Article

Impact of Log-Normal Particle Size Distribution in Holby–Morgan Degradation Model on Aging of Pt/C Catalystin PEMFC

by
Victor A. Kovtunenko
1,2
1
Department of Mathematics and Scientific Computing, Karl-Franzens University of Graz, NAWI Graz, Heinrichstr. 36, 8010 Graz, Austria
2
Lavrentyev Institute of Hydrodynamics, Siberian Division of the Russian Academy of Sciences, 630090 Novosibirsk, Russia
Technologies 2025, 13(7), 262; https://doi.org/10.3390/technologies13070262
Submission received: 20 May 2025 / Revised: 9 June 2025 / Accepted: 18 June 2025 / Published: 20 June 2025
(This article belongs to the Section Environmental Technology)

Abstract

:
The Holby–Morgan model of electrochemical degradation in platinum on a carbon catalyst is studied with respect to the impact of particle size distribution on aging in polymer electrolyte membrane fuel cells. The European Union harmonized protocol for testing by non-symmetric square-wave voltage is applied for accelerated stress cycling. The log-normal distribution is estimated using finite size groups which are defined by two parameters of the median and standard deviation. In the non-diffusive model, the first integral of the system is obtained which reduces the number of differential equations. Without ion diffusion, it allows to simulate platinum particles shrank through platinum dissolution and growth by platinum ion deposition. Numerical tests of catalyst degradation in the diffusion model demonstrate the following changes in platinum particle size distribution: broadening for small and shrinking for large medians with tailing towards large particles; the possibility of probability decrease as well as increase for each size group; and overall, a drop in the platinum particle size takes place, which is faster for the small median owing to the Gibbs–Thompson effect.

1. Introduction

The polymer electrolyte membrane fuel cells (PEMFCs) operating at low-temperature are now mostly often used in all kinds of road, railroad, and maritime vehicles. Fuel cells produce electricity by combining hydrogen and oxygen into water through reduction–oxidation electrochemical reactions between anode and cathode catalyst layers separated by a proton exchange membrane (PEM). The interesting readers can find a compendium of hydrogen energy by Ball et al. [1], Barbir et al. [2], Basile et al. [3], Subramani et al. [4]. For the theoretical modeling of fuel cells, see Eikerling and Kulikovsky [5], Kulikovsky [6], Hacker and Mitsushima [7]. One of the main obstacles for wider manufacturing production and clean technology that avoids environmental damage is the limited durability of hydrogen fuel cells. In the Membrane Electrode Assembly (MEA), which is a main stack component used in fuel cells, platinum catalyst degradation is especially responsible for performance and durability; see a recent review of mechanisms and modeling effects on the degradation processes in Foniok et al. [8].
The catalyst layer (CL) is typically composed of Pt nanoparticles deposited on a highly porous carbon-based support maximizing surface area. Catalysts with different particle sizes have varied durability. The loss in electrochemical surface area (ECSA) is combined from competitive degradation mechanisms; see the sketch in Figure 1. On one side, the dissolution of platinum particles detached from the carbon support leads to the Pt mass loss. On the other side, the Ostwald ripening mechanism compensates for the redistribution of mass from small Pt particles to larger particles. Zhu et al. [9] studied 1D model focusing on Pt precipitation versus Ostwald ripening and the formation of Pt band validated against experimental data. They reported the higher contribution of Ostwald ripening to Pt degradation by the triangle wave (TW) compared to square wave (SW) voltage cycle profile. This may indicate that Ostwald ripening more likely occurs during a rapid voltage change rather than the dwell time. Jahnke et al. [10] developed a multiscale catalyst degradation model to simulate the spatially resolved catalyst degradation under various operating conditions in low-temperature fuel cells, including platinum transport, dissolution, oxidation, Pt nanoparticles reduction, growth, and band formation.
The Ostwald ripening mechanism can be represented with the help of varied particle size groups that are close to a continuous particle size distribution (PSD). Ding et al. [11] established a population balance equation relating the PSD evolution with the loss in ECSA. In the study by Li et al. [12], the comparison of the predicted kinetic equations and measured PSD was presented in the range 2–12 nm. The simulation calculated larger Pt particles near the interface with gas diffusion layer (GDL) due to less impact from platinum ion diffusion into the membrane. A cathode CL generated samples from the log-normal distribution of the particle radius in the range of 0–10 nm in order to account for platinum dissolution and redeposition by the Ostwald ripening phenomenon. The model calibration was presented for accelerated stress test (AST) data with different temperatures, and upper (UPL) and lower (LPL) potential levels of SW voltage cycling. The degradation caused by voltage profiles in a range less than 0.9 V is typical for the automotive PEM fuel cells and was studied under representative operating conditions in Colombo et al. [13]. Shojayian and Kjeang [14] developed a 1D model, simulating fuel cell stack durability for realistic transportation applications like heavy-duty electric transit buses. Full 3D multiscale simulation of PEM fuel cell model was performed in Choi et al. [15], which demonstrated the significant effect of a nonuniform Pt particle size distribution.
Not only the ECSA value but also the properties of the perfluorosulfonic acid (PFSA) ionomer are accounted for in cell performance. Carbon black (CB) is widely used as a catalyst support and has a high pore volume in order to increase the surface area. Kobayashi et al. [16] found that increasing the distance between Pt particles on the catalyst suppresses Ostwald ripening and coarsening of Pt particles. Preventing the ionomer from blocking the nanopores of the catalyst and increasing the inter-particle distance is important in order to improve both cell performance and durability. The impact of dry–wet cycles on PEMFC durability in experiment was reported by Wang et al. [17]. A review of the chemical design of complex materials applied for solid oxide fuel and electrolysis cells with both oxygen-ionic and proton-conducting electrolytes can be found in Tarasova et al. [18]. Zheng et al. [19] investigated a 1D model of Pt precipitation and agglomeration processes between particles of different sizes. The experimental and numerical results were supported by possible mitigation strategy for ECSA loss by graded structure of proton exchange membrane. The composite PEM structure between anode and cathode CL included subsequently lower gas diffusivity in the anodic backing layer, a content supportive layer reinforced with e-PTFE, and greater gas diffusivity in the cathodic backing layer.
Kravos et al. [20] presented computationally fast and thermodynamically consistent quasi-1D electrochemical models for PEMFC performance modeling and control. Aiming to minimize degradation and to extend the fuel cell lifetime, model-based control strategies were proposed in Bartlechner et al. [21]. The dynamic mechanistic model of an electrochemical interface in the electrolyte describing the ionic transport by migration–diffusion was suggested by Franco et al. [22] based on the coupling of Nernst–Planck and Poisson equations. We cite Fuhrmann et al. [23] for coupled modeling and analysis of numerical methods suitable for computer simulation of electrolyte flows. We refer to Efendiev [24] for the theory of nonlinear diffusion, to Fellner and Kovtunenko [25], González-Granada and Kovtunenko [26], Kovtunenko and Zubkova [27] for modeling with Poisson–Boltzmann and Poisson–Nernst–Planck equations, to Alekseev and Spivak [28] for further coupling with temperature-dependent phenomena, and to Hintermüller et al. [29], Itou et al. [30], Khludnev and Kovtunenko [31] for mechanical degradation. The morphology of crack formation on the CL surface in PEMFC and its performance was considered in Du et al. [32]. We cite Chan et al. [33] for the revealing related electrochemical impact of PSD on the aging of lithium-ion batteries.
We develop a Holby–Morgan electrochemical model of platinum degradation. In Kovtunenko and Karpenko-Jereb [34], we studied industrial protocols used for cyclic voltammetry (CV) by U.S. Department of Energy, Tennessee Tech University, and Nissan for electric potential of both square wave (SW) as well as triangle wave (TW) forms. The ECSA loss was less significant for TW when compared with SW profiles. In contrast, either high UPL or steep electric potential increase the degradation. In the following, we apply the European Union recommended Fuel Cell and Hydrogen Joint Undertaking (FCH JU) non-symmetric square waveform from Pivac and Barbir [35] for the modeling of the impact of cycling operating conditions on the durability of fuel cells. The asymmetric protocol is implemented for a 40 s long potential cycling profile between voltages of 0.6 V for 10 s, and 0.9 V for 30 s. Based on local sensitivity analysis in Kovtunenko and Karpenko-Jereb [36], the lifetime prognosis of the catalyst increases, either by increasing the Pt particle diameter, pH, Pt particle loading, or decreasing the diffusion, temperature, Pt/C volume fraction. In Karpenko-Jereb and Kovtunenko [37], Kovtunenko [38], we presented variance of cycling operating conditions for the Holby–Morgan model, and concluded with feasible domain of model parameters in Kovtunenko [39,40]. Some calculations based on the mathematical model were compared to the commercial catalyst in Koltsova et al. [41].
In the present paper, the impact of particle diameter distribution in platinum catalyst on the electrochemical degradation phenomena in PEMFC is analyzed with respect to changes in size, amplitude, and breadth of the initial distribution after accelerated aging test which is accompanied by loss in Pt mass and ECSA. The continuous PSD is represented by a finite number of particle size groups. Whereas normal distribution was considered previously in Kovtunenko [42], here we focus on the log-normal distribution of Pt particles; see Shojayian and Kjeang [14], Holby and Morgan [43], which is useful for practical measurements. The log-normal distribution is in good agreement with the experimental data obtained for various catalyst layers, where two statistic parameters of the expectation and the standard deviation are fitted from available experimental data; see Touil et al. [44]. The size distribution comprises a finite number of particle groups, which are characterized by the particle radius and the number of particles contained within.

2. Model

Darling and Meyers [45] first developed kinetic rate equations for platinum electrochemical dissolution, oxide film formation, and oxide chemical dissolution. Further, Holby and Morgan [43] avoided the reaction of chemical dissolution since it is negligible compared to main electrochemical mechanisms of precipitation. Holby et al. [46] refined the kinetic model for coupling the ECSA loss and the catalyst PSD for hundreds particles. For validation of the model the initial PSD of 200 particles of diameter in the range 0.05–8 nm measured by transmission electron microscopy (TEM) were input to the model. Both experimental and theoretical techniques demonstrated a big change of ECSA through both mass loss and coarsening for the mean particle sizes 2–3 nm, a little change at 4–5 nm, and almost no change for the larger particle sizes.
We start with the mathematical formulation of the Holby–Morgan model. Let a catalyst layer be determined by the space variable x [ 0 , L ] along the layer thickness L = 10 (μm). We prescribe voltage V that varies in time t > 0 in accordance with the FCH JU protocol of accelerated aging by the periodic function
V ( t ) = 0.6 V for t ( ( k 1 ) τ , ( k 1 ) τ + 10 ) 0.9 V for t ( ( k 1 ) τ + 10 , k τ ) , k = 1 , 2 , , # k ,
where the period τ = 40 (s) and # k stands for the number of cycles before end of life (EoL) at t EoL : = # k τ (s). We look for the unknown Pt ion concentration c ( t , x ) (mol/cm3), distribution of Pt particle diameters d i ( t , x ) (nm), and ratios of Pt oxide coverage θ i ( t , x ) (dimensionless) of given number P > 0 :
c > 0 , d 1 , , d P > 0 , θ 1 , , θ P ( 0 , 1 ) .
As x ( 0 , L ) and t ( 0 , t EoL ) , the variables in (2) justify the coupled system of nonlinear reaction–diffusion ( 2 P + 1 ) -equations with weights ϕ 1 + + ϕ P = 1 :
ε c t ε 3 / 2 D Pt 2 c x 2 = π N Pt 2 V Pt i = 1 P ϕ i d i 2 r dissol ( c , d i , θ i ) ,
d i t = Ω r dissol ( c , d i , θ i ) , i = 1 , , P ,
t ln ( θ i d i 2 ) = 1 Γ θ i r oxide ( θ i ) , i = 1 , , P .
The reaction rates r dissol for the Pt ion dissolution and r oxide for Pt oxide coverage, given in mol/(cm2 s), are established following the Butler–Volmer equations. For the Pt ion dissolution, the reaction rate is given by
r dissol ( c , d i , θ i ) = Γ ( 1 θ i ) ( ν 1 exp [ H 1 , fit + ( 1 β 1 ) H 1 ( d i , θ i ) R T ] ν 2 c c ref exp [ H 1 , fit + β 1 H 1 ( d i , θ i ) R T ] ) ,
with the gas constant R and the Faraday constant F. The molar enthalpy difference for dissolution (J/mol) yields
H 1 ( d i , θ i ) = n F ( U eq V ) 4 Ω d i ( γ 0 ( θ i ) Γ n 2 F θ i V ) ,
and the surface tension difference (J/cm2) is determined by
γ 0 ( θ i ) = γ + Γ R T θ i ( ln [ ν 2 ν 1 10 2 p H ] + 2 n 2 F U fit + ω θ i 2 R T + ln ( θ i 2 ) + 2 θ i θ i ln ( 1 θ i 2 ) ) .
For Pt oxide coverage, the reaction rate is described by
r oxide ( θ i ) = Γ ( ν 1 ( 1 θ i 2 ) exp [ H 2 , fit + λ θ i + ( 1 β 2 ) H 2 ( θ i ) R T ] ν 2 10 2 p H exp [ H 2 , fit λ θ i + β 2 H 2 ( θ i ) R T ] ) ,
and the molar enthalpy difference for oxidation (J/mol)
H 2 ( θ i ) = n 2 F ( U fit V ) + ω θ i .
The governing Equations (3)–(10) are supported by the initial conditions
c ( 0 , x ) = 0 , d i ( 0 , x ) = d i 0 , θ i ( 0 , x ) = 0 for x [ 0 , L ] ,
with prescribed initial PSD d 1 0 , , d P 0 > 0 , and mixed boundary conditions
c x ( t , 0 ) = 0 , c ( t , L ) = 0 for t ( 0 , t EoL ) .
The boundary conditions (12) at the CL left-end x = 0 (where the catalyst layer matches GDL) imply no-flux, and at the CL right-end x = L (matching PEM) describe a perfectly absorbing boundary.

3. Materials

In Table 1 we gather together the parameters employed in the model (3)–(10), namely, the material and fitting parameters for platinum oxide formation, as well as for platinum ion formation and diffusion. These values are taken from the literature Li et al. [12], Holby and Morgan [43], Darling and Meyers [45], Holby et al. [46].
We set the Pt/C volume fraction ε = 0.02 and the potential of hydrogen p H = 0 . The shape of platinum particles is a hemisphere, such that its volume V Pt = π d Pt 3 / 6 , and number N Pt = p Pt / ( L ρ Pt ) . The reference values for cathode catalyst are taken for Pt particles density ρ Pt = 21.45 (g/cm3) and Pt particles loading p Pt = 4 × 10 4 (g/cm2); however, the reference value for Pt particle diameter d Pt (cm) is determined by median d ˜ of the size distribution and is varied.

4. Methods

To determine the PSD weights ϕ i in (3), we consider a log-normal distributed diameter d > 0 of platinum particles. For two given parameters of the standard deviation σ > 0 and the expectation d ˜ > 0 , the probability density function reads
ϕ ( d ) = 1 σ d 2 π e ( ln ( d / d ˜ ) ) 2 / ( 2 σ 2 ) ,
for which the mean, median, and mode are, respectively,
Mean = d ˜ e σ 2 / 2 , Med = d ˜ , Mode = d ˜ e σ 2 .
Here the median of the size distribution can be varied independently, whereas the mean and the mode depend on the both parameters d ˜ and σ .
The distribution ϕ in (13) versus Pt particle diameter d ( 0 , 8 ) (nm) is depicted for d ˜ = 3 (nm) and σ = 0.25 in the left plot (a) of Figure 2. Corresponding to (13), the cumulative distribution function reads
Φ ( d ) = 1 2 π ln ( d / d ˜ ) / σ e s 2 / 2 d s .
Let equidistant points d i = d i 1 + 2 σ split into sub-intervals of finite number P > 0 , the interval of possible particle diameters, such that
d 1 = d ˜ + σ ( 5 P ) , , d P = d 1 + 2 σ ( P 1 ) = d ˜ + σ ( 3 + P ) .
Using (14) and (15), the log-normal distribution can be approximated by piecewise-constant probabilities of particle size groups ϕ 1 , , ϕ P
ϕ 1 = Φ ( d 1 ) for d < d 1 , ϕ P = 1 Φ ( d P 1 ) for d P 1 d , ϕ i = Φ ( d i ) Φ ( d i 1 ) for d i 1 d < d i , i = 2 , , P 1 ,
such that i = 1 P ϕ i = 1 . The selection of size groups is determined by the width of distribution and influenced by the material properties of nano-structures. It is sensitive to principles of measurement. Taylor et al. [47] performed particle size analysis of supported platinum catalysts using transmission electron microscopy (TEM) versus X-ray diffraction (XRD) techniques. Whereas the TEM localizes individual particles in the image are taken through a microscope, the XRD analysis provides the average particle size from the average volume across a sample. The experimental information is aimed to predict an effective surface area available for catalytic activity.
As d ˜ = 3 and σ = 0.25 , twelve particle size groups from (16) are represented with bars in the right plot (b) of Figure 2. The corresponding values are gathered in Table 2. Each ϕ i describes the probability of respective diameters [ 0 , d 1 + σ ) , [ d i σ , d i + σ ) for i = 2 , , 11 , and [ d 12 σ , ) with the sum equal to one. In the simulation, we vary d ˜ and σ , keeping the same weight distribution ϕ 1 , , ϕ 12 from Table 2.
For the numerical solution of the system (1)–(12), in earlier works we developed the implicit–explicit scheme IMEX2, which is incorporated within the Runge–Kutta–Fehlberg method RKF45 of variable time-step. The details of solution algorithm can be found in Karpenko-Jereb and Kovtunenko [37] and references therein. In the simulation, we set the mesh of uniform size Δ x = 1 (μm) and time step Δ t = 10 2 (s). Time stepping is locally refined to 10 4 (s) within ( Δ t , Δ t ) -neighborhoods around lift-off points t = ( k 1 ) τ + 10 , k = 1 , 2 , , # k , of the square potential in (1). To solve the algebraic equations, within each voltage cycle, we have 4037 time steps and 44,407 ( 2 P + 1 ) degrees of freedom, which is more than 10 6 as P = 12 .

5. Results

Emerged by the synthesis of supported Pt nanoparticles onto liquid substrates, Lönn et al. [48] observed a bimodal size distribution. The measurements by Adibi et al. [49] revealed bimodal size distributions of Pt nanoparticles dispersed on alumina and silica supports. The mechanism of Pt ion re-precipitation was included by Bi and Fuller [50] using a simplified bimodal distribution. In the accelerated stress test (AST) representative initial radii were assumed 1.75 nm for large, and 1.5 nm for small particles. Without ion diffusion in the simulated catalyst degradation, large particles grew with a net gain by Pt ion deposition, and small particles shrank through Pt dissolution during potential cycling. The presence of electrochemical Ostwald ripening was treated in Schröder et al. [51] as a degradation mechanism in bimodal catalyst consisting of two distinguishable size populations. The larger population demonstrated a stronger increase in particle size, whereas redeposition was absent within the small population, which indicates that not all degradation necessarily leads to growth in each size population. Gilbert et al. [52] discovered that ECSA loss of Pt nanoparticles resulting from potential cycling was controlled by reducing the number of particles smaller than a critical particle diameter (CPD). The CPD was found to be in the range 3.5–4 nm, depending on both the cycling protocol by square wave (SW) versus triangle wave (TW) and on the catalyst environment in the fuel cell.
To simulate Pt degradation, we start with non-diffusive model independent of the CL thickness x. If there is no ion diffusion, then the complex dynamics of Pt particle nucleation and growth simplifies to solely deposition. The solution of (1)–(11) without ion diffusion can be obtained by setting the diffusion coefficient D Pt = 0 in (3) such that
ε d c d t = π N Pt 2 V Pt i = 1 P ϕ i d i 2 r dissol ( c , d i , θ i ) .
Multiplying (17) with Ω , and (4) with π N Pt / ( 2 V Pt ) ϕ i d i 2 , the right-hand side is canceled after summation over i = 1 , , P . As the result, we get homogeneous ordinary differential equation (ODE)
d d t Ω ε c + π N Pt 6 V Pt i = 1 P ϕ i d i 3 = 0 for t ( 0 , t EoL ) .
Solving (18) using initial conditions (11) leads to the first integral of the system
Ω ε c ( t ) = π N Pt 6 V Pt i = 1 P ϕ i ( d i 0 ) 3 d i ( t ) 3 .
Inserting (19) into (4), the system can be reduced to ODE equations for
d 1 , , d P > 0 , θ 1 , , θ P ( 0 , 1 ) .
Let P = 12 from Table 2 with the log-normal probabilities ϕ 1 , , ϕ 12 and the initial distribution d 1 0 , , d 12 0 in (11) for d ˜ = 3 and σ = 0.25 . The numerical solution is presented in Figure 3. In the left plot (a), there is depicted the time evolution of the Pt particle diameter ratio starting from 1:
d 1 ( t ) d 1 0 , , d P ( t ) d P 0
versus #k = 1000 cycles in (1), corresponding to time t EoL = 11 . 1 ¯ (h). This figure justifies the reduction in platinum dissolution of the small particles, less than 5 (nm), and growth in the particles larger than 5.5 (nm) by platinum ion deposition. In the center bar-plot (b), we observe that the initial particle size distribution is not changing without ion diffusion during potential cycling. In the right plot (c), we depict with respect to the reference active area the ECSA ratio
E ( t ) = i = 1 P ϕ i d i ( t ) d i 0 2 , E ( 0 ) = 1 ,
and relative Pt mass ratio
m Pt ( t ) = i = 1 P ϕ i d i ( t ) d i 0 3 , m Pt ( 0 ) = 1 ,
which both decrease by the aging test.
Applying the accelerated stress test (AST) causes shifts in the ECSA depending on the particle size. The study Sandbeck et al. [53] demonstrated that particle growth was largely attributed to Ostwald ripening. As the particle size increases, the ECSA decreases, thus decreasing the amount of Pt dissolution. The degradation mechanisms are nonuniform and depend on the platinum distribution along the fuel cell thickness direction. Experimental results reveal that the Pt mass loss occurs primarily near the PEM rather than at the GDL-CL interface, whereas the particle growth due to Ostwald ripening mechanism is almost uniformly distributed across the catalyst.
The main result we obtain for the diffusion model: a numerical solution of the Holby–Morgan model (1)–(12) with diffusion for d ˜ = 2.15 (nm) and σ = 0.0025 during #k = 10 voltage cycles for t EoL = 6 . 6 ¯ (min) is presented in Figure 4. In the left plot (a), the Pt ion concentration c ( t , x ) (mol/cm3) is depicted versus time across the catalyst thickness x ( 0 , 10 ) (μm). In the center bar-plot (b), we observe that no changes of the initial particle size distribution happen at the GDL-CL inteface x = 0 . At the same time, PSD changes at the CL-PEM inteface x = 10 can be seen at the 10-th cycle in the right bar-plot (c) of Figure 4.
In the following we will consider Pt particle diameters which are averaged over the catalyst layer depending on time only:
mean x [ 0 , L ] d 1 ( t , x ) , , mean x [ 0 , L ] d P ( t , x ) .
We compare the mean PSD composed from mean diameters (22) when computed at #k = 100 cycles (left plot), #k = 200 cycles (center plot), and #k = 300 cycles (right plot) for 3 . 3 ¯ (h) with the initial mean PSD at #k = 0. By this, we vary the distribution median d ˜ { 2 , 3 , 5 , 6 } (nm) for fixed σ = 0.0025 (nm).
In the three plots of Figure 5, the mean PSD is depicted for d ˜ = 2 (nm). In the figure, we observe the following changes. First is the shift of the initial distribution to the left, which is 0.155 (nm) for #k = 300 cycles and implies a reduction in all particle diameters. Second is the broadening from the initial range 0.06 (nm) to 0.085 (nm) of the size groups for #k = 300 cycles. Third is that, during the period of #k = 100 cycles, there are two size groups with probabilities ϕ 5 and ϕ 6 unified to one size group, which has the higher probability 0.45 and then splits again.
In the same window of length 0.155 (nm), the change of Pt particle diameters for d ˜ = 3 (nm) is depicted in plots (a)–(c) of Figure 6. From this figure, for larger median d ˜ we conclude that there is a slowing of the PSD shift for 0.02 (nm) for #k = 300 cycles, and no broadening of the initial distribution range. Two size groups of probabilities ϕ 3 and ϕ 4 are unified for #k = 200 cycles to one size group of the probability 0.3484, and for #k = 300 cycles, two size groups of probabilities ϕ 5 and ϕ 6 are unified to one size group of the probability 0.45.
For the large medians d ˜ = 5 and 6 (nm) tested, we report no shift of the mean PSD to the left; rather, there is a shrinking of the initial distribution 0.06 (nm) to 0.055 (nm) when two size groups of probabilities ϕ 1 and ϕ 2 are unified to one size group of the probability 0.0155. The above changes of Pt diameter distribution imply tailing towards large particles.

6. Discussion

There are known several electrochemically driven degradation mechanisms affecting CL during PEMFC operation which leads to a decrease in the useful electrochemical surface area. Growth in the Pt particle size has essential consequences in the loss of ECSA. The local redeposition of platinum from smaller to larger particles, called Ostwald ripening (see Ostwald [54]), is one of the degradation mechanisms that worsens the performance of fuel cells and shortens its lifetime. Ascarelli et al. [55] proposed that under pure Ostwald ripening, the particle size distribution (PSD) of Pt should be broader and with a shift to larger sizes of the peak. On the other hand, PSD with tails to larger sizes are correlated with migration and coalescence; see Granqvist and Buhrman [56]. The theoretical analysis of particle size redistribution in fuel cells in comparison with the classical diffusion driven Ostwald ripening was performed by Kregar and Katrašnik [57]. In particular, rapid particle growth was observed in case of high electric potentials. The model results of Kregar et al. [58] indicate linear-in-time catalyst particle growth in the case of particle agglomeration and root-function dependence for the Ostwald ripening. In the case of particle agglomeration, a small number of large particles builds PSD with tail towards large particles. In the case of Ostwald ripening, the fast dissolution of small particles and slow redeposition on large particles leads to a PSD tailed towards small particles. Baroody et al. [59] introduced a continuity equation describing the evolution of PSD with contributions from the mechanisms of Pt dissolution/redeposition, coagulation, and detachment.
Larger nanoparticles have a larger surface area and, therefore, by the Gibbs–Thompson effect they are more stable against agglomeration when compared with smaller particles. Nores-Pondal et al. [60] correlated the size of the Pt particles determined by TEM with the electrocatalytic activity. In Gummalla et al. [61], the TEM-based analysis of catalyst PSD in the range 2–25 nm was presented for platinum alloys. For the Pt-based MEA, 5 nm Pt was the best performer and the most durable, whereas 8.1 nm was the best performer for the Pt3Co-based MEA. TEM analysis on Pt catalysts was performed in Yu et al. [62] for 200 particles in PEMFC. For MEA with initial sizes of 2.2 and 3.5 nm, significant growth of the mean particle size and broadening PSD were reported, whereas only a slight increase was observed for the initial sizes 5.0, 6.7, and 11.3 nm. Overall, Pt dissolution was the controlling degradation mechanism which assisted the electro-chemical Ostwald ripening and coalescence affected by particle size due to the 3D nature of the carbon support. Xu et al. [63] found that the particle size increase from sub 3 nm to 6.5 nm improved the surface specific activity and the electrochemical stability of platinum on carbon, which is balanced by ECSA loss. In Yu et al. [64], automated scanning TEM were employed across fuel cell electrodes that enabled to obtain the physical properties and distribution of hundreds thousands of nanoparticles at a high resolution. The paper by Zhan et al. [65] reviewed the research progress on Pt/C catalysts and Pt-based alloy catalysts achieved in recent years.

7. Conclusions

We summarize our findings obtained in the paper. For the cycling voltammetry test computed in the Holby–Morgan electrochemical degradation model of the aging of the Pt/C catalyst in PEMFC under log-normal particle size distribution, we conclude the following:
  • Without diffusion, platinum nanoparticles decrease for small sizes, and increase when the particles are larger than 5 nm in diameter.
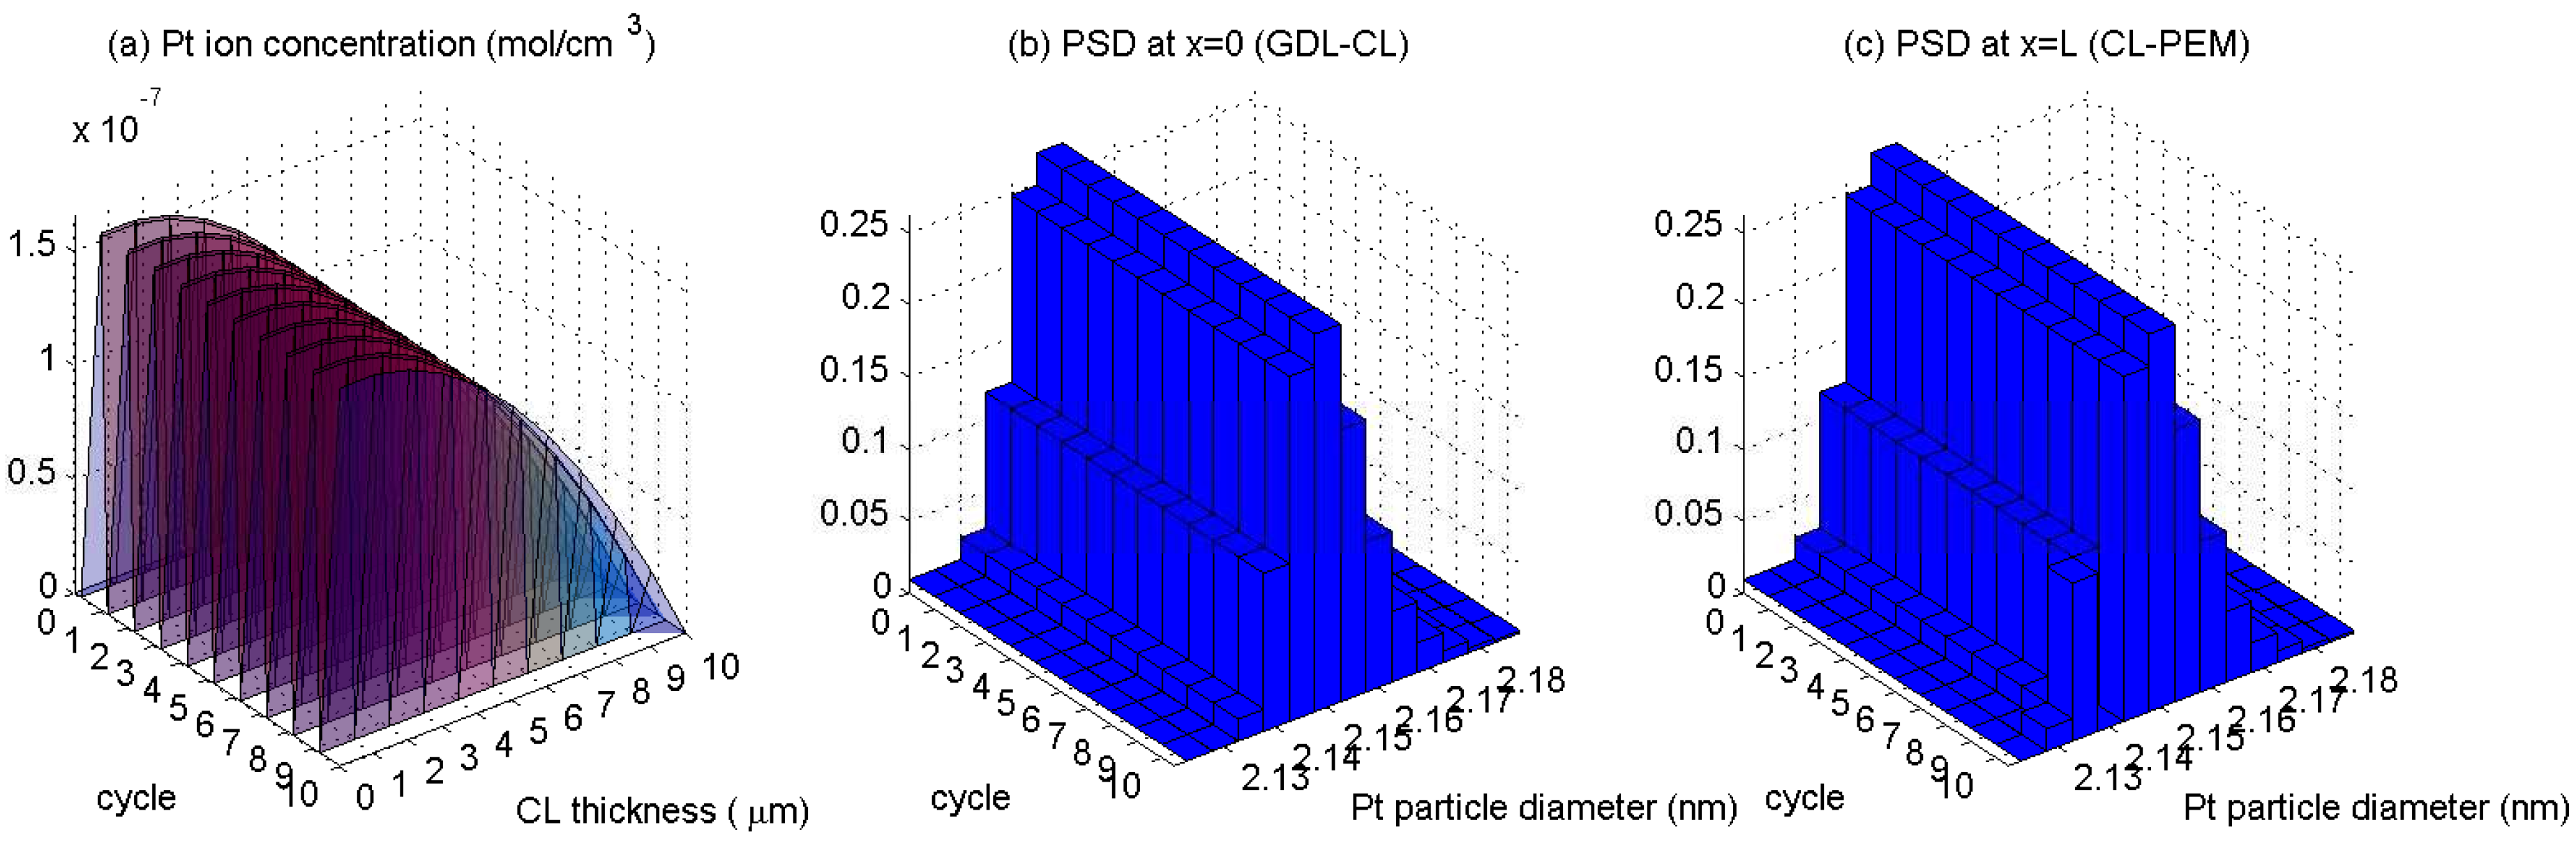
  • The Pt ion diffusion is nonuniform, it is less into the membrane, and becomes larger when interface with the gas diffusion layer is approaching.
  • In overall, Pt particle sizes reduce under the accelerated stress test which results in the loss of both the electrochemical active area and relative mass: smaller diameter, larger loss.
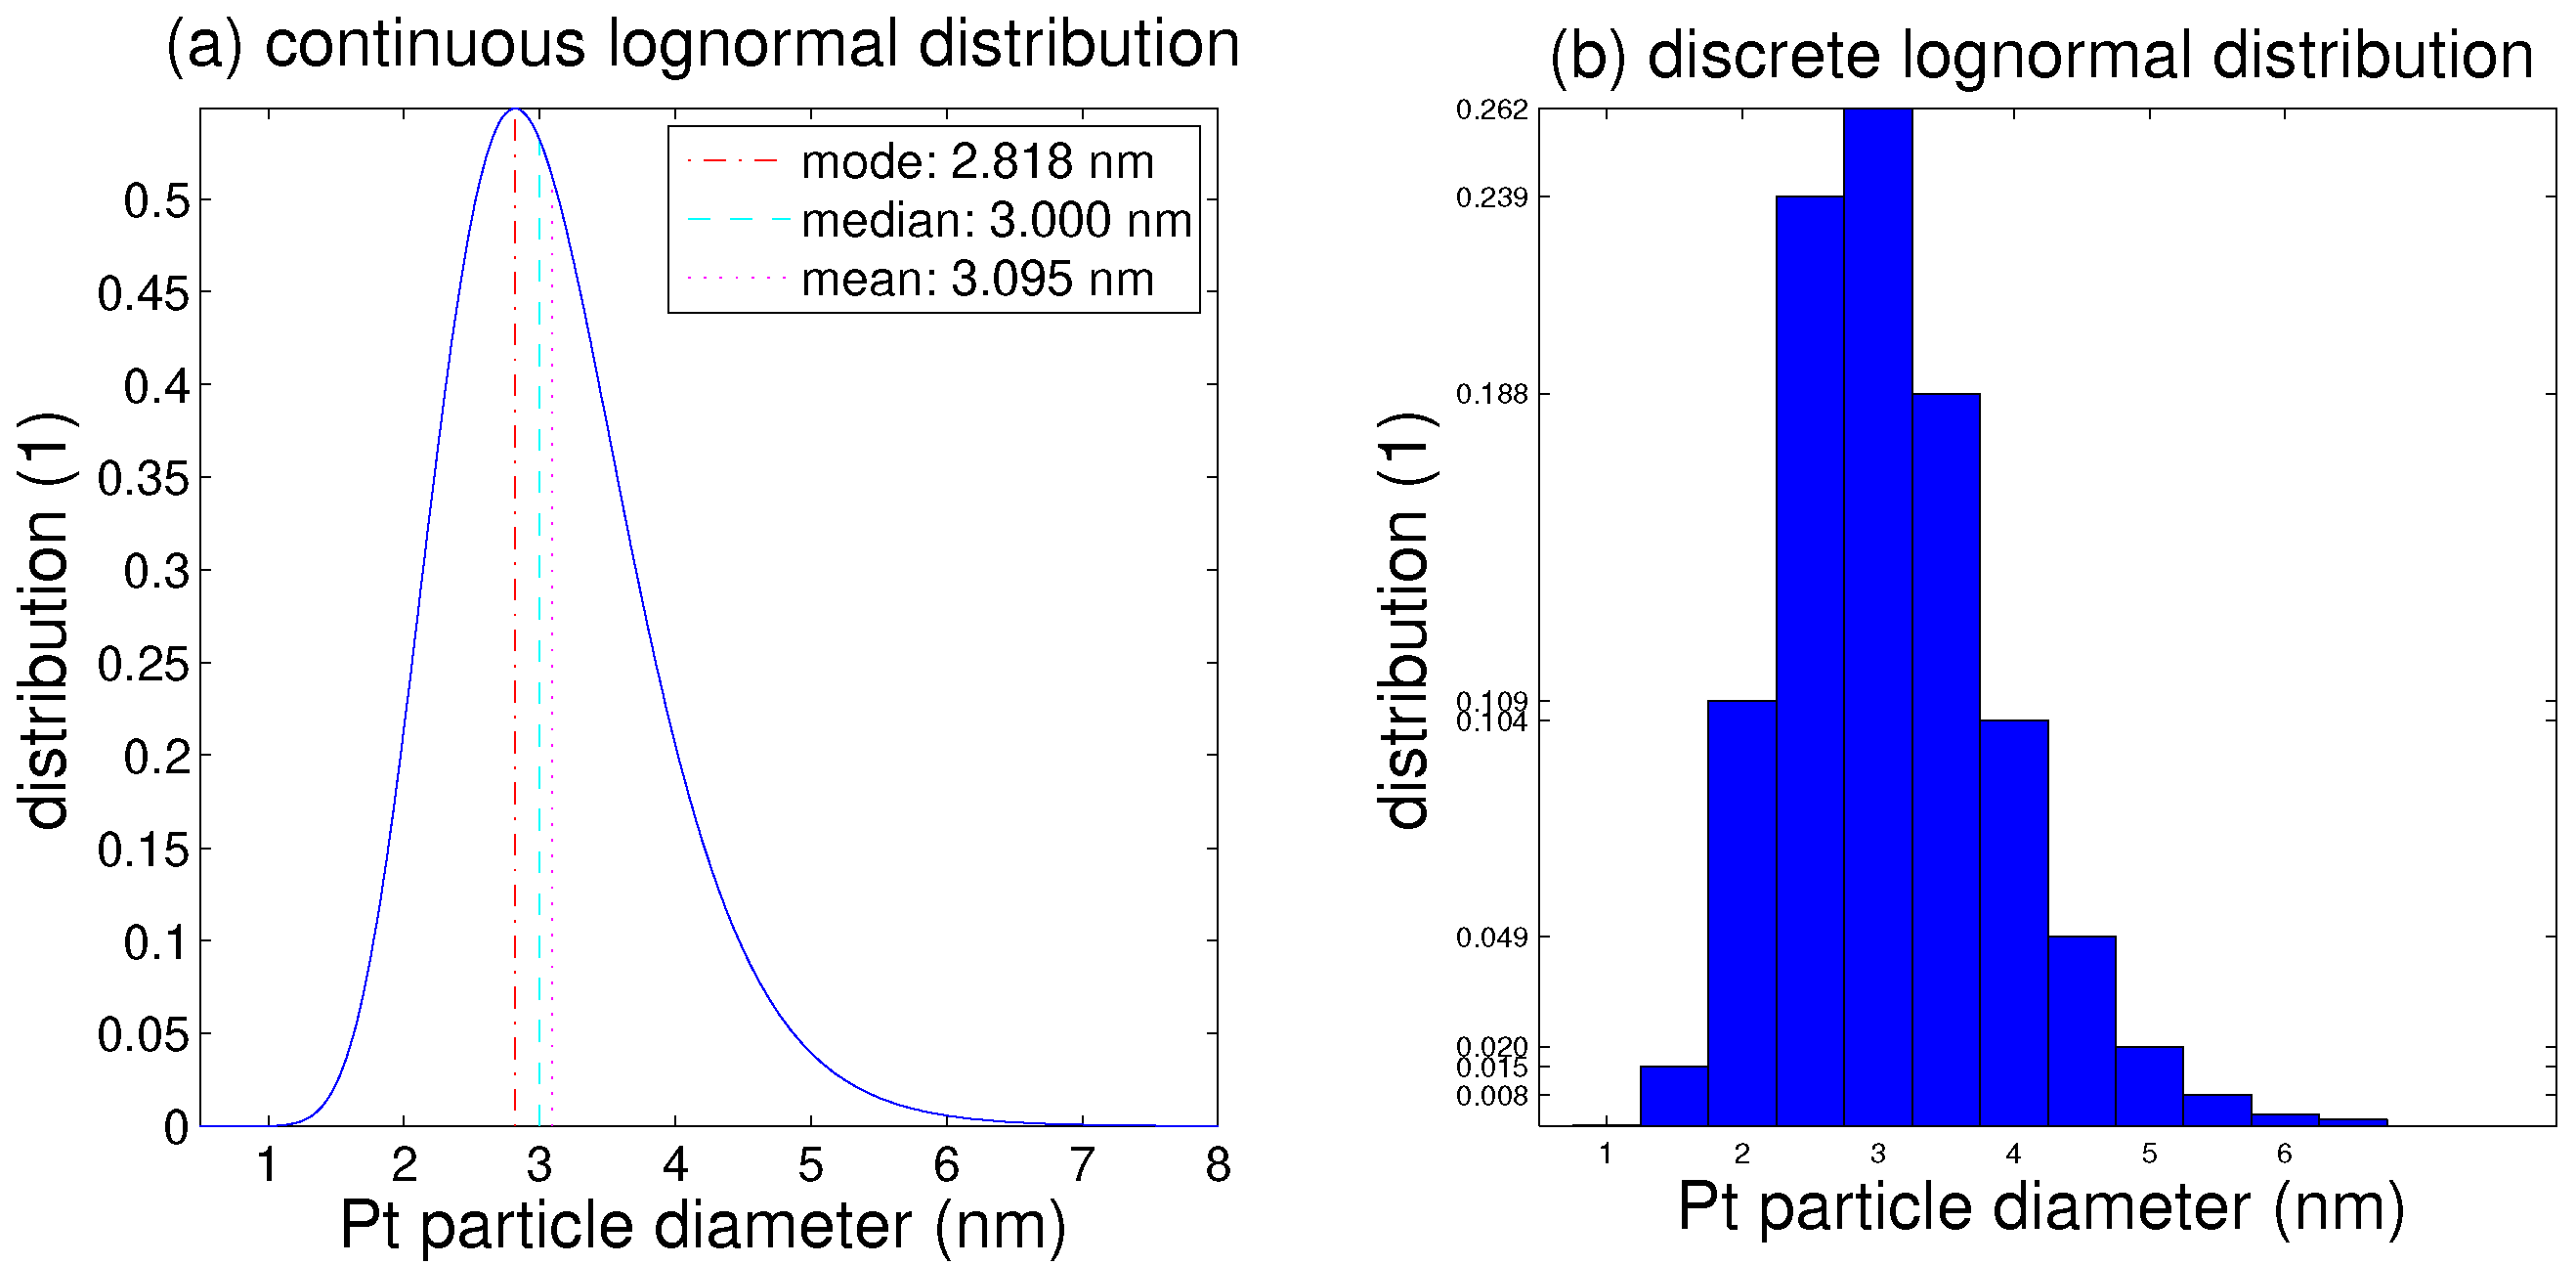
  • The probability distribution of sizes is determined by the median and standard deviation, and it can be approximated within groups of finite breadth.
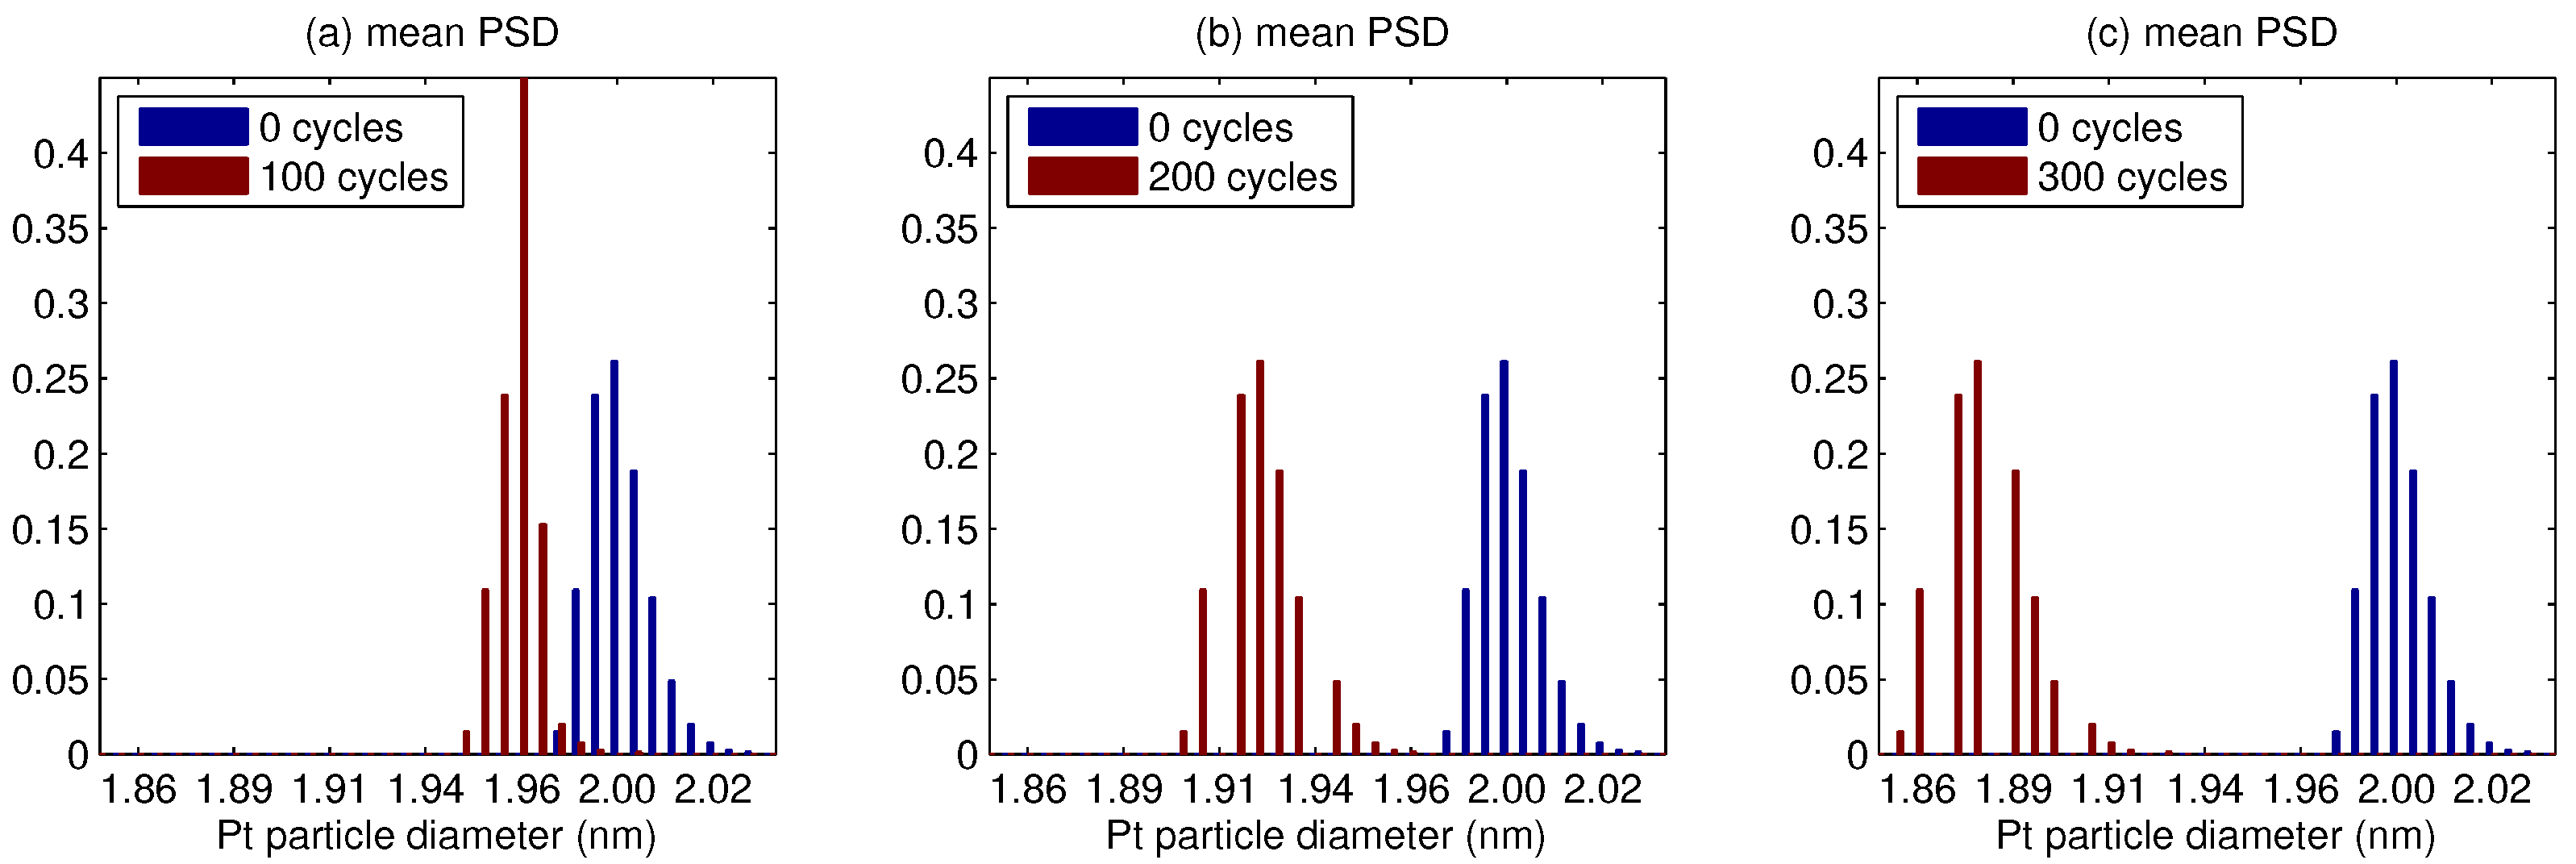
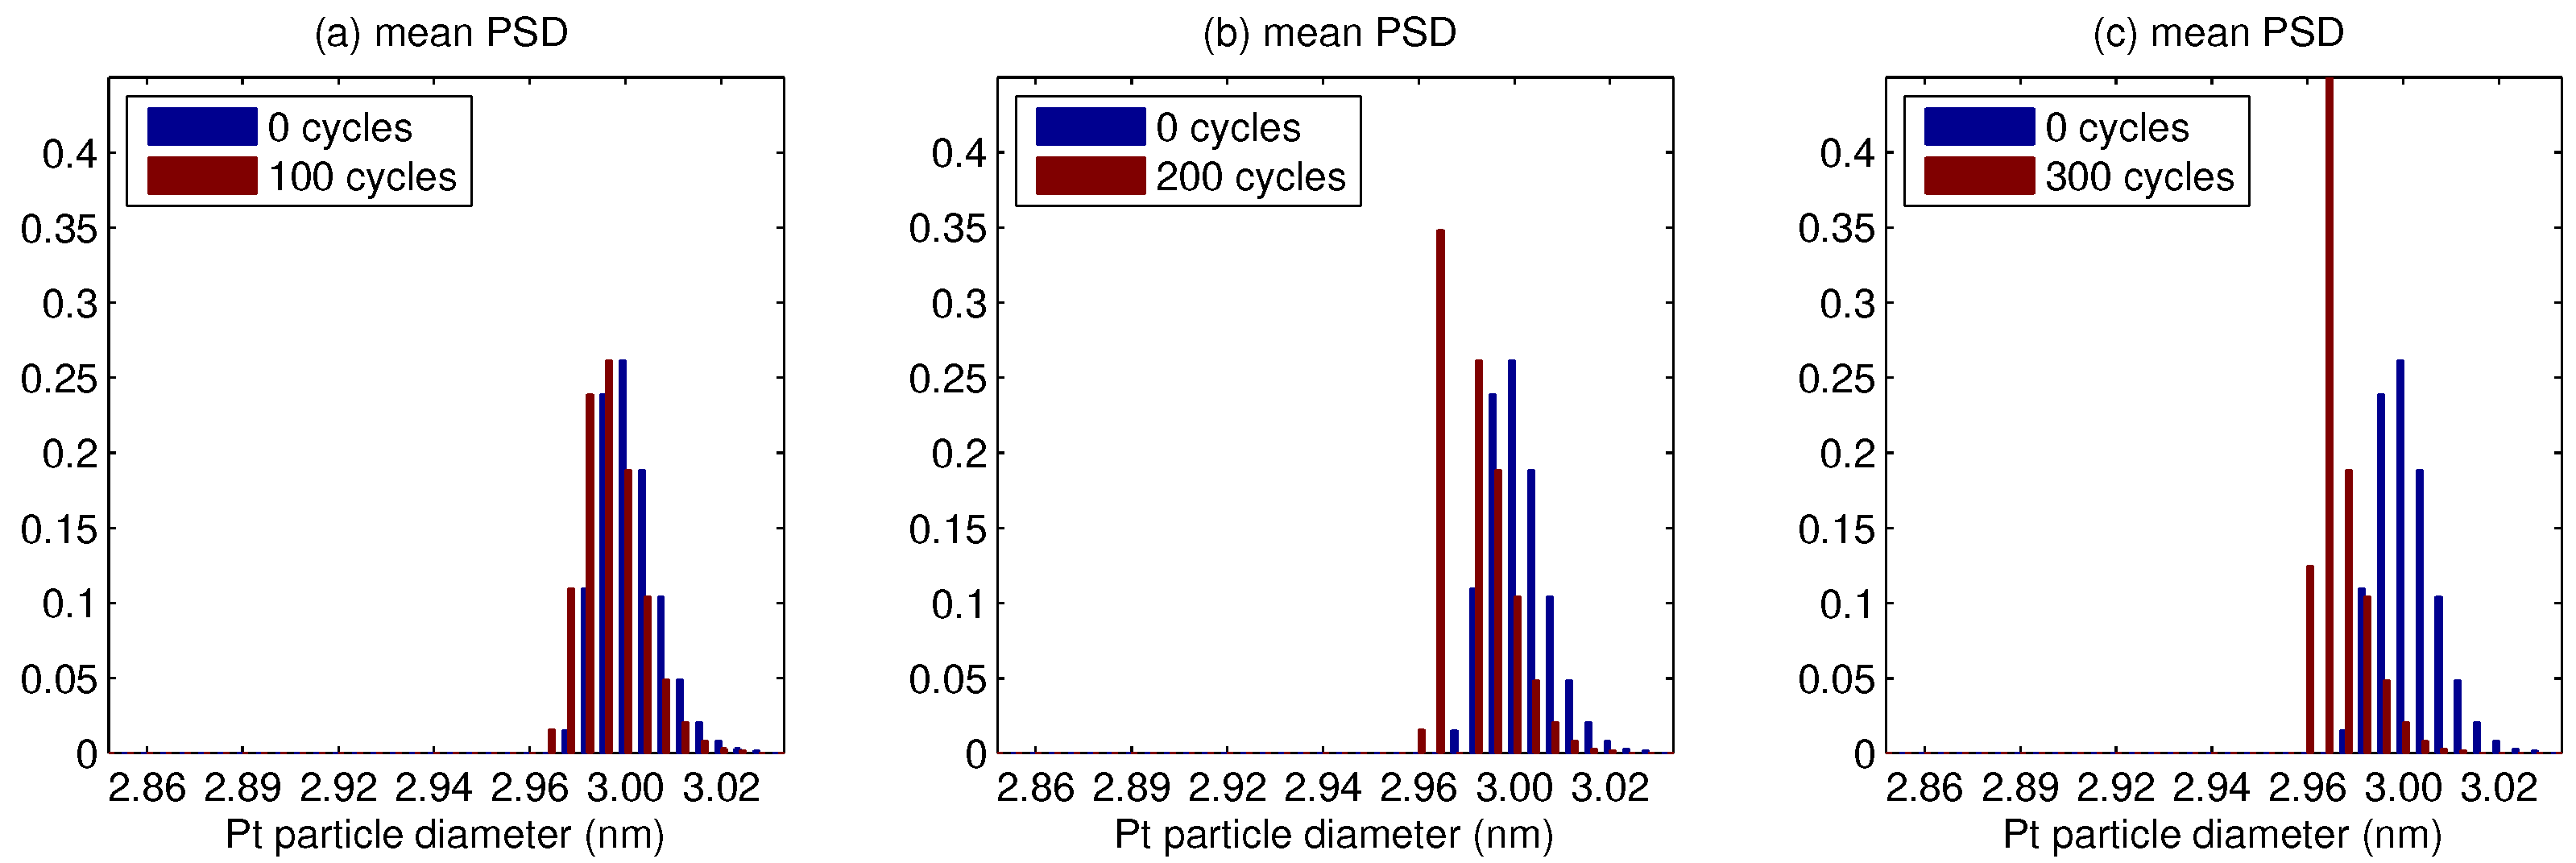
  • The platinum particle size distribution (PSD) broadens for a median smaller than 5 nm, and shrinks for a larger median.
  • PSD tails towards large particles, and the probability for each of their own size group can decrease as well as increase.
  • In whole PSD changes towards a smaller size, the change is faster for a small median, and conversely slower for a large median.
The performance of fuel cells is affected by the rate of degradation, which can be minimized through a comprehensive understanding of failure mechanisms. We believe that the findings detailed above provide information that could be helpful in developing mitigation strategies and catalyst design.

Funding

This research received no external funding.

Institutional Review Board Statement

Not applicable.

Informed Consent Statement

Not applicable.

Data Availability Statement

The original contributions presented in this study are included in the article. Further inquiries can be directed to the corresponding author.

Conflicts of Interest

The author declares no conflicts of interest.

References

  1. Ball, M.; Basile, A.; Veziroǧlu, T. Compendium of Hydrogen Energy: Hydrogen Use, Safety and the Hydrogen Economy; Woodhead Publishing: Sawston, UK, 2016. [Google Scholar]
  2. Barbir, F.; Basile, A.; Veziroǧlu, T. Compendium of Hydrogen Energy: Hydrogen Energy Conversion; Woodhead Publishing: Sawston, UK, 2016. [Google Scholar]
  3. Basile, A.; Gupta, R.; Veziroǧlu, T. Compendium of Hydrogen Energy: Hydrogen Storage, Distribution and Infrastructure; Woodhead Publishing: Sawston, UK, 2016. [Google Scholar]
  4. Subramani, V.; Basile, A.; Veziroǧlu, T. Compendium of Hydrogen Energy: Hydrogen Production and Purification; Woodhead Publishing: Sawston, UK, 2015. [Google Scholar]
  5. Eikerling, M.; Kulikovsky, A. Polymer Electrolyte Fuel Cells; Elsevier: Amsterdam, The Netherlands, 2017. [Google Scholar]
  6. Kulikovsky, A. Analytical Modeling of Fuel Cells; Elsevier: Amsterdam, The Netherlands, 2019. [Google Scholar] [CrossRef]
  7. Hacker, V.; Mitsushima, S. Fuel Cells and Hydrogen; Elsevier: Amsterdam, The Netherlands, 2018. [Google Scholar]
  8. Foniok, K.; Drozdova, L.; Prokop, L.; Krupa, F.; Kedron, P.; Blazek, V. Mechanisms and modelling of effects on the degradation processes of a proton exchange membrane (PEM) fuel cell: A comprehensive review. Energies 2025, 18, 2117. [Google Scholar] [CrossRef]
  9. Zhu, Y.; Qu, Z.; Zhang, G.; Yu, B. A one-dimensional model for Pt degradation and precipitation in proton exchange membrane fuel cell considering Pt nucleation, particle size growth, and band formation. Electrochim. Acta 2024, 475, 143590. [Google Scholar] [CrossRef]
  10. Jahnke, T.; Futter, G.; Baricci, A.; Rabissi, C.; Casalegno, A. Physical modeling of catalyst degradation in low temperature fuel cells: Platinum oxidation, dissolution, particle growth and platinum band formation. J. Electrochem. Soc. 2020, 167, 013523. [Google Scholar] [CrossRef]
  11. Ding, Y.; Fang, Z.; Yuan, Y.; Tian, M.; Yu, J.; Li, L. Particle size distribution degradation model for PEM fuel cell Pt/C catalyst based on population balance equation. Chem. Eng. Sci. 2024, 300, 120590. [Google Scholar] [CrossRef]
  12. Li, Y.; Moriyama, K.; Gu, W.; Arisetty, S.; Wang, C. A one-dimensional Pt degradation model for polymer electrolyte fuel cells. J. Electrochem. Soc. 2015, 162, F834–F842. [Google Scholar] [CrossRef]
  13. Colombo, E.; Casalegno, A.; Guetaz, L.; Bariccil, A. Revealing the critical role of low voltage excursions in enhancing PEM fuel cell catalyst degradation by automotive hydrogen/air potential cycling experiments. Int. J. Hydrogen Energy 2024, 65, 292–307. [Google Scholar] [CrossRef]
  14. Shojayian, M.; Kjeang, E. Simulation of cathode catalyst durability under fuel cell vehicle operation—Effects of stack size and temperature. J. Power Sources 2024, 591, 233820. [Google Scholar] [CrossRef]
  15. Choi, J.; Kim, E.; Cha, Y.; Ghasemi, M.; Ju, H. Probing the influence of nonuniform Pt particle size distribution using a full three-dimensional, multiscale, multiphase polymer electrolyte membrane fuel cell model. Electrochim. Acta 2022, 405, 139811. [Google Scholar] [CrossRef]
  16. Kobayashi, A.; Fujii, T.; Harada, C.; Yasumoto, E.; Takeda, K.; Kakinuma, K.; Uchida, M. Effect of Pt and ionomer distribution on polymer electrolyte fuel cell performance and durability. ACS Appl. Energy Mater. 2021, 4, 2307–2317. [Google Scholar] [CrossRef]
  17. Wang, D.; Min, H.; Sun, W.; Zeng, B.; Wu, H. Durability study of frequent dry–wet cycle on proton exchange membrane fuel cell. Energies 2023, 16, 4284. [Google Scholar] [CrossRef]
  18. Tarasova, N.A.; Hanif, M.B.; Janjua, N.K.; Anwar, S.; Motola, M.; Medvedev, D.A. Fluorine-insertion in solid oxide materials for improving their ionic transport and stability. A brief review. Int. J. Hydrogen Energy 2024, 50 Pt C, 104–123. [Google Scholar] [CrossRef]
  19. Zheng, Z.; Yang, F.; Lin, C.; Zhu, F.; Shen, S.; Wei, G.; Zhang, J. Design of gradient cathode catalyst layer (CCL) structure for mitigating Pt degradation in proton exchange membrane fuel cells (PEMFCs) using mathematical method. J. Power Sources 2020, 451, 227729. [Google Scholar] [CrossRef]
  20. Kravos, A.; Ritzberger, D.; Tavčar, G.; Hametner, C.; Jakubek, S.; Katrašnik, T. Thermodynamically consistent reduced dimensionality electrochemical model for proton exchange membrane fuel cell performance modelling and control. J. Power Sources 2020, 454, 227930. [Google Scholar] [CrossRef]
  21. Bartlechner, J.; Vrlić, M.; Hametner, C.; Jakubek, S. State-of-Health observer for PEM fuel cells—A novel approach for real-time online analysis. Int. J. Hydrogen Energy 2024, 95, 1112–1125. [Google Scholar] [CrossRef]
  22. Franco, A.A.; Schott, P.; Jallut, C.; Maschke, B. A dynamic mechanistic model of an electrochemical interface. J. Electrochem. Soc. 2006, 153, A1053–A1061. [Google Scholar] [CrossRef]
  23. Fuhrmann, J.; Guhlke, C.; Linke, A.; Merdon, C.; Müller, R. Models and numerical methods for electrolyte flows. In Topics in Applied Analysis and Optimisation; Hintermüller, M., Rodrigues, J.F., Eds.; Springer: Cham, Switzerland, 2019; Chapter 8; pp. 183–209. [Google Scholar] [CrossRef]
  24. Efendiev, M. Attractors for Degenerate Parabolic Type Equations. In Mathematical Surveys and Monographs; AMS: Providence, RI, USA, 2013; Volume 192. [Google Scholar] [CrossRef]
  25. Fellner, K.; Kovtunenko, V.A. A singularly perturbed nonlinear Poisson–Boltzmann equation: Uniform and super-asymptotic expansions. Math. Meth. Appl. Sci. 2015, 38, 3575–3586. [Google Scholar] [CrossRef]
  26. González-Granada, J.; Kovtunenko, V. Entropy method for generalized Poisson–Nernst–Planck equations. Anal. Math. Phys. 2018, 8, 603–619. [Google Scholar] [CrossRef]
  27. Kovtunenko, V.; Zubkova, A. Mathematical modeling of a discontinuous solution of the generalized Poisson–Nernst–Planck problem in a two-phase medium. Kinet. Relat. Mod. 2018, 11, 119–135. [Google Scholar] [CrossRef]
  28. Alekseev, G.; Spivak, Y. Stability estimates of optimal solutions for the steady magnetohydrodynamics-Boussinesq equations. Mathematics 2024, 12, 1912. [Google Scholar] [CrossRef]
  29. Hintermüller, M.; Kovtunenko, V.A.; Kunisch, K. A Papkovich–Neuber-based numerical approach to cracks with contact in 3D. IMA J. Appl. Math. 2009, 74, 325–343. [Google Scholar] [CrossRef]
  30. Itou, H.; Kovtunenko, V.; Rajagopal, K. The Boussinesq flat-punch indentation problem within the context of linearized viscoelasticity. Int. J. Eng. Sci. 2020, 151, 103272. [Google Scholar] [CrossRef]
  31. Khludnev, A.; Kovtunenko, V. Analysis of Cracks in Solids. In Advances in Fracture Mechanics; WIT-Press: Southampton, MA, USA, 2000; Volume 6. [Google Scholar]
  32. Du, S.; Guan, S.; Mehrazi, S.; Zhou, F.; Pan, M.; Zhang, R.; Chuang, P.Y.A.; Sui, P.C. Effect of dispersion method and catalyst on the crack morphology and performance of catalyst layer of PEMFC. J. Electrochem. Soc. 2021, 168, 114506. [Google Scholar] [CrossRef]
  33. Chan, H.S.; Bläubaum, L.; Vijayshankar, D.; Röder, F.; Nowak, C.; Weber, A.; Kwade, A.; Krewer, U. Revealing the impact of particle size distribution on ageing of Lithium-Ion batteries with frequency response analysis. Batter. Supercaps 2023, 6, e202300203. [Google Scholar] [CrossRef]
  34. Kovtunenko, V.; Karpenko-Jereb, L. Study of voltage cycling conditions on Pt oxidation and dissolution in polymer electrolyte fuel cells. J. Power Sources 2021, 493, 229693. [Google Scholar] [CrossRef]
  35. Pivac, I.; Barbir, F. Impact of shutdown procedures on recovery phenomena of proton exchange membrane fuel cells. Fuel Cells 2020, 160, 185–195. [Google Scholar] [CrossRef]
  36. Kovtunenko, V.; Karpenko-Jereb, L. Lifetime of catalyst under voltage cycling in polymer electrolyte fuel cell due to platinum oxidation and dissolution. Technologies 2021, 9, 80. [Google Scholar] [CrossRef]
  37. Karpenko-Jereb, L.; Kovtunenko, V. Modeling of the impact of cycling operating conditions on durability of polymer electrolyte fuel cells and its sensitivity analysis. Int. J. Hydrogen Energy 2023, 48, 15646–15656. [Google Scholar] [CrossRef]
  38. Kovtunenko, V. Variance-based sensitivity analysis of fitting parameters to impact on cycling durability of polymer electrolyte fuel cells. Technologies 2022, 9, 111. [Google Scholar] [CrossRef]
  39. Kovtunenko, V. The Holby–Morgan model of platinum catalyst degradation in PEM fuel cells: Range of feasible parameters achieved using voltage cycling. Technologies 2023, 11, 184. [Google Scholar] [CrossRef]
  40. Kovtunenko, V. Feasible domain of cycling operating conditions and model parameters for Holby–Morgan model of platinum catalyst degradation in PEMFC. Int. J. Hydrogen Energy 2024, 51C, 1518–1526. [Google Scholar] [CrossRef]
  41. Koltsova, E.; Vasilenko, V.; Zhensa, A.; Bogdanovskaya, V.; Radina, M. Mechanism of degradation of polymer fuel cell cathode catalyst: Research and modeling. Theor. Found. Chem. Eng. 2024, 58, 1945–1956. [Google Scholar] [CrossRef]
  42. Kovtunenko, V. Particle size distribution in Holby–Morgan degradation model of platinum on carbon catalyst in fuel cell: Normal distribution. Technologies 2024, 12, 202. [Google Scholar] [CrossRef]
  43. Holby, E.; Morgan, D. Application of Pt nanoparticle dissolution and oxidation modeling to understanding degradation in PEM fuel cells. J. Electrochem. Soc. 2012, 159, B578–B591. [Google Scholar] [CrossRef]
  44. Touil, W.; Li, Z.; Outbib, R.; Hissel, D.; Jemei, S. A system-level modeling framework for predicting Pt catalyst degradation in proton exchange membrane fuel cells. J. Power Sources 2025, 625, 235628. [Google Scholar] [CrossRef]
  45. Darling, R.; Meyers, J. Kinetic model of platinum dissolution in PEMFCs. J. Electrochem. Soc. 2003, 150, A1523–A1527. [Google Scholar] [CrossRef]
  46. Holby, E.; Sheng, W.; Shao-Horn, Y.; Morgan, D. Pt nanoparticle stability in PEM fuel cells: Influence of particle size distribution and crossover hydrogen. Energy Environ. Sci. 2009, 2, 865–871. [Google Scholar] [CrossRef]
  47. Taylor, S.; Fabbri, E.; Levecque, P.; Schmidt, T.J.; Conrad, O. The effect of platinum loading and surface morphology on oxygen reduction activity. Electrocatalysis 2016, 7, 287–296. [Google Scholar] [CrossRef]
  48. Lönn, B.; Strandberg, L.; Roth, V.; Luneau, M.; Wickman, B. Fuel cell catalyst layers with platinum nanoparticles synthesized by sputtering onto liquid substrates. ACS Omega 2024, 9, 43725–43733. [Google Scholar] [CrossRef]
  49. Adibi, P.T.Z.; Zhdanov, V.P.; Langhammer, C.; Grönbeck, H. Transient bimodal particle size distributions during Pt sintering on alumina and silica. J. Phys. Chem. C 2014, 119, 989–996. [Google Scholar] [CrossRef]
  50. Bi, W.; Fuller, T.F. Modeling of PEM fuel cell Pt/C catalyst degradation. J. Power Sources 2008, 178, 188–196. [Google Scholar] [CrossRef]
  51. Schröder, J.; Pittkowski, R.K.; Du, J.; Kirkensgaard, J.J.K.; Arenz, M. Investigating the particle growth in bimodal Pt/C catalysts by in-situ small-angle x-ray scattering: Challenges in the evaluation of stress test protocol-dependent degradation mechanisms. J. Electrochem. Soc. 2022, 169, 104504. [Google Scholar] [CrossRef]
  52. Gilbert, J.A.; Kariuki, N.N.; Wang, X.; Kropf, A.J.; Yu, K.; Groom, D.J.; Ferreira, P.J.; Morgan, D.; Myers, D.J. Pt catalyst degradation in aqueous and fuel cell environments studied via in-operando anomalous small-angle x-ray scattering. Electrochim. Acta 2015, 173, 223–234. [Google Scholar] [CrossRef]
  53. Sandbeck, D.; Secher, N.; Speck, F.; Sørensen, J.; Chorkendorff, J.; Cherevko, S. Particle size effect on platinum dissolution: Considerations for accelerated stability testing of fuel cell catalysts. ACS Catal. 2020, 10, 6281–6290. [Google Scholar] [CrossRef]
  54. Ostwald, W. Lehrbruck der Allgemeinen Chemie; W. Engelmann: Leipzig, Germany, 1896; Volume 2. [Google Scholar]
  55. Ascarelli, P.; Contini, V.; Giorgi, R. Formation process of nanocrystalline materials from x-ray diffraction profile analysis: Application to platinum catalysts. J. Appl. Phys. 2002, 91, 4556–4561. [Google Scholar] [CrossRef]
  56. Granqvist, C.G.; Buhrman, R.A. Size distributions for supported metal catalysts: Coalescence growth versus Ostwald ripening. J. Catal. 1976, 42, 477–479. [Google Scholar] [CrossRef]
  57. Kregar, A.; Katrašnik, T. Theoretical analysis of particle size re-distribution due to Ostwald ripening in the fuel cell catalyst layer. Open Phys. 2019, 17, 779–789. [Google Scholar] [CrossRef]
  58. Kregar, A.; Kravos, A.; Katrašnik, T. Methodology for evaluation of contributions of Ostwald ripening and particle agglomeration to growth of catalyst particles in PEM fuel cells. Fuel Cells 2020, 20, 487–498. [Google Scholar] [CrossRef]
  59. Baroody, H.A.; Stolar, D.B.; Eikerling, M.H. Modelling-based data treatment and analytics of catalyst degradation in polymer electrolyte fuel cells. Electrochim. Acta 2018, 283, 1006–1016. [Google Scholar] [CrossRef]
  60. Nores-Pondal, F.; Vilella, I.; Troiani, H.; Granada, M.; de Miguel, S.; Scelza, O.; Corti, H. Catalytic activity vs. size correlation in platinum catalysts of PEM fuel cells prepared on carbon black by different methods. Int. J. Hydrogen Energy 2009, 34, 8193–8203. [Google Scholar] [CrossRef]
  61. Gummalla, M.; Ball, S.C.; Condit, D.A.; Rasouli, S.; Yu, K.; Ferreira, P.J.; Myers, D.J.; Yang, Z. Effect of particle size and operating conditions on Pt3Co PEMFC cathode catalyst durability. Catalysts 2015, 5, 926–948. [Google Scholar] [CrossRef]
  62. Yu, K.; Groom, D.J.; Wang, X.; Yang, Z.; Gummalla, M.; Ball, S.C.; Myers, D.J.; Ferreira, P.J. Degradation mechanisms of platinum nanoparticle catalysts in proton exchange membrane fuel cells: The role of particle size. Chem. Mater. 2014, 26, 5540–5548. [Google Scholar] [CrossRef]
  63. Xu, Z.; Zhang, H.; Zhong, H.; Lu, Q.; Wang, Y.; Su, D. Effect of particle size on the activity and durability of the Pt/C electrocatalyst for proton exchange membrane fuel cells. Appl. Catal. B Environ. 2012, 111–112, 264–270. [Google Scholar] [CrossRef]
  64. Yu, H.; Zachman, M.J.; Reeves, K.S.; Park, J.H.; Kariuki, N.N.; Hu, L.; Mukundan, R.; Neyerlin, K.C.; Myers, D.J.; Cullen, D.A. Tracking nanoparticle degradation across fuel cell electrodes by automated analytical electron microscopy. ACS Nano 2022, 16, 12083–12094. [Google Scholar] [CrossRef]
  65. Zhan, F.; Hu, K.S.; Mai, J.H.; Zhang, L.S.; Zhang, Z.G.; He, H.; Liu, X.H. Recent progress of Pt-based oxygen reduction reaction catalysts for proton exchange membrane fuel cells. Rare Met. 2024, 43, 2444–2468. [Google Scholar] [CrossRef]
Figure 1. Platinum particles reduction by dissolution contra to growth by ion redeposition.
Technologies 13 00262 g001
Figure 2. Log-normal distribution for d ˜ = 3 and σ = 0.25 : probability density function ϕ (a) and its approximation within P = 12 particle size groups ϕ 1 , , ϕ P (b).
Technologies 13 00262 g002
Figure 3. Non-diffusive model: Pt particle diameter ratio d i / d i 0 vs. cycles (a), non-change of PSD (b), ratio E of ECSA and m Pt of Pt mass loss vs. cycles (c).
Technologies 13 00262 g003
Figure 4. Diffusive model: Pt ion concentration c ( t , x ) vs. cycles across CL (a), non-change of PSD at interface with GDL (b), change of PSD at interface with membrane (c).
Technologies 13 00262 g004
Figure 5. Change of the initial mean PSD for d ˜ = 2 (nm) and σ = 0.0025 (nm) during #k = 100 cycles (a), #k = 200 cycles (b), #k = 300 cycles (c).
Technologies 13 00262 g005
Figure 6. Change of the initial mean PSD for d ˜ = 3 (nm) and σ = 0.0025 (nm) during #k = 100 cycles (a), #k = 200 cycles (b), #k = 300 cycles (c).
Technologies 13 00262 g006
Table 1. Parameters for Pt ion formation and diffusion and for Pt oxide formation.
SymbolValueUnitsDescription
ν 1 1 × 10 4 Hzdissolution attempt frequency
ν 2 8 × 10 5 Hzbackward dissolution rate factor
β 1 0.5 Butler transfer coefficient for Pt dissolution
n2 electrons transferred during Pt dissolution
U eq 1.118VPt dissolution bulk equilibrium voltage
Ω 9.09cm3/molmolar volume of Pt
γ 2.4 × 10 4 J/cm2Pt [1 1 1] surface tension
c ref 1mol/cm3reference Pt ion concentration
H 1 , fit 4.4 × 10 4 J/molpartial molar Pt dissolution activation enthalpy
D Pt 1 × 10 6 cm2/sdiffusion coefficient of Pt ion in the membrane
ν 1 1 × 10 4 Hzforward Pt oxide formation rate constant
ν 2 2 × 10 2 Hzbackward Pt oxide formation rate constant
Γ 2.2 × 10 9 mol/cm2Pt surface site density
β 2 0.5 Butler transfer coefficient for PtO formation
n 2 2 electrons transferred during Pt oxide formation
U fit 0.8VPt oxide formation bulk equilibrium voltage
λ 2 × 10 4 J/molPt oxide dependent kinetic barrier constant
ω 5 × 10 4 J/molPt oxide-oxide interaction energy
H 2 , fit 1.2 × 10 4 J/molpartial molar oxide formation activation enthalpy
Table 2. Discrete probability of 12 particle size groups for d ˜ = 3 = d 5 and σ = 0.25 .
GroupParticle SizeRangeProbability
i = 1 : d 1 = 1 d < d 1 + σ ϕ 1 = 0.0002
i = 2 : d 2 = 1.5 d 2 σ d < d 2 + σ ϕ 2 = 0.0153
i = 3 : d 3 = 2 d 3 σ d < d 3 + σ ϕ 3 = 0.1094
i = 4 : d 4 = 2.5 d 4 σ d < d 4 + σ ϕ 4 = 0.239
i = 5 : d 5 = 3 d 5 σ d < d 5 + σ ϕ 5 = 0.2617
i = 6 : d 6 = 3.5 d 6 σ d < d 6 + σ ϕ 6 = 0.1884
i = 7 : d 7 = 4 d 7 σ d < d 7 + σ ϕ 7 = 0.1043
i = 8 : d 8 = 4.5 d 8 σ d < d 8 + σ ϕ 8 = 0.0488
i = 9 : d 9 = 5 d 9 σ d < d 9 + σ ϕ 9 = 0.0204
i = 10 : d 10 = 5.5 d 10 σ d < d 10 + σ ϕ 10 = 0.008
i = 11 : d 11 = 6 d 11 σ d < d 11 + σ ϕ 11 = 0.003
i = 12 : d 12 = 6.5 d 12 σ d ϕ 12 = 0.0017
Disclaimer/Publisher’s Note: The statements, opinions and data contained in all publications are solely those of the individual author(s) and contributor(s) and not of MDPI and/or the editor(s). MDPI and/or the editor(s) disclaim responsibility for any injury to people or property resulting from any ideas, methods, instructions or products referred to in the content.

