Article

Linear Average Yield Criterion and Its Application in Failure Pressure Evaluation of Defect-Free Pipelines

1
Department of Hydraulic Engineering, Henan Vocational College of Water Conservancy and Environment, Zhengzhou 450008, China
2
School of Water Resources and Transportation, Zhengzhou University, Zhengzhou 450001, China
3
National Local Joint Engineering Laboratory of Major Infrastructure Testing and Rehabilitation Technology, Zhengzhou 450001, China
4
Collaborative Innovation Center of Water Conservancy and Transportation Infrastructure Safety, Zhengzhou 450001, China
5
Yellow River Laboratory, Zhengzhou University, Zhengzhou 450001, China
*
Author to whom correspondence should be addressed.
Technologies 2025, 13(6), 252; https://doi.org/10.3390/technologies13060252
Submission received: 11 April 2025 / Revised: 1 June 2025 / Accepted: 10 June 2025 / Published: 13 June 2025
(This article belongs to the Section Construction Technologies)

Abstract

Analysis of internal pressure failure is a crucial aspect of assessing pipeline integrity. By combining the unified yield criterion with actual burst data, the applicability of different yield criteria is elucidated. Based on the distribution law of burst data, a linear average yield criterion is proposed. The results indicate that the yield function of the linear average yield criterion is a linear expression, and the yield path forms an equilateral non-equiangular inscribed dodecagon within the von Mises circle. For the evaluation of failure pressure, this yield criterion exhibits the highest level of applicability, followed by the ASSY and Tresca yield theories. The linear average yield criterion limits the failure pressure prediction error, with low strain-hardening (0 ≤ n ≤ 0.06) to within 3%.

1. Introduction

Steel pipelines operate under internal pressure. For the convenience of material transportation, steel pipelines maintain internal pressure during operation. Currently, there is a high occurrence rate of pipeline failures under internal pressure, which presents a significant risk to the well-being of the general public, economic progress, and the environment. In order to prevent such failures, it becomes imperative to monitor the pipeline’s burst pressure in a timely manner. Overly conservative estimates of the burst pressure may result in wastage of resources, while overly liberal judgments can lead to leaks or explosions of pipelines. Hence, achieving the precise computation of burst pressure is of utmost importance [1].
Due to internal pressure or external loads, pipelines may undergo plastic deformation. As plastic deformation reaches the limit threshold, the pipeline will fail. The basis for the bearing capacity analysis of pipelines lies in the yield criterion. The investigation into yield criterion dates back to the previous century. In the year 1864, the Tresca yield criterion was put forth by Tresca, taking metal deformation tests as its foundation [2], identifying plastic deformation based on maximum shear stress. In 1913, the establishment of the nonlinear von Mises yield criterion considered the three principal stresses [3]. In 1950, the revision of von Mises yield criterion by Hill resulted in the derivation of the Hill yield criterion [4]. Yu [5] proposed the twin shear stress yield (TSSY) criterion in 1983, assuming material plastic failure. These aforementioned yield criteria assume significance in regards to the mechanical analysis of plastic deformation.
Numerous academics have studied the bearing capacity assessment of steel pipelines. Yu [6] discussed the relationship between different yield criteria with complex stress and provided a method for selecting the reasonable failure criterion. To further increase the precision, Zhao et al. [7] created the MY criterion, which relies on the mean of the Tresca and TSSY criteria. Zhu and Brian [8] proposed prediction formulas for pipeline burst pressure forecasting based on Tresca and von Mises criteria, respectively, and derived the ASSY criterion based on shear stress. The analytical model proposed by Peng et al. [9], which was based on the TSSY criteria, led to an overestimation of the pipes’ ultimate bearing capacity. It is evident that the findings based on the Tresca criterion are too low, and the results based on the TSSY criterion are excessive, for forecasting the burst pressure. Furthermore, there remains a discrepancy between the test data and the outcomes of the von Mises and ASSY criteria [10]. Zhang et al. [11] first established a finite element analysis model for pipelines based on the Tresca criterion. The von Mises criterion produced findings that were marginally higher than the experimental data, whereas the Tresca criterion produced computed values that were determined to be too cautious. Using the model of hardening material, Chmelko and Berta [12] formulated an analytical method for calculating the explosion pressure of cylindrical containers. The findings suggest that the experimental results obtained correspond to their analytical solutions in a satisfactory manner. A multi-parameter assessment criterion was introduced by Chen, Z. et al. [13] in order to precisely assess the pressure at which hydrogen-doped pipelines fail. Tang et al. [14] employed mathematical extrapolation to develop a novel yield criterion, and the predicted outcomes of this yield criterion are situated in the intermediate range between those of the TSSY and Tresca criteria. Zhang and Liu [15] introduced a novel yield criterion that incorporates strain-hardening characteristics into a failure pressure evaluation model for defective and defect-free pipelines. Subsequent research has indicated that certain predictive models neglected to account for the impact of material strain-hardening, which led to an inadequate estimation of internal pressure bearing capacity [16]. Indeed, the ultimate bearing capacity will be enhanced by the hardening characteristics of materials. To compensate for the shortcomings of the existing yield criteria, Zhu et al. [17] proposed a yield criterion and a method for calculating failure pressure applicable to thick-walled pipelines.
Currently, a discrepancy persists between the efficacy of failure pressure assessment models that align with yield criterion and the empirical data available. Given that the anticipated outcomes of burst pressure are contingent upon various yield criteria, it is necessary to clarify the applicability of different yield criteria [18]. Therefore, this article establishes a new yield criterion, with the mean theorem based on the applicable range of yield criteria in internal pressure failure analysis of steel with different attributes. Drawing upon the yield criteria, a novel mathematical model was developed to forecast the rupture pressure of pipelines, and the accuracy of different yield criteria was verified through actual pipeline burst data.

2. Yield Criterion and Evaluation Model

The yield criterion is directly related to the evaluation model of failure pressure, and the evaluation model can be divided into the following two methods:
(1) According to the type of yield criterion, it is possible to classify the evaluation models as Tresca, ASSY, von Mises, and TSSY. The predicted result of the Tresca yield criterion evaluation model is the smallest, whereas the predicted result of the TSSY criterion evaluation model is the largest.
(2) According to whether or not the strain-hardening performance of steel materials is considered, the methods can be divided into two categories: considering and not considering. The strain-hardening performance can be determined by the strain-hardening exponent n, which is a parameter greater than 0 but less than 1. For different grades of steel materials, the range is approximately 0 < n < 0.2 [19]. The larger the value of this parameter, the more significant the strengthening performance of the steel material. For an evaluation model that does not consider the strain-hardening performance, it is assumed that n = 0.
Wang and Zhang provided a predictive model for failure pressure P0 grounded in the unified yield criterion (UYC) [20], as shown in Equation (1). By changing the values of parameter b and the strain-hardening exponent n in Equation (1), different types of failure pressure evaluation models can be transformed.
P 0 = ( 1 + b 2 + b ) n + 1 4 t D t σ u
where σ u is the tensile strength, n is the strain-hardening exponent, D and t are the diameter and wall thickness, respectively, and parameter b is the coefficient affected by the failure stress.
The UYC is composed of a series of piecewise linear yield criteria obtained as a function of b in the π-plane. The particular formulation is determined by the value of parameter b. The range of b is 0 b 1 . Therefore, Equation (1) can be transformed for use in different failure pressure evaluation models corresponding to different yield criteria based on parameter b.
(1) When b = 0, Equation (1) can be transformed into the evaluation model corresponding to the Tresca criterion;
(2) When b = 1, Equation (1) is the evaluation model corresponding to the TSSY criterion;
(3) When 0 < b < 1 , the impact of the second principal shear stress on the equivalent stress of pipeline plastic failure was considered, but its weight was lower than the first principal shear stress. Between the two ultimate yield criteria (Treca and TSSY criteria), a succession of yield criteria were derived to characterize the strength properties of various materials. For example, when b = 1/(1 + 3 ), Equation (1) approximates the evaluation model corresponding to the von Mises criterion linearly; when b = ( 8 3 10 ) / 23 , Equation (1) yields the evaluation model corresponding to the ASSY yield criterion.

3. Applicability of Different Yield Criteria

According to Equation (1), The primary determinant of the yield criterion selection is parameter b, and the expression for parameter b, as shown in Equation (2), can be obtained, as follows:
b = 1 1 ( P 0 D t 4 t σ u ) 1 n + 1 2
The failure data of 65 intact pipelines [21,22,23,24,25,26,27,28,29,30,31,32,33,34,35,36,37] was adopted to analyze the applicability of the yield criterion. The experimental data covers three strength levels of steel: low, medium, and high. Considering the inherent characteristics of steel materials, the method of considering the strain-hardening characteristics is adopted for analysis, and n is determined using the following standards:
(1) If there is true strain ε u or engineering strain ε u data corresponding to tensile strength σu, determine the value of n with Equation (3) [19].
n = ln ( 1 + ε u ) = ε u
(2) If there is data for yield strength σy, tensile strength σu, and yield strain ε y , calculate n with Equation (4).
σ y σ u = 1 1 + ε y e ln ( 1 + ε y ) n n
Figure 1 illustrates the correlation between parameter b and the strain-hardening exponent n, calculated based on failure pressure in 65 burst tests. The strain-hardening exponent n varies between 0.01 and 0.20, including a wide range of potential values [38]. Figure 1 shows that the maximum prediction is determined by the von Mises criterion, whereas the minimum is determined by the Tresca criterion. The ASSY criterion is in an intermediate state between the two, and the forecast results of TSSY are much greater than the true value. Considering the differences in processing techniques, steel with the same strain-hardening exponent n displays different yield criteria for internal pressure failure analysis, and the most obvious difference is the steel material with 0.06 ≤ n < 0.19.
Figure 1 illustrates that the yield criteria of pipelines are primarily categorized into two parts:
(1) When dealing with steel materials with 0 ≤ n < 0.06, the highest allowable yield criterion is the ASSY yield criterion, while the lowest allowable criterion is the Tresca criterion.
(2) When dealing with steel materials with 0.06 ≤ n < 0.19, the von Mises yield criterion is the upper limit for analyzing failure pressure. The Tresca criterion serves as the lower limit for the yield criterion.

4. Development of a Novel Yield Criterion

4.1. Linear Average Yield Criterion

The research results indicate that the yield criterion is closely related to the strain-hardening exponent n [8,16,39]. As shown in Figure 1, for a pipeline with 0 ≤ n < 0.06, the failure data is uniformly distributed between the ASSY and the Tresca yield criteria; for a pipeline with 0.06 ≤ n < 0.19, the failure data is uniformly distributed between the von Mises and the Tresca yield criteria. Based on the research conclusion, a novel linear average yield criterion was presented, with the specific expression as follows:
(1) Steel pipeline with 0 ≤ n ≤ 0.06
The maximum threshold of the yield criteria is referred to as the ASSY yield criterion, and the expression of equivalent stress σ e is as follows:
σ e = σ 1 0 . 144 σ 2 1 . 856 σ 3
where σ1, σ2, σ3 represents the three principal stresses of the pipeline with internal pressure, respectively.
The Tresca yield criterion represents the minimum threshold of the yield criteria, and the expression of equivalent stress σ e is as follows:
σ e = σ 1 σ 3
To construct a more representative yield criterion for defect-free pipelines under internal pressure, a linear average approach between two classical criteria was adopted. Specifically, Equation (5) represents the ASSY yield criterion, which tends to overpredict the failure pressure, while Equation (6) represents the Tresca criterion, which is generally conservative and tends to underpredict the failure pressure. Both expressions are linear and reflect the influence of different shear stress conditions. The new linear average yield criterion is obtained by averaging the two equations:
σ e = σ 1 0 . 072 σ 2 0 . 928 σ 3
The linear average yield criterion in Equation (7) states that material yield is influenced by both the first and second principal shear stresses, but the weight of the first principal shear stress is much greater than that of the second principal shear stress, with a weight ratio of 12.82.
(2) Steel pipelines with n > 0.06
The von Mises yield criterion represents the upper limit, and σ e is expressed as follows:
σ e = σ 1 0 . 268 σ 2 0 . 732 σ 3
The Tresca yield criterion represents the minimum threshold of the yield criteria, and Equations (6) and (8) are both linear expressions. The new linear average yield criterion is obtained by averaging the two equations:
σ e = σ 1 0 . 134 σ 2 0 . 866 σ 3
The linear average yield criterion in Equation (9) states that material yield is influenced by both the first and second principal shear stresses, but the weight of the first principal shear stress is greater than that of the second principal shear stress, with a weight ratio of 6.45.
Therefore, the new linear average yield (LAY) criterion, is shown in Figure 2 (where σ 1 , σ 2 , and σ 3 are principal stresses σ 1 , σ 2 , and σ 3 , projected on the π-plane), expressed as follows:
σ e = σ 1 0 . 072 σ 2 0 . 928 σ 3 0 n 0.06 σ 1 0 . 134 σ 2 0 . 866 σ 3 0.06   <   n

4.2. Yield Trajectory

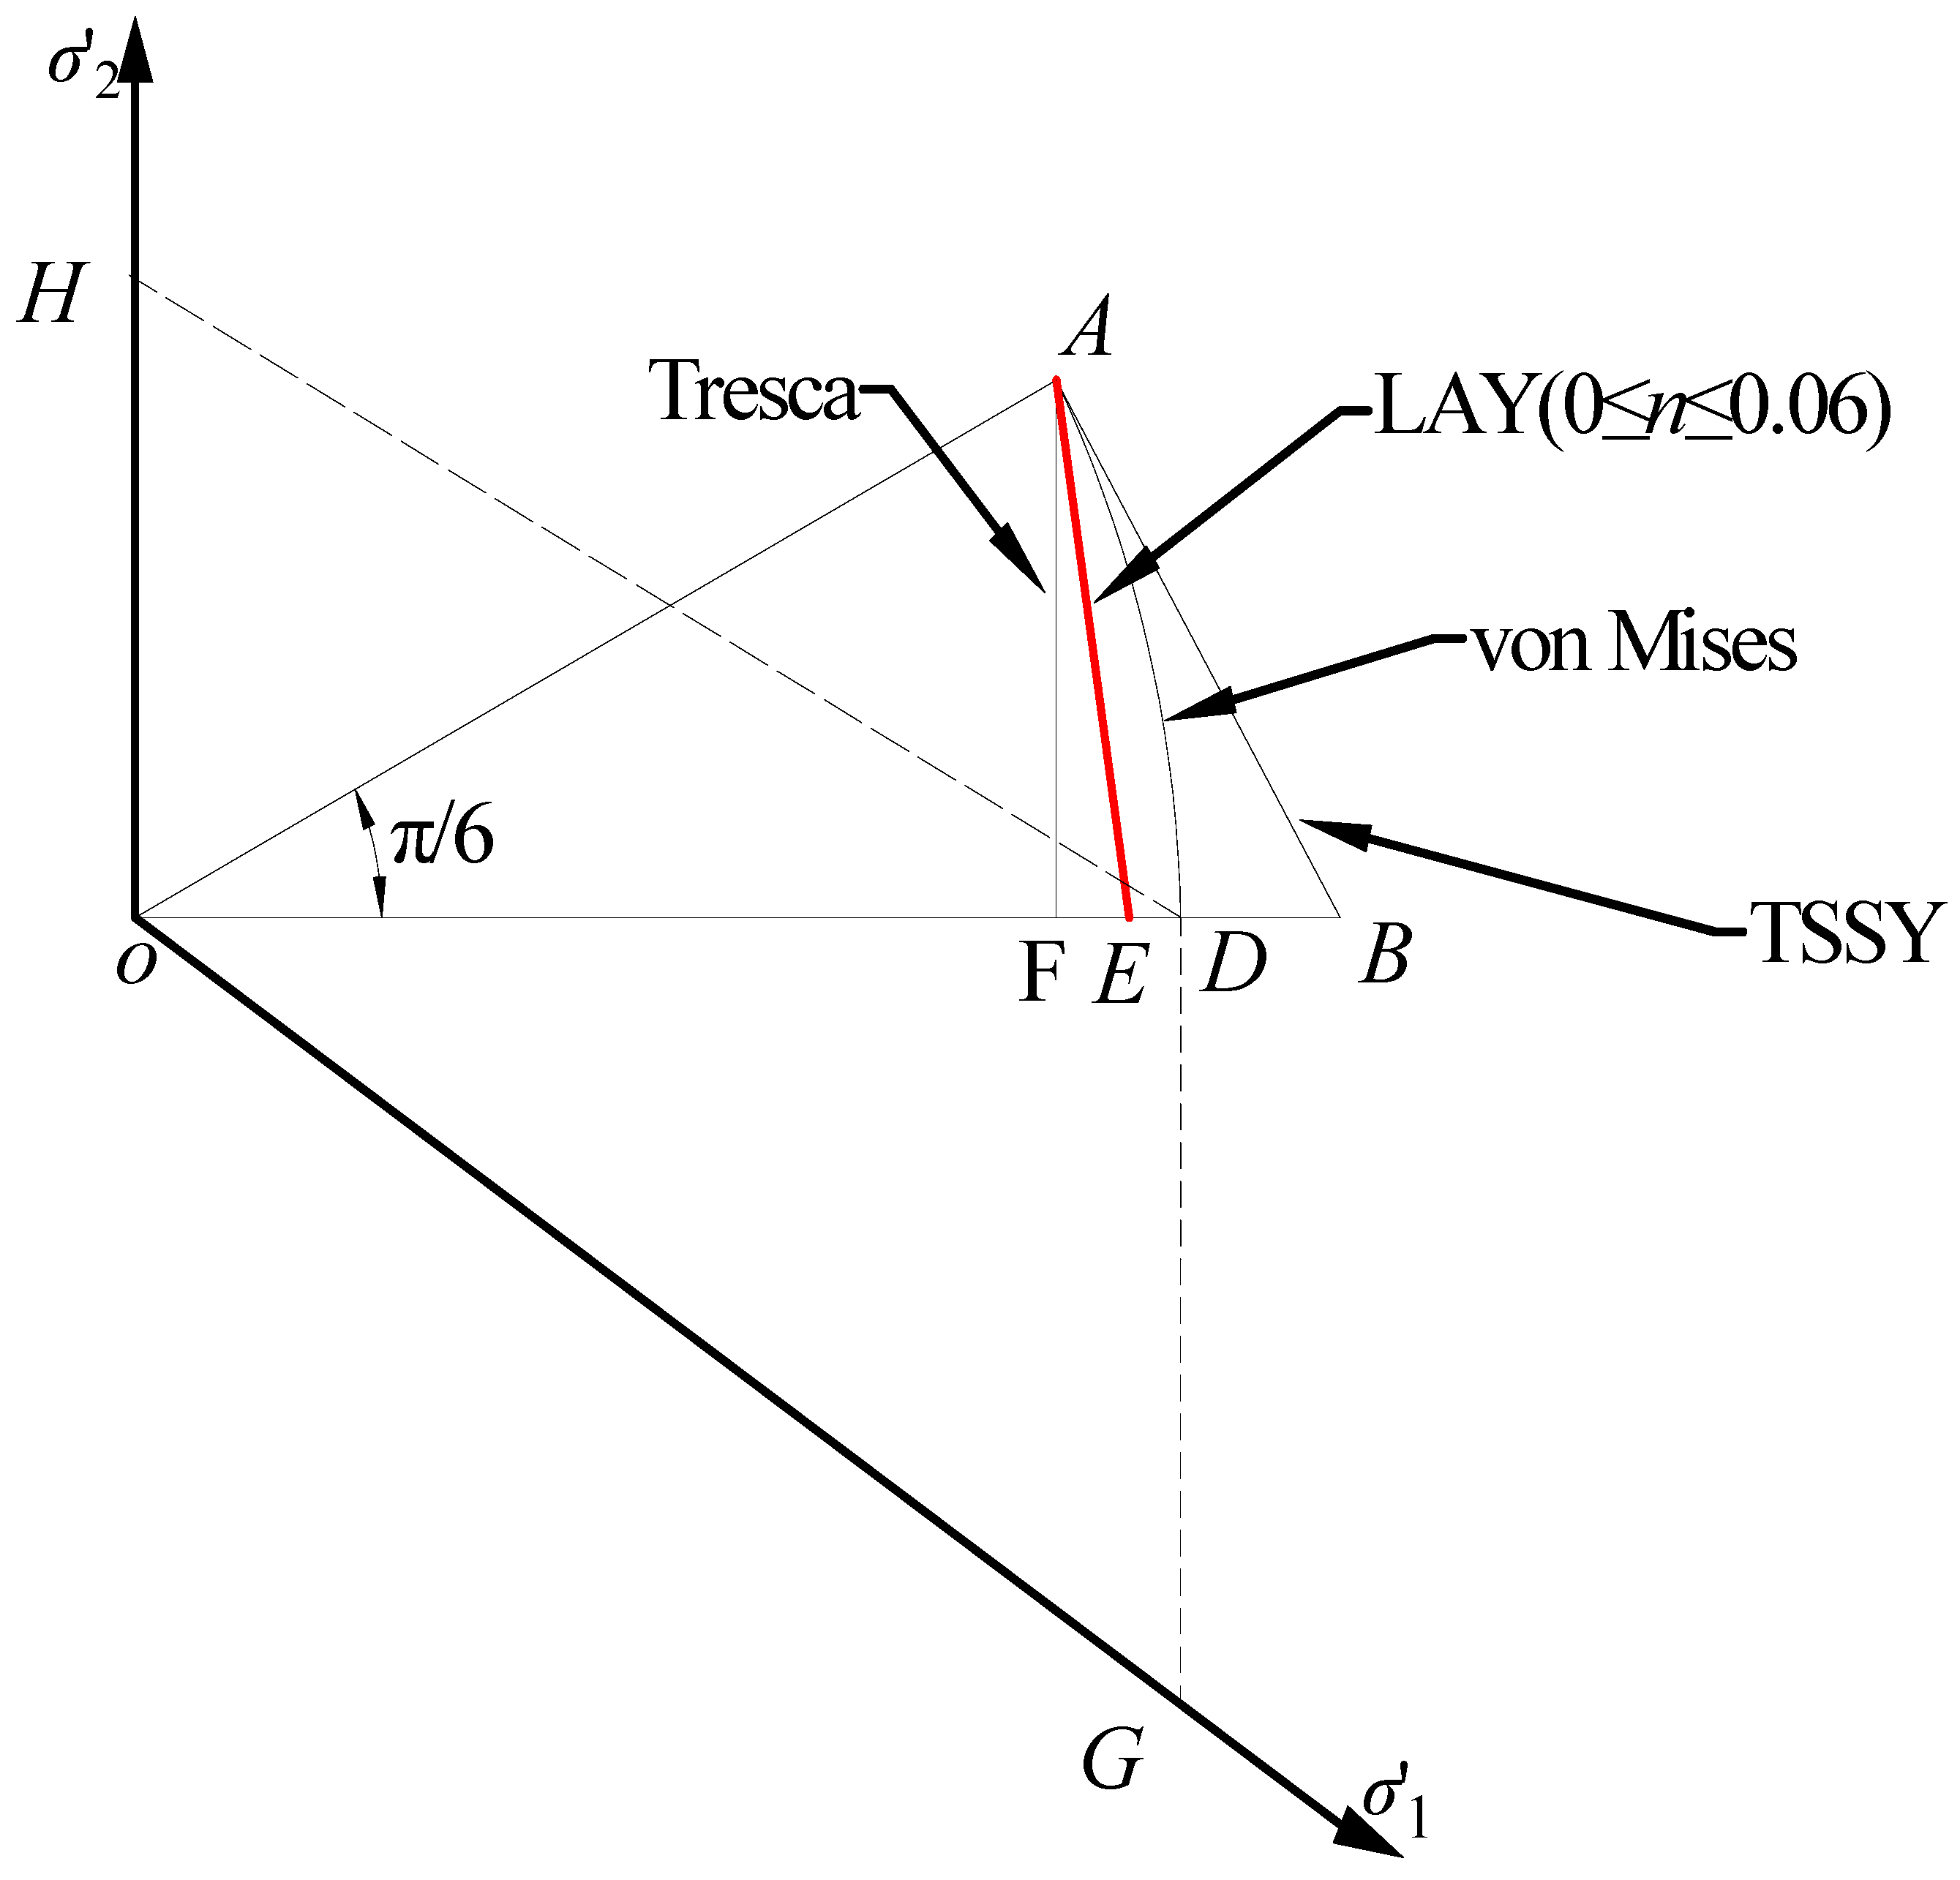
The point on the yielding cylindrical surface of the principal stress space is the endpoint of the composite vector with σ1, σ2, σ3 as the component. The projection of the spherical stress component of the composite vector on the π-plane coincides with the origin at point o in Figure 2. And the endpoint of the deviation stress component of the composite vector is on the yield trajectory. Figure 3 shows the yield trajectory of the LAY criterion in the π/6 range. AD is the von Mises yield surface, and oD = oA = 2 3 σ e , ∠oAB = 90°. AF is the Tresca yield surface, and AF = 1 2 2 3 σ e .
As shown in Figure 3, the components σ1 and σ2 of the composite vector oD corresponding to the stress state at point D is projected onto the π-plane as oG and oH. As ∠HoG = 120°, ∠DoG = 30° = ∠AoB. Meanwhile, oA = oD and ∠oDG = ∠oAB = 90°. Thus ΔoDG ≌ ΔoAB. Therefore:
oG = oB and oH = DG = AB
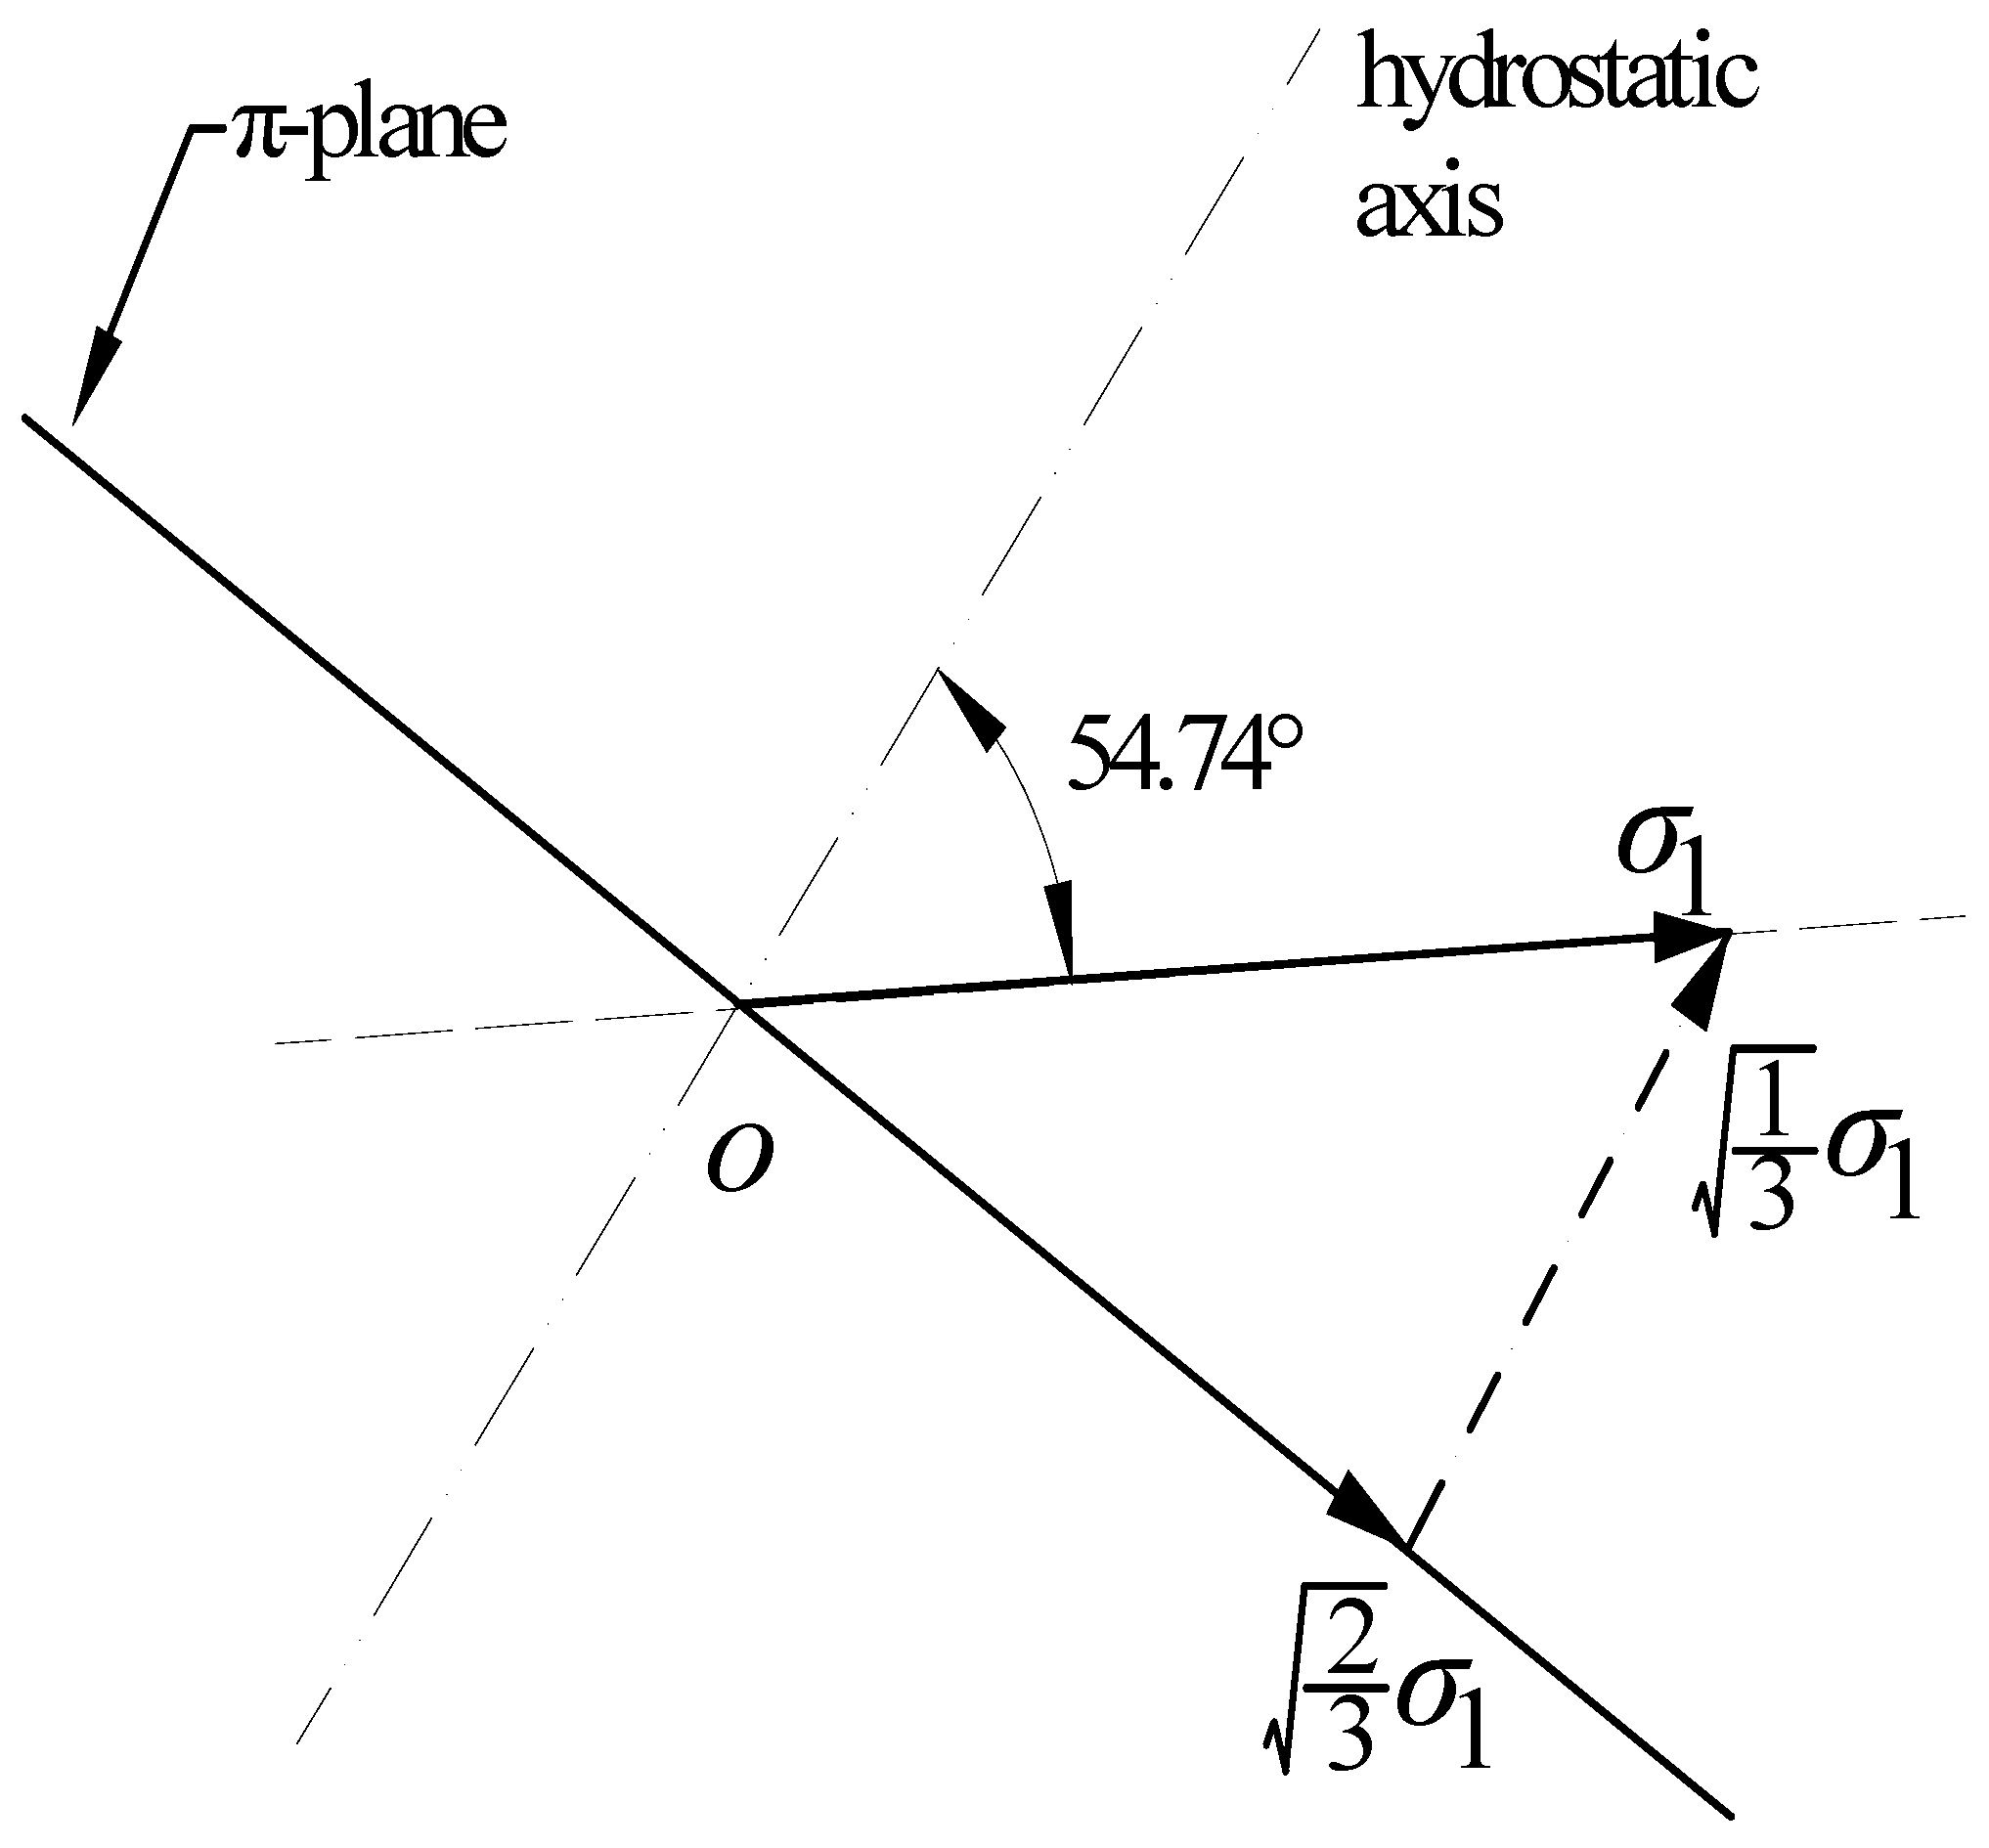
Figure 4 depicts the representation of the principal stress projected onto the π-plane. Based on Figure 3 and Figure 4, the principal stress at position D can be determined with the following calculations:
oG = 2 3 σ 1 = oB = o A cos 30 ° = 1 cos 30 ° 2 3 σ e = 2 2 3 σ e ,   σ 1 = 2 3 σ e
oH = 2 3 σ 1 = GD   =   AB = o B sin 30 ° = 2 2 3 σ e sin 30 ° = 2 3 σ e ,   σ 2 = σ e 3
σ 2 = σ 1 + σ 3 2 , σ 3 = 0
By substituting the stress values of σ1, σ2 and σ3 into the von Mises yield function, f 1 = σ 1 0.268 σ 2 0.732 σ 3 = σ e , indicating that point D is in a yielding state. Taking the LAY (0 ≤ n ≤ 0.06) criterion as an example, the D-point stress is introduced into the LAY yield function, f 2 = σ 1 0.072 σ 2 0.928 σ 3 = 1.113164 σ e . This indicates that the stress condition at point D has yielded, based on the LAY criterion, and the critical yield position E should be on the inner side of point D. The ED distance is determined by the projection size of the disparity between two yield functions, so the exact position of point E is
ED = 2 3 ( f 2 f 1 ) = 0.092387 σ e
Move 0.092387σe inward from point D in Figure 3, and the position of point E is obtained, and connecting AE is the yield trajectory of the 30° LAY criterion.
tan FAE = E F A F = o D o F E D A F = 0.04114823
FAE = tan−1(0.04114823) = 2.36°
oAE = ∠FAE + 60° = 62.36°; ∠oEA = 90° − ∠FAE = 87.64°
AE = A F cos 2.36 ° = 0.408545 σ e
The inscribed dodecagon of the von Mises yield trajectory (circle) has a side length of 0.4226497 and a vertex angle of 150°. Therefore, the yield trajectory of the LAY criterion (0 ≤ n ≤ 0.06) is an equilateral non-equiangular inscribed dodecagon with a side length of 0.408545 σe within the von Mises circle. The top angle of the six circular inner contact points is 62.36° × 2 = 124.72°, and the top angle of the six non-circular internal contact points is 87.64° × 2 = 175.28°.
For the LAY (n > 0.06) criterion, a similar conclusion can be obtained, where the yield trajectory is a regular dodecagon with equal side lengths and unequal angles inscribed inside the von Mises circle, and E D = 0.063137 σ e ; A E = 0.410815 σ e . The top angle of six circular internal contacts is 132.94°, and the top angle of six non-circular internal contacts is 167.06°.

4.3. Derivation of Plastic Work Rate

According to the Levy–Mises flow rule [40], it can be concluded that
f ( σ i j ) = 0 ;   ε i j = d λ f σ i j
where σ i j and ε i j represent the stress and strain components, respectively; f is the yield function; λ is a parameter greater than 0.
Taking the yield criterion of LAY (0 ≤ n ≤ 0.06) as an example, the first formula in Equations (10) and (20) provide the following:
ε 1 : ε 2 : ε 3 = 1 : 0.072 : 0.928 = λ : 0.072 λ : 0.928 λ
For Equation (21), the principal strain component can be taken as follows:
ε 1 = λ ; ε 2 = 0.072 λ ; ε 3 = 0.928 λ
ε max ε min = ε 1 ε 3 = 1.928 λ ,   λ = ε min ε min 1.928 = ε 1 ε 3 1.928
For the point E, σ2 = (σ1 + σ3)/2. According to Equation (22), the plastic work rate is D ( ε i j ) = σ 1 ε 1 + σ 2 ε 2 + σ 3 ε 3 = σ 1 λ 0.072 λ σ 1 + σ 3 2 0.928 λ σ 3 ; thus:
D ( ε i j ) = 0.964 λ ( σ 1 σ 3 )
According to the first formula in Equation (10), angular point E (σ2 = (σ1 + σ3)/2) yields
0.964 ( σ 1 σ 3 ) = σ e
Substitute Equations (25) and (23) into Equation (24):
D ( ε i j ) = 0.964 λ ( σ 1 σ 3 ) = 0.964 ε min ε min 1.928 σ e 0.964 = σ e ε min ε min 1.928
Similarly, as n > 0.06, the plastic work rate per unit volume is
D ( ε i j ) = σ e ε min ε min 1.866
According to Equations (26) and (27), the expression of the LAY criterion and the plastic work rate are both linear. This characteristic can provide analytical solutions for the nonlinear function of the plastic work. Table 1 shows the comparison of the plastic work rate for different yield criteria, and the plastic work rate of different yield criteria is expressed as follows: D ( ε i j ) = σ e ε min ε min k .
According to Table 1, the difference in the plastic work rate between LAY (0 ≤ n ≤ 0.06) and the Tresca yield criteria is Δ = (1/1.928 − 1/2.000)/(1/1.928) = 3.6%; the difference compared to the ASSY yield criterion is Δ = (1/1.928 − 1/1.856)/(1/1.928) = −3.8%; the difference compared to the von Mises yield criterion is Δ = (1/1.928 − 1/1.732)/(1/1.928) = −11.3%. It can be seen that as 0 ≤ n ≤ 0.06, the LAY yield criterion is in an intermediate state between the Tresca and the ASSY yield criteria. This criterion compensates for the shortcomings of the lower projected results of the Tresca yield criterion and the higher projected results of the ASSY yield criterion.
In terms of plastic work rate, the difference between the LAY (n > 0.06) and the Tresca yield criterion is Δ = (1/1.866 − 1/2.000)/(1/1.866) = 6.7%; the difference compared to the ASSY yield criterion is Δ = (1/1.866 − 1/1.856)/(1/1.866) = −0.5%; the difference compared to the von Mises yield criterion is Δ = (1/1.866 − 1/1.732)/(1/1.866) = −7.7%. It can be seen that as n > 0.06, the LAY criterion is in the halfway state between the Tresca and von Mises yield criteria, which is close to the ASSY yield criterion. This criterion compensates for the shortcomings of the Tresca criterion, predicting lower values, and the von Mises criterion, predicting higher values.

5. Analysis of Failure Pressure Error for the LAY Criterion

5.1. Failure Pressure Evaluation Method Based on LAY Criterion

The three-dimensional principal stresses σ 1 , σ 2 , and σ 3 of the pipeline are
σ 1 = σ θ = P ( D 2 t ) 2 t , σ 2 = σ z = P ( D 2 t ) 4 t , σ 3 = σ r = P 0
where D’ and t’ are the actual diameter and thickness, respectively; σ θ , σ z , and σ r represent the circumferential, axial, and radial stresses of the pipeline with internal pressure, respectively.
Therefore, the equivalent stress of the LAY criterion is defined as
σ e = 0.964 σ 1 0 n 0.06 0.933 σ 1 0.06 < n
The expression for the first principal strain ε 1 is as follows [8,16]:
ε 1 = 1 2 ln ( D 2 t D 2 t t t )
The effective strain ε e is expressed as [4,8]
ε e = σ 1 ε 1 σ e = σ 1 2 σ e ln ( D 2 t D 2 t t t )
The following is an expression for the true stress σ and strain ε of the steel materials:
σ = K ε n
where K is the strength coefficient.
According to Equations (28), (29), (31) and (32), the internal pressure is expressed as
P = σ 1 2 σ e 4 t D 2 t e 2 σ e ε e / σ 1 K ε e n
The strength coefficient K is expressed as follows [8,16]:
K = σ u e n n
As ε e = σ 1 2 σ e n , the internal pressure reaches its extreme value, which is the failure pressure. Therefore, the failure pressure with the LAY criterion is
P 0 = 0.519 n + 1 4 t D - 2 t σ u 0 n 0.06 0.536 n + 1 4 t D - 2 t σ u   0.06 n

5.2. Error Analysis of Failure Pressure Assessment

Comparative analysis was conducted using the Tresca, ASSY, and von Mises yield criteria. The comparison outcomes are shown in Table 2. As shown in Table 2, the maximum and average errors of the existing evaluation methods, in descending order, occur for the ASSY, Tresca, and von Mises criteria. The LAY criterion is superior to the current, most accurate ASSY criterion in terms of maximum error, minimum error, and average error. It is inferred that the prediction accuracy is increased on the basis of stability, which is not lower than that of the ASSY yield criterion. It should be noted that the smaller the error, the more difficult it is to decline the error. Although the relative value of the average error only increased by 0.28% (4.03–3.75%), the improvement reached 7.47% on the basis of the existing minimum error of 4.03%, verifying the applicability of the LAY criterion.
In order to further demonstrate the applicability of the ASSY and LAY criteria, a comparative analysis was conducted on the predicted error with different strain-hardening exponents. The results are listed in Table 3. According to Table 3, for pipelines with n > 0.06, the evaluation methods of the two yield criteria are almost identical, with a difference of only 0.08%. The accuracy of the LAY criterion is slightly higher than that of the ASSY criterion. However, for pipelines with 0 ≤ n ≤ 0.06, the accuracy of the LAY criterion has increased by 1.52% compared to that of the ASSY criterion, with an increase of 55.97%. It is evident that the main superiority of the LAY criterion-based assessment method lies in the high accuracy of failure pressure evaluation for low strain-hardening (pipelines with high-strength grade), which can control the average error of failure pressure within 3%.

5.3. Conservativeness Analysis of Yield Criteria Under Safety Factors

The conservativeness of the linear average yield (LAY) criterion in comparison to that of other yield criteria (Tresca, ASSY, and von Mises) with various safety factors is examined. Table 4 presents the ratio γ = predicted value/real value for each criterion at safety factors 1.1, 1.15, and 1.2. This γ ratio indicates whether a prediction is conservative (γ < 1) or under-conservative (γ > 1). The table provides the average γ for each criterion at each safety factor, along with the minimum and maximum values observed.
At a safety factor of 1.1, clear differences in conservativeness are observed among the criteria. Tresca has the lowest average γ (~0.85), indicating that it is the most conservative—on average, Tresca predictions are about 15% lower than the real value (providing a large safety margin). ASSY is slightly less conservative than Tresca, with an average γ of ~0.92, which is still safely below 1.0. The LAY criterion yields an average γ of about 0.99 at SF = 1.1, which is very close to unity. This suggests that LAY’s predictions nearly match the real values, on average, providing only a minimal safety margin at 1.1. In contrast, the von Mises criterion produces an average γ of ~1.08 at SF = 1.1, meaning it overestimates the actual strength by about 8% on average (an under-conservative prediction). In fact, the von Mises criterion shows some cases with γ up to 1.15 at SF = 1.1—a significant under-conservative outlier indicating that the predicted value exceeded the real strength by 15%. Meanwhile, LAY’s maximum γ at 1.1 is around 1.03, much lower than von Mises’s worst case result. This implies that LAY avoids large unsafe deviations and stays closer to the safe side of γ = 1.0. On the conservative end, Tresca’s γ ranges down to ~0.80 at SF = 1.1 (20% under actual), whereas LAY’s minimum γ is ~0.95 (only 5% under actual). Therefore, at the 1.1 safety factor, LAY provides predictions that are significantly less conservative than Tresca or ASSY (maximizing efficiency), yet it remains far more conservative (safer) than the von Mises criteria in the worst cases.
Increasing the safety factor to 1.15 uniformly reduces the γ values for all criteria, making the predictions more conservative overall. At SF = 1.15, the von Mises’s average γ drops to about 1.00—essentially, right on the border between under-conservative and conservative. LAY’s average γ at 1.15 is about 0.94, now providing a modest safety margin (6% under real value, on average). Tresca and ASSY become even more conservative (average γ ≈ 0.80 and 0.87, respectively), indicating larger safety margins but also greater deviation from actual strengths. Notably, at SF = 1.15, the maximum γ for the von Mises criterion (~1.07) is still slightly above 1, meaning that the von Mises method can still be under-conservative, in some cases, even with this higher safety factor. In contrast, LAY’s maximum γ at 1.15 is ~0.98, which is now below 1—indicating that all LAY predictions have become conservative at the 1.15 factor. In other words, with SF = 1.15, the LAY criterion manages to avoid any under-conservative prediction (>1), whereas von Mises criterion still has a small risk of unconservative outcomes. The range of γ for LAY at 1.15 (approximately 0.90 to 0.98) is narrow and entirely on the safe side, showing LAY’s consistency. For the von Mises criterion, the range (0.93 to 1.07) has shifted downward compared to that for SF = 1.1, but it still includes values above 1. The Tresca model remains very conservative, with γ ranging roughly 0.75–0.85 at SF = 1.15, and for the ASSY model, it is around 0.83–0.91, both far below 1.
At a safety factor of 1.2, all criteria yield conservative predictions (γ < 1 across the board). The von Mises criterion’s average γ is about 0.93 at SF = 1.2, now comfortably below 1.0. Its maximum γ is ~1.00 (approximately equal to the real value, in the worst case), which suggests that a safety factor of 1.2 is sufficient to bring even the least conservative criterion to the verge of safe design. The LAY at SF = 1.2 displays an average γ of ~0.90, indicating a moderate conservativeness; all LAY predictions are conservative, with γ ranging from ~0.86 to 0.94. Tresca and ASSY remain the most conservative criteria at SF = 1.2, with an average γ around 0.75 and 0.83, respectively, and their predictions are significantly under the actual values (up to 25% lower for Tresca). With SF = 1.2, the differences between criteria narrow in terms of safety—even the highest γ (von Mises ~1.00) just meets the actual value—but the more conservative criteria (Tresca, ASSY, and to a lesser, extent LAY) now exhibit substantial safety reserves beyond what is required.
Considering the results in Table 4, the LAY criterion appears to provide an appropriate balance between safety and efficiency. LAY’s γ values are closer to 1.0 than those of Tresca and ASSY, indicating less over-conservatism and more efficient use of material strength. For instance, with SF = 1.1, LAY’s average γ (~0.99) is much nearer to unity than Tresca’s 0.85, meaning that LAY allows for a higher utilization of the actual strength, while still remaining essentially safe. Across all safety factors examined, LAY’s predictions remain either slightly conservative or nearly accurate, and importantly, LAY avoids the pronounced under-conservatism observed with the von Mises criterion at lower safety factors. With SF = 1.15 and above, LAY ensures that all predictions are safe (γ ≤ 1), with only a modest conservative margin, whereas by that point, Tresca and ASSY carry a larger margin (lower γ) than necessary. In summary, the LAY criterion achieves a middle ground: it significantly reduces the overly conservative bias of Tresca/ASSY, yet it maintains a safety margin that prevents the unconservative outcomes associated with the von Mises criteria. This balance suggests that LAY can improve design efficiency (by not underestimating capacity as severely as do traditional conservative criteria) while still upholding the required safety levels (by not overestimating capacity like the less conservative criterion might). Therefore, LAY provides an appropriate and desirable balance between safety and efficiency in structural design under the given safety factors.

5.4. Example of Predesign Assessments for Burst Pressure

To illustrate the conservativeness and practical application of the proposed LAY criterion, a pipeline with an outer diameter D = 508 mm, thickness t = 6.35 mm, yield strength σy = 540 MPa, ultimate strength σu = 610.34 MPa, and hardening exponent n = 0.071 was adopted. The environment exhibits medium risk (e.g., safety class resistance factor γ = 1.10). The burst pressure predictions of different yield criteria are shown in Table 5. The design burst pressure  p design for each criterion can be calculated by considering the safety factor γ = 1.10:
p design = P 0 γ
The Tresca (ASME B31.8) criterion remains the most conservative, with the lowest design burst pressure (13.13 MPa). The von Mises predictions are significantly higher (17.19 MPa), reflecting less conservative design assumptions. The LAY prediction (15.59 MPa burst, 14.17 MPa design) lies between these two extremes, and is very close to the ASSY prediction (14.24 MPa design). Notably, the LAY’s predicted burst pressure is closer to the actual pipeline strength (as verified in the literature), while maintaining a 10% safety margin when γ = 1.10.
In practical engineering, the LAY criterion’s design burst pressure (14.17 MPa) is about 8% higher than that of the Tresca criterion, reducing over-conservatism while still maintaining the safety margins required for medium-risk environments. Compared to von Mises (which can be borderline non-conservative, if not carefully calibrated), LAY’s prediction ensures that all calculated results remain on the safe side (design burst pressure always < actual capacity), avoiding the risk of unconservative over-predictions. The LAY criterion achieves a desirable balance: it avoids the excessive conservativeness of the Tresca criterion while reducing the unconservative risk of the von Mises method, providing an efficient and safe design for medium-risk pipelines.

6. Conclusions

The linear average yield (LAY) criterion was proposed for the first time, based on the distribution characteristics of pipeline burst experimental data, and the applicability of different yield criteria was verified. The LAY criterion is particularly applicable to corroded pipelines subjected to the combined action of internal pressure and axial force. It provides a practical and accurate tool for predicting failure pressure under such multiaxial stress states, effectively balancing conservative and aggressive predictions and improving engineering reliability. Thus, it is possible to conclude the following:
(1) The Tresca criterion predicts the minimum result of failure pressure, while the ASSY yield criterion predicts the maximum result as 0 ≤ n < 0.06. The Tresca yield criterion is the lower bound, and the von Mises criterion is the superior bound for 0.06 ≤ n < 0.19.
(2) The linear average yield criterion was proposed, based on the upper and lower limits of the corresponding yield criteria for pipeline burst failure with different strain-hardening exponents. The criterion has a piecewise linear function as its mathematical formulation. Within the von Mises circle, the yield route is an equilateral non-equiangular inscribed dodecagon.
(3) The most suitable yield criterion for evaluating the failure pressure is the LAY criterion, followed by the ASSY criterion. The LAY yield criterion can control the evaluation error of pipelines with low strain-hardening or high-strength grade within 3%.

Author Contributions

Conceptualization, M.-M.S. and J.Z.; methodology, J.Z.; software, M.-M.S.; validation, J.-H.J.; formal analysis, J.Z.; investigation, J.-H.J.; resources, J.-H.J.; data curation, J.Z.; writing—original draft preparation, J.Z.; writing—review and editing, M.-M.S. and J.Z.; visualization, M.-M.S.; supervision, J.Z.; project administration, J.-H.J.; funding acquisition, M.-M.S. All authors have read and agreed to the published version of the manuscript.

Funding

This research was funded by J.Z., the Key Scientific Research Projects (23A560013); M.-M.S., the Youth Science Foundation (232300421328), the Central Plains Talent Program (234200510014), and the National Key R&D Program (No. 2022YFC3801000).

Institutional Review Board Statement

Not applicable.

Informed Consent Statement

Not applicable.

Data Availability Statement

The data that support the findings of this study are available from the corresponding author upon reasonable request.

Conflicts of Interest

The authors declare no conflict of interest.

References

  1. Ma, B.; Shuai, J. Influence of Plastic Deformation Capacity On Failure Behavior of Pipelines. J. Fail. Anal. Prev. 2018, 18, 508–518. [Google Scholar] [CrossRef]
  2. Tresca, H. Memoir On the Flow of Solid Bodies Under Strong Pressure; Comptesrendus de l’Académie des Sciences: Paris, France, 1864; Volume 59, pp. 754–758. [Google Scholar]
  3. Mises, R.V. Mechanik Der Festen Körper Im Plastisch-Deformablen Zustand. Nachrichten Von Der Ges. Der Wiss. Zu Gött. Math.-Phys. Kl. 1913, 4, 582–592. [Google Scholar]
  4. Hill, R. The Mathematical Theory of Plasticity; Oxford University Press: New York, NY, USA, 1950. [Google Scholar]
  5. Yu, M. Twin Shear Stress Yield Criterion. Int J. Mech. Sci. 1983, 25, 71–74. [Google Scholar] [CrossRef]
  6. Yu, M. Advances in Strength Theories for Materials Under Complex Stress State in the 20Th Century. Appl. Mech. Rev. 2002, 55, 169–218. [Google Scholar] [CrossRef]
  7. Zhao, D.; Liu, X.; Wang, G. Yield Criterion Based on the Mean Function of Tresca and Twin Shear Stress Yield Functions. J. Northeast. Univ. (Nat. Sci.) 2002, 23, 979–982. [Google Scholar]
  8. Zhu, X.; Leis, B.N. Average Shear Stress Yield Criterion and its Application to Plastic Collapse Analysis of Pipelines. Int. J. Pres. Ves. Pip. 2006, 83, 663–671. [Google Scholar] [CrossRef]
  9. Xing-yu, P.; Peng, Z.; Ying, W. Study on the Residual Strength Reliability of Corroded Oil Pipeline Based on Double Shear Yield Condition. China Saf. Sci. J. Nal. 2008, 18, 149–152. [Google Scholar]
  10. Zhu, X.; Leis, B.N. Evaluation of Burst Pressure Prediction Models for Line Pipes. Int. J. Pres. Ves. Pip. 2012, 89, 85–97. [Google Scholar] [CrossRef]
  11. Zhang, S.; Wang, Q.; Zhou, W. Implementation of the Tresca Yield Criterion in Finite Element Analysis of Burst Capacity of Pipelines. Int. J. Pres. Ves. Pip. 2019, 172, 180–187. [Google Scholar] [CrossRef]
  12. Chmelko, V.; Berta, I. Analytical Solution of the Pipe Burst Pressure Using Bilinear Stress-Strain Model and Influence of Corrosion Defects On It. Procedia Struct. Integr. 2019, 18, 600–607. [Google Scholar] [CrossRef]
  13. Chen, Z.; Chu, W.; Wang, H.; Li, Y.; Wang, W.; Meng, W.; Li, Y. Structural Integrity Assessment of Hydrogen-Mixed Natural Gas Pipelines Based On a New Multi-Parameter Failure Criterion. Ocean. Eng. 2022, 247, 110731. [Google Scholar] [CrossRef]
  14. Tang, Z.J.; Zhang, S.H.; Li, Y.; Li, Y.X. A Mathematical Extrapolation-Based Yield Criterion and its Application in Modeling of Burst Pressure of Defect-Free Straight Pipes. Ocean. Eng. 2022, 263, 112408. [Google Scholar] [CrossRef]
  15. Zhang, S.H.; Liu, J.R. A Generalized Weighted Yield Criterion: Theoretical Derivation and its Application in the Plastic Failure Analysis of Pipeline with Corroded Defects. Int. J. Pres. Ves. Pip. 2022, 200, 104832. [Google Scholar] [CrossRef]
  16. Sun, M.; Chen, Y.; Zhao, H.; Li, X. Analysis of the Impact Factor of Burst Capacity Models for Defect-Free Pipelines. Int. J. Pres. Ves. Pip. 2022, 200, 104805. [Google Scholar] [CrossRef]
  17. Zhu, X.; Wiersma, B.; Johnson, W.R.; Sindelar, R.L. Burst Pressure Solutions of Thin and Thick-Walled Cylindrical Vessels. J. Press. Vessel. Technol. 2023, 145, 041303. [Google Scholar] [CrossRef]
  18. Jin, C.; Wang, L.; Zhang, Y. Strength Differential Effect and Influence of Strength Criterion On Burst Pressure of Thin-Walled Pipelines. Appl. Math. Mech. 2012, 33, 1361–1370. [Google Scholar] [CrossRef]
  19. Sun, M.; Li, X.; Liu, J. Determination of Folias Factor for Failure Pressure of Corroded Pipeline. J. Press. Vess-T. Asme. 2020, 142, 31802. [Google Scholar] [CrossRef]
  20. Wang, L.; Zhang, Y. Plastic Collapse Analysis of Thin-Walled Pipes Based On Unified Yield Criterion. Int. J. Mech. Sci. 2011, 53, 348–354. [Google Scholar] [CrossRef]
  21. Mok, D.; Pick, R.J.; Glover, A.G.; Hoff, R. Bursting of Line Pipe with Long External Corrosion. Int. J. Pres. Ves. Pip. 1991, 46, 195–216. [Google Scholar] [CrossRef]
  22. Liessem, A.; Graef, M.K.; Knauf, G.; Marewski, U. Influence of Thermal Treatment on Mechanical Properties of UOE Linepipe. In Proceedings of the 4th International Conference of Pipeline Technology, Ostend, Belgium, 9–13 May 2004; pp. 1263–1281. [Google Scholar]
  23. Hillenbrand, H.; Liessem, A.; Knauf, G.; Niederhoff, K.; Bauer, J. Development of Large-Diameter Pipe in Grade X100. In Proceedings of the 3rd International Pipeline Technology Conference, Brugge, Belgium, 21–24 May 2000; pp. 469–482. [Google Scholar]
  24. Okaguchi, S.P.; Makino, H.L.; Hamada, M.; Yamamoto, A.; Ikeda, T.; Takeuchi, I.; Fairchild, D.P.; Macia, M.L.; Papka, S.D.; Stevens, J.H. Development and Mechanical Properties of X120 Linepipe. In Proceedings of the The Thirteenth International Offshore and Polar Engineering Conference, Honolulu, HI, USA, 25–30 May 2003; pp. 3–336. [Google Scholar]
  25. Papka, S.D.; Stevens, J.H.; Macia, M.L.; Fairchild, D.P.; Petersen, C.W. Full-Size Testing and Analysis of X120 Linepipe. In Proceedings of the the 13th International Offshore and Polar Engineering Conference, Honolulu, HI, USA, 25–30 May 2003; pp. 50–59. [Google Scholar]
  26. Paslay, P.R.; Cernocky, E.P.; Wink, R. Burst Pressure Prediction of Thin-Walled, Ductile Tubulars Subjected to Axial Load. In Proceedings of the SPE Applied Technology Workshop on Risk Based Design of Well Casing and Tubing, Woodlands, TX, USA, 7–8 May 1998; p. 48327. [Google Scholar]
  27. Benjamin, A.C.; Freire, J.L.F.; Vieira, R.D.; Diniz, J.L.; de Andrade, E.Q. Burst Tests On Pipeline Containing Interacting Corrosion Defects. In Proceedings of the ASME 2005 24th International Conference on Offshore Mechanics and Arctic Engineering, Halkidiki, Greece, 12–17 June 2005; pp. 403–417. [Google Scholar]
  28. Cronin, D.S.; Pick, R.J. Experimental Database for Corroded Pipe: Evaluation of RSTRENG and B31G. In Proceedings of the 3rd International Pipeline Conference, Calgary, AL, Canada, 1–5 October 2000; pp. 757–767. [Google Scholar]
  29. Royer, C.P.; Rolfe, S.T. Effect of Strain-Hardening Exponent and Strain Concentrations on the Bursting Behavior of Pressure Vessels. J. Eng. Mater-T. Asme. 1974, 96, 292–298. [Google Scholar] [CrossRef]
  30. Gaessier, H.; Vogt, G.H. Influence of Yield to Tensile Ratio On the Safety of Pipelines. In Proceedings of the 7th Biennial Joint Technical Meeting on Line Pipe Research, Calgary, AL, Canada, 4 April 1989; pp. 165–172. [Google Scholar]
  31. Maxey, W.A. Y/T Significance in Line Pipe. In Proceedings of the 7th Symposium on Line Pipe Research, Houston, TX, USA, 14–16 October; 1986; pp. 1–18. [Google Scholar]
  32. Amano, K.; Matsuoka, M.; Ishihara, T.; Tanaka, K.; Inoue, T.; Kawaguchi, Y.; Tsukamoto, M. Significance of Yield Ratio Limitation to Plastic Deformation of Pipeline in High Pressure Proof Test. In Proceedings of the 7th Symposium on Line Pipe Research, Houston, TX, USA, 14–16 October 1986; pp. 1–21. [Google Scholar]
  33. Chouchaoui, B. Evaluating the Remaining Strength of Corroded Pipelines; University of Waterloo: Waterloo, ON, Canada, 1995. [Google Scholar]
  34. Stewart, G.; Klever, F.J.; Ritchie, D. An Analytical Model to Predict the Burst Capacity of Pipelines. In Proceedings of the 13th International Offshore Mechanics and Arctic Engineering Conference, Houston, TX, USA, February 27–March 3 1994; pp. 177–188. [Google Scholar]
  35. Law, M.; Bowie, G. Prediction of Failure Strain and Burst Pressure in High Yield-To-Tensile Strength Ratio Pipeline. Int J. Pres. Ves. Pip. 2007, 84, 487–492. [Google Scholar] [CrossRef]
  36. Law, M.; Bowie, G.; Fletcher, L. Burst Pressure and Failure Strain in Pipeline, Part 2: Comparisons of Burst-Pressure and Failure-Strain Formulas. J. Pipeline Integr. 2004, 3, 102–106. [Google Scholar]
  37. Law, M.; Bowie, G.; Fletcher, L.; Piper, L. Burst Pressure and Failure Strain in Linepipe: Part 1:Comparison of Ring-Expansion and Tensile Testing in Gas Linepipe. J. Pipeline Integr. 2004, 3, 95–101. [Google Scholar]
  38. Zhu, X.; Leis, B.N. Strength Criteria and Analytic Predictions of Failure Pressure in Line Pipes. Int. J. Offshore Polar. 2004, 14, 125–131. [Google Scholar]
  39. Zhu, X.; Leis, B.N. Influence of Yield-To-Tensile Strength Ratio On Failure Assessment of Corroded Pipelines. J. Press. Vess-T. Asme. 2005, 127, 436–442. [Google Scholar] [CrossRef]
  40. Zhao, D.; Wang, X.; Liu, X.; Wang, G. A Dodecagon Linear Yield Criterion with Optimal Approximation to Mises Criterion. In Proceedings of the 2nd International Conference on New Development in Rock Mechanics & Rock Engineering, Shenyang, China, 10 October 2002; pp. 554–558. [Google Scholar]
  41. Belrhiti, Y.; Hamelin, C.; Lamagnere, P.; Knowles, D.; Mostafavi, M. A Comprehensive Comparison of Creep-Fatigue Life Assessment through Leading Industrial Codes. Int. J. Pres. Ves. Pip. 2025, 216, 105497. [Google Scholar] [CrossRef]
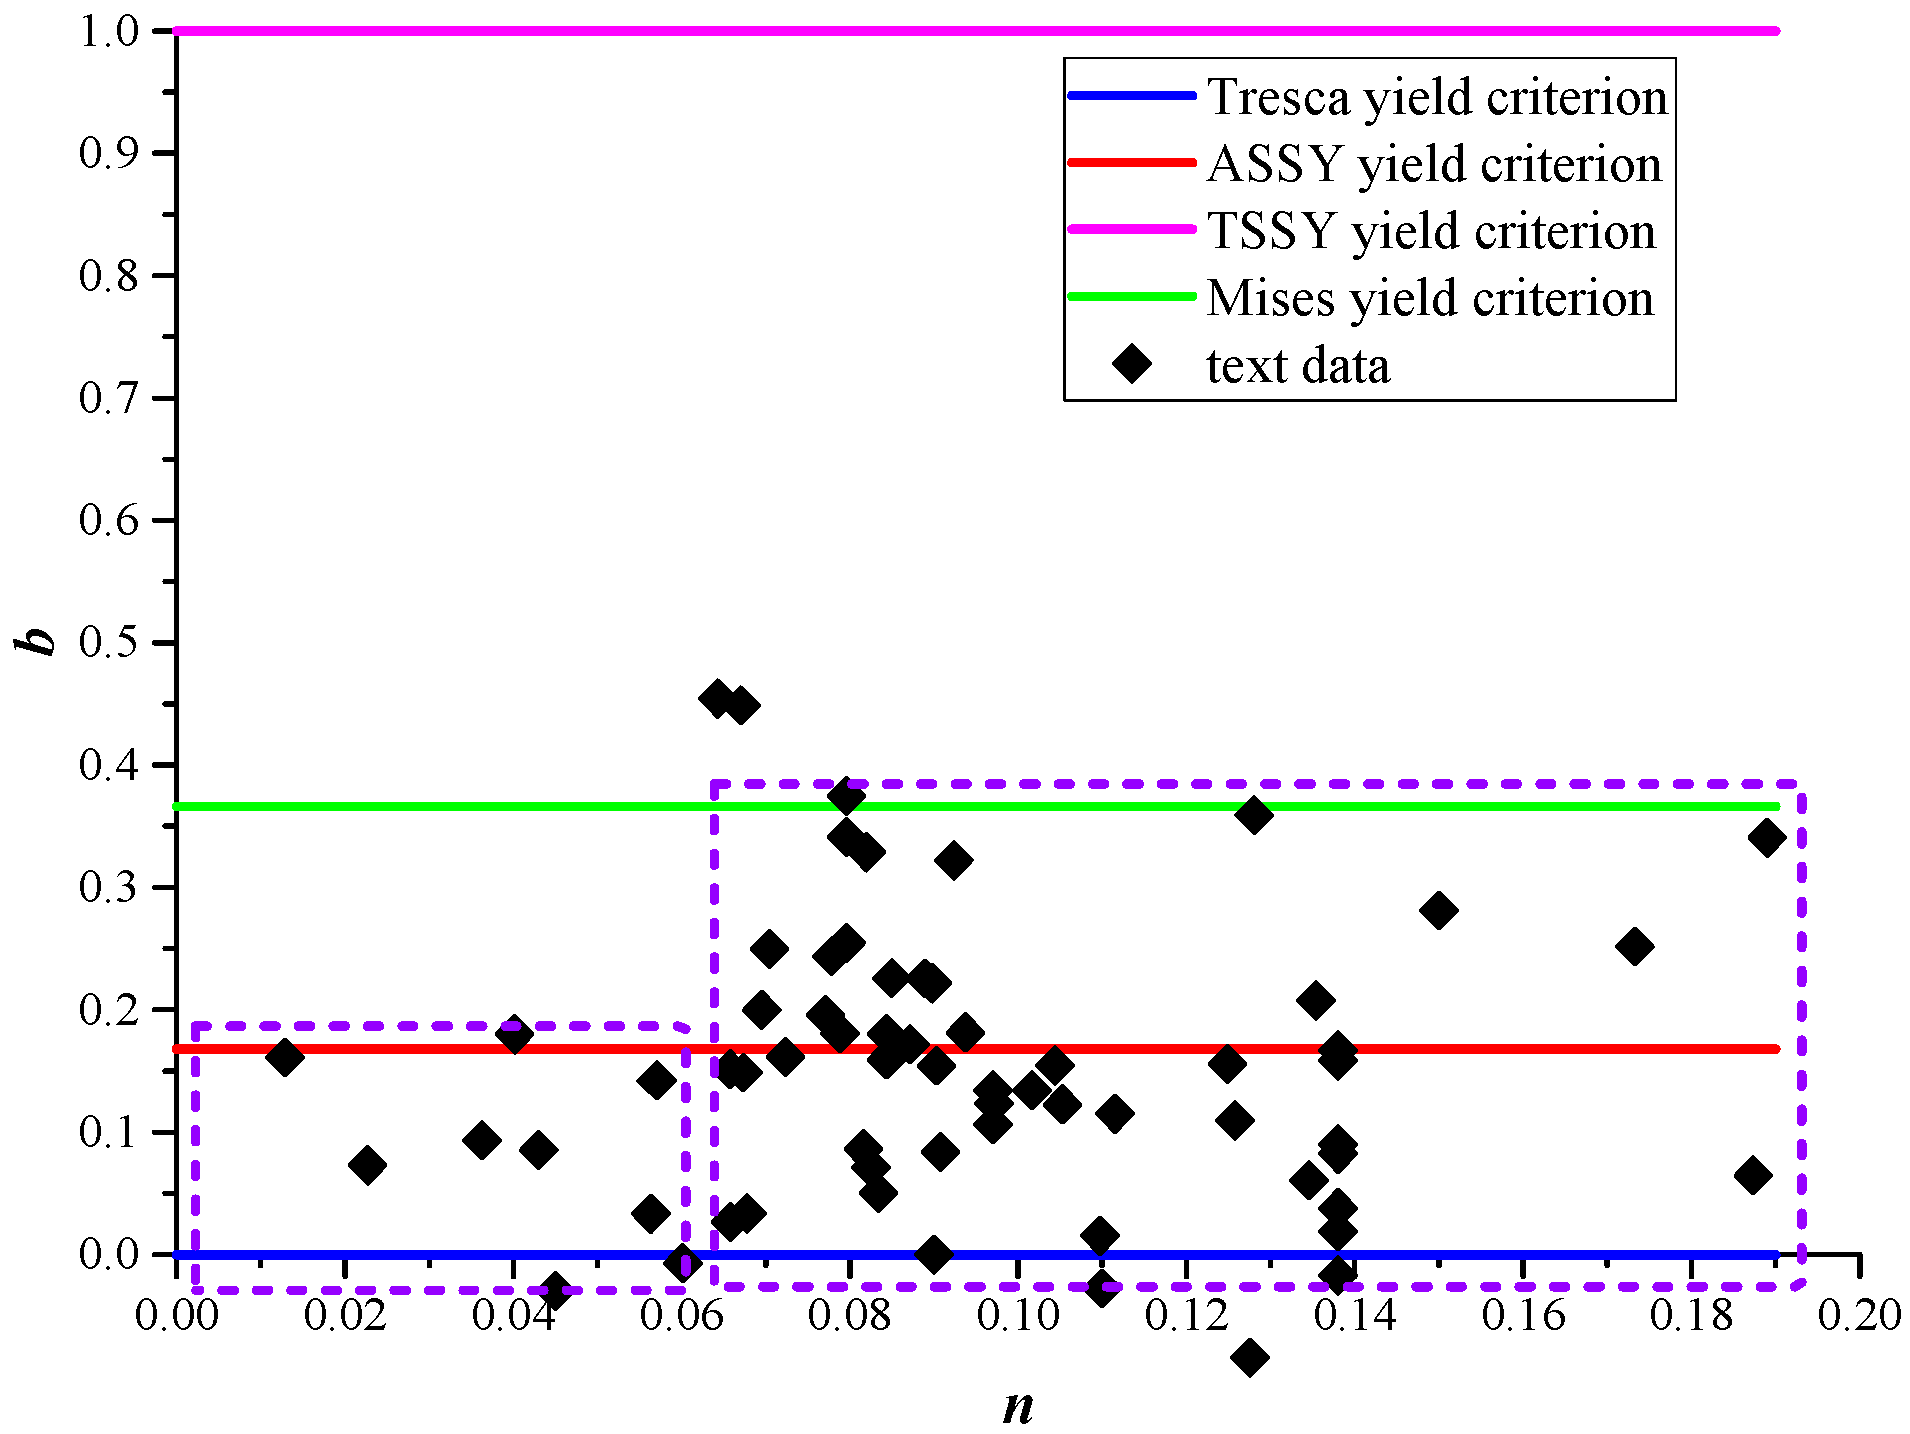
Figure 1. The distribution of yield criteria as a function of strain-hardening exponent n.
Technologies 13 00252 g001
Figure 2. LAY yield criterion.
Technologies 13 00252 g002
Figure 3. The trajectory of the LAY criterion in the π-plane at an angle of π/6.
Technologies 13 00252 g003
Figure 4. Projection of σ1 on to the π-plane.
Technologies 13 00252 g004
Table 1. Comparison of plastic work under different yield criteria.
Yield CriterionTrescaLAY
(0 ≤ n ≤ 0.06)
LAY
(n > 0.06)
ASSYvon
Mises
TSSY
k2.0001.9281.8661.8561.7321.500
Computation model D ( ε i j ) = σ e ε min ε min k
Table 2. Comparison of prediction errors.
Yield Criterion
(Design Code)
Tresca
(ASME B31.8)
ASSYvon Mises
(RCC-MRx, R5)
LAY
maximum16.54%14.43%23.74%13.78%
minimum0.01%0.04%0.24%0.01%
average6.99%4.03%9.39%3.75%
standard deviation0.040.030.050.03
Note: Error(%) = abs ((real value − predicted result)/real value) × 100.
Table 3. Comparison of predicted errors for different properties.
MethodLAYASSY
attribute interval0 ≤ n ≤ 0.060.06 < n0 ≤ n ≤ 0.060.06 < n
maximum5.59%13.78%9.83%14.43%
minimum0.24%0.01%0.27%0.04%
average2.68%3.93%4.20%4.01%
Table 4. Comparison of ratio γ of the predicted result with the real value.
Safety Factor
SF
Yield Criterion
(Design Code)
Tresca
(ASME B31.8)
ASSYvon Mises
(RCC-MRx, R5
[41])
LAY
1.1average91.09%99.29%84.82%92.03%
minimum81.69%88.42%75.87%82.13%
maximum103.44%112.49%95.65%104.03%
1.15average87.13%94.97%81.14%88.03%
minimum78.14%84.58%72.57%78.56%
maximum98.94%107.60%91.49%99.51%
1.2average83.50%91.01%77.76%84.36%
minimum74.89%81.05%69.55%75.29%
maximum94.82%103.12%87.68%95.36%
Note: γ = predicted result/real value.
Table 5. Design burst pressure.
CriterionPredicted Burst Pressure (MPa)Design Burst Pressure (MPa)
Tresca14.4413.13
von Mises18.9117.19
ASSY15.6714.24
LAY15.5914.17
Disclaimer/Publisher’s Note: The statements, opinions and data contained in all publications are solely those of the individual author(s) and contributor(s) and not of MDPI and/or the editor(s). MDPI and/or the editor(s) disclaim responsibility for any injury to people or property resulting from any ideas, methods, instructions or products referred to in the content.