Figure 1.
Typical TWF conditions: (a) Winding tap layout, (b) Axial displacement fault, (c) Inter-turn short circuit, (d) Short-circuit between adjacent winding sections.
Figure 1.
Typical TWF conditions: (a) Winding tap layout, (b) Axial displacement fault, (c) Inter-turn short circuit, (d) Short-circuit between adjacent winding sections.
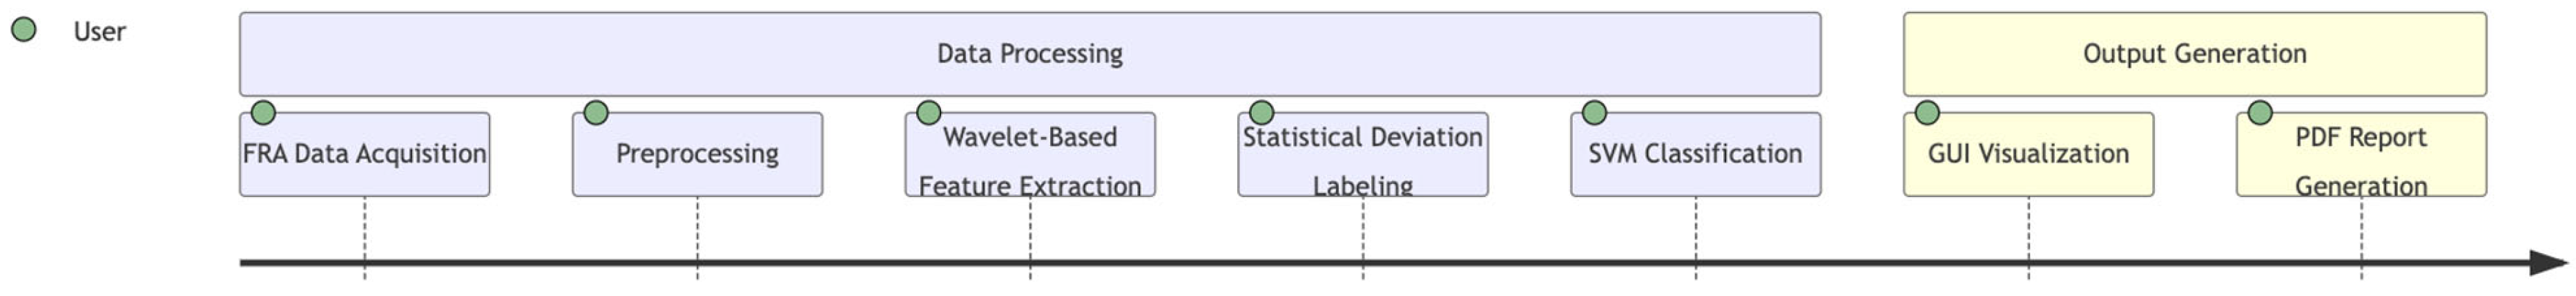
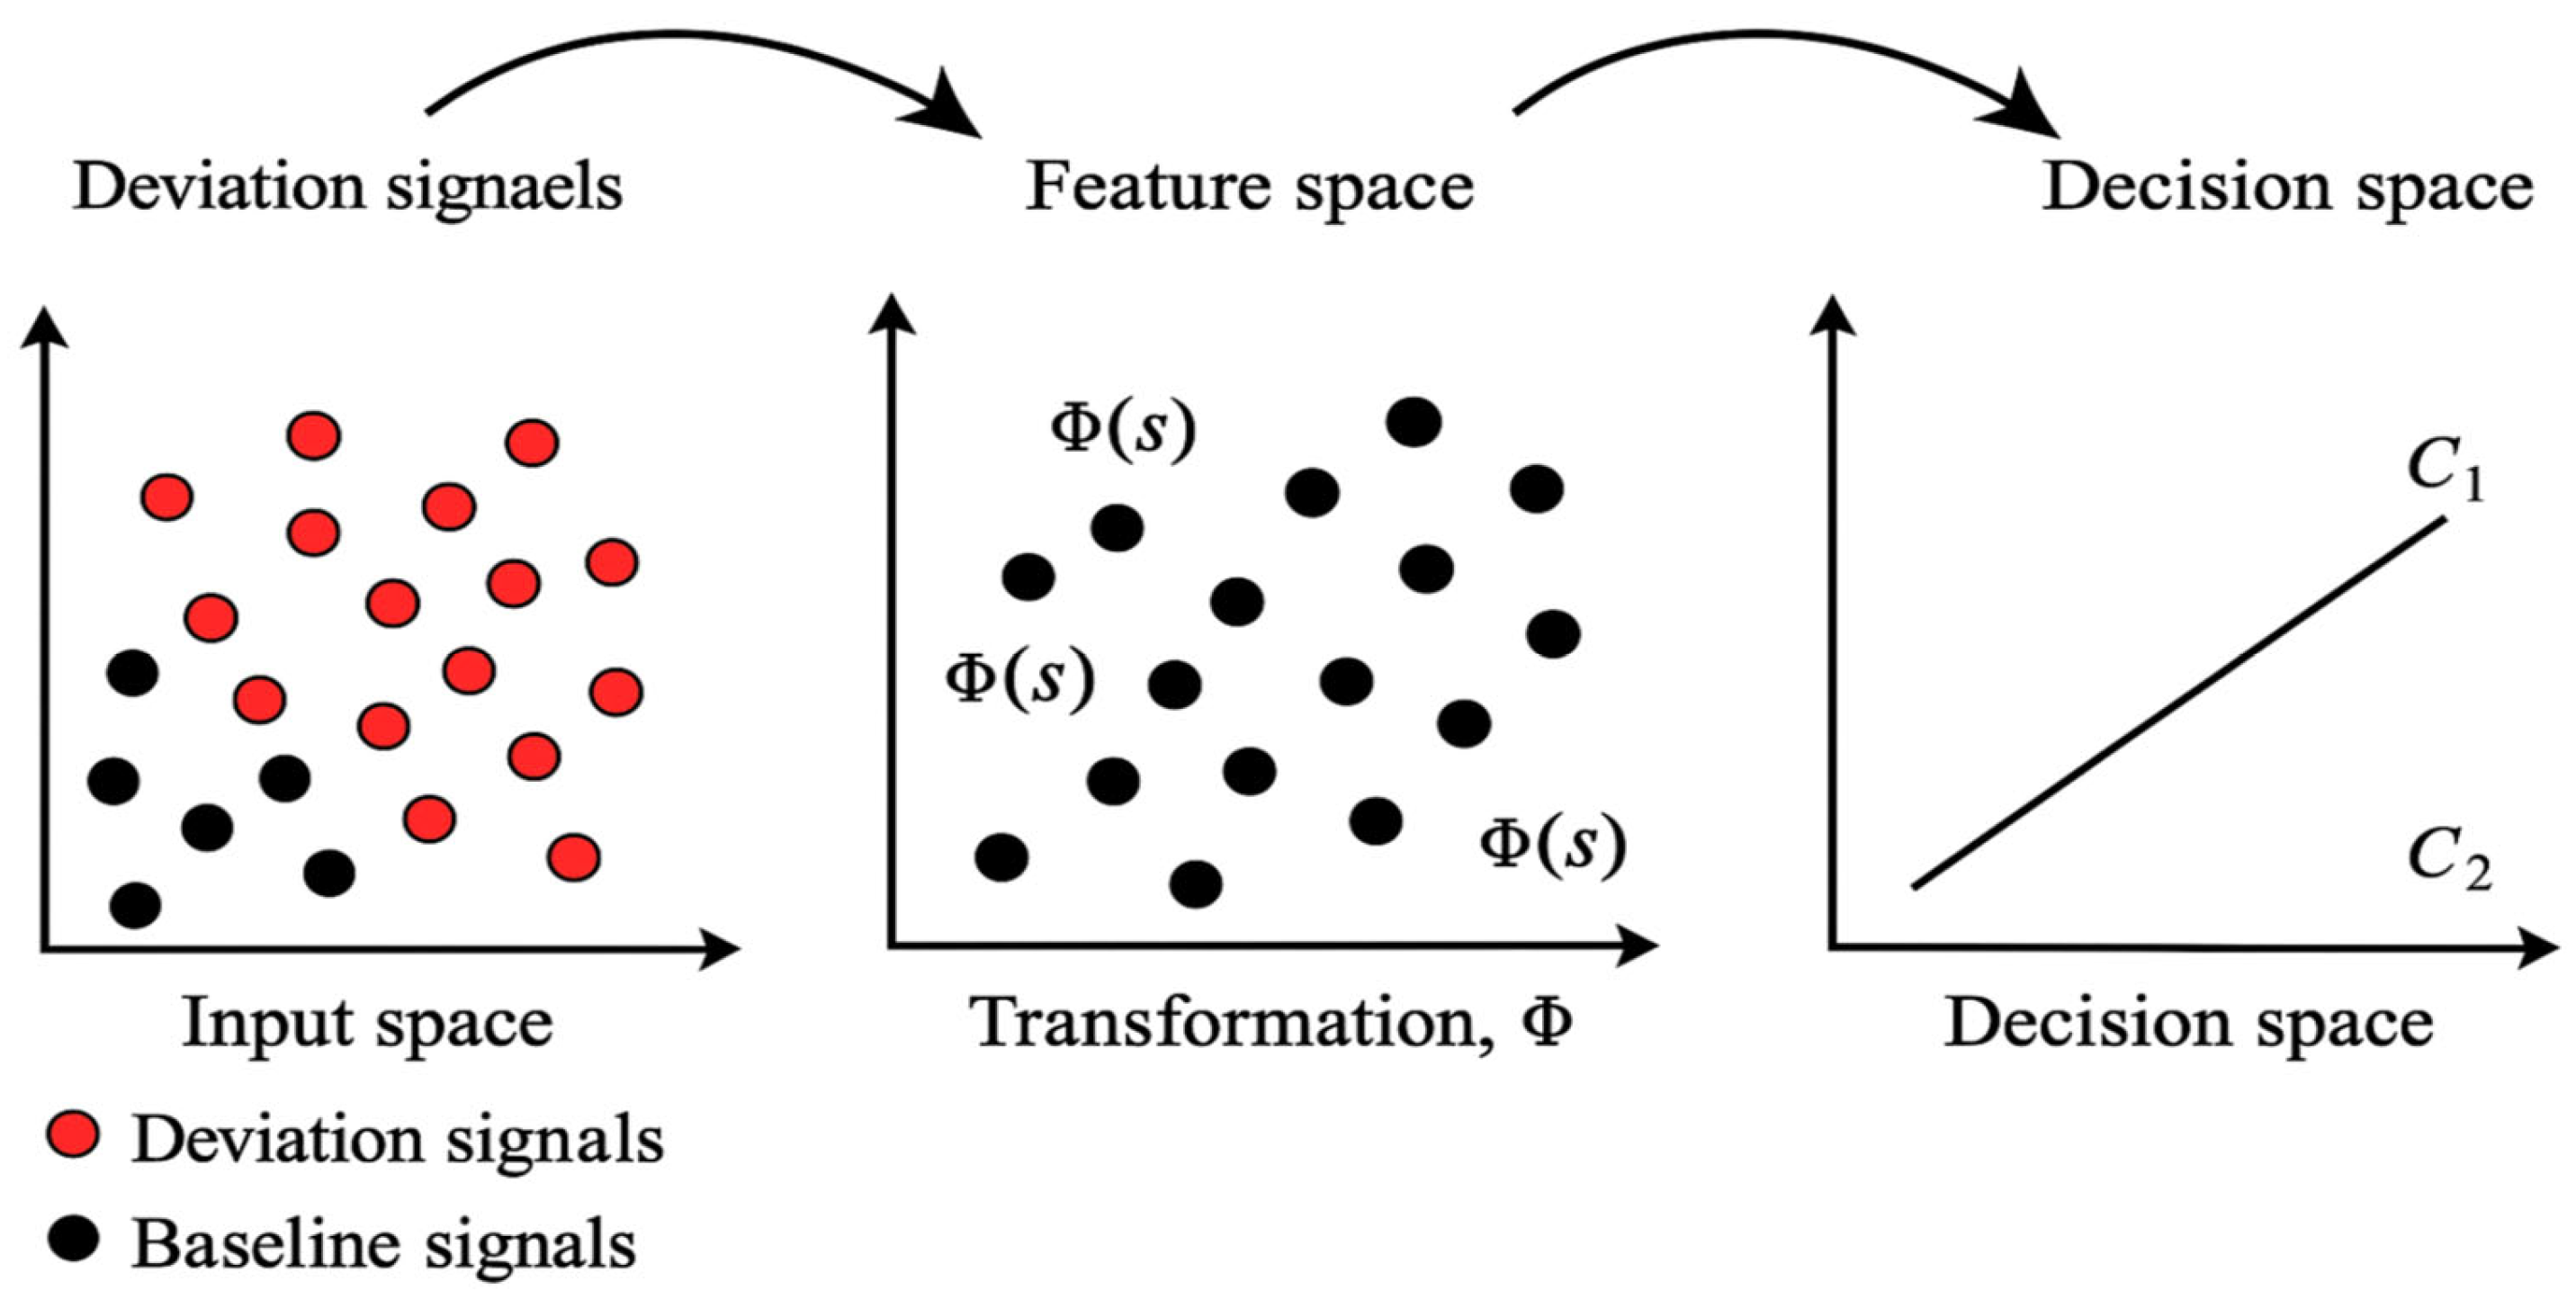
Figure 2.
Two main stages of TWF detection.
Figure 2.
Two main stages of TWF detection.
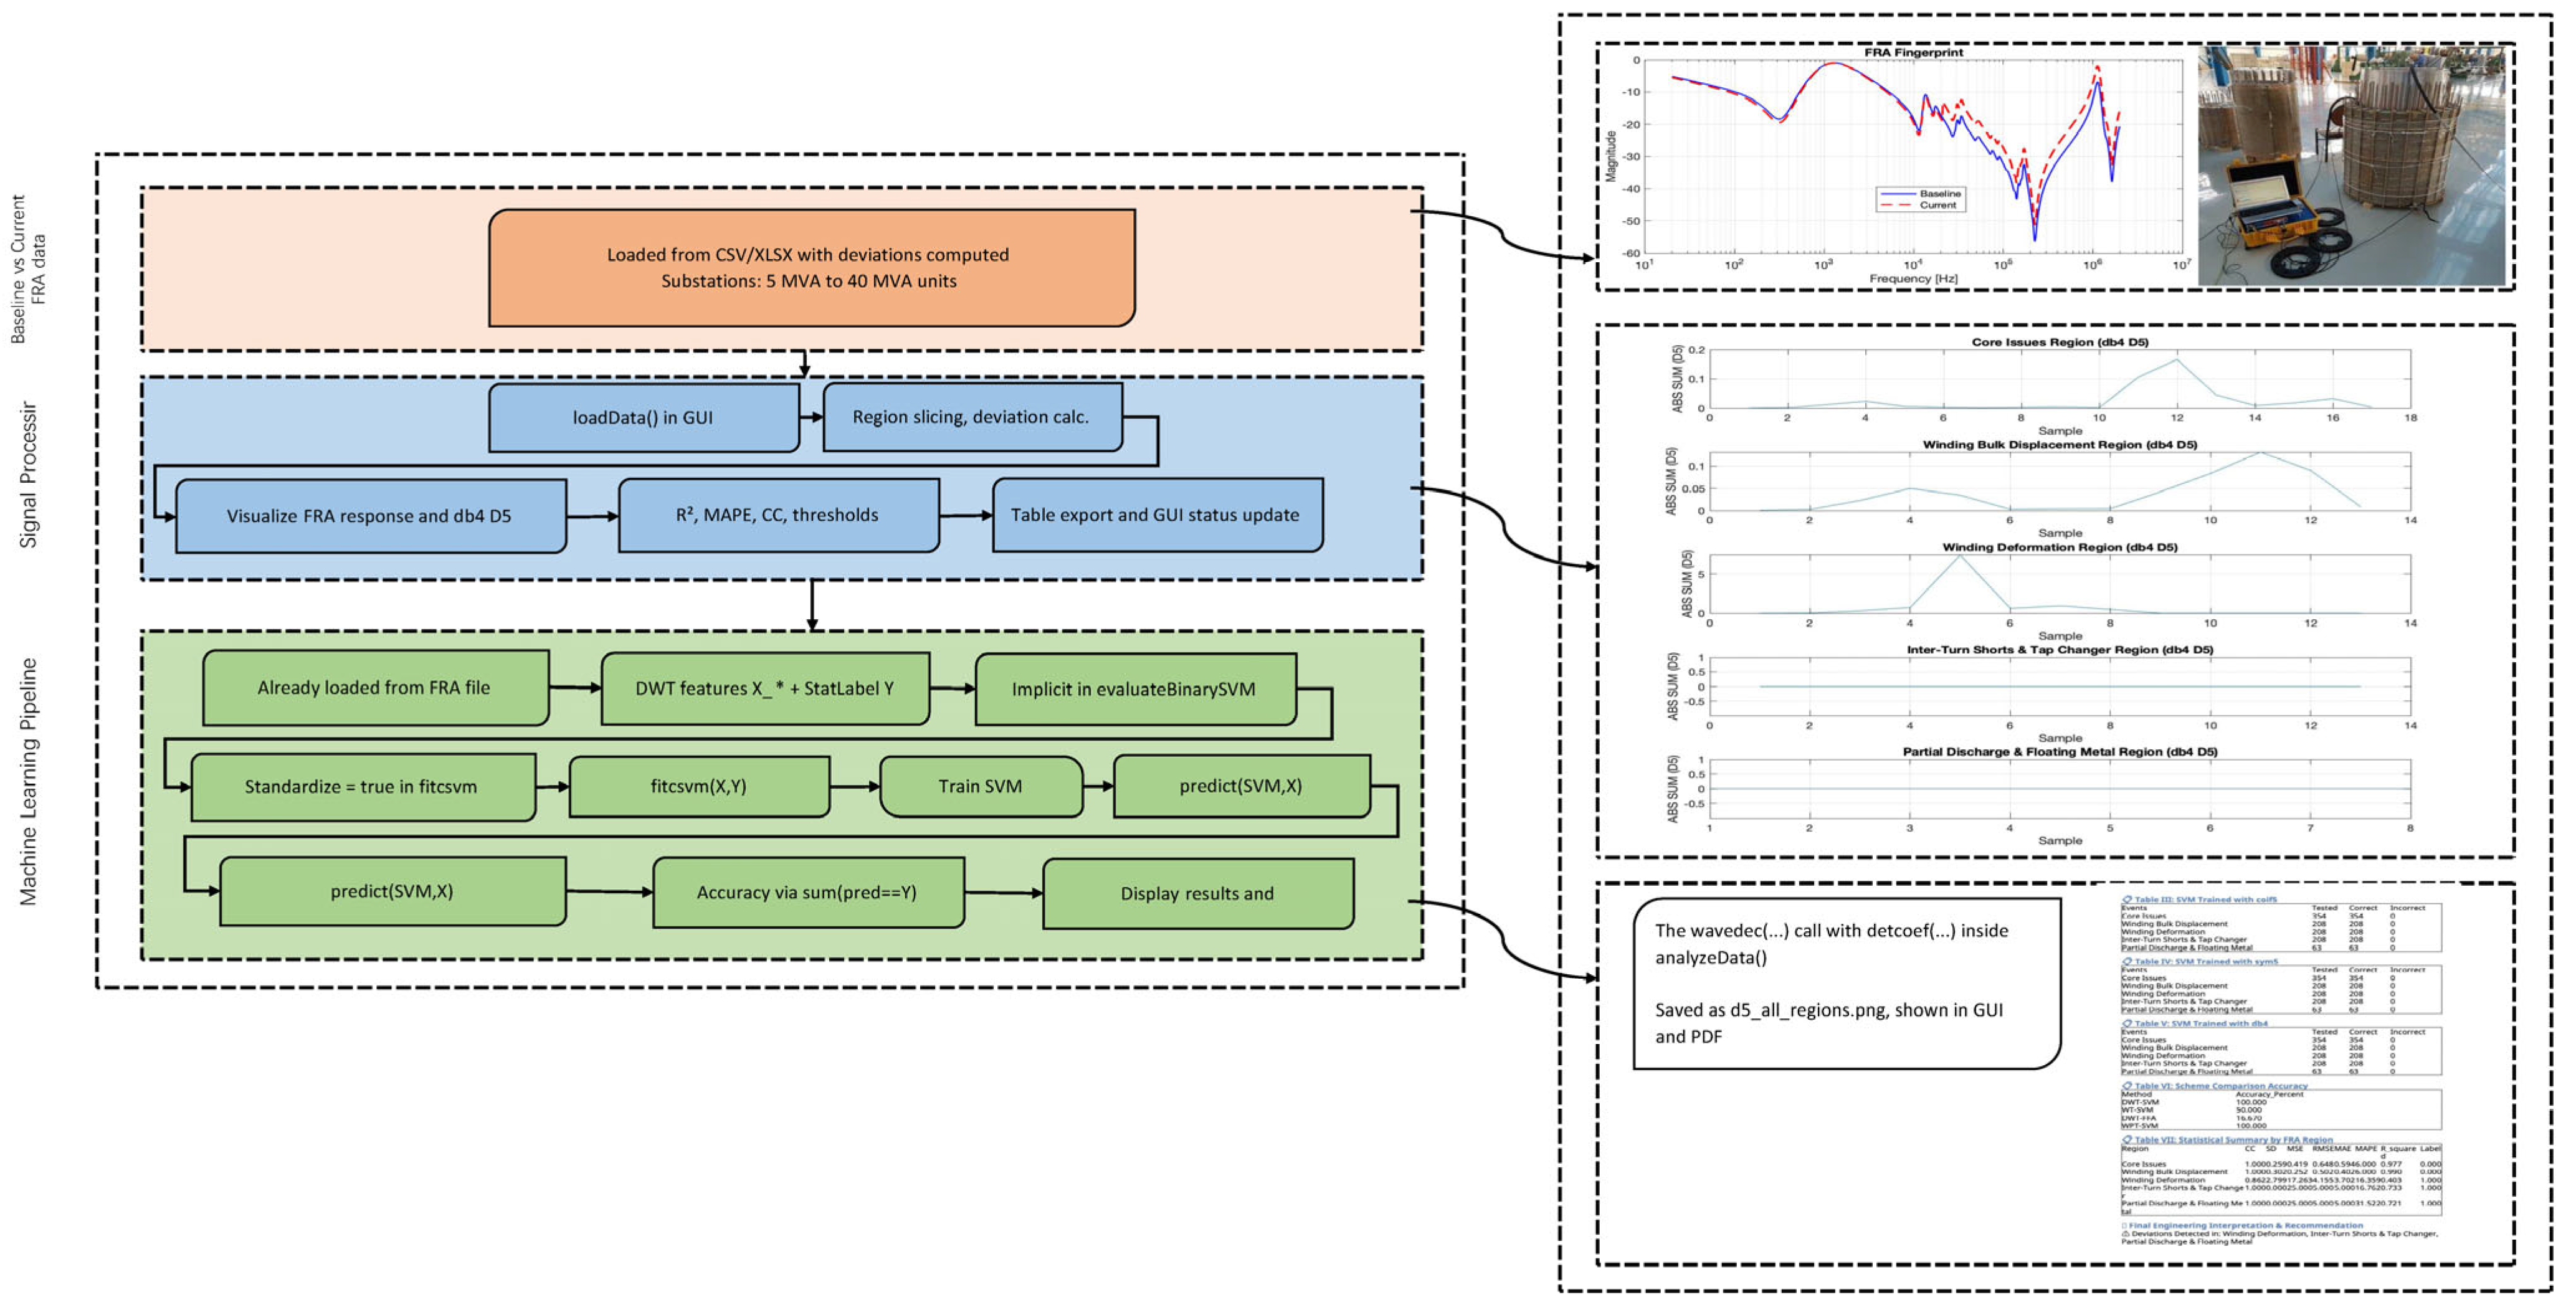
Figure 3.
Layout of the various components of the proposed approach.
Figure 3.
Layout of the various components of the proposed approach.
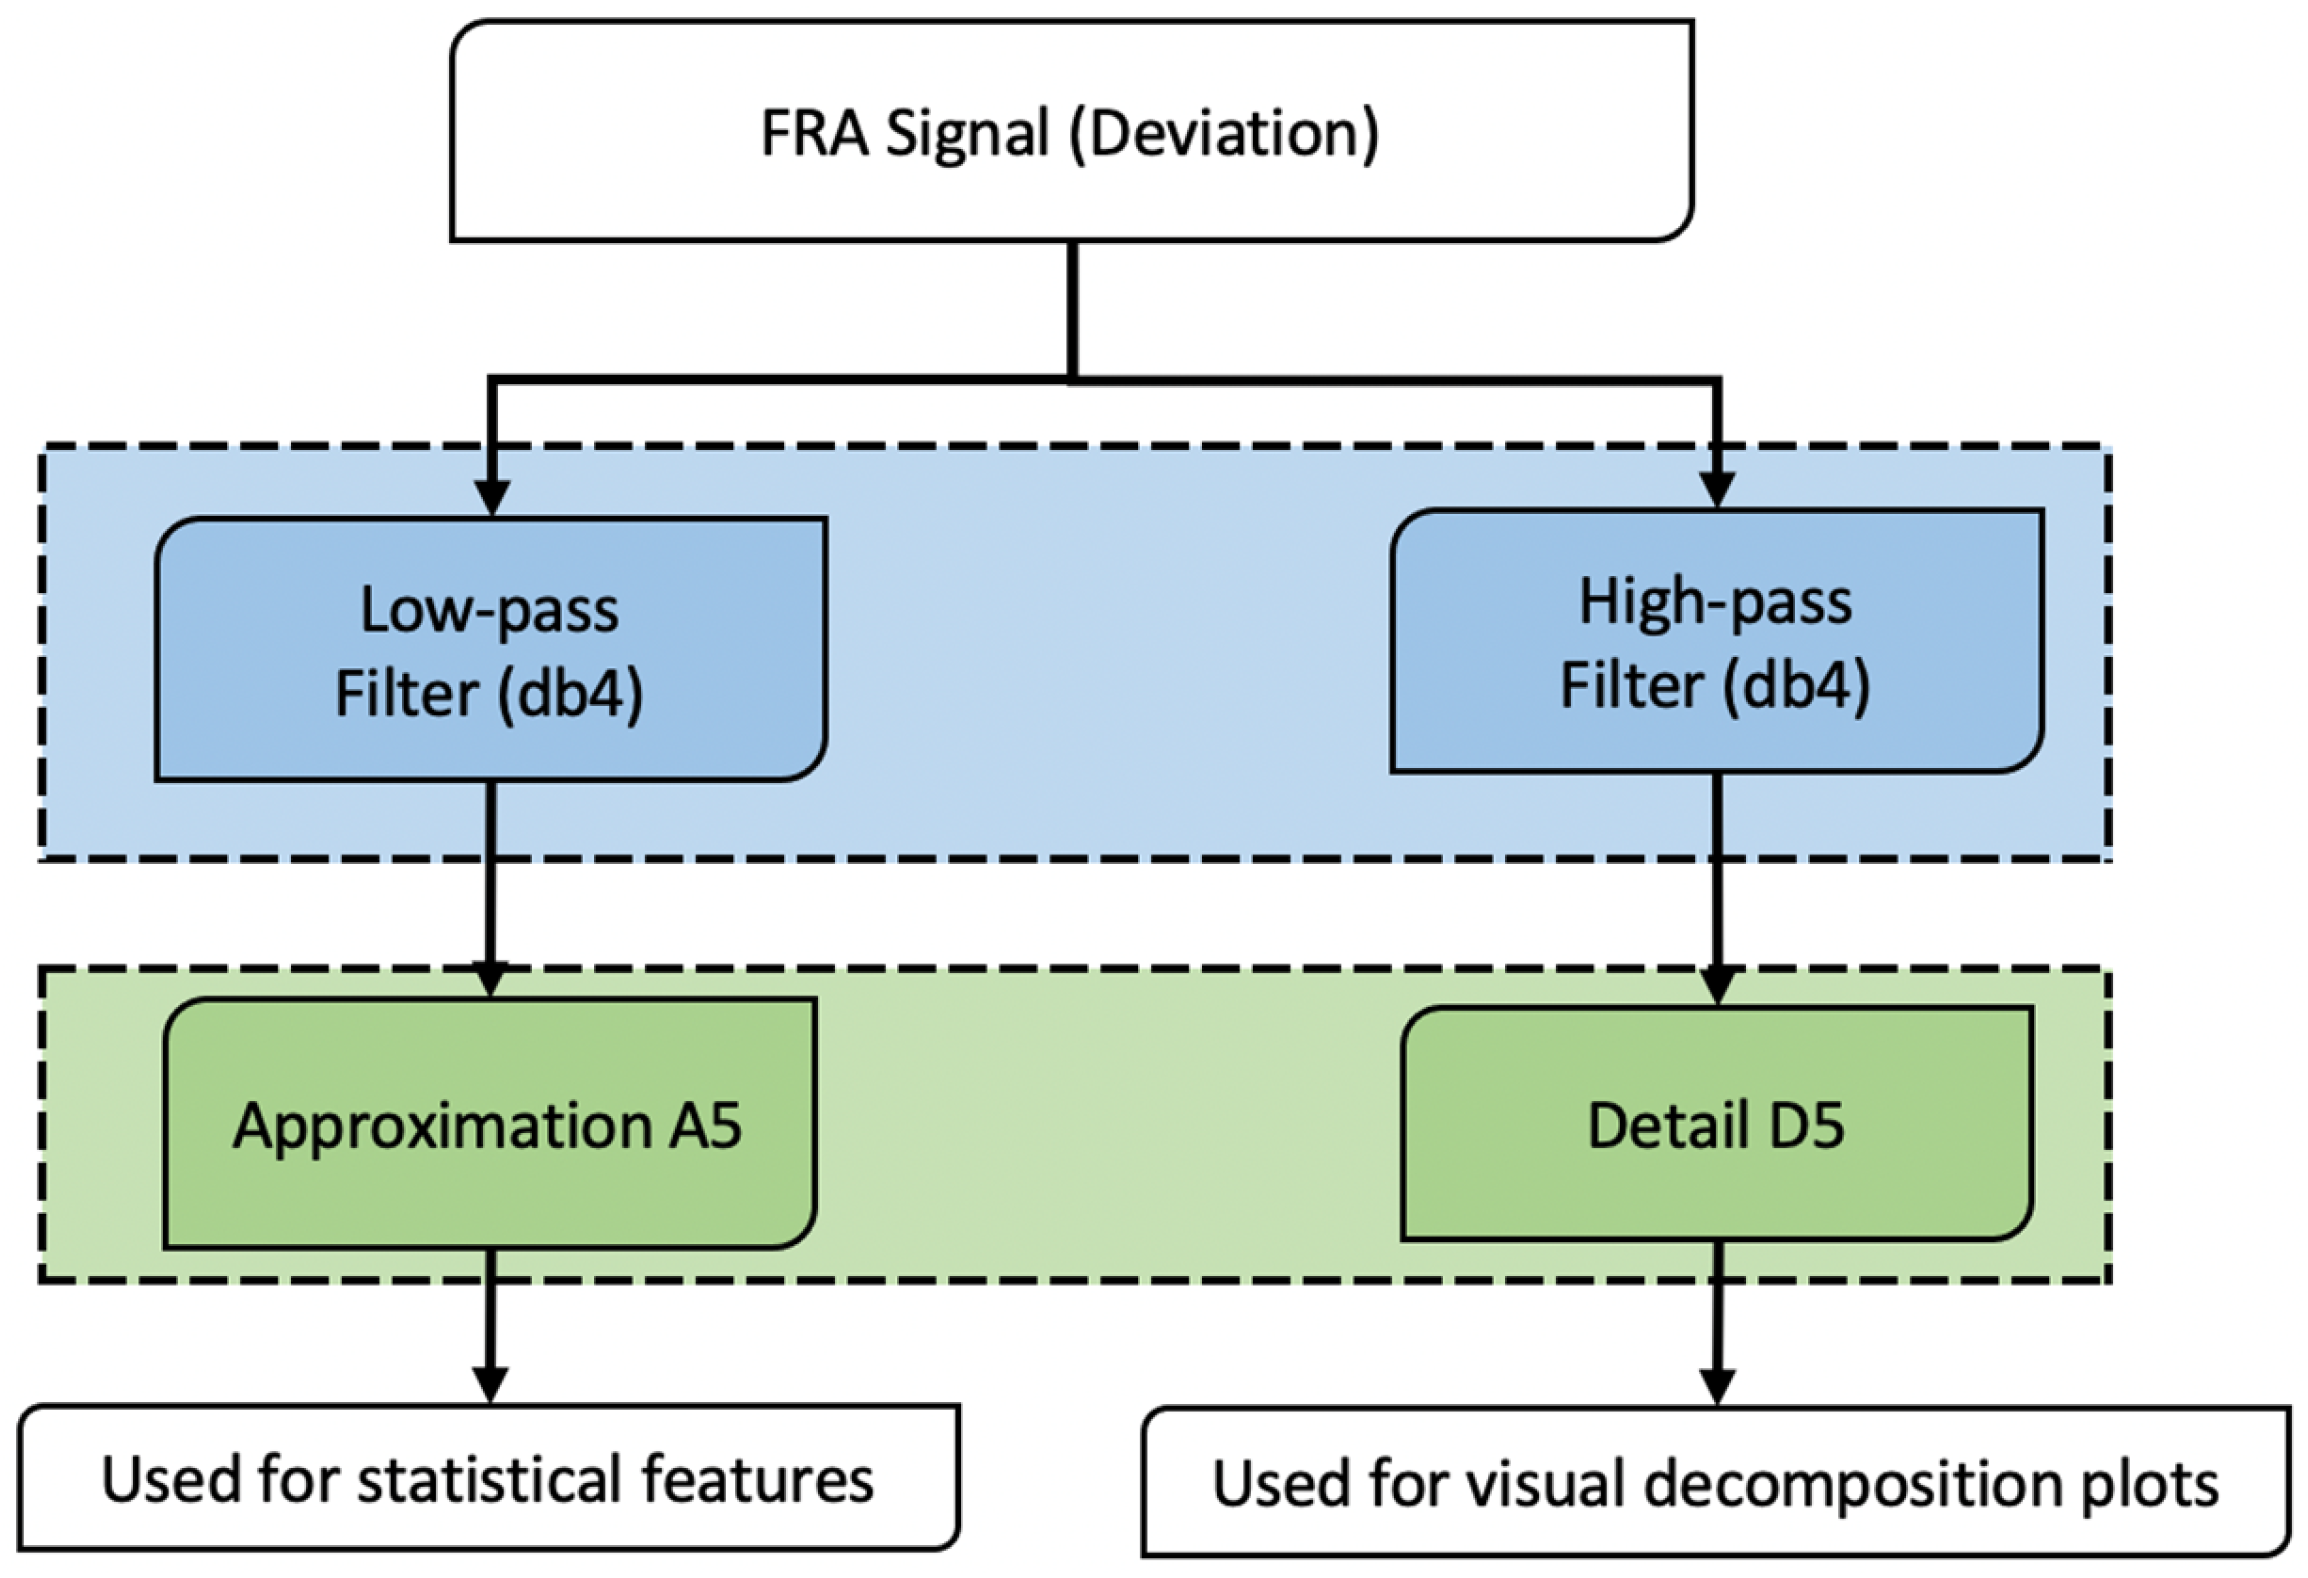
Figure 4.
Wavelet-based separation of low-frequency and high-frequency components in the FRA deviation signal using db4 filter.
Figure 4.
Wavelet-based separation of low-frequency and high-frequency components in the FRA deviation signal using db4 filter.
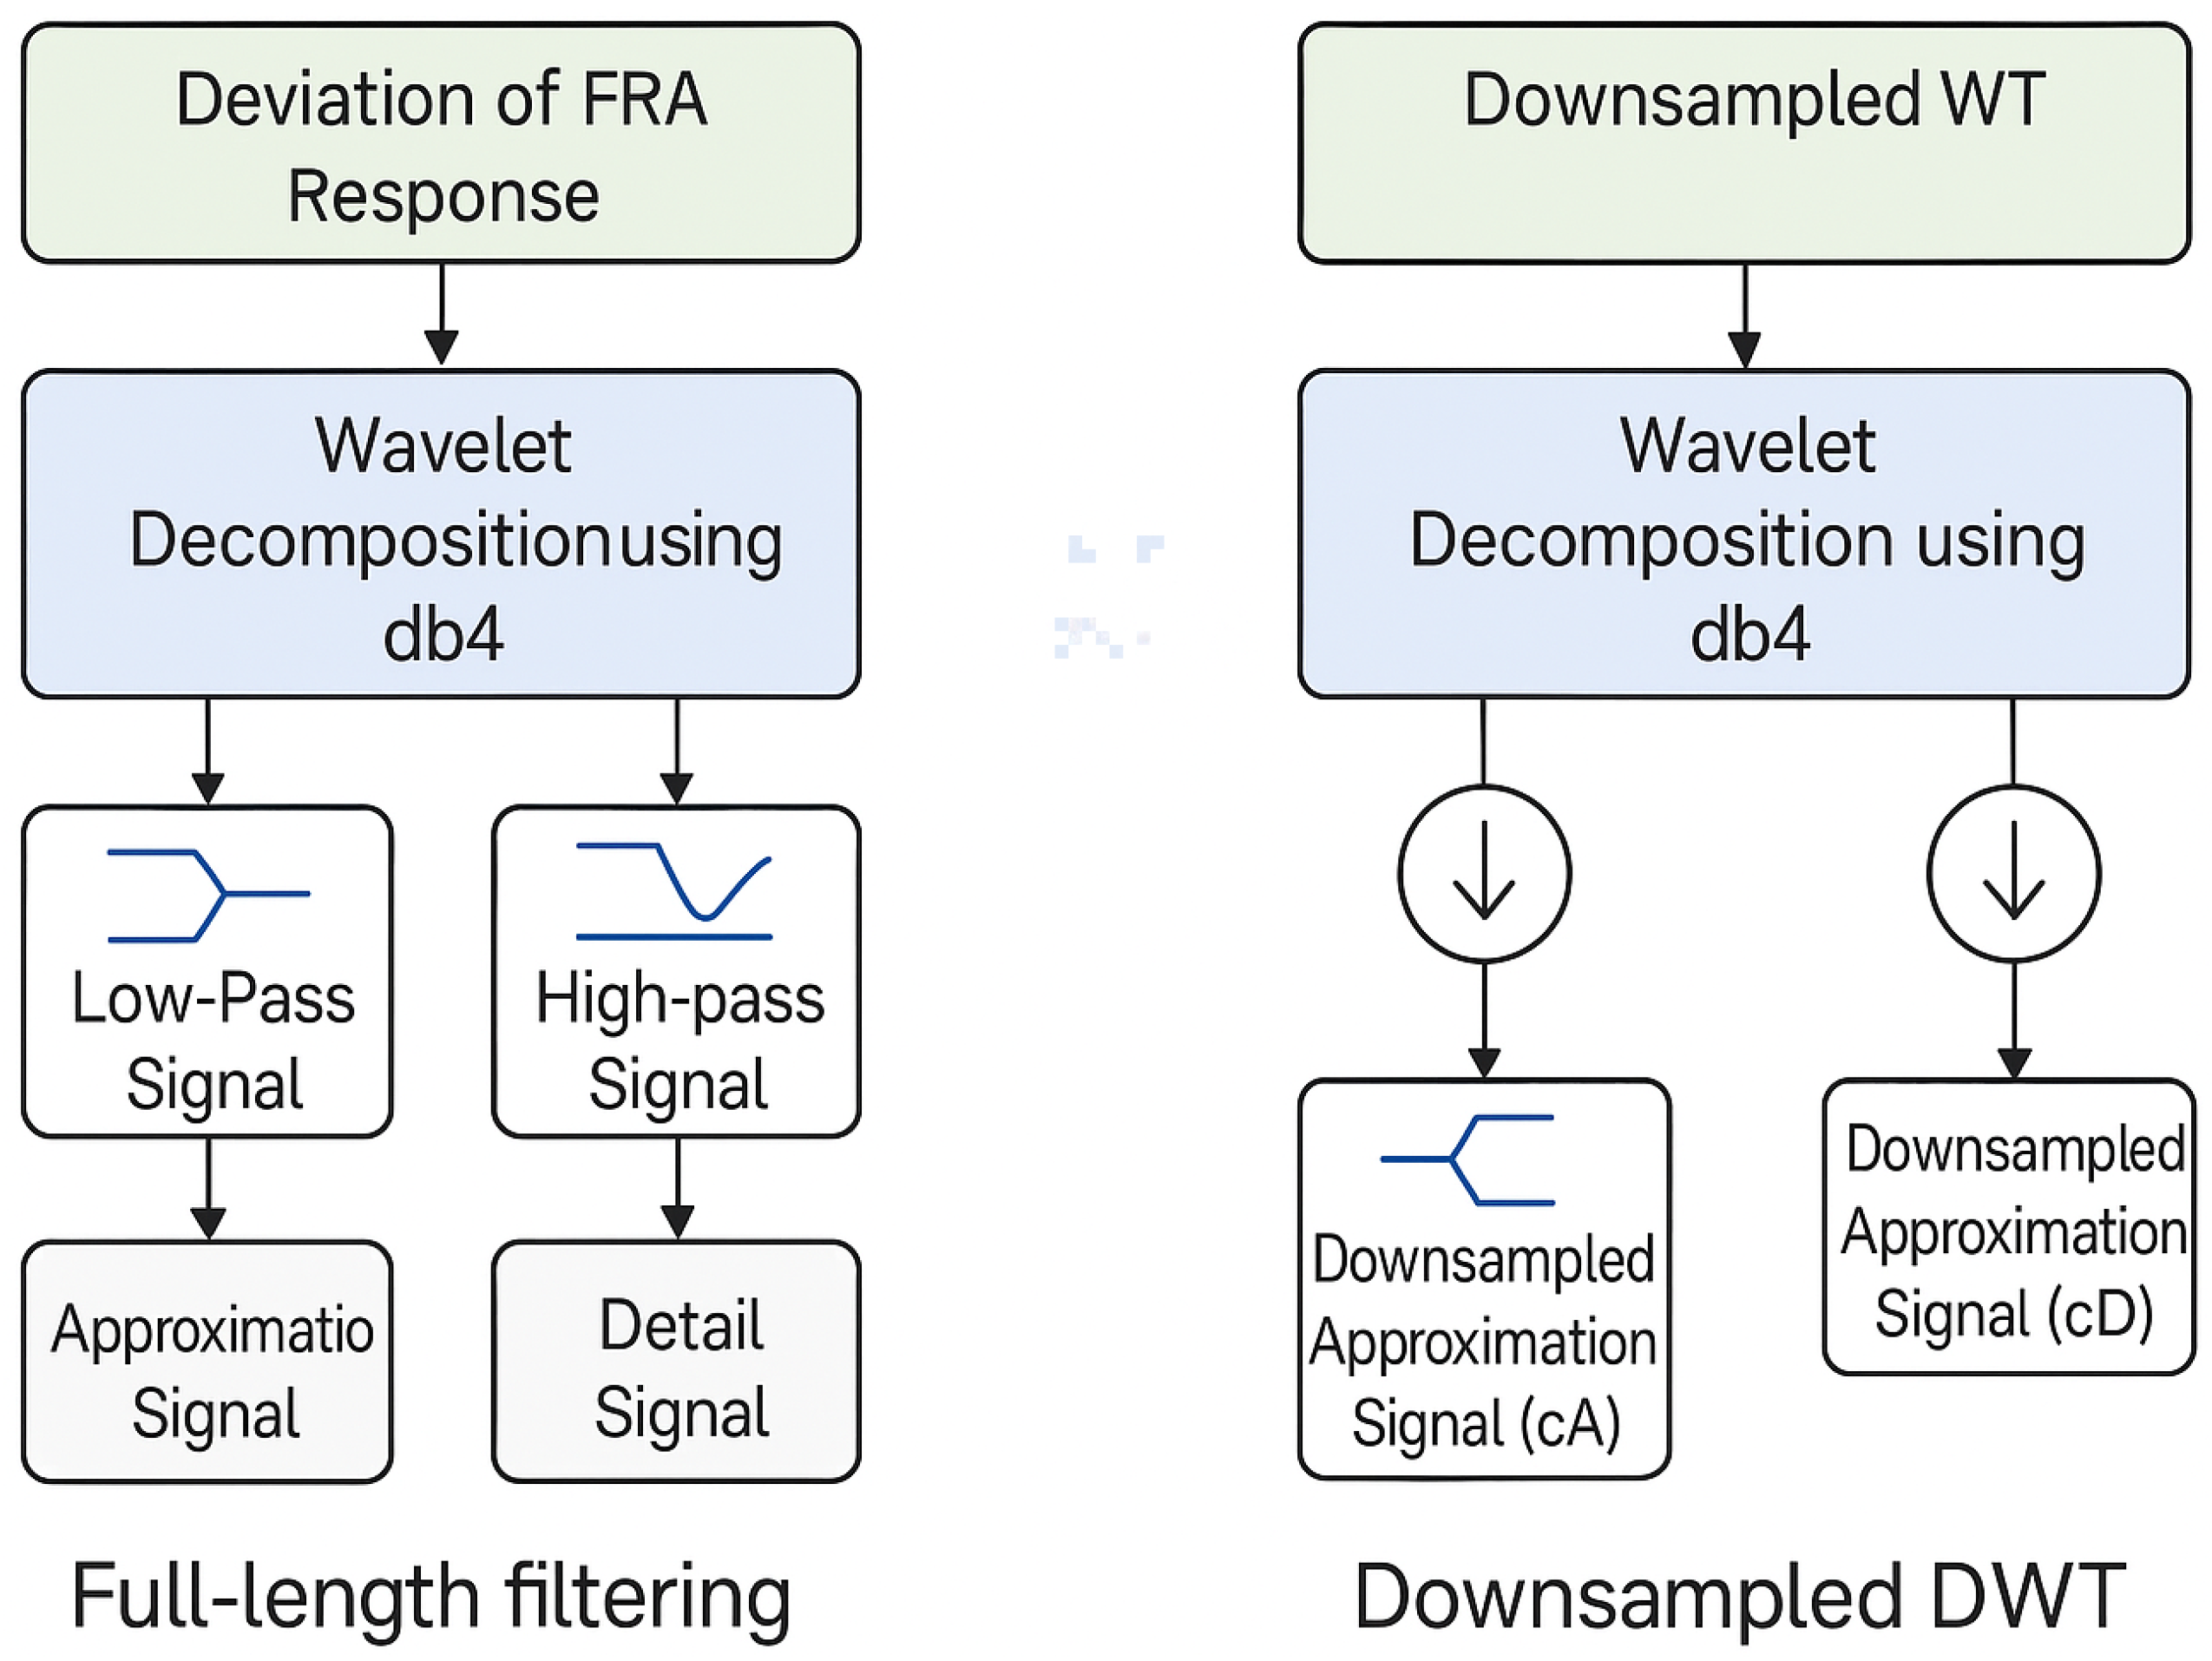
Figure 5.
DWT-based decomposition of FRA signals with and without downsampling for fault feature extraction.
Figure 5.
DWT-based decomposition of FRA signals with and without downsampling for fault feature extraction.
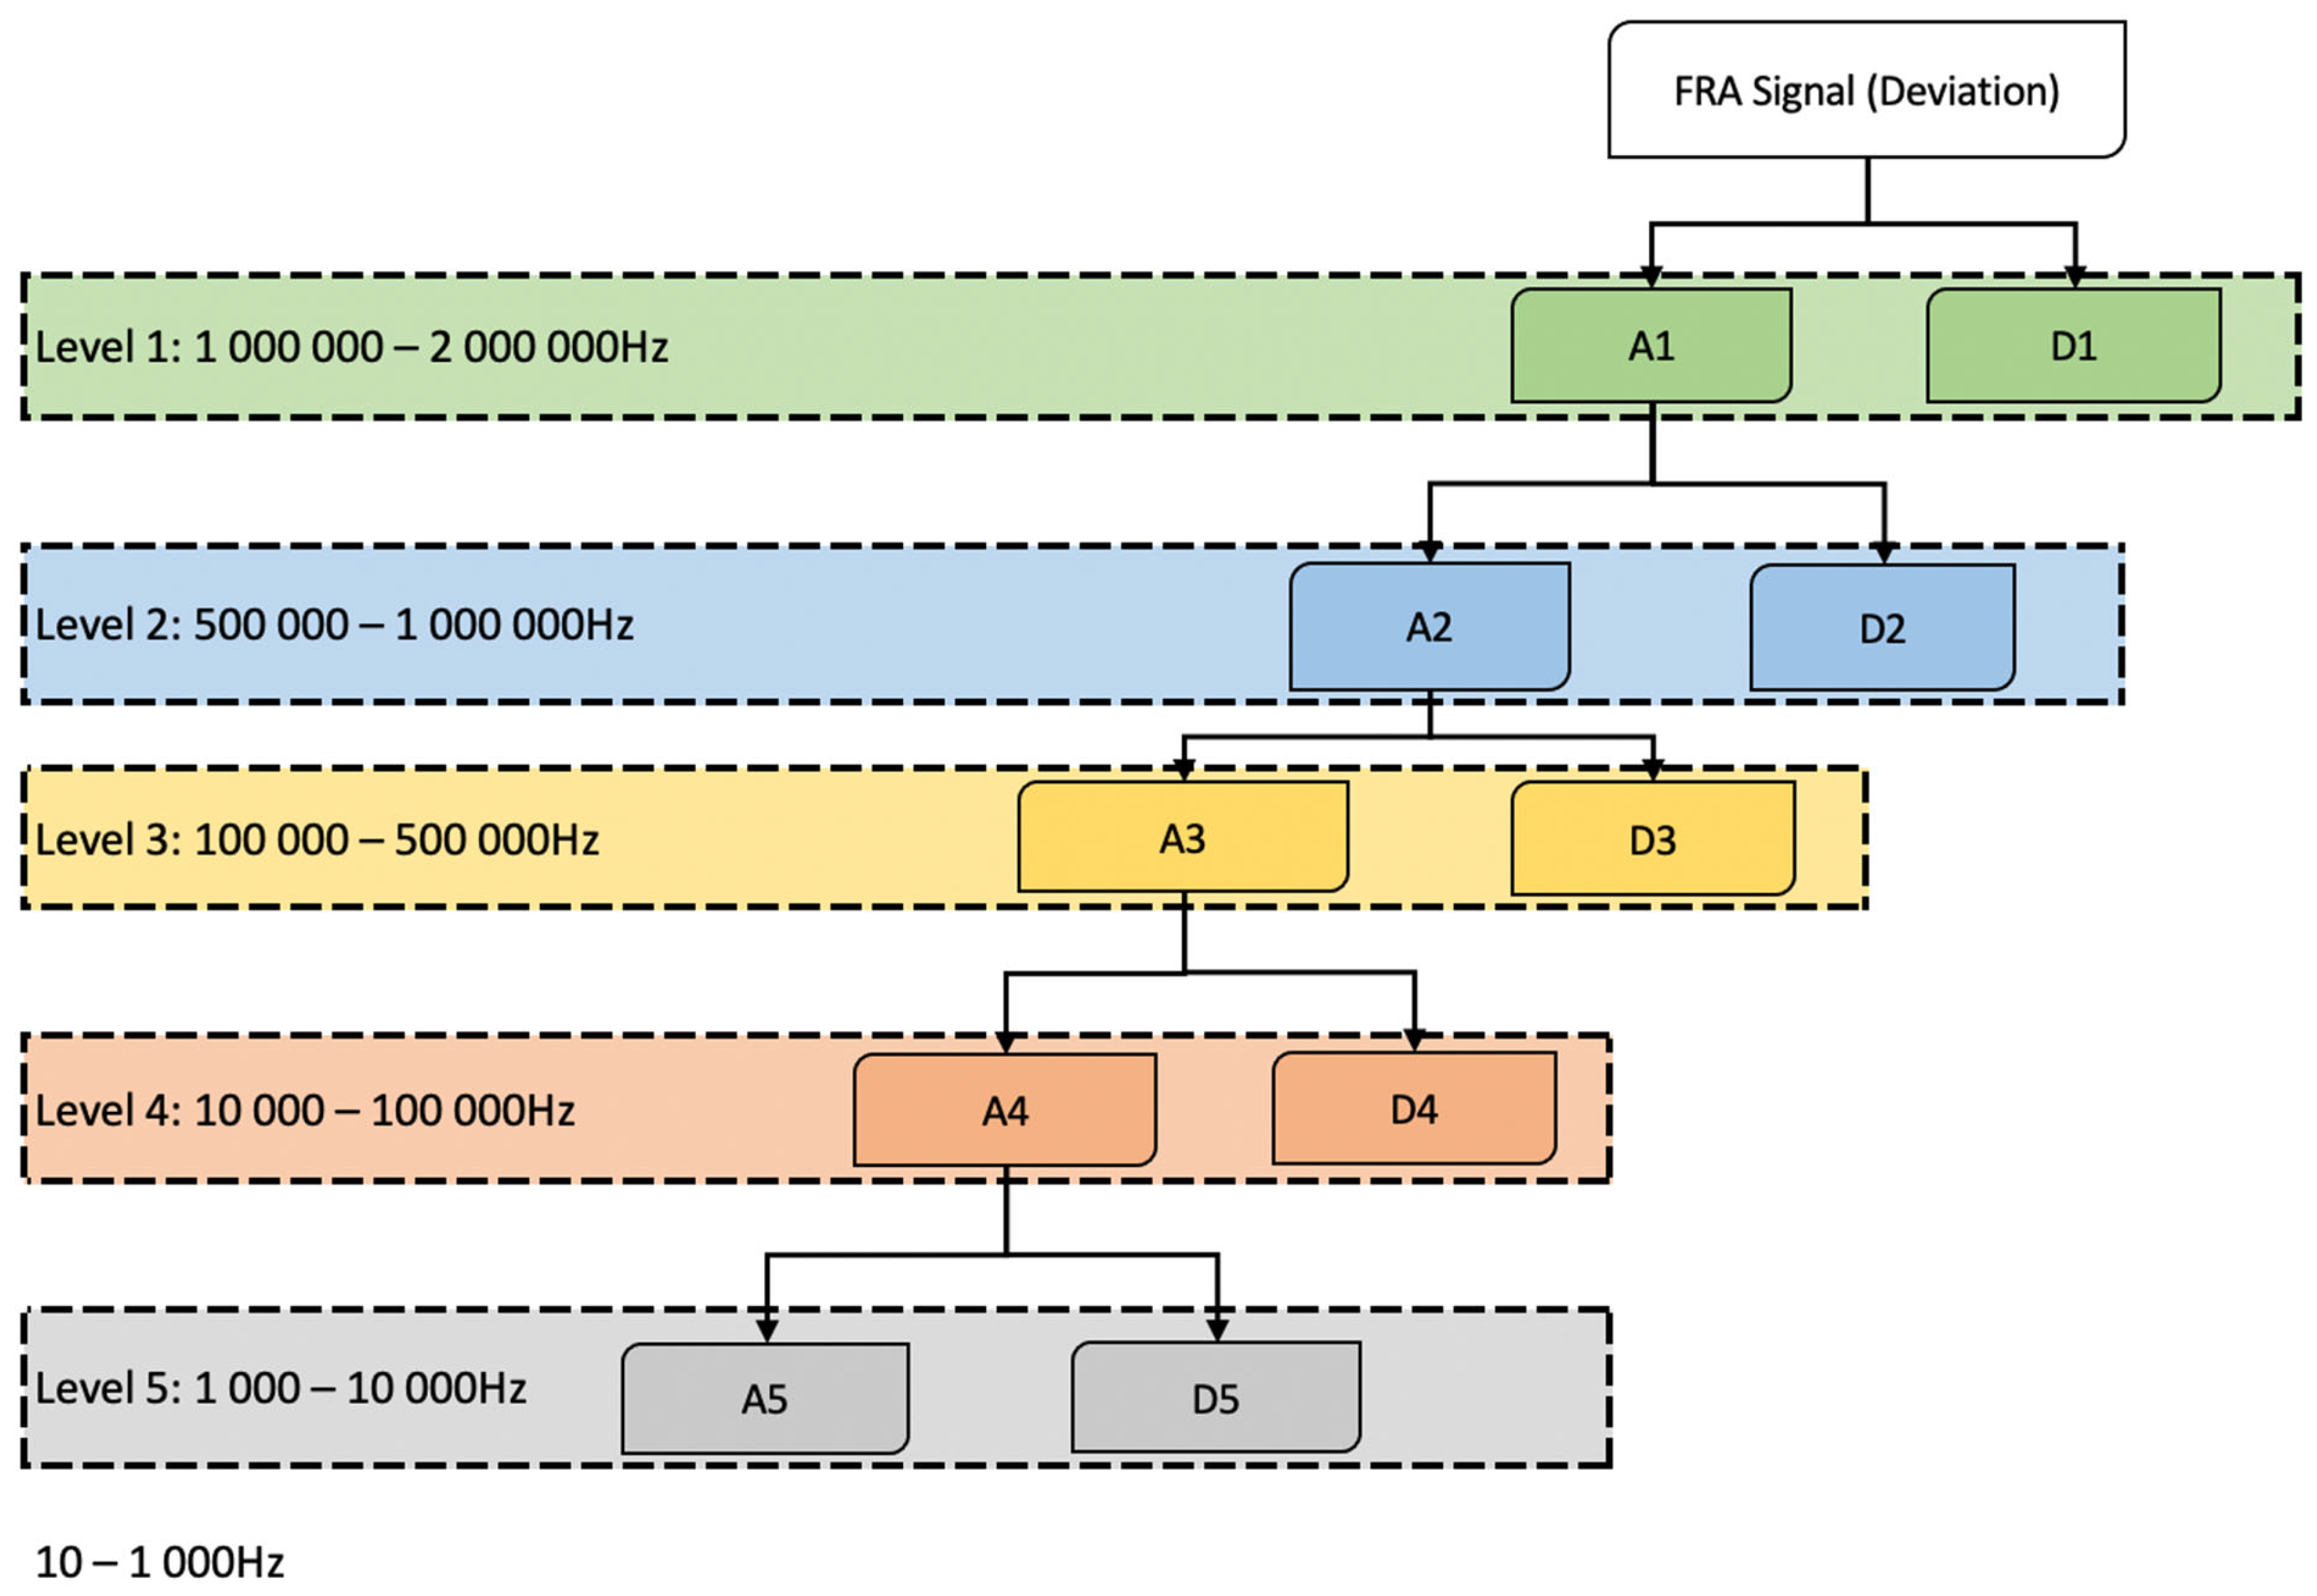
Figure 6.
Multilevel wavelet decomposition of the FRA signal deviation using Daubechies wavelets, with D5 coefficients extracted for fault classification.
Figure 6.
Multilevel wavelet decomposition of the FRA signal deviation using Daubechies wavelets, with D5 coefficients extracted for fault classification.
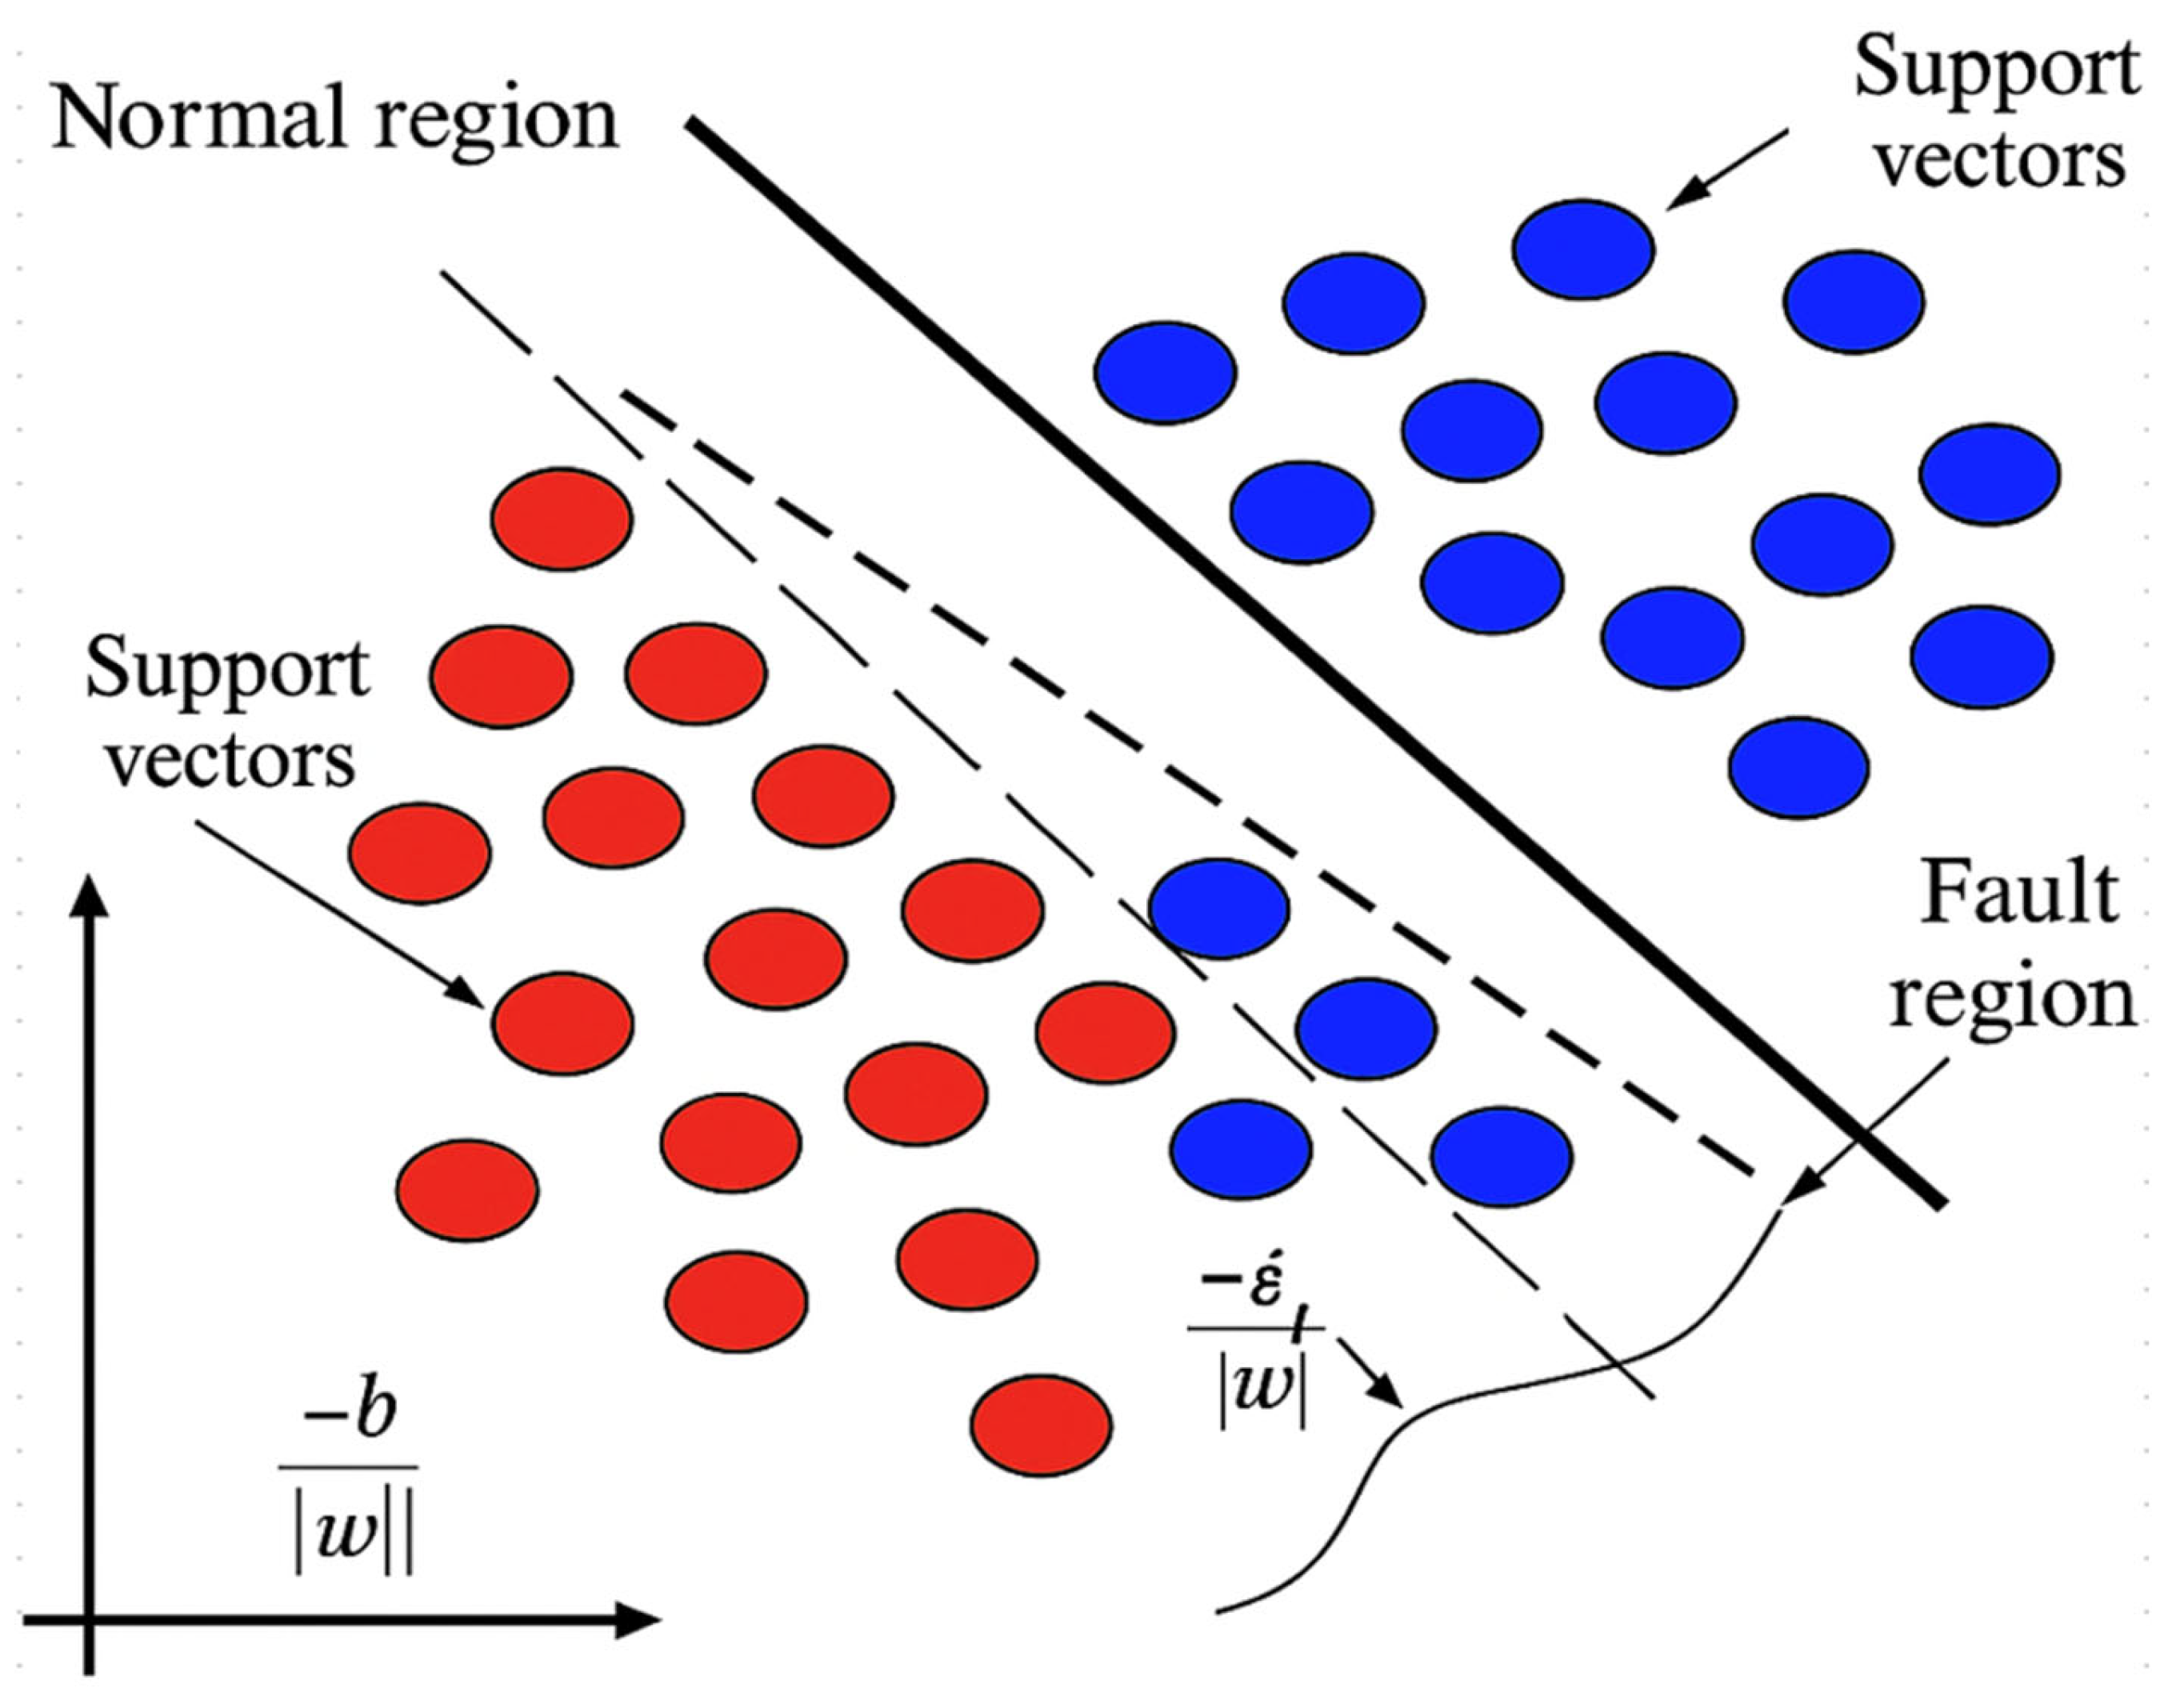
Figure 7.
Classification of FRA datasets using the SVM method.
Figure 7.
Classification of FRA datasets using the SVM method.
Figure 8.
SVM classification of FRA signatures.
Figure 8.
SVM classification of FRA signatures.
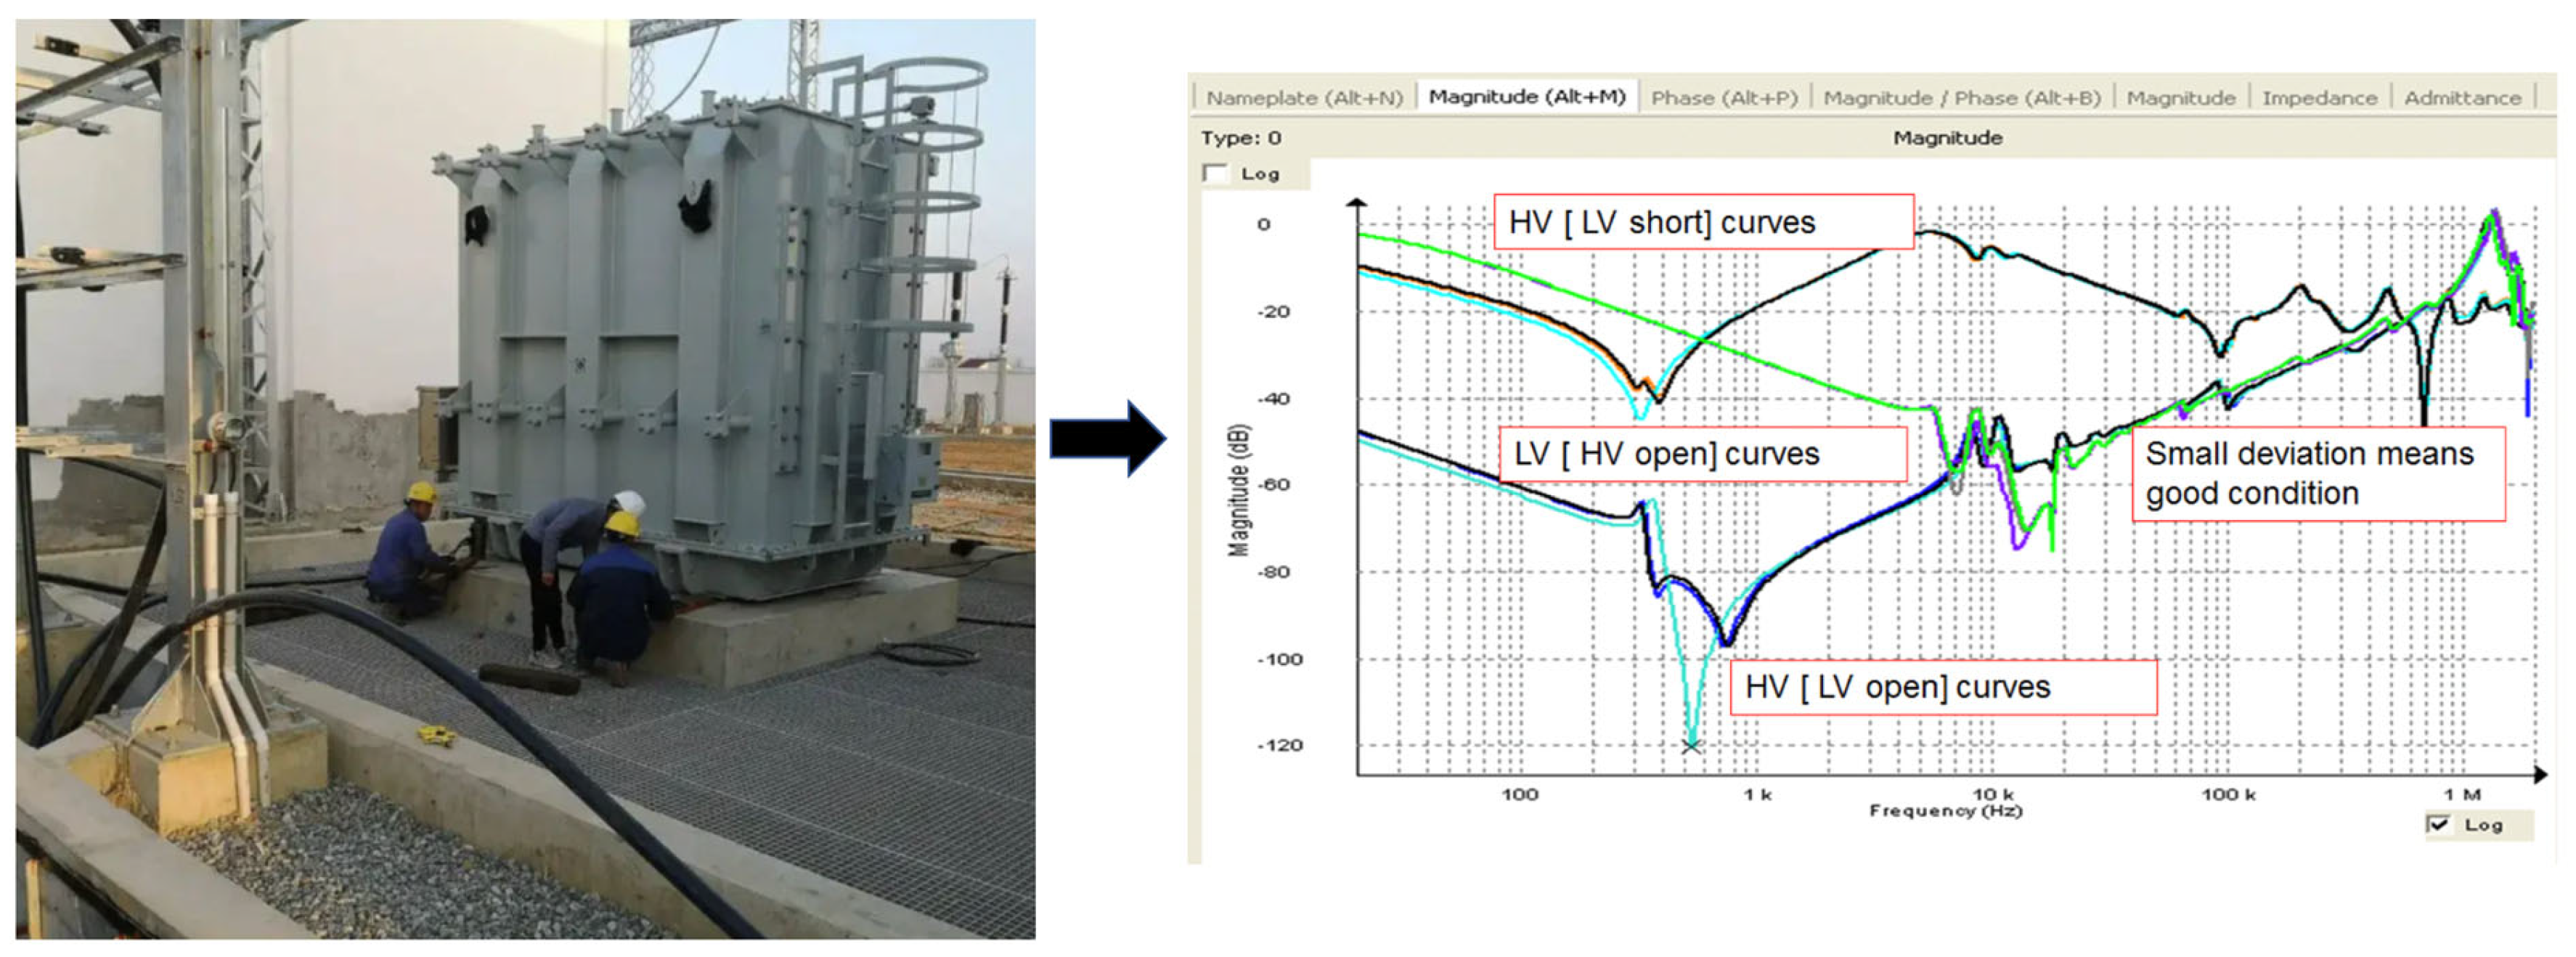
Figure 9.
On-site FRA test on a power transformer and corresponding response curves.
Figure 9.
On-site FRA test on a power transformer and corresponding response curves.
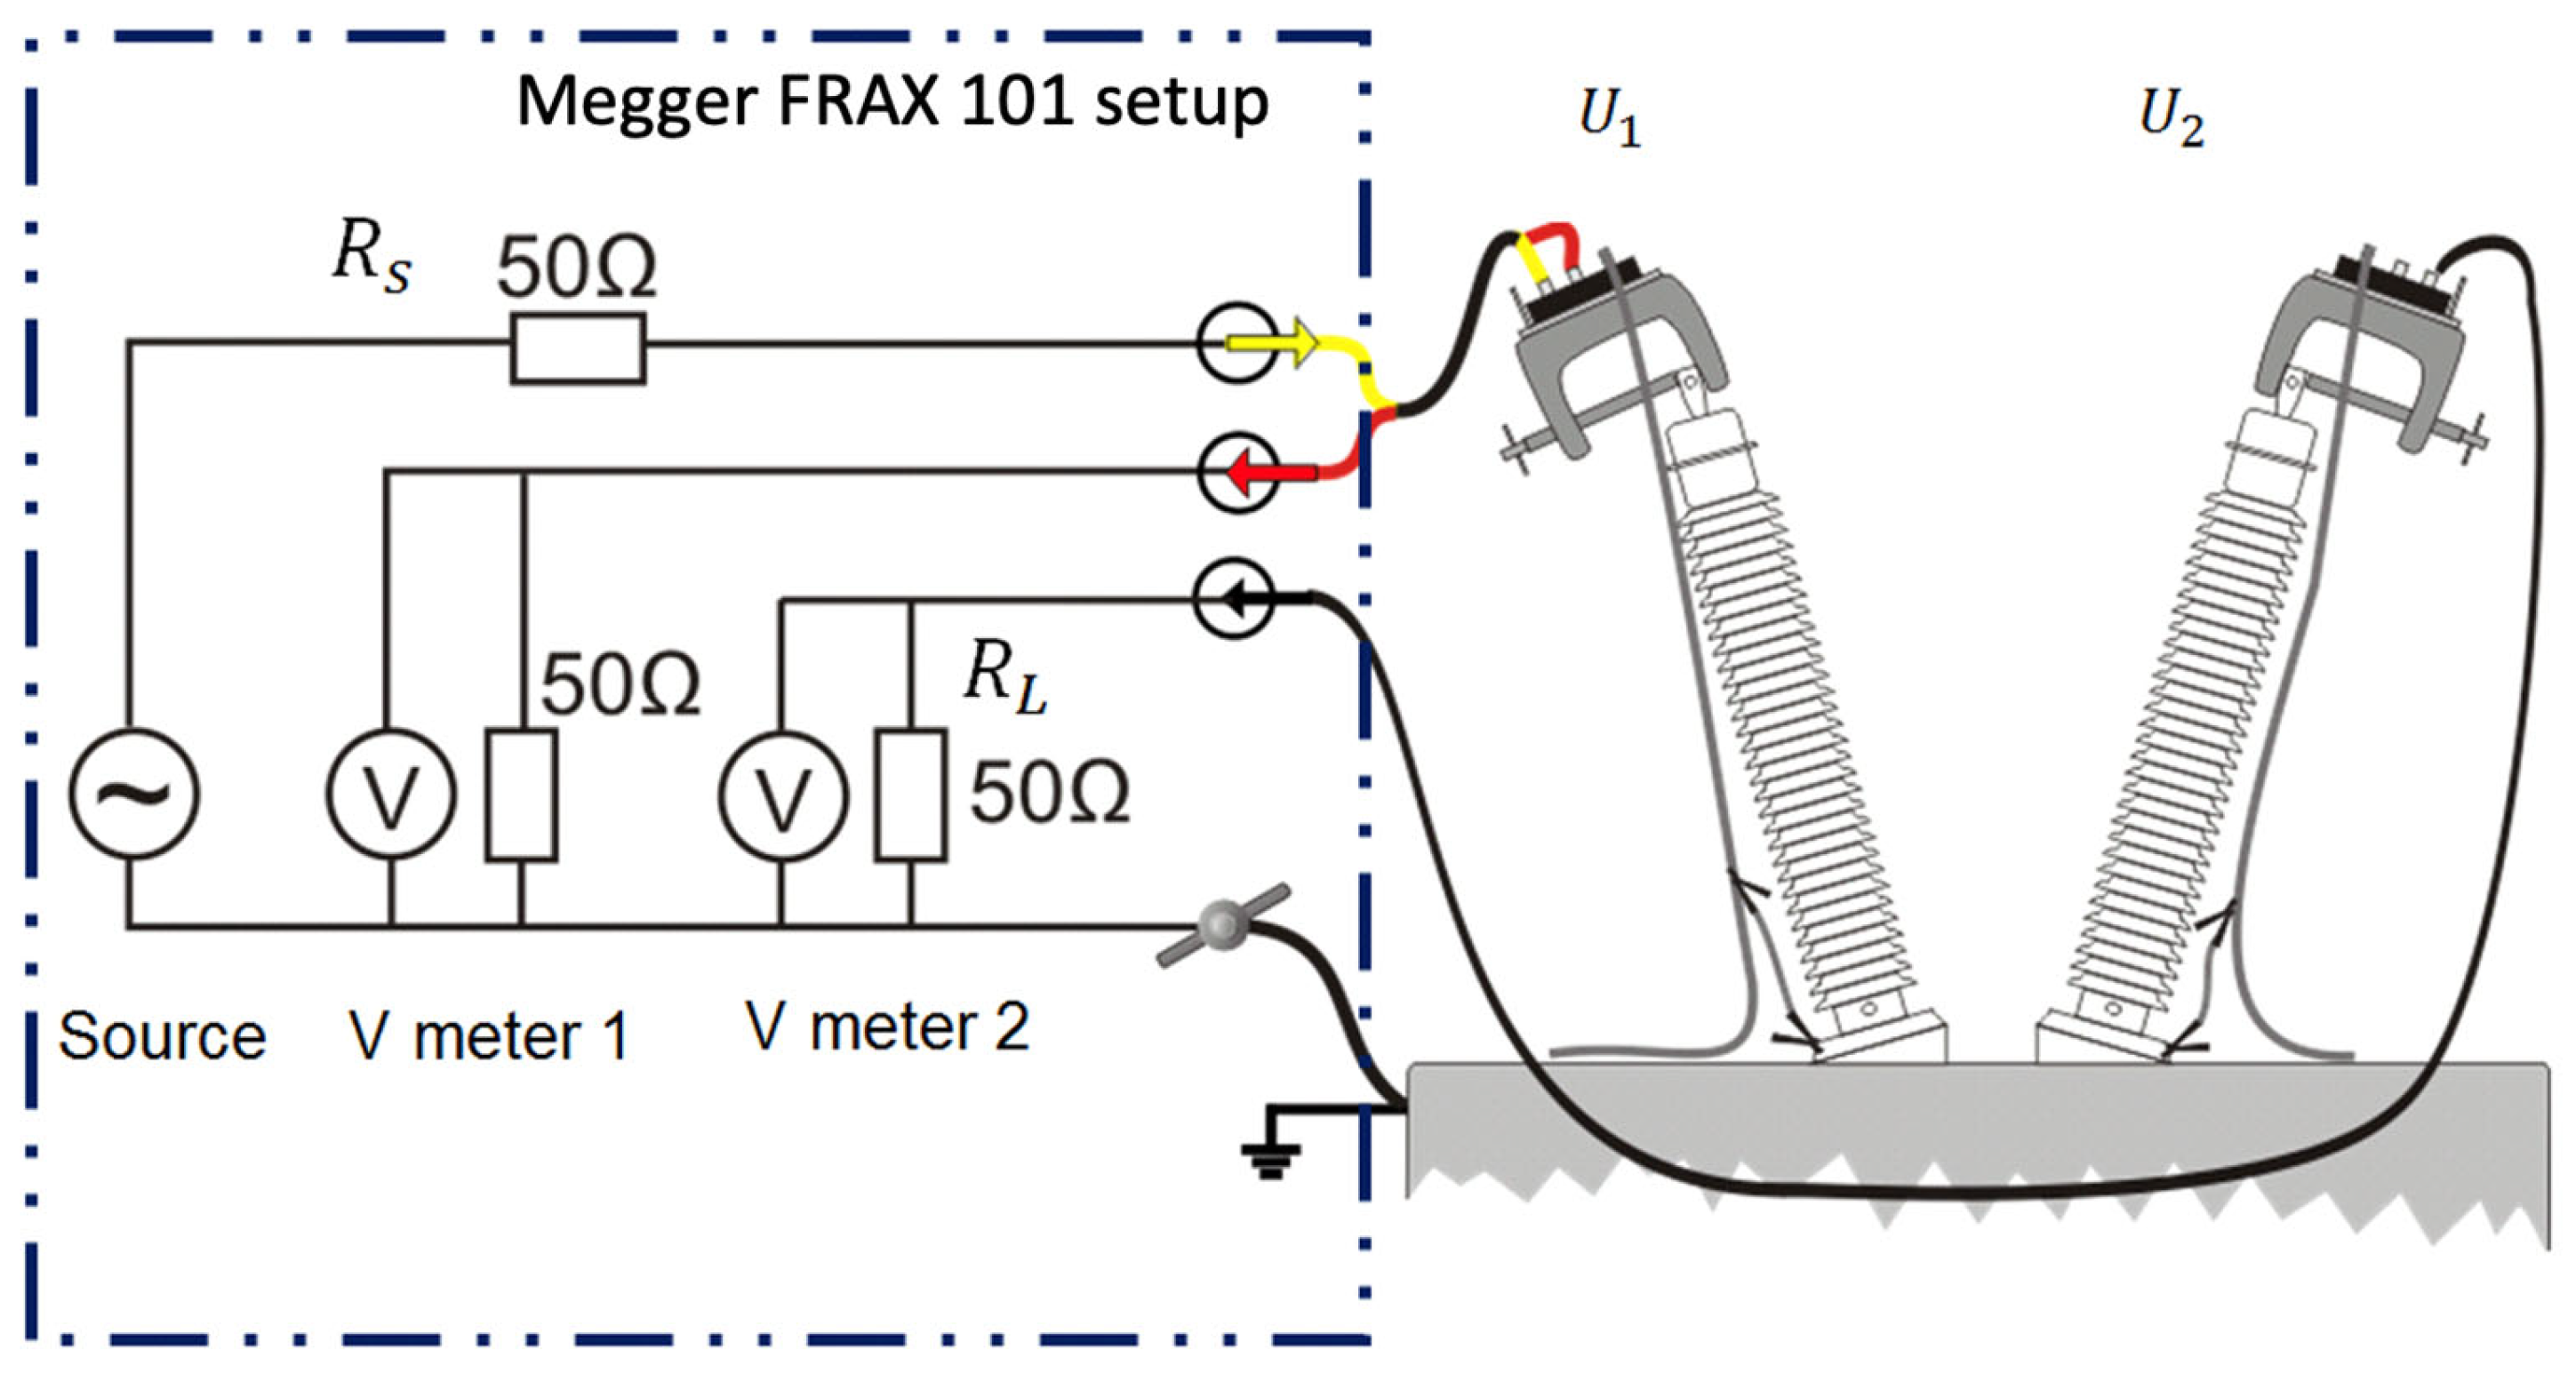
Figure 10.
FRA test configuration with 50 Ω impedance matching for transformer winding analysis.
Figure 10.
FRA test configuration with 50 Ω impedance matching for transformer winding analysis.
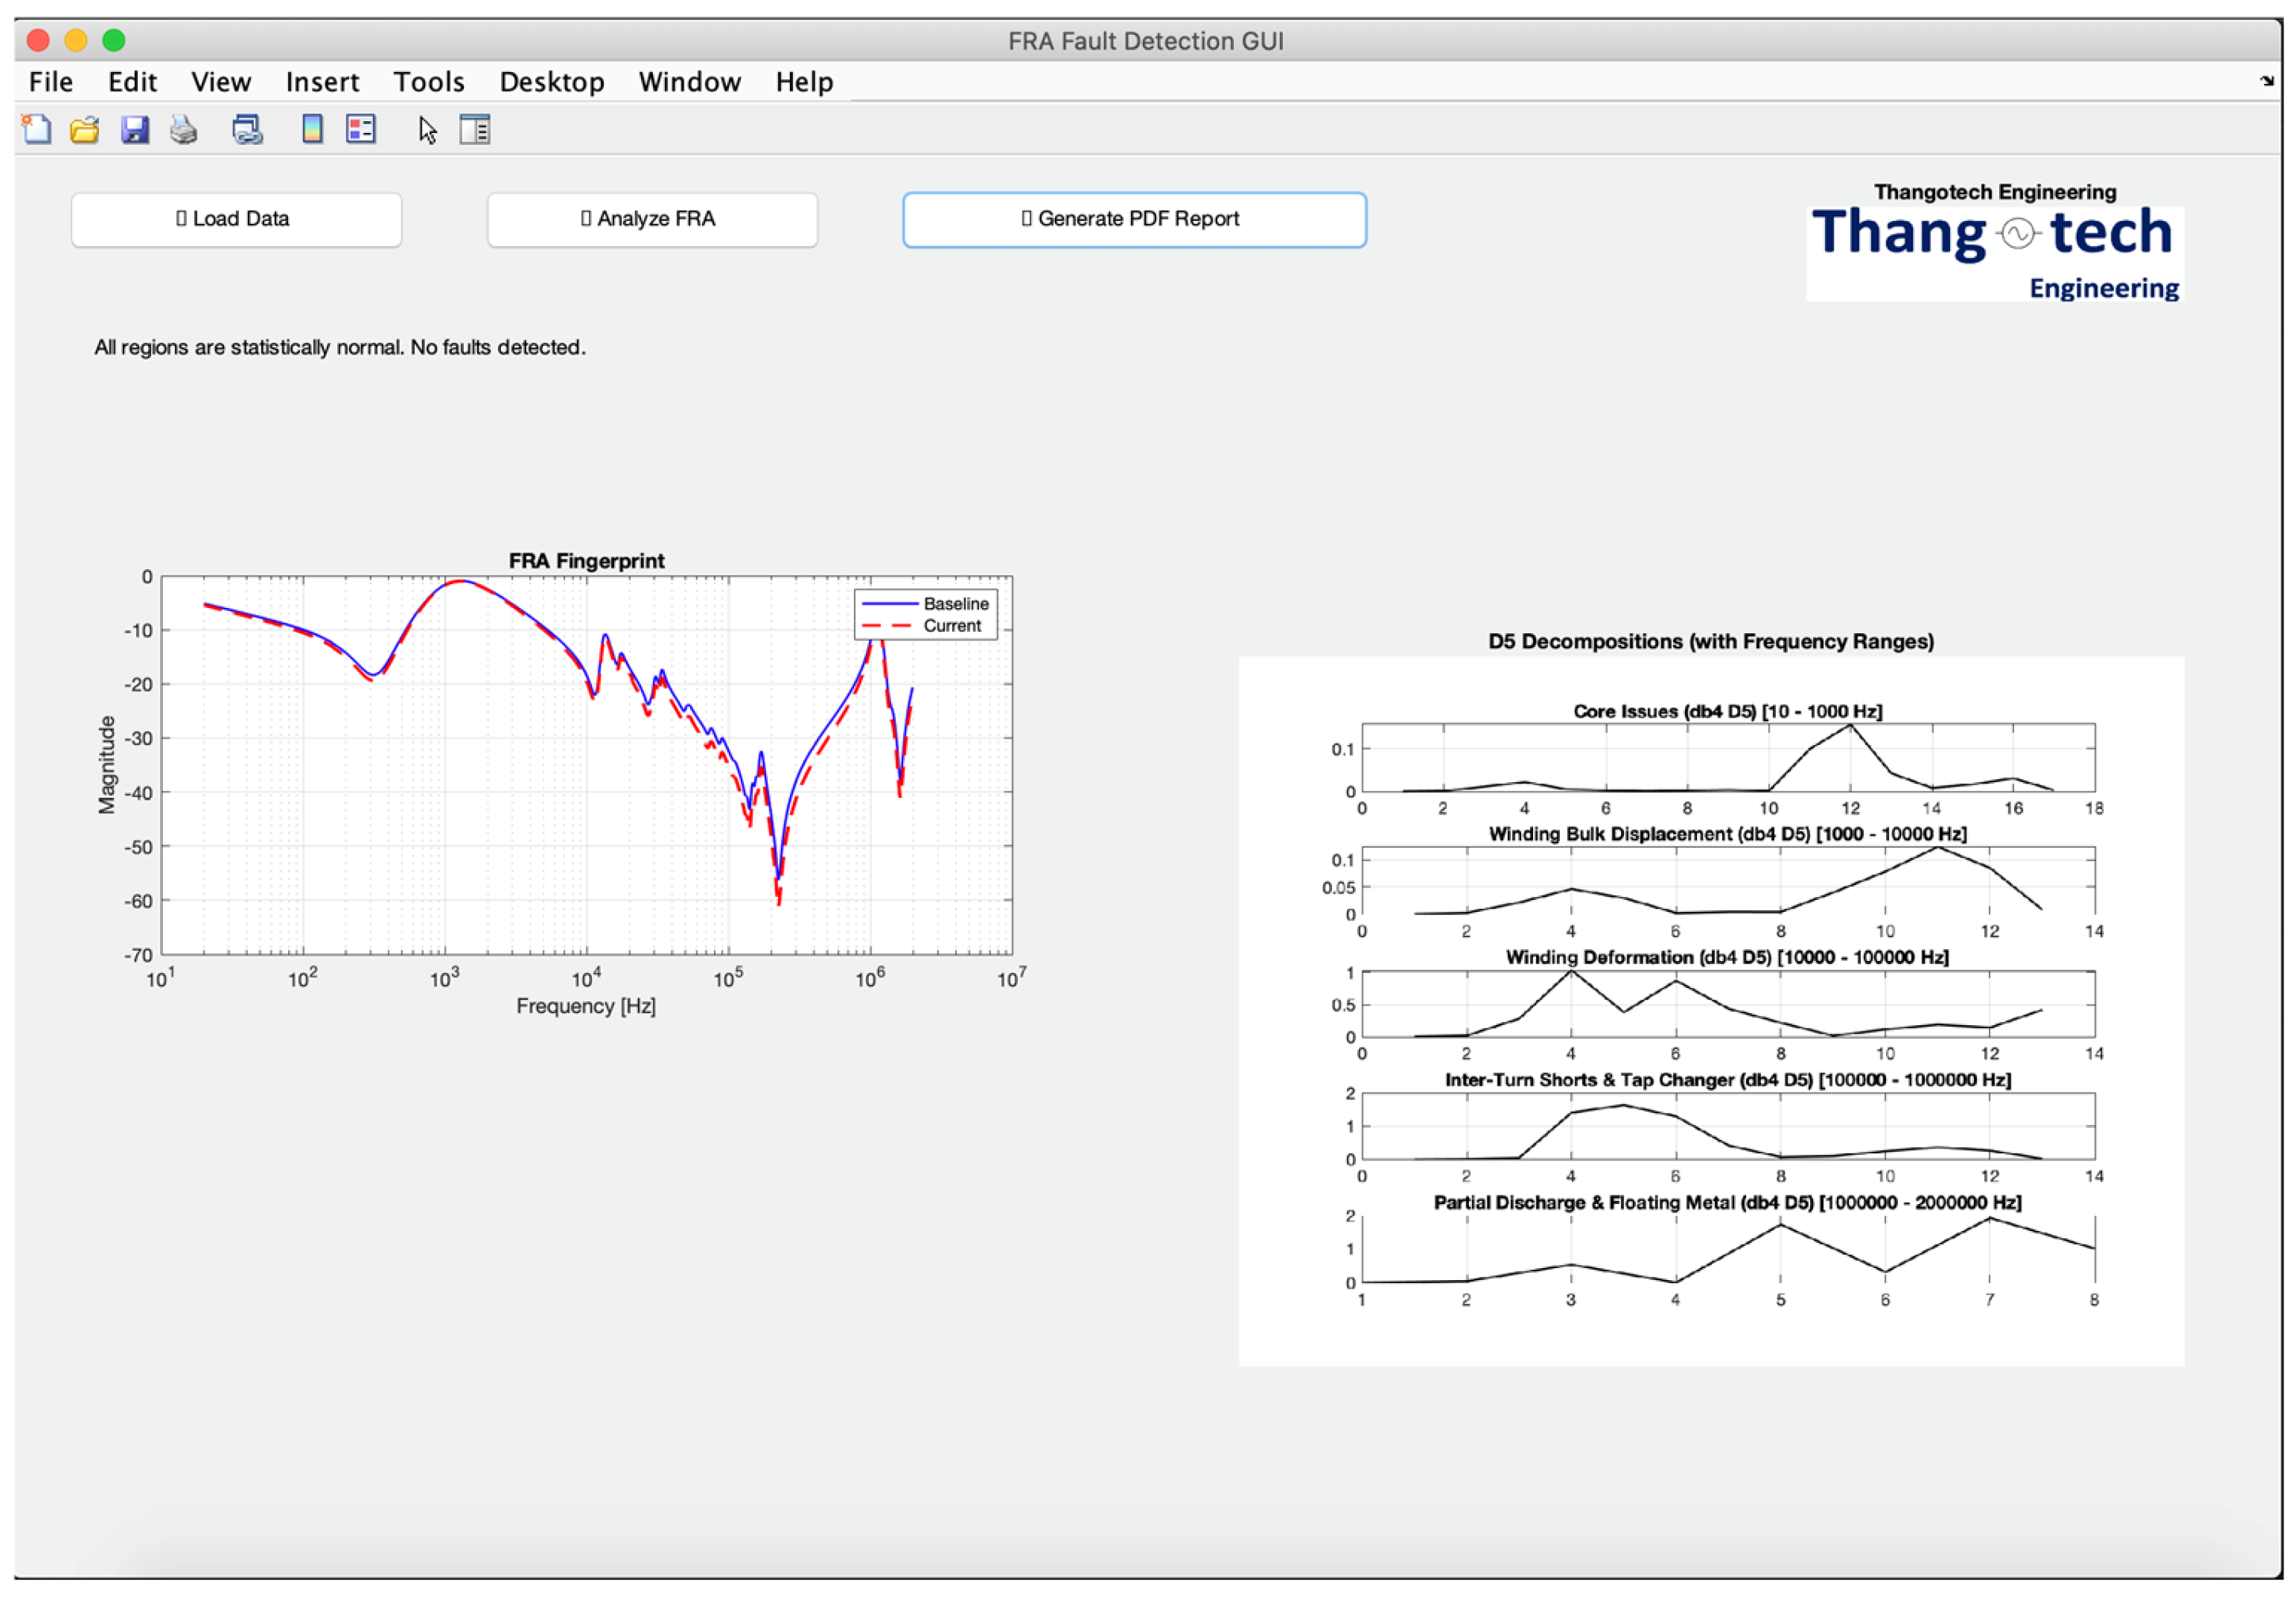
Figure 11.
Case Study 1—FRA signatures obtained in Megger FRAX 101 software.
Figure 11.
Case Study 1—FRA signatures obtained in Megger FRAX 101 software.
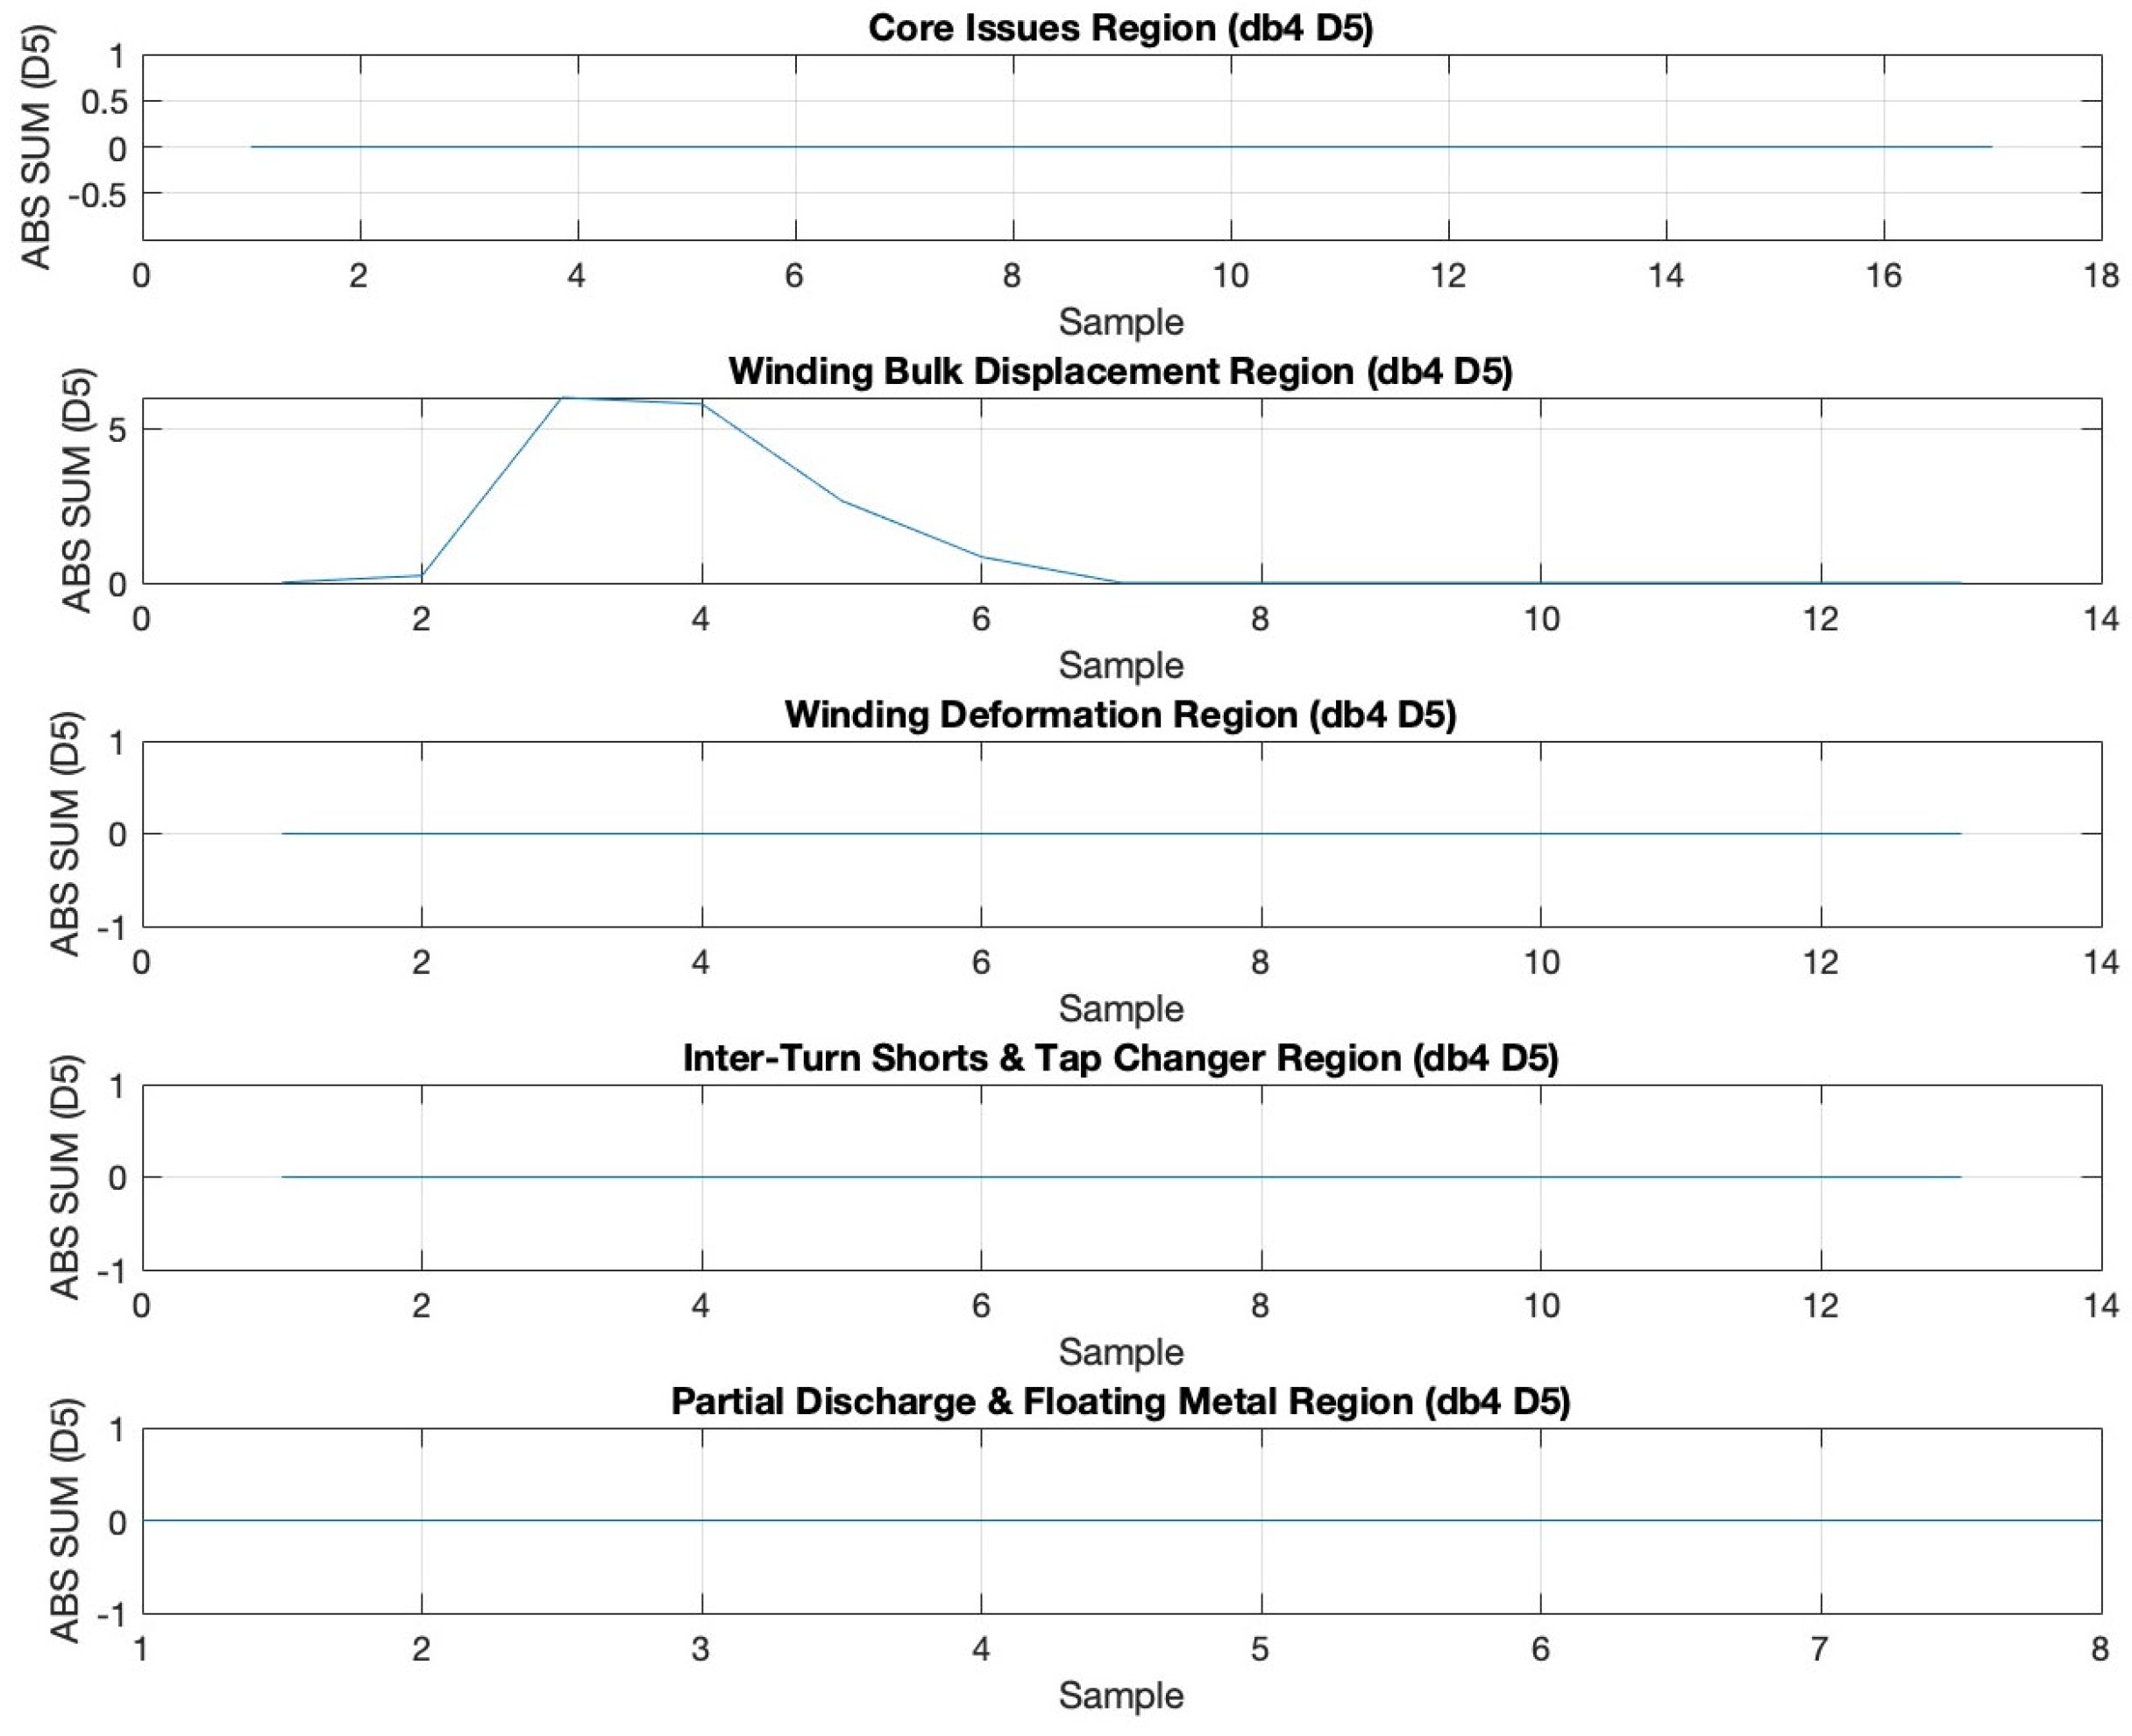
Figure 12.
Case Study 1—Decomposition of FRA deviation signal using db4 wavelet (D5 level) across defined fault regions for TWF diagnosis.
Figure 12.
Case Study 1—Decomposition of FRA deviation signal using db4 wavelet (D5 level) across defined fault regions for TWF diagnosis.
Figure 13.
Case Study 2—FRA signatures obtained in Megger FRAX 101 software.
Figure 13.
Case Study 2—FRA signatures obtained in Megger FRAX 101 software.
Figure 14.
Case Study 2—DWT (db4) decomposition of FRA deviation signal across diagnostic frequency bands.
Figure 14.
Case Study 2—DWT (db4) decomposition of FRA deviation signal across diagnostic frequency bands.
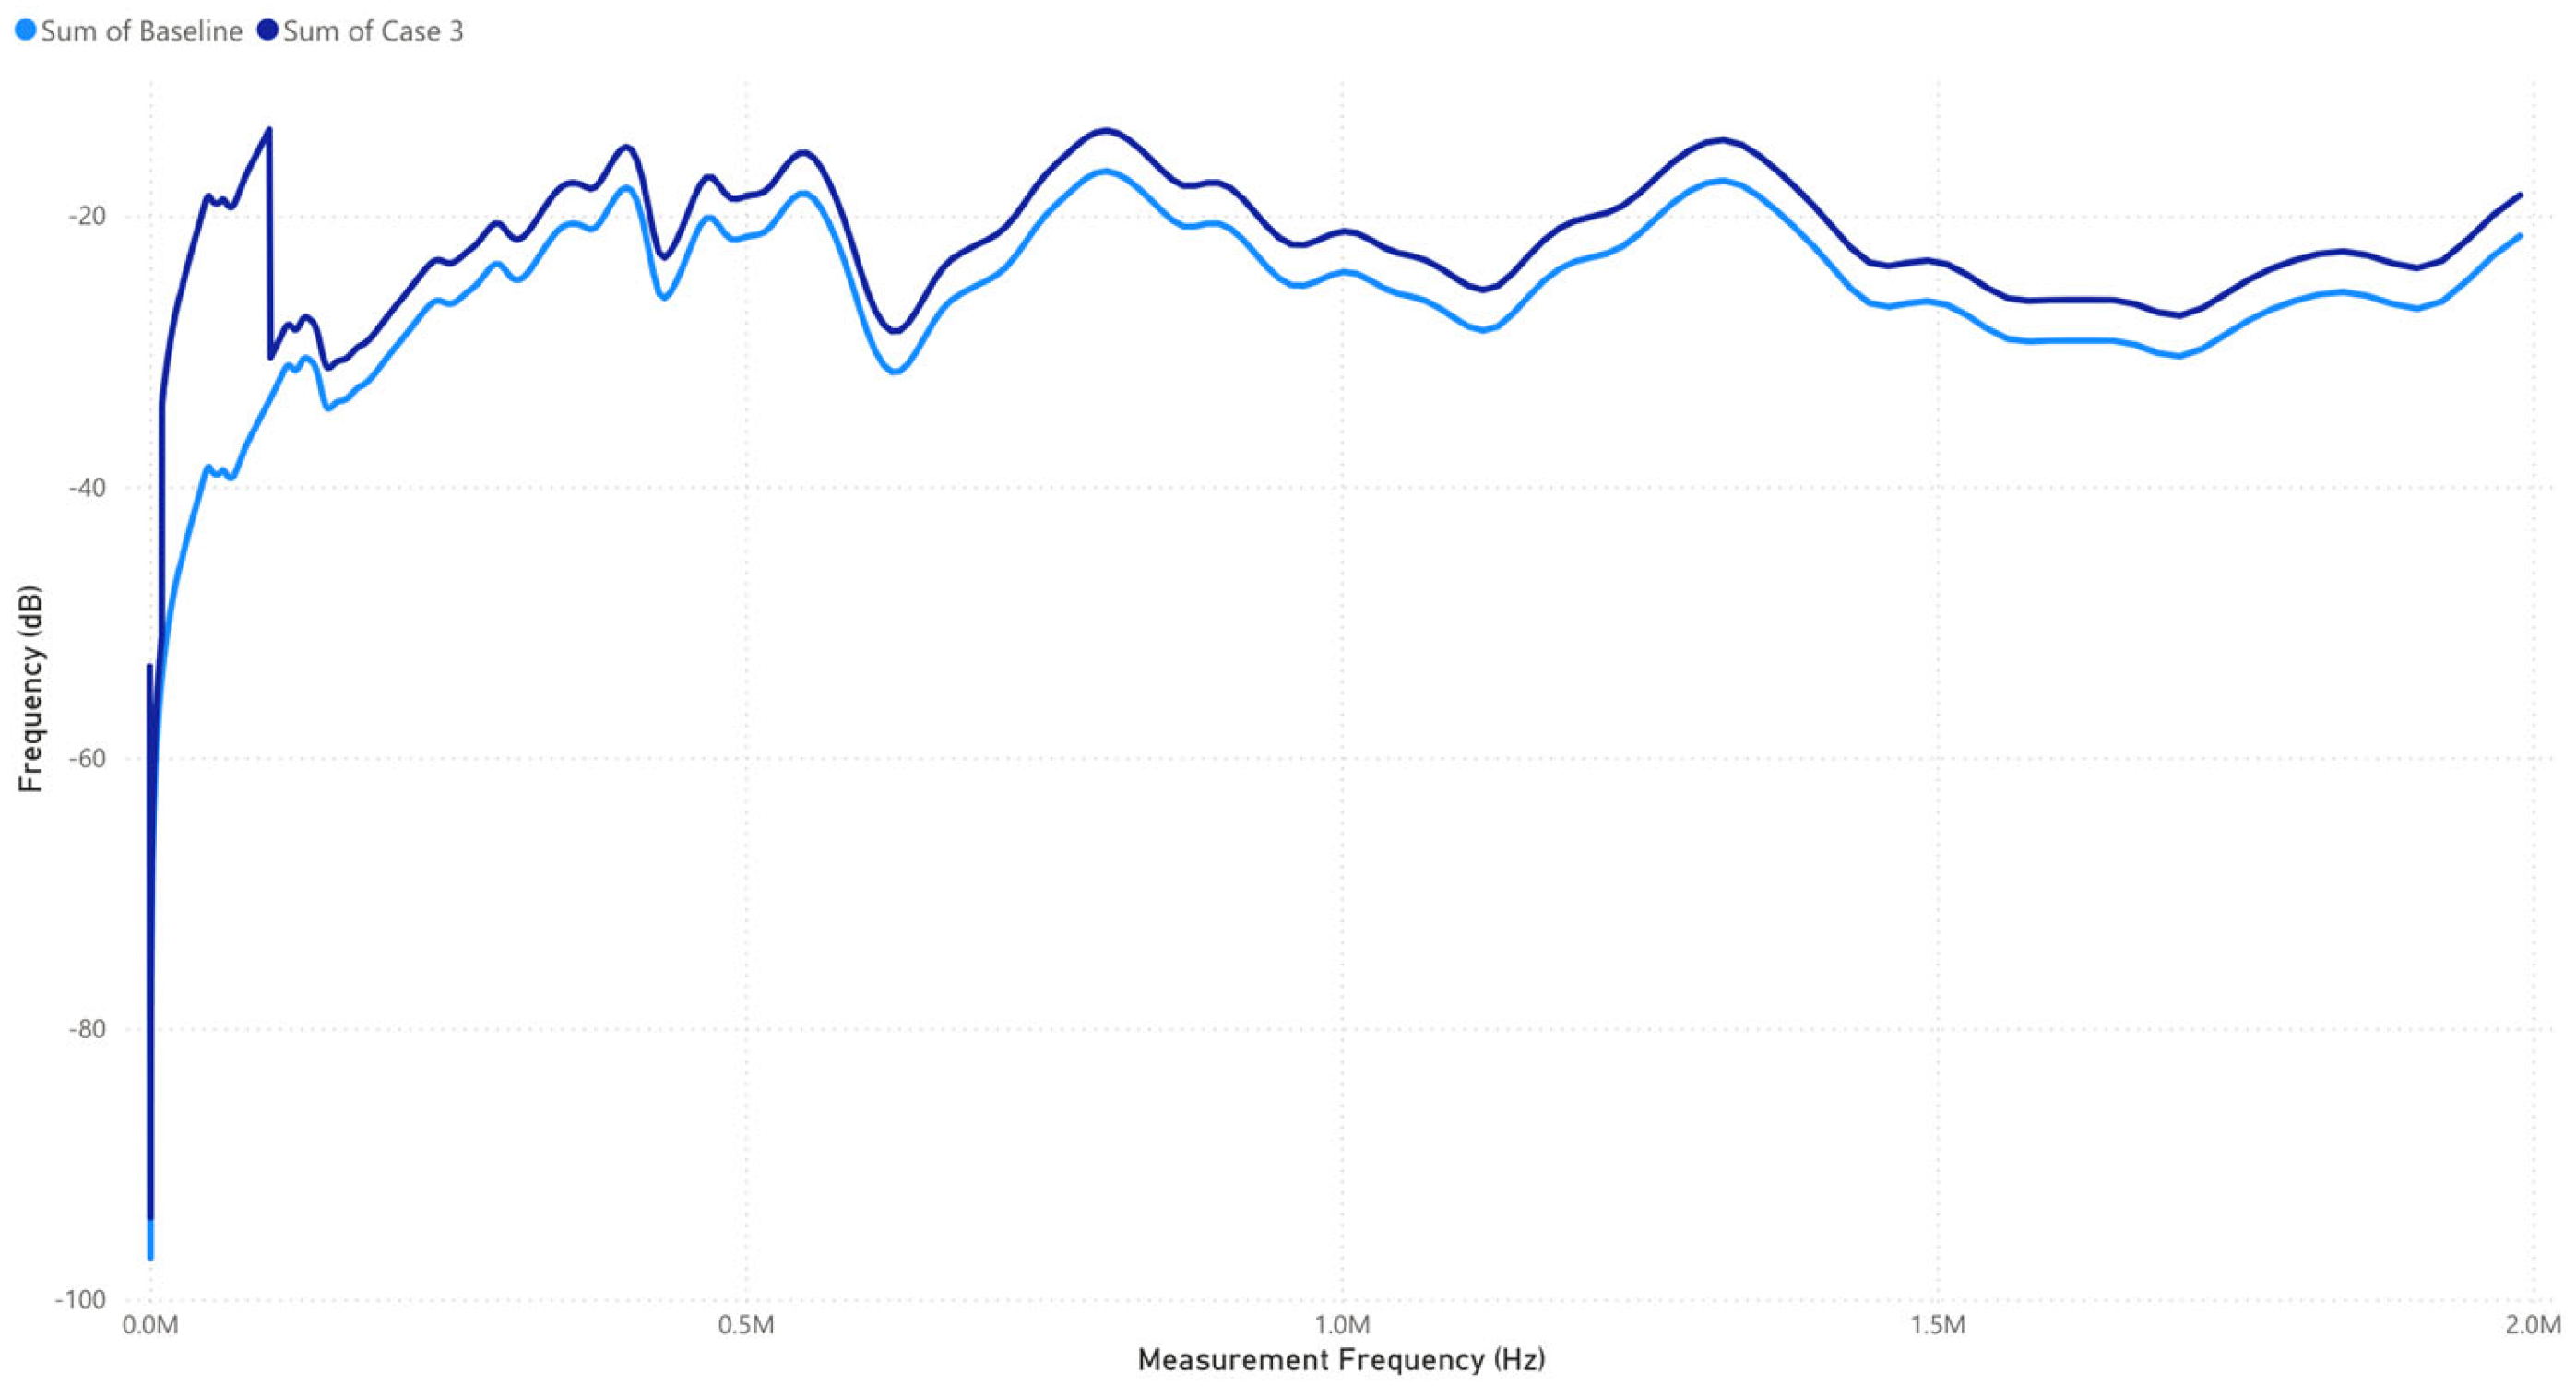
Figure 15.
Case Study 3—FRA signatures acquired via Megger FRAX 101 analyzer.
Figure 15.
Case Study 3—FRA signatures acquired via Megger FRAX 101 analyzer.
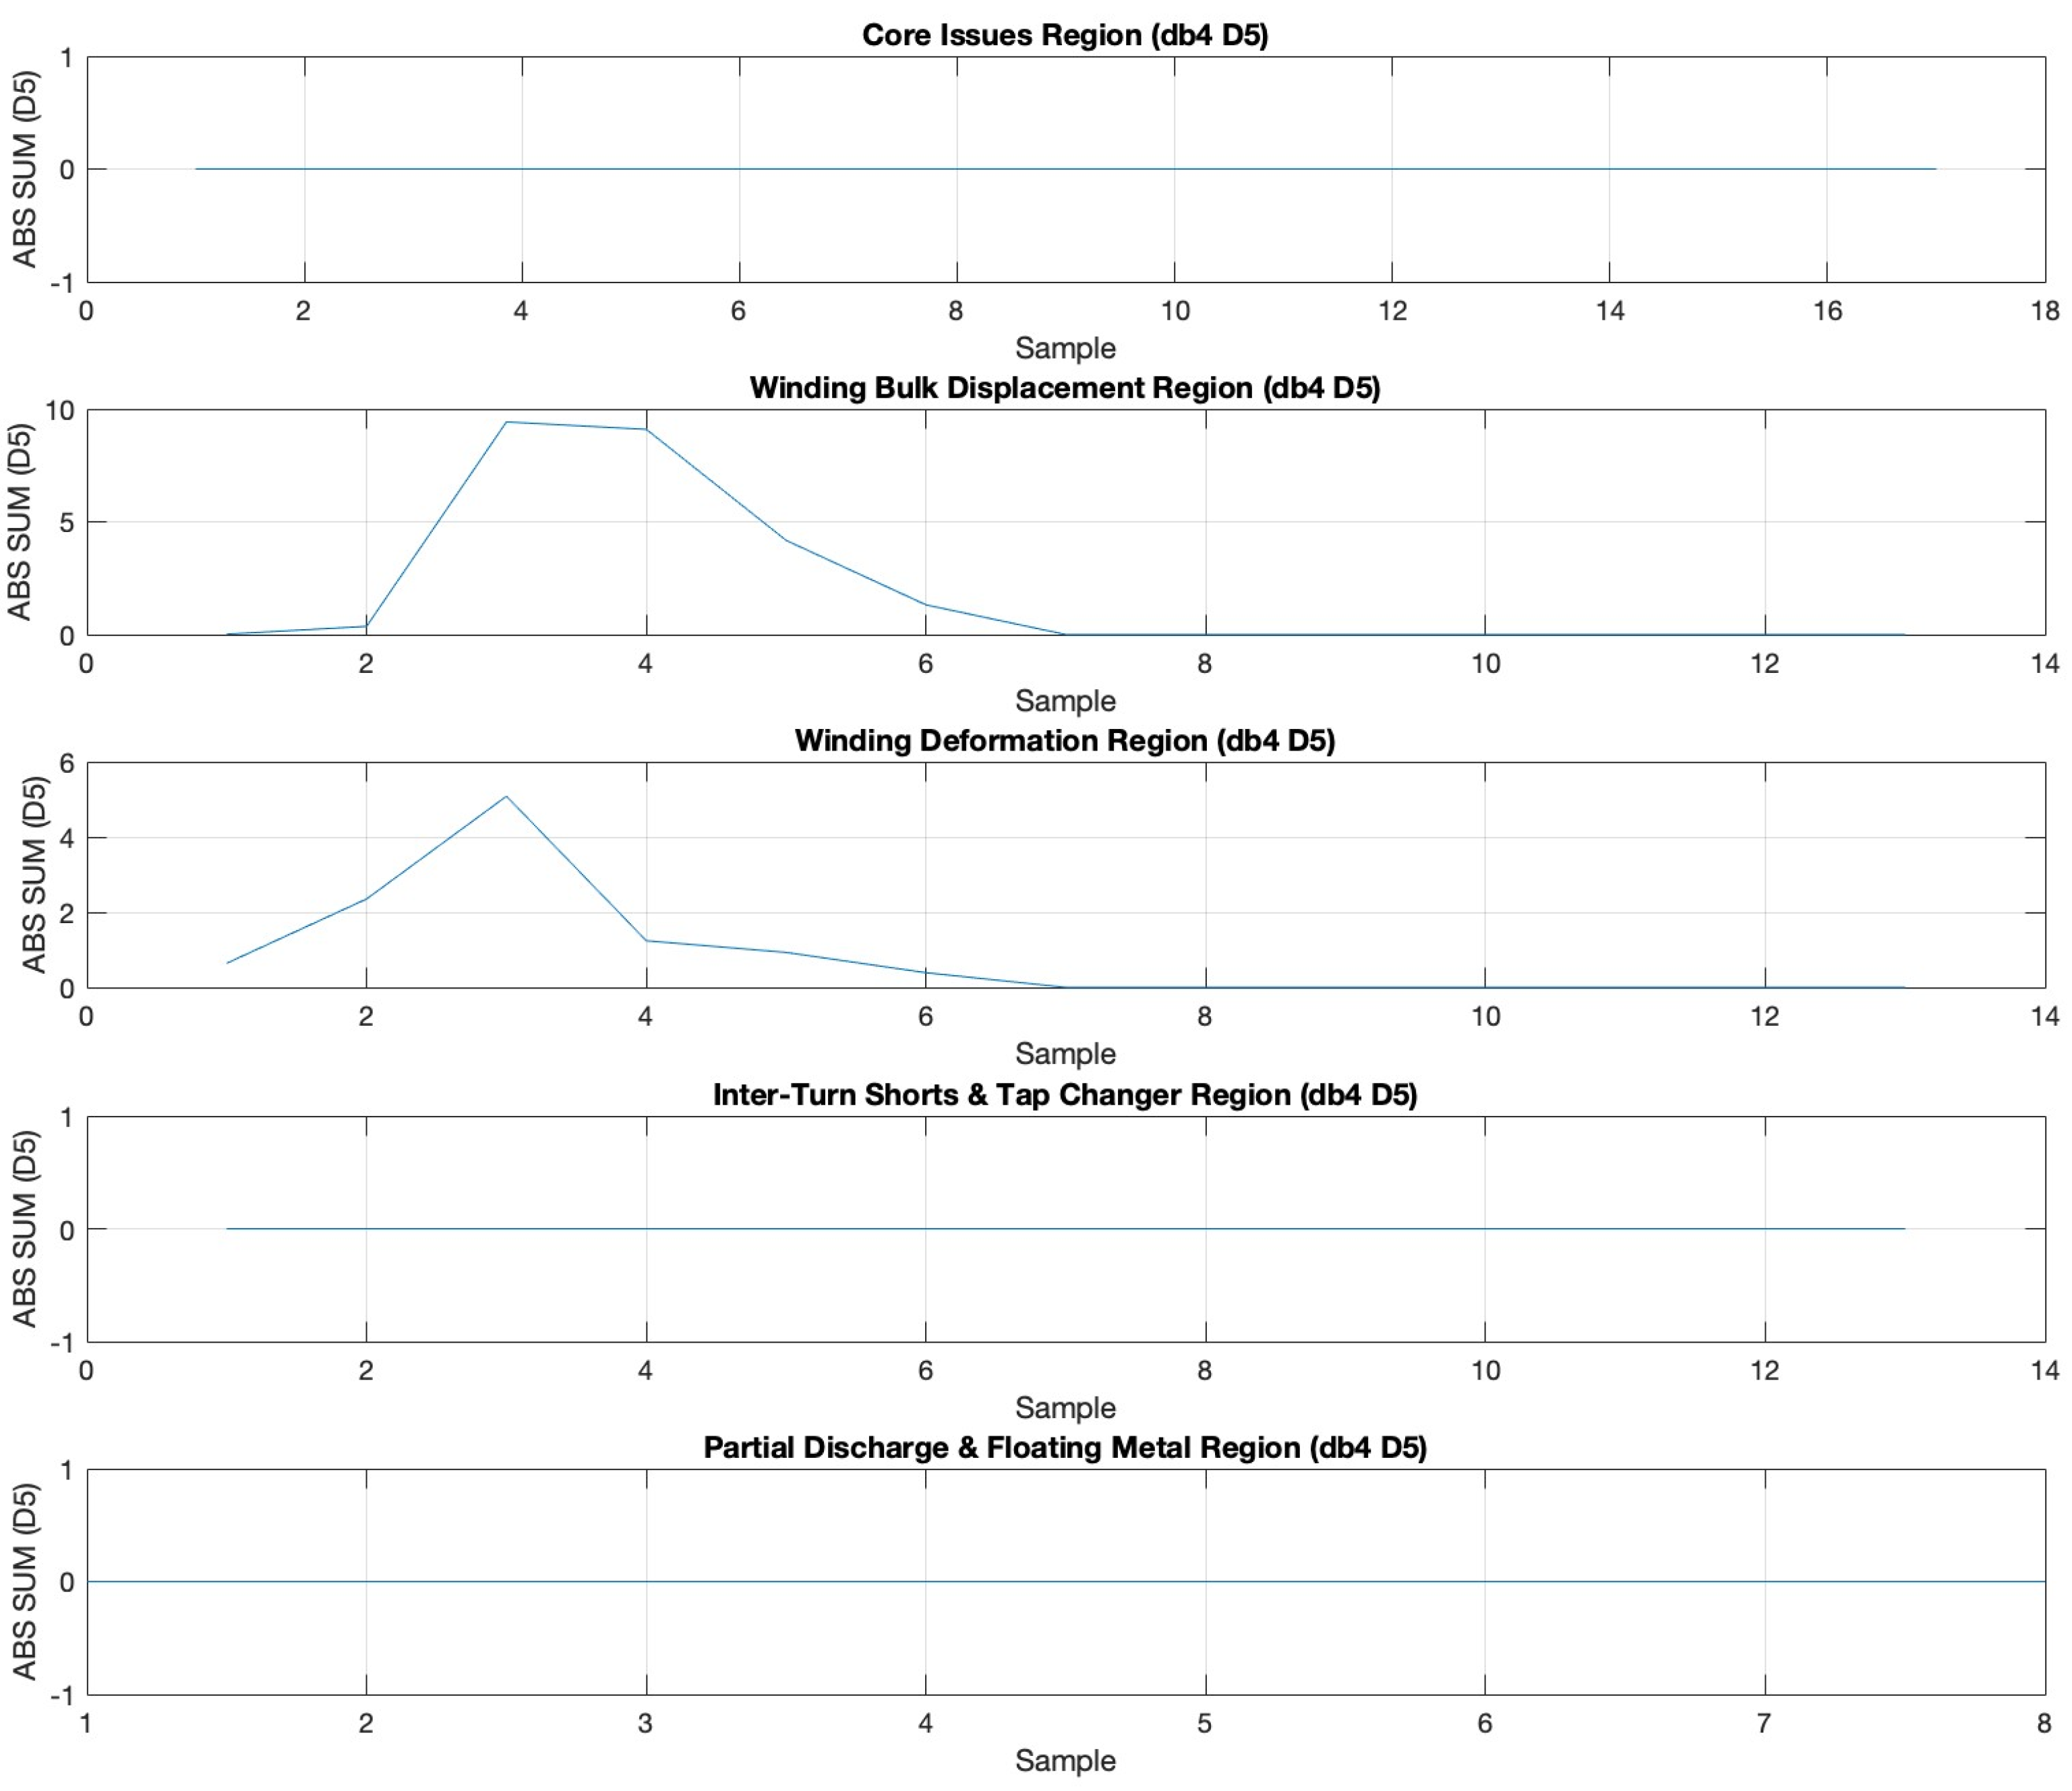
Figure 16.
Case Study 3—db4 wavelet decomposition (D5) of FRA deviation across diagnostic regions.
Figure 16.
Case Study 3—db4 wavelet decomposition (D5) of FRA deviation across diagnostic regions.
Figure 17.
Case Study 4—FRA signatures acquired via Megger FRAX 101 analyzer.
Figure 17.
Case Study 4—FRA signatures acquired via Megger FRAX 101 analyzer.
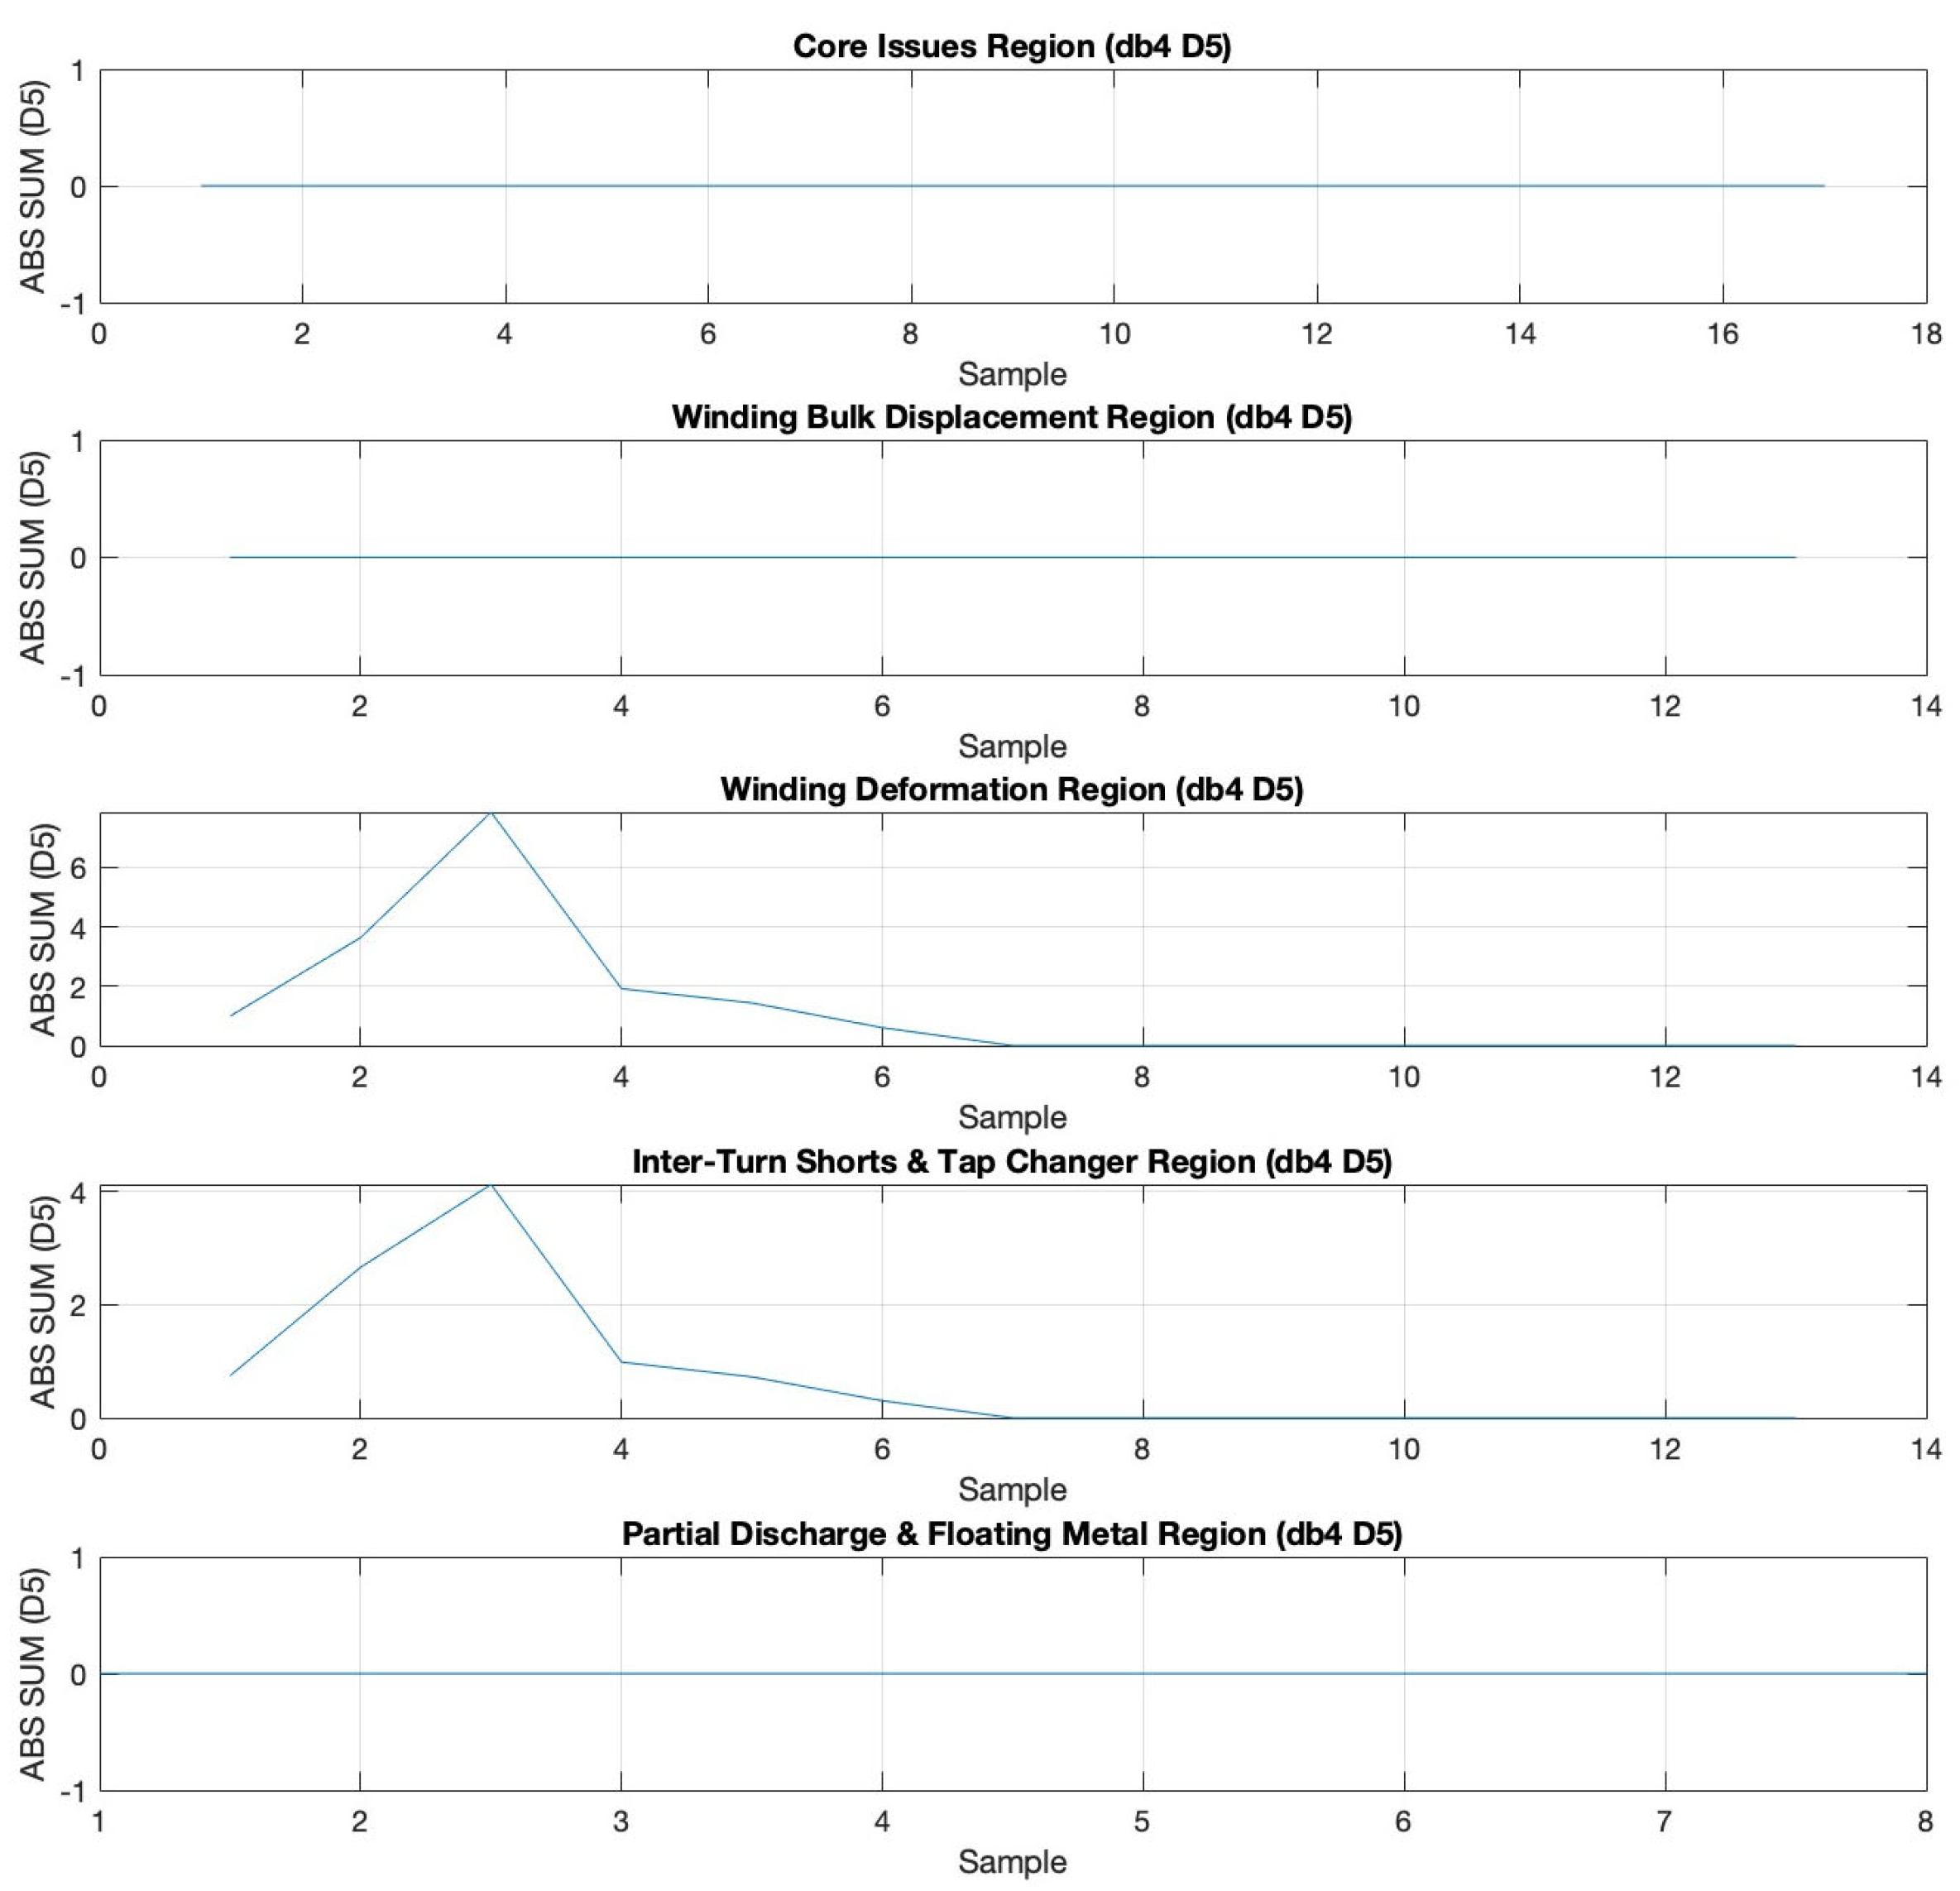
Figure 18.
Case Study 4—DWT decomposition (db4 D5) across diagnostic regions.
Figure 18.
Case Study 4—DWT decomposition (db4 D5) across diagnostic regions.
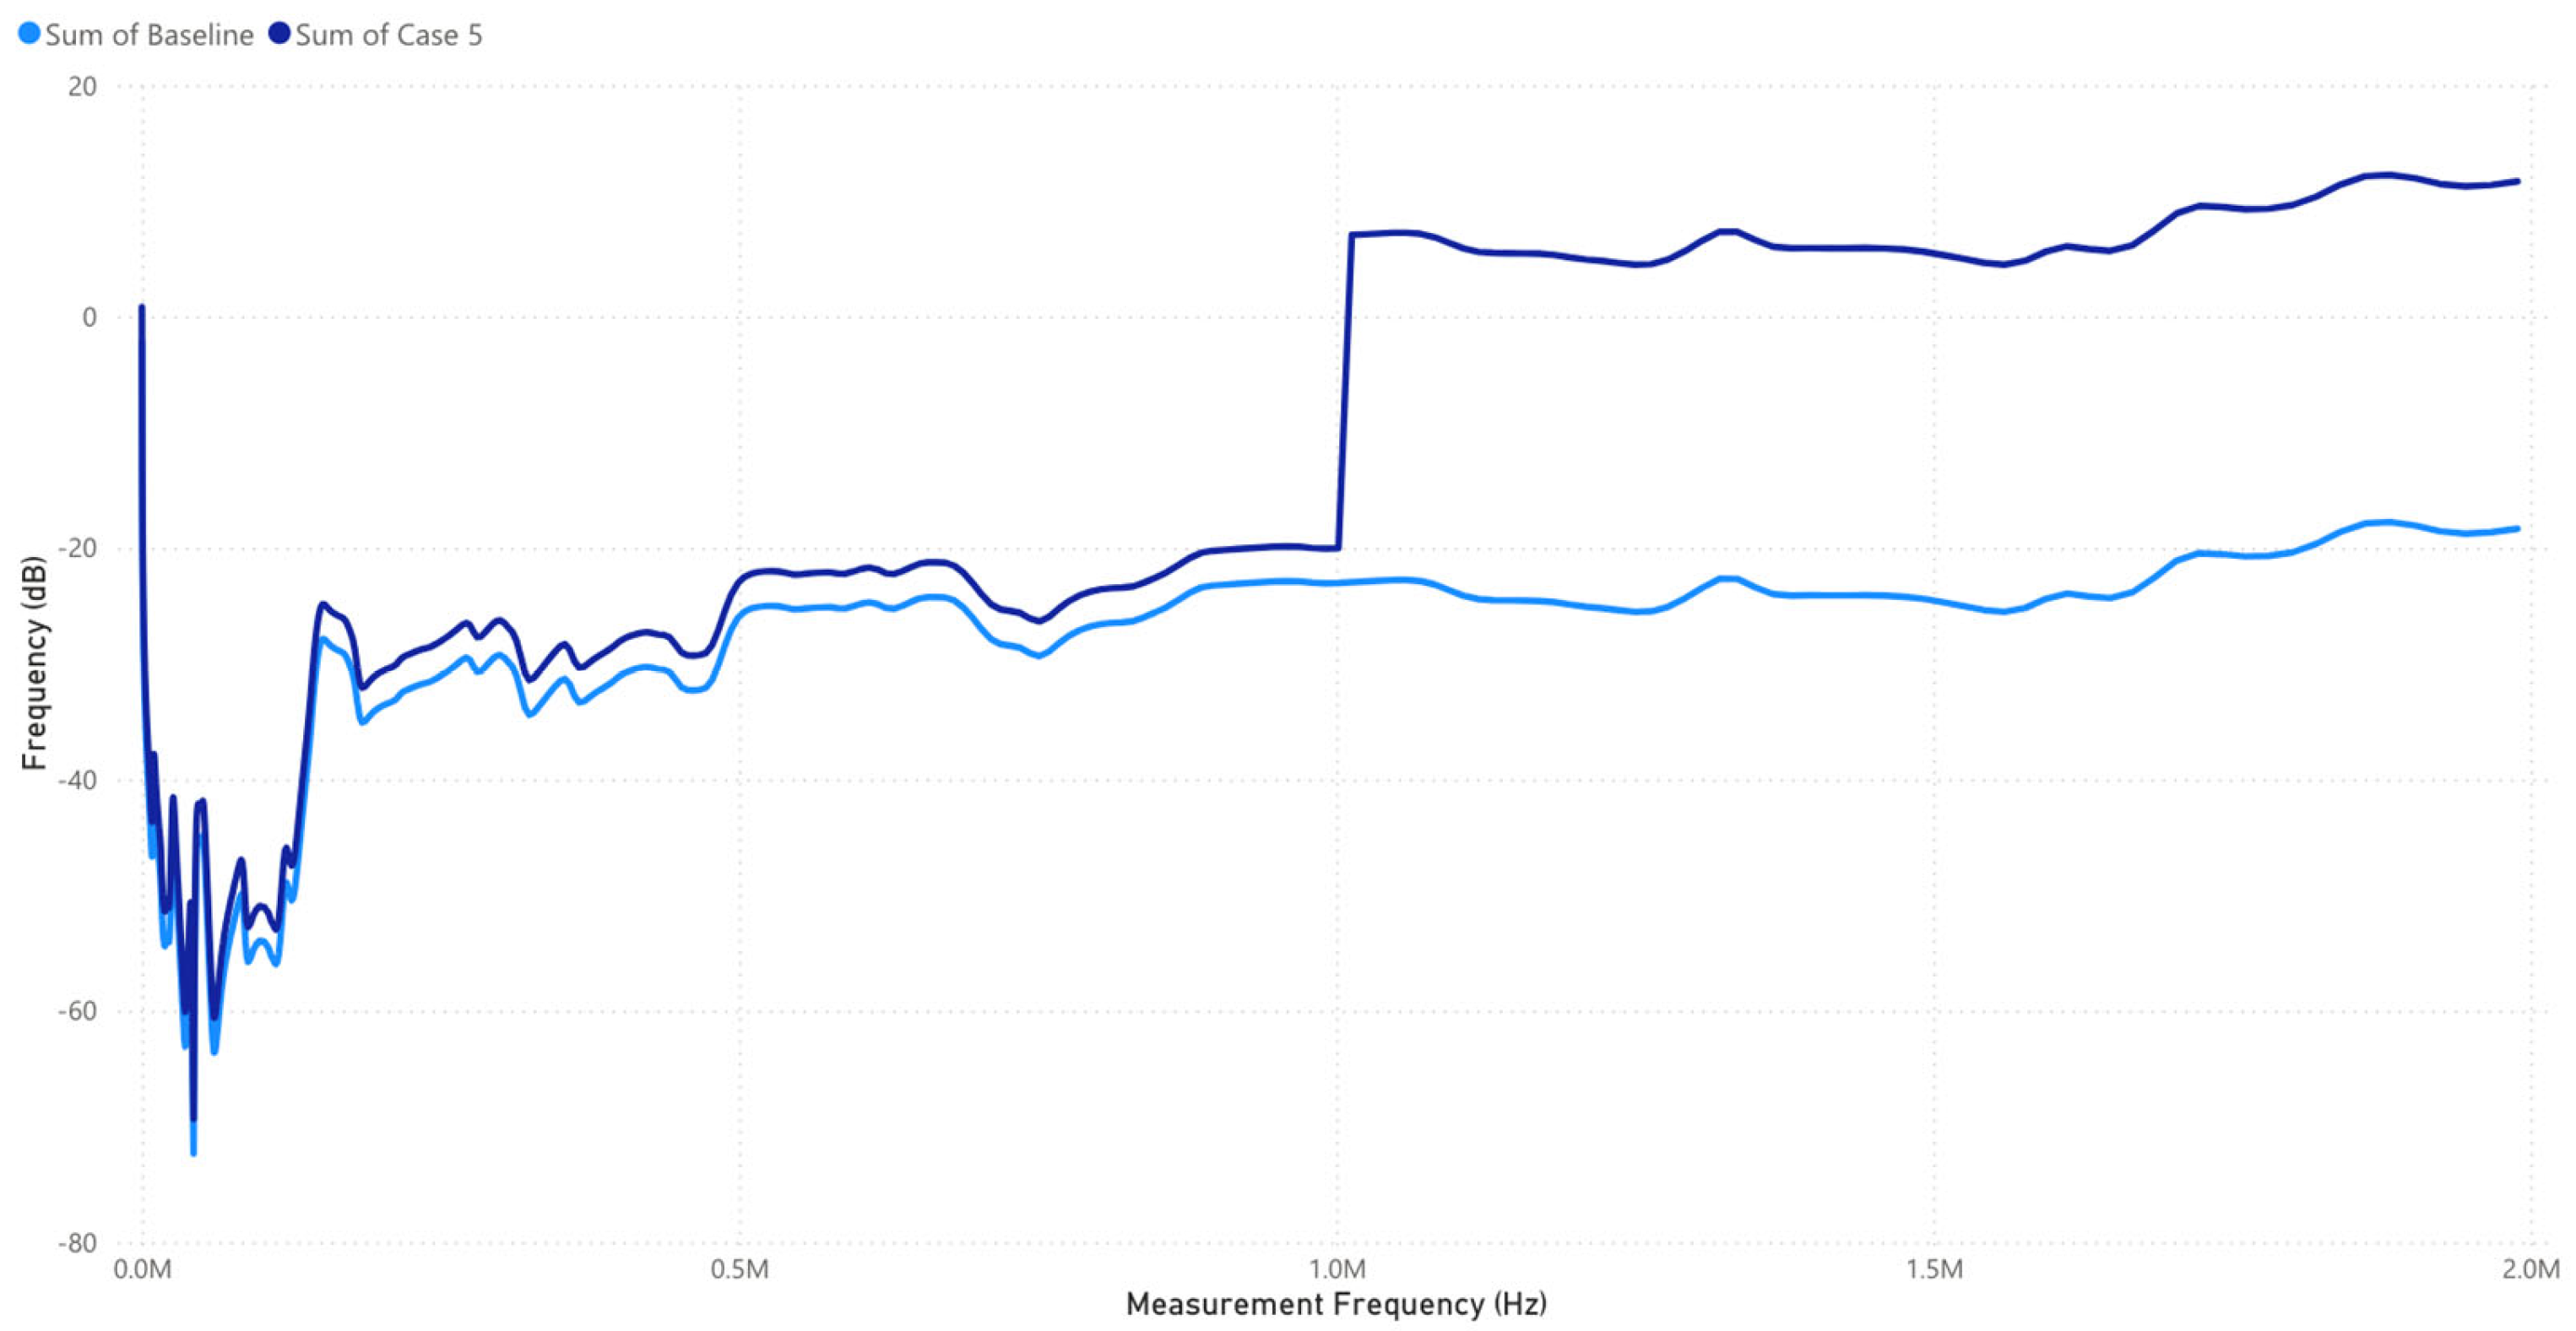
Figure 19.
Case Study 5—FRA signatures acquired via Megger FRAX 101 analyzer.
Figure 19.
Case Study 5—FRA signatures acquired via Megger FRAX 101 analyzer.
Figure 20.
Case Study 5—DWT decomposition (db4 D5) across diagnostic regions.
Figure 20.
Case Study 5—DWT decomposition (db4 D5) across diagnostic regions.
Table 1.
Parameters used in the FRA-based TWF detection model.
Table 1.
Parameters used in the FRA-based TWF detection model.
| FRA Diagnostic Parameter | Typical Range/Threshold |
|---|
| Frequency Range (Full Scan) | 10 Hz–2 MHz |
| Core Issue Detection Band | 10–1000 Hz |
| Bulk Winding Displacement Band | 1000–10,000 Hz |
| Winding Deformation Band | 10,000–100,000 Hz |
| Inter-Turn Short/Tap Changer Band | 100,000–1,000,000 Hz |
| Partial Discharge/Floating Metal | 1,000,000–2,000,000 Hz |
| DWT Decomposition Levels | 5 levels (db4, coif5, sym5) |
| MAPE Fault Threshold | >15% |
| R2 Fault Threshold | <0.80 |
| SVM Output Classes | 0 (Normal), 1 (Fault) |
Table 2.
Case Study 1—Summary of Key Transformer and Test Parameters.
Table 2.
Case Study 1—Summary of Key Transformer and Test Parameters.
| Attribute | Value |
|---|
| Rated Power (MVA) | 6 |
| HV Rating (kV) | 88 |
| LV1/LV2 Rating (kV) | 1.22/1.22 |
| Tertiary Rating (kV) | 2.38 |
| Impedance HV–LV1 (%) | 6.07 |
| Impedance HV–LV2 (%) | 6.14 |
| Impedance HV–Tertiary (%) | 10.07 |
| Tap Changer Type | Offload Tap Changer (DETC) |
| Tap Position During Test | 1 |
| Sweep Frequency Range (Hz) | 20–1,988,018 |
| Input Resistance (Ω) | 50 |
Table 3.
Case Study 1—SVM Trained with coif5 Wavelet.
Table 3.
Case Study 1—SVM Trained with coif5 Wavelet.
| Region | Tested Patterns | Correct | Incorrect |
|---|
| Core Issues | 354 | 283 | 71 |
| Winding Bulk Displacement | 208 | 166 | 42 |
| Winding Deformation | 208 | 166 | 42 |
| Inter-Turn Shorts & Tap Changer | 208 | 166 | 42 |
| Partial Discharge & Floating Metal | 63 | 50 | 13 |
Table 4.
Case Study 1—SVM Trained with sym5 Wavelet (Cross-Validated).
Table 4.
Case Study 1—SVM Trained with sym5 Wavelet (Cross-Validated).
| Region | Tested Patterns | Correct | Incorrect |
|---|
| Core Issues | 354 | 283 | 71 |
| Winding Bulk Displacement | 208 | 166 | 42 |
| Winding Deformation | 208 | 166 | 42 |
| Inter-Turn Shorts & Tap Changer | 208 | 166 | 42 |
| Partial Discharge & Floating Metal | 63 | 50 | 13 |
Table 5.
Case Study 1—SVM Trained with db4 Wavelet (Cross-Validated).
Table 5.
Case Study 1—SVM Trained with db4 Wavelet (Cross-Validated).
| Region | Tested Patterns | Correct | Incorrect |
|---|
| Core Issues | 354 | 283 | 71 |
| Winding Bulk Displacement | 208 | 166 | 42 |
| Winding Deformation | 208 | 166 | 42 |
| Inter-Turn Shorts & Tap Changer | 208 | 166 | 42 |
| Partial Discharge & Floating Metal | 63 | 50 | 13 |
Table 6.
Case Study 1—Scheme Comparison Accuracy (Cross-Validated).
Table 6.
Case Study 1—Scheme Comparison Accuracy (Cross-Validated).
| Method | Accuracy (%) |
|---|
| DWT-SVM | 80 |
| WT-SVM | 50 |
| DWT-FFA | 16.67 |
| WPT-SVM | 80 |
Table 7.
Case Study 1—Statistical Summary by FRA Region.
Table 7.
Case Study 1—Statistical Summary by FRA Region.
| Region | CC | SD | MSE | RMSE | MAE | MAPE | R2 | Label |
|---|
| Core Issues | 1.0000 | 0.0000 | 100.00 | 10.000 | 10.000 | 44.558 | −0.1064 | Fault |
| Winding Bulk Displacement | 0.9859 | 1.3494 | 12.500 | 3.5355 | 3.2692 | 6.539 | 0.7730 | Fault |
| Winding Deformation | 1.0000 | 0.0000 | 9.000 | 3.0000 | 3.0000 | 5.281 | 0.7790 | Fault |
| Inter-Turn Shorts & Tap Changer | 1.0000 | 0.0000 | 9.000 | 3.0000 | 3.0000 | 6.806 | 0.8114 | Normal |
| Partial Discharge & Floating Metal | 1.0000 | 0.0000 | 9.000 | 3.0000 | 3.0000 | 10.640 | 0.6791 | Fault |
Table 8.
Case Study 2—Summary of Key Transformer and Test Parameters.
Table 8.
Case Study 2—Summary of Key Transformer and Test Parameters.
| Attribute | Value |
|---|
| Rated Power (MVA) | 6 |
| HV Rating (kV) | 92.5 |
| LV1/LV2 Rating (kV) | 1.22/1.22 |
| Tertiary Rating (kV) | 2.36 |
| Impedance HV–LV1 (%) | 6.12 |
| Impedance HV–LV2 (%) | 6.18 |
| Impedance HV–Tertiary (%) | 10.14 |
| Tap Changer Type | Offload Tap Changer |
| Tap Position During Test | 1 |
| Sweep Frequency Range (Hz) | 20–1,988,018 |
| Input Resistance (Ω) | 50 |
Table 9.
Case Study 2—SVM Trained with coif5 Wavelet (Cross-Validated).
Table 9.
Case Study 2—SVM Trained with coif5 Wavelet (Cross-Validated).
| Region | Tested Patterns | Correct | Incorrect |
|---|
| Core Issues | 354 | 283 | 71 |
| Winding Bulk Displacement | 208 | 166 | 42 |
| Winding Deformation | 208 | 166 | 42 |
| Inter-Turn Shorts & Tap Changer | 208 | 166 | 42 |
| Partial Discharge & Floating Metal | 63 | 50 | 13 |
Table 10.
Case Study 2—SVM Trained with sym5 Wavelet (Cross-Validated).
Table 10.
Case Study 2—SVM Trained with sym5 Wavelet (Cross-Validated).
| Region | Tested Patterns | Correct | Incorrect |
|---|
| Core Issues | 354 | 283 | 71 |
| Winding Bulk Displacement | 208 | 166 | 42 |
| Winding Deformation | 208 | 166 | 42 |
| Inter-Turn Shorts & Tap Changer | 208 | 166 | 42 |
| Partial Discharge & Floating Metal | 63 | 50 | 13 |
Table 11.
Case Study 2—SVM Trained with db4 Wavelet (Cross-Validated).
Table 11.
Case Study 2—SVM Trained with db4 Wavelet (Cross-Validated).
| Region | Tested Patterns | Correct | Incorrect |
|---|
| Core Issues | 354 | 283 | 71 |
| Winding Bulk Displacement | 208 | 166 | 42 |
| Winding Deformation | 208 | 166 | 42 |
| Inter-Turn Shorts & Tap Changer | 208 | 166 | 42 |
| Partial Discharge & Floating Metal | 63 | 50 | 13 |
Table 12.
Case Study 2—Scheme Comparison Accuracy (Cross-Validated).
Table 12.
Case Study 2—Scheme Comparison Accuracy (Cross-Validated).
| Method | Accuracy (%) |
|---|
| DWT-SVM | 80 |
| WT-SVM | 50 |
| DWT-FFA | 16.67 |
| WPT-SVM | 80 |
Table 13.
Case Study 2—Statistical Summary by FRA Region.
Table 13.
Case Study 2—Statistical Summary by FRA Region.
| Region | CC | SD | MSE | RMSE | MAE | MAPE | R2 | Label |
|---|
| Core Issues | 1.0000 | 0.0000 | 9.000 | 3.0000 | 3.0000 | 4.3067 | 0.96245 | Normal |
| Winding Bulk Displacement | 0.9905 | 2.1205 | 188.81 | 13.741 | 13.577 | 18.737 | 0.03224 | Fault |
| Winding Deformation | 0.9776 | 1.0760 | 10.798 | 3.286 | 3.1058 | 5.5632 | 0.50136 | Fault |
| Inter-Turn Shorts & Tap Changer | 1.0000 | 0.0000 | 9.000 | 3.0000 | 3.0000 | 6.6682 | 0.75290 | Fault |
| Partial Discharge & Floating Metal | 1.0000 | 0.0000 | 9.000 | 3.0000 | 3.0000 | 9.9957 | 0.45604 | Fault |
Table 14.
Case Study 3—Summary of Key Transformer and Test Parameters.
Table 14.
Case Study 3—Summary of Key Transformer and Test Parameters.
| Attribute | Value |
|---|
| Rated Power (MVA) | 0.31 |
| HV Rating (kV) | 22 |
| LV1 Rating (kV) | 0.4 |
| Impedance HV–LV1 (%) | 4.68 |
| Tap Changer Type | Offload Tap Changer |
| Tap Position During Test | 1 |
| Sweep Frequency Range (Hz) | 20–1,988,018 |
| Input Resistance (Ω) | 50 |
Table 15.
Case Study 3—SVM Trained with coif5 Wavelet (Cross-Validated).
Table 15.
Case Study 3—SVM Trained with coif5 Wavelet (Cross-Validated).
| Region | Tested Patterns | Correct | Incorrect |
|---|
| Core Issues | 354 | 212 | 142 |
| Winding Bulk Displacement | 208 | 125 | 83 |
| Winding Deformation | 208 | 125 | 83 |
| Inter-Turn Shorts & Tap Changer | 208 | 125 | 83 |
| Partial Discharge & Floating Metal | 63 | 38 | 25 |
Table 16.
Case Study 3—SVM Trained with sym5 Wavelet (Cross-Validated).
Table 16.
Case Study 3—SVM Trained with sym5 Wavelet (Cross-Validated).
| Region | Tested Patterns | Correct | Incorrect |
|---|
| Core Issues | 354 | 71 | 283 |
| Winding Bulk Displacement | 208 | 42 | 166 |
| Winding Deformation | 208 | 42 | 166 |
| Inter-Turn Shorts & Tap Changer | 208 | 42 | 166 |
| Partial Discharge & Floating Metal | 63 | 13 | 50 |
Table 17.
Case Study 3—SVM Trained with db4 Wavelet (Cross-Validated).
Table 17.
Case Study 3—SVM Trained with db4 Wavelet (Cross-Validated).
| Region | Tested Patterns | Correct | Incorrect |
|---|
| Core Issues | 354 | 142 | 212 |
| Winding Bulk Displacement | 208 | 83 | 125 |
| Winding Deformation | 208 | 83 | 125 |
| Inter-Turn Shorts & Tap Changer | 208 | 83 | 125 |
| Partial Discharge & Floating Metal | 63 | 25 | 38 |
Table 18.
Case Study 3—Scheme Comparison Accuracy (Cross-Validated).
Table 18.
Case Study 3—Scheme Comparison Accuracy (Cross-Validated).
| Method | Accuracy (%) |
|---|
| DWT-SVM | 40 |
| WT-SVM | 50 |
| DWT-FFA | 16.67 |
| WPT-SVM | 40 |
Table 19.
Case Study 3—Statistical Summary by FRA Region.
Table 19.
Case Study 3—Statistical Summary by FRA Region.
| Region | CC | SD | MSE | RMSE | MAE | MAPE | R2 | Label |
|---|
| Core Issues | 1.0000 | 0.0000 | 9.000 | 3.0000 | 3.0000 | 4.5113 | 0.91653 | Normal |
| Winding Bulk Displacement | 1.0000 | 0.0000 | 9.000 | 3.0000 | 3.0000 | 4.6573 | 0.80664 | Normal |
| Winding Deformation | 0.9643 | 1.6630 | 396.24 | 19.906 | 19.837 | 45.826 | −11.396 | Fault |
| Inter-Turn Shorts & Tap Changer | 0.9732 | 1.1787 | 10.880 | 3.2985 | 3.0817 | 12.213 | 0.57752 | Fault |
| Partial Discharge & Floating Metal | 1.0000 | 0.0000 | 9.000 | 3.0000 | 3.0000 | 12.127 | 0.22778 | Fault |
Table 20.
Case Study 4—Summary of Key Transformer and Test Parameters.
Table 20.
Case Study 4—Summary of Key Transformer and Test Parameters.
| Attribute | Value |
|---|
| Rated Power (MVA) | 10 |
| HV Rating (kV) | 44 |
| LV1 Rating (kV) | 11 |
| Impedance HV–LV1 (%) | 11.3 |
| Tap Changer Type | On-load Tap Changer |
| Tap Position During Test | Extreme Raise (Onload) |
| Sweep Frequency Range (Hz) | 20–1,988,018 |
| Input Resistance (Ω) | 50 |
Table 21.
Case Study 4—SVM Trained with coif5 Wavelet (Cross-Validated).
Table 21.
Case Study 4—SVM Trained with coif5 Wavelet (Cross-Validated).
| Region | Tested Patterns | Correct Patterns | Incorrect Patterns |
|---|
| Core Issues | 354 | 142 | 212 |
| Winding Bulk Displacement | 208 | 83 | 125 |
| Winding Deformation | 208 | 83 | 125 |
| Inter-Turn Shorts & Tap Changer | 208 | 83 | 125 |
| Partial Discharge & Floating Metal | 63 | 25 | 38 |
Table 22.
Case Study 4—SVM Trained with sym5 Wavelet (Cross-Validated).
Table 22.
Case Study 4—SVM Trained with sym5 Wavelet (Cross-Validated).
| Region | Tested Patterns | Correct Patterns | Incorrect Patterns |
|---|
| Core Issues | 354 | 142 | 212 |
| Winding Bulk Displacement | 208 | 83 | 125 |
| Winding Deformation | 208 | 83 | 125 |
| Inter-Turn Shorts & Tap Changer | 208 | 83 | 125 |
| Partial Discharge & Floating Metal | 63 | 25 | 38 |
Table 23.
Case Study 4—SVM Trained with db4 Wavelet (Cross-Validated).
Table 23.
Case Study 4—SVM Trained with db4 Wavelet (Cross-Validated).
| Region | Tested Patterns | Correct Patterns | Incorrect Patterns |
|---|
| Core Issues | 354 | 142 | 212 |
| Winding Bulk Displacement | 208 | 83 | 125 |
| Winding Deformation | 208 | 83 | 125 |
| Inter-Turn Shorts & Tap Changer | 208 | 83 | 125 |
| Partial Discharge & Floating Metal | 63 | 25 | 38 |
Table 24.
Case Study 4—Scheme Comparison Accuracy (Cross-Validated).
Table 24.
Case Study 4—Scheme Comparison Accuracy (Cross-Validated).
| Method | Accuracy (%) |
|---|
| DWT-SVM | 40 |
| WT-SVM | 50 |
| DWT-FFA | 16.67 |
| WPT-SVM | 40 |
Table 25.
Case Study 4—Statistical Summary by FRA Region.
Table 25.
Case Study 4—Statistical Summary by FRA Region.
| Region | CC | SD | MSE | RMSE | MAE | MAPE | R2 | Label |
|---|
| Core Issues | 1.0000 | 0 | 9.000 | 3.000 | 3.000 | 6.6968 | 0.91099 | 0 |
| Winding Bulk Displacement | 1.0000 | 0 | 9.000 | 3.000 | 3.000 | 5.8349 | 0.91553 | 0 |
| Winding Deformation | 1.0000 | 0 | 9.000 | 3.000 | 3.000 | 7.9835 | 0.86153 | 0 |
| Inter-Turn Shorts & Tap Changer | 0.98334 | 1.1787 | 398.12 | 19.953 | 19.918 | 49.907 | –10.283 | 1 |
| Partial Discharge & Floating Metal | 0.27609 | 2.1418 | 15.206 | 3.8995 | 3.2698 | 9.7595 | –60.933 | 1 |
Table 26.
Case Study 5—Summary of Key Transformer and Test Parameters.
Table 26.
Case Study 5—Summary of Key Transformer and Test Parameters.
| Attribute | Value |
|---|
| Rated Power (MVA) | 20 |
| HV Rating (kV) | 88 |
| LV1 Rating (kV) | 11 |
| Impedance HV–LV1 (%) | 11.6 |
| Tap Changer Type | On-load Tap Changer |
| Tap Position During Test | Extreme Raise (Onload) |
| Sweep Frequency Range (Hz) | 20–1,988,018 |
| Input Resistance (Ω) | 50 |
Table 27.
Case Study 5—SVM Trained with Coif5 Wavelet (Cross-Validated).
Table 27.
Case Study 5—SVM Trained with Coif5 Wavelet (Cross-Validated).
| Region | Tested Patterns | Correct | Incorrect |
|---|
| Core Issues | 354 | 283 | 71 |
| Winding Bulk Displacement | 208 | 166 | 42 |
| Winding Deformation | 208 | 166 | 42 |
| Inter-Turn Shorts & Tap Changer | 208 | 166 | 42 |
| Partial Discharge & Floating Metal | 63 | 50 | 13 |
Table 28.
Case Study 5—SVM Trained with Sym5 Wavelet (Cross-Validated).
Table 28.
Case Study 5—SVM Trained with Sym5 Wavelet (Cross-Validated).
| Region | Tested Patterns | Correct | Incorrect |
|---|
| Core Issues | 354 | 283 | 71 |
| Winding Bulk Displacement | 208 | 166 | 42 |
| Winding Deformation | 208 | 166 | 42 |
| Inter-Turn Shorts & Tap Changer | 208 | 166 | 42 |
| Partial Discharge & Floating Metal | 63 | 50 | 13 |
Table 29.
Case Study 5—SVM Trained with db4 Wavelet (Cross-Validated).
Table 29.
Case Study 5—SVM Trained with db4 Wavelet (Cross-Validated).
| Region | Tested Patterns | Correct | Incorrect |
|---|
| Core Issues | 354 | 283 | 71 |
| Winding Bulk Displacement | 208 | 166 | 42 |
| Winding Deformation | 208 | 166 | 42 |
| Inter-Turn Shorts & Tap Changer | 208 | 166 | 42 |
| Partial Discharge & Floating Metal | 63 | 50 | 13 |
Table 30.
Case Study 5—Scheme Comparison Accuracy (Cross-Validated).
Table 30.
Case Study 5—Scheme Comparison Accuracy (Cross-Validated).
| Method | Accuracy (%) |
|---|
| DWT-SVM | 80 |
| WT-SVM | 50 |
| DWT-FFA | 16.67 |
| WPT-SVM | 80 |
Table 31.
Case Study 5—Statistical Summary by FRA Region.
Table 31.
Case Study 5—Statistical Summary by FRA Region.
| Region | CC | SD | MSE | RMSE | MAE | MAPE | R2 | Label |
|---|
| Core Issues | 1.0000 | 0 | 9.000 | 3.000 | 3.000 | 48.695 | 0.83183 | Fault |
| Winding Bulk Displacement | 1.0000 | 0 | 9.000 | 3.000 | 3.000 | 8.6295 | 0.75824 | Fault |
| Winding Deformation | 1.0000 | 0 | 9.000 | 3.000 | 3.000 | 5.8521 | 0.75396 | Fault |
| Inter-Turn Shorts & Tap Changer | 1.0000 | 0 | 9.000 | 3.000 | 3.000 | 9.7571 | 0.87226 | Normal |
| Partial Discharge & Floating Metal | 0.5548 | 3.4017 | 885.86 | 29.76 | 29.57 | 130.12 | −175.23 | Fault |


