In the initial phase, experimental measurements were conducted at the velocity measurement gates, wherein a series of thirteen measurements was executed. For each projectile discharge, both the barrel velocity and the velocity upon achieving a flight distance of 98 m were recorded. Utilizing the aforementioned simplified relation (Equation (7)), the G1 ballistic coefficient was determined, and the experimentally measured velocity drop over the specified distance was evaluated in comparison to the manufacturer’s provided values. Additionally, the influence of barrel temperature on the obtained results was assessed.
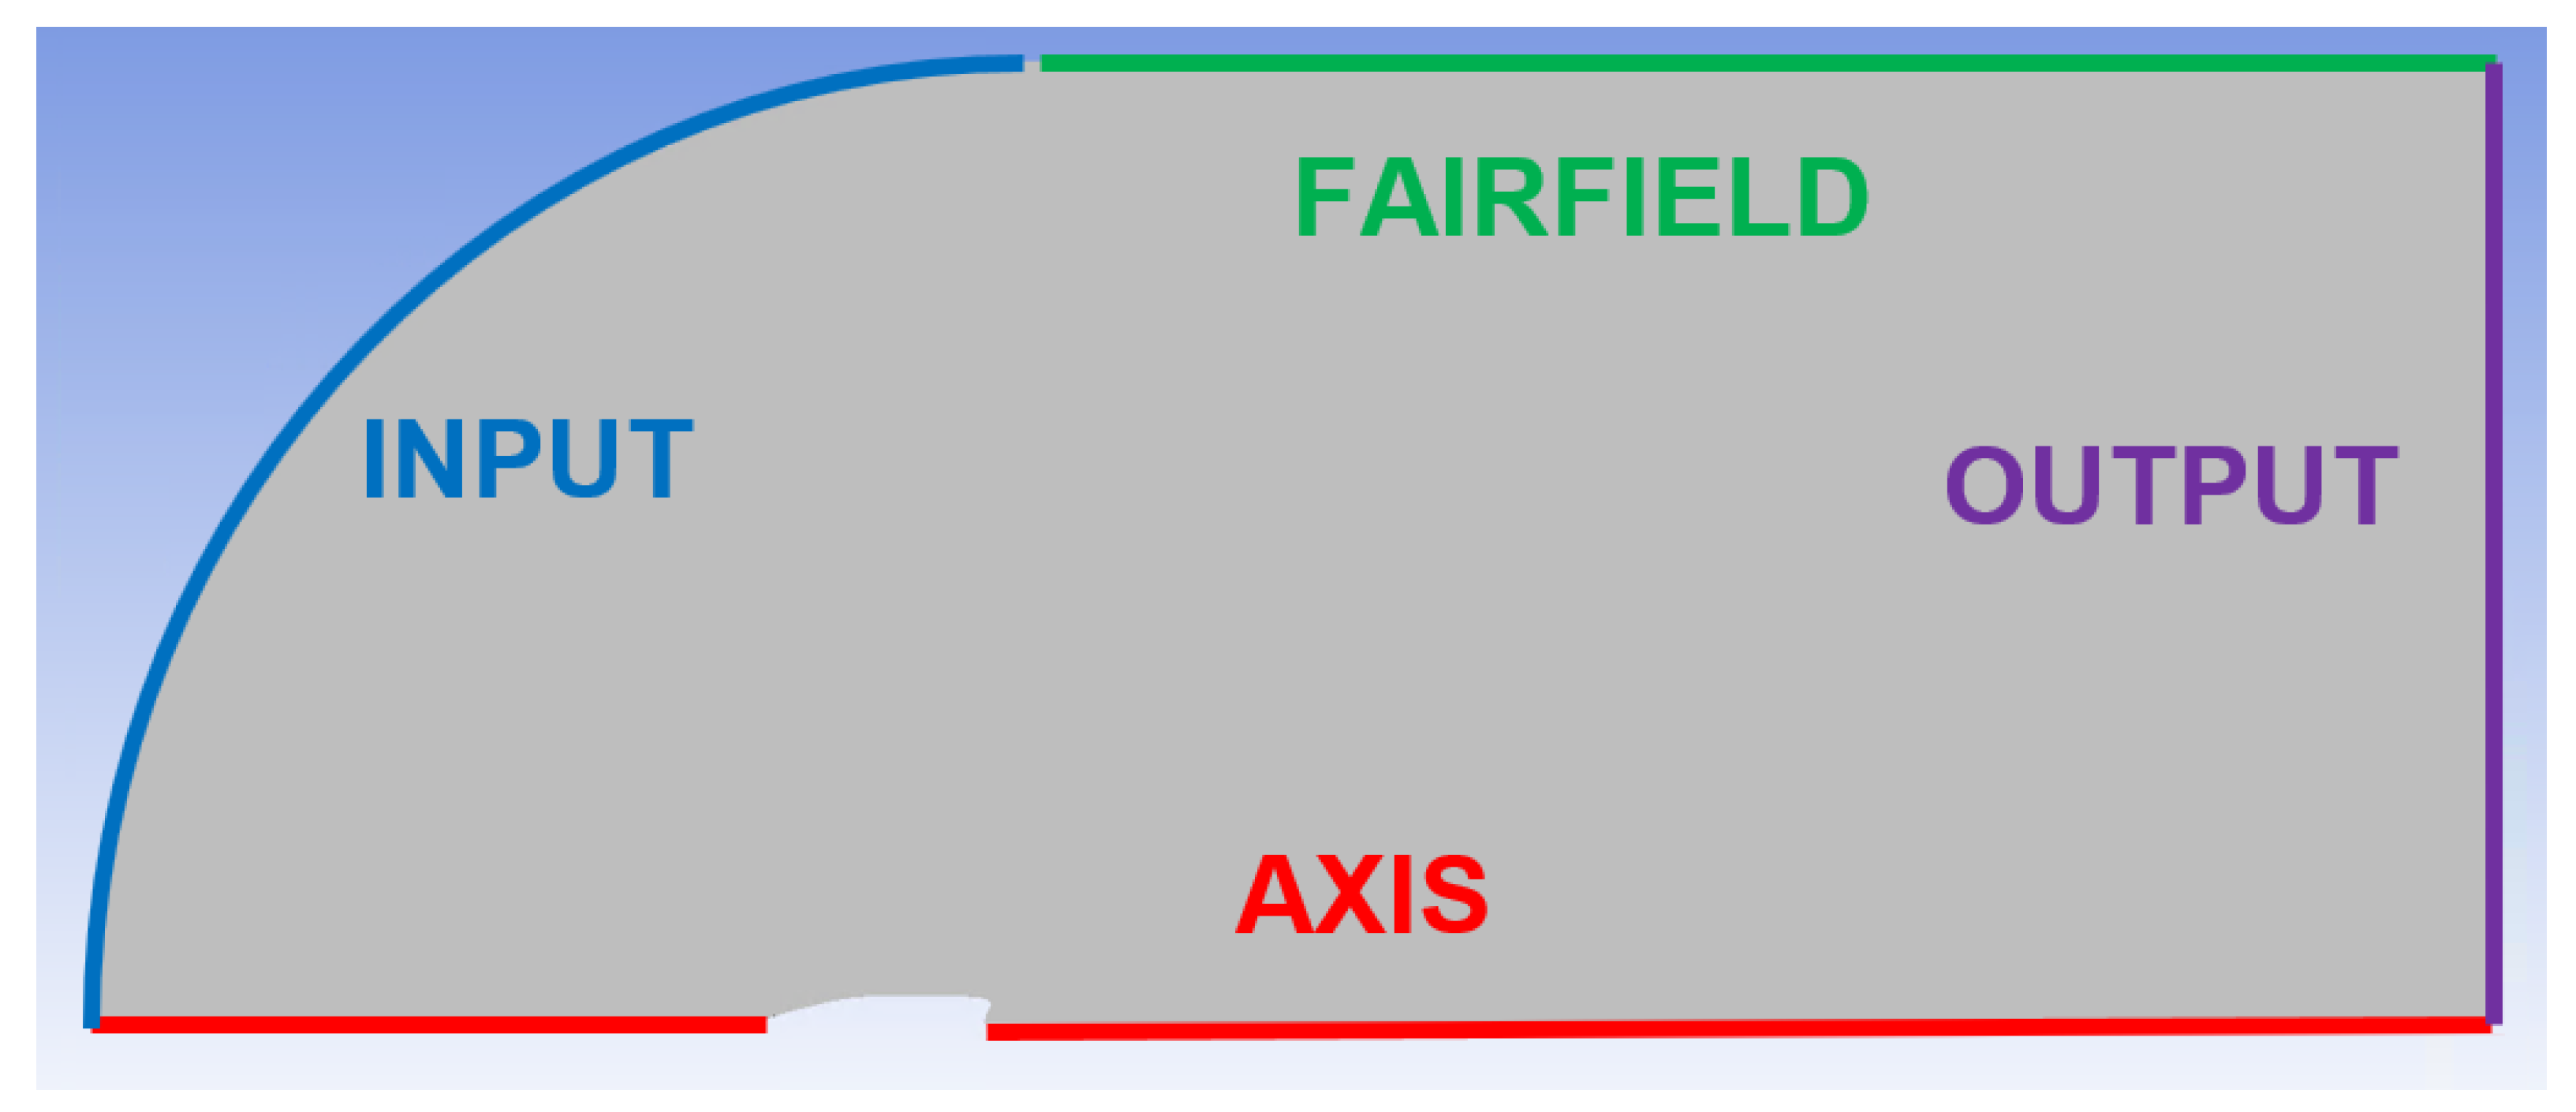
CFD analyses were performed within the Ansys Fluent environment to evaluate the drag force acting on a 2D axisymmetric projectile model derived from a 3D volumetric representation. The 3D model of the projectile geometry was acquired through 3D scanning technology using a HandyScan BLACK device, which possesses an accuracy specification commencing at ±0.025 mm. The volumetric accuracy is determined by the formula 0.020 mm + 0.040 mm·m−1, thus indicating that the projectile was scanned with an accuracy of 0.04 mm. The scanning procedure was executed at SolidVision Brno (Czech Republic).
3.1. Experimental Measurements Conducted on Electronic Gates
A series of experimental firings was conducted. The experiments were performed under the following conditions: an indoor firing range temperature of 22 °C, an atmospheric pressure of 101,400 Pa, and a relative humidity of 46%.
Following the removal of outliers, a selection of 12 data points was extracted from the results. These data points represent pairs of velocity measurements: the initial barrel velocity,
v0, and the projectile velocity after traversing 98 m,
v98. The results are presented in
Table 6.
Twelve repeated experimental measurements of velocity loss were conducted, and the averaged values were utilized for further analysis. To evaluate the measurement error, the Standard Error of the Mean (
SEM) methodology was employed, and the results are given in
Table 7. The
SEM represents the standard deviation of the sampling distribution of the sample mean, derived from data obtained as a random sample from the population. It is a quantity that indicates the extent to which the obtained sample mean is likely to deviate from the true population mean.
The evaluation was performed based on Equation (17):
where
σ [Pa] is the standard deviation of the sample, and
n is the quantity of data points from which the mean was evaluated.
From the obtained results, the G1 ballistic coefficient was determined for each measurement using the aforementioned simplified methodology.
The results demonstrate that the experimentally determined G1 value is marginally higher than that specified by the manufacturer (
Table 6), indicating an enhanced ability of the projectile to overcome aerodynamic resistance. This discrepancy may be attributed to the experimental firing, which exhibited a slightly elevated barrel velocity, exceeding 900 [m/s], compared to the manufacturer’s stated value (
Table 6). This difference likely stems from the fact that the manufacturer’s test firing was conducted using a rifle with a 20-inch barrel, whereas our experiment utilized a 22-inch barrel, thereby facilitating a more complete utilization of the propellant energy.
The experiment demonstrated a relatively consistent velocity deceleration across the examined trajectory in all trials, as illustrated in the graphics (
Figure 7). Based on statistical computations, outliers exhibiting extreme deviation from the mean, as determined by the Standard Error of the Mean (SEM), were excluded from the complete dataset of the results (
Figure 7a). The occurrence of these anomalies is typically attributed to factors such as inconsistent propellant loading or projectile imbalance.
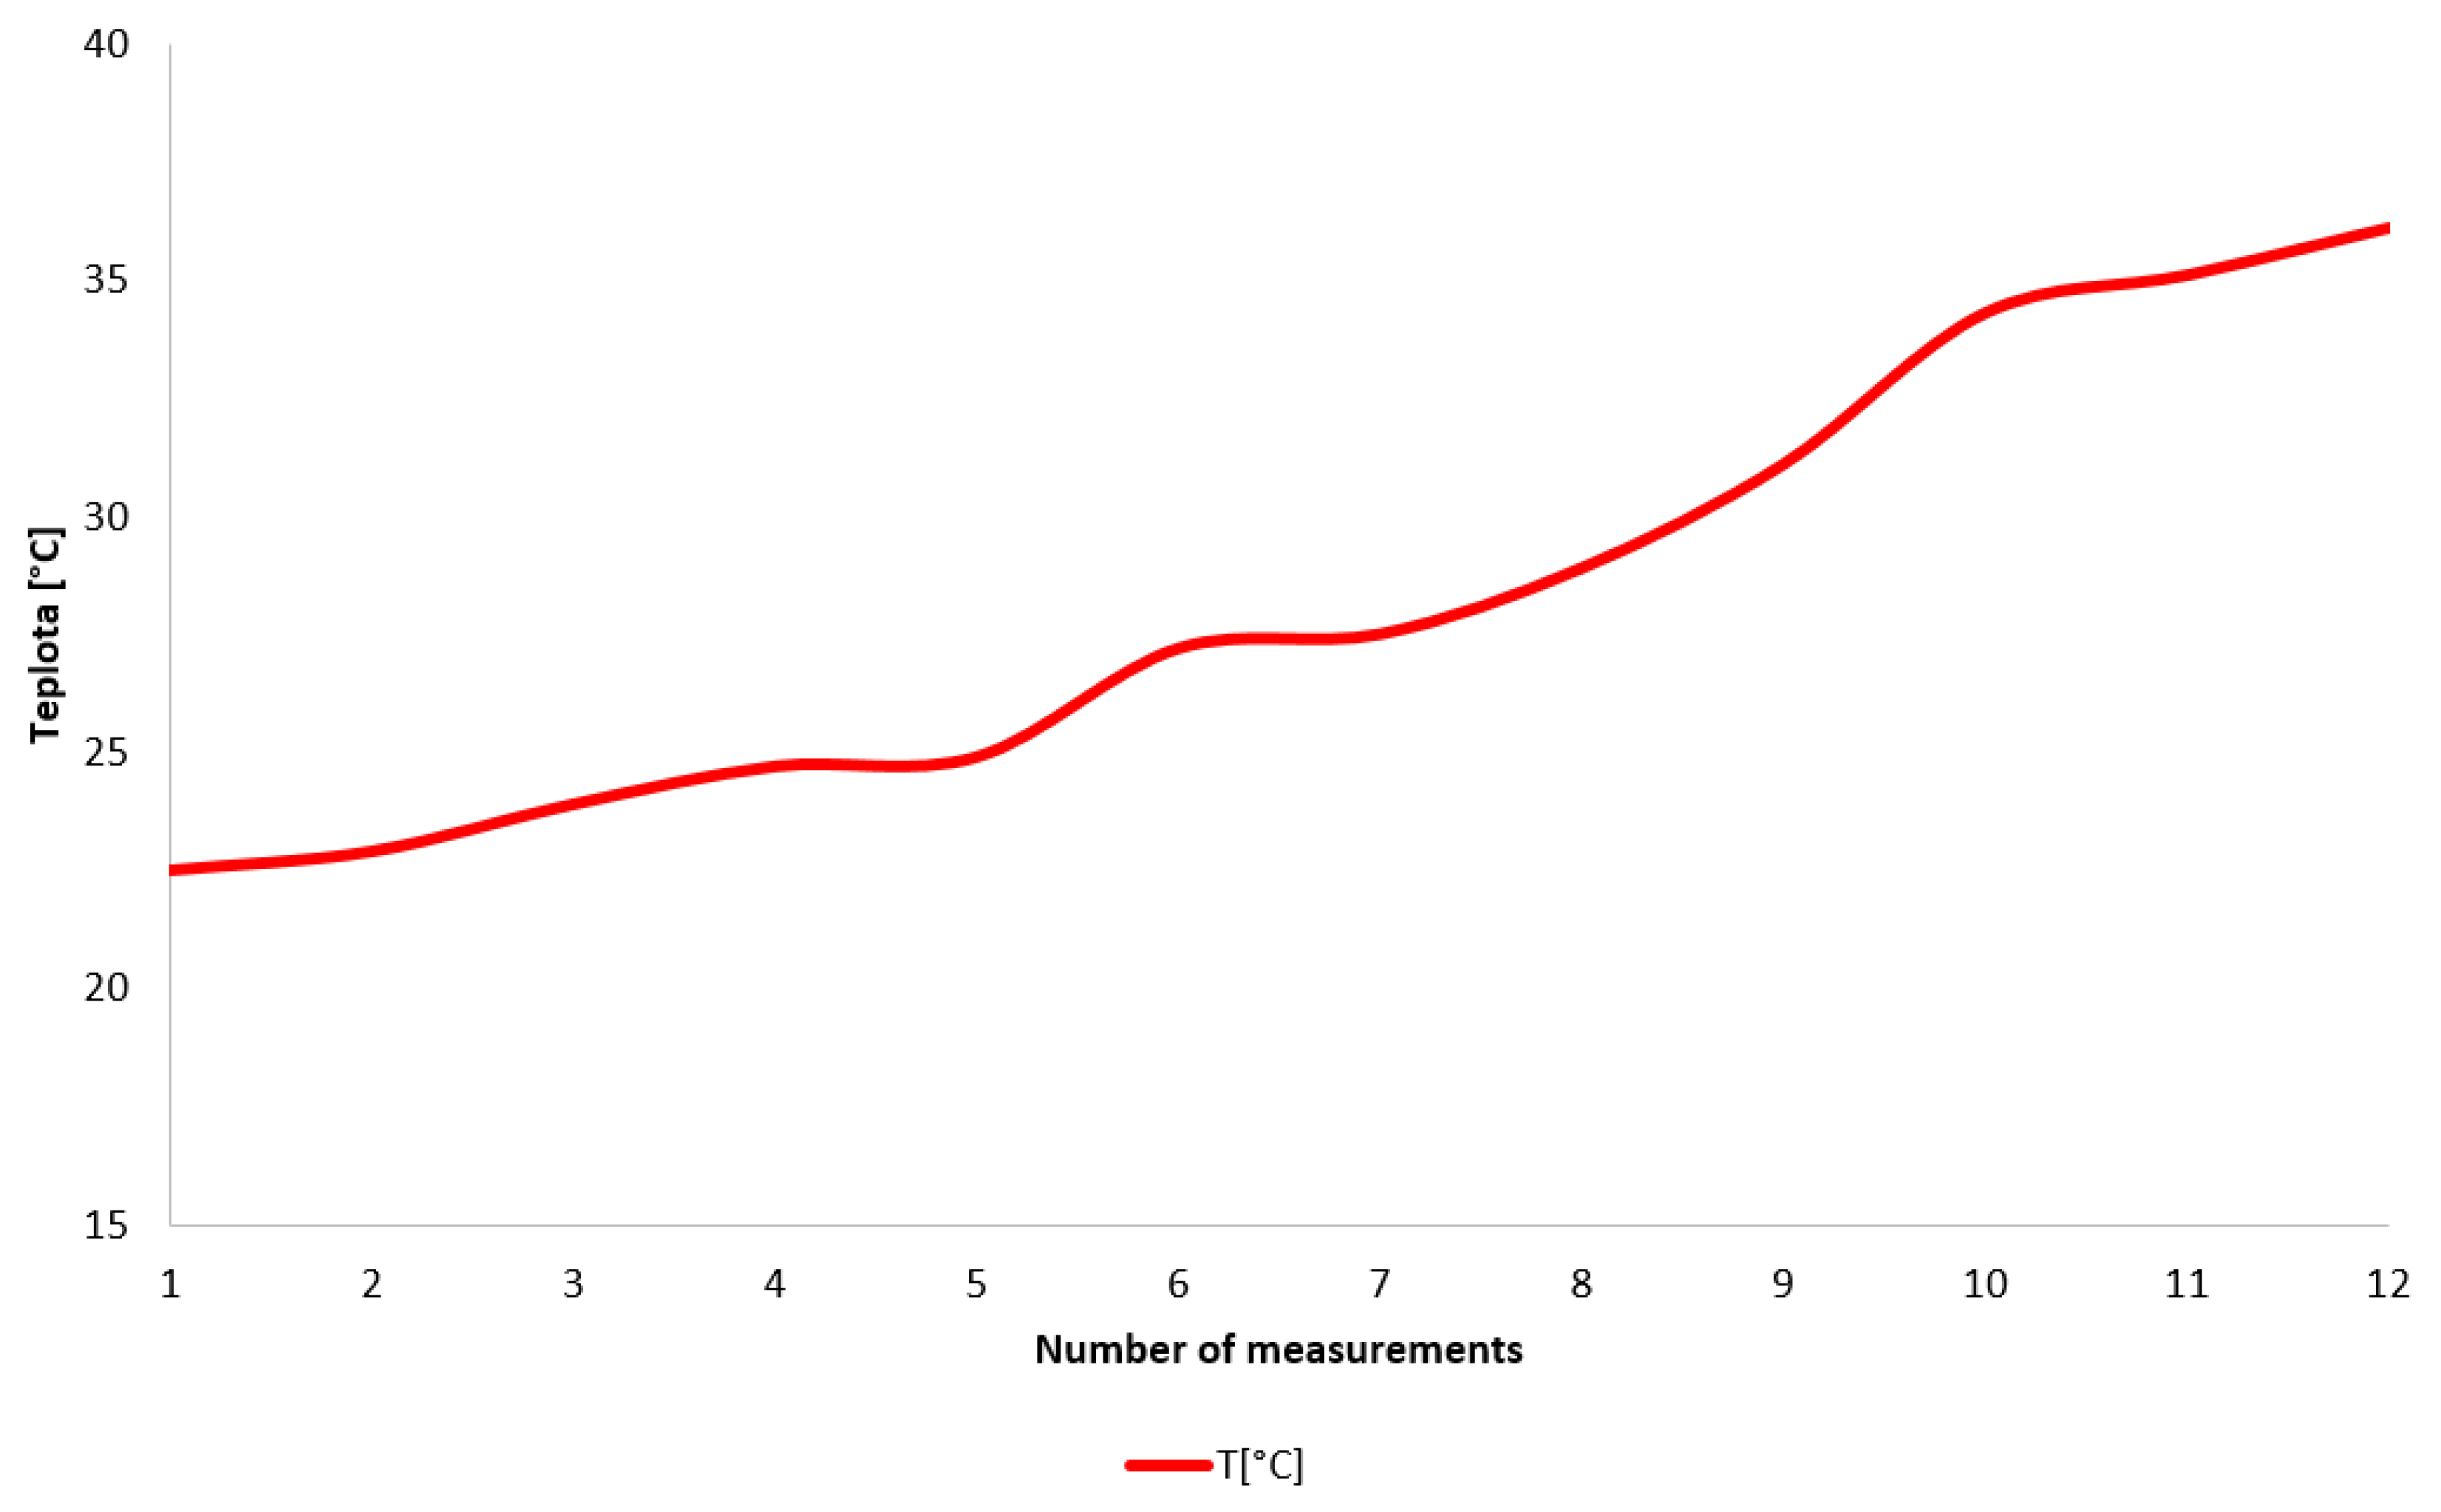
Figure 7b illustrates the subset of results that fall within the established deviation criteria. One contributing factor to the observed variations in the results is the increasing temperature, particularly during the experimental measurements. The temperature progression is recorded in
Table 6 and presented graphically in
Figure 8 for enhanced clarity.
Utilizing the preceding results, it is possible to interpret the disparity in the velocity profiles along the projectile’s trajectory between those provided by the manufacturer and our experimental findings.
Figure 9 illustrates the manufacturer’s reported velocity profile [
21], depicting a decrease from a muzzle velocity of 800 m·s
−1 to 577 m·s
−1 upon reaching a trajectory distance of 400 m.
This velocity profile is juxtaposed with the velocity profile obtained from our experiment, wherein average values of muzzle velocities and velocities upon reaching a distance of 98 m were recorded. It is evident from the profiles that the utilization of a rifle with a barrel length extended by 2 inches and the attainment of a higher muzzle velocity, which, in prior results, yielded an elevated ballistic coefficient (BC), results in a diminished velocity decay over the trajectory.
3.3. CFD Analyses Results
CFD analyses were performed to evaluate the drag force at selected velocities (
Table 9). Subsequently, the drag coefficient was determined using Equation (20) derived from Equation (3). The results are presented in
Table 9 and graphically depicted in
Figure 11:
As depicted in
Figure 11, three discernible regions are evident on the curve representing the drag force magnitude.
The first region is characterized by subsonic flow, wherein the gas flow surrounding the projectile remains subsonic, and the drag force increases proportionally to the square of the velocity. Within this domain, the augmentation of the drag force is relatively gradual. Specifically, up to 0.3 Mach, negligible compression and localized density increases occur, which would otherwise impede the projectile’s motion.
A second region of interest is the abrupt increase in drag force observed during transonic velocity regimes, specifically at the point of transition across the Mach number boundary. This surge in drag is attributed to the formation of shock waves propagating ahead of the object, generating supplementary resistance due to a localized increase in air density, which can reach an order of magnitude as the projectile traverses the medium.
The third region is characterized by supersonic velocities, wherein the rate of increase in drag force, while still significant relative to subsonic velocities, exhibits a diminished gradient compared to the transonic region.
In the supersonic regime, the drag force exhibits behavior distinct from that observed in subsonic conditions and is composed of wave drag, friction drag, and pressure drag. Wave drag arises from the formation of shock waves propagating ahead of the object and constitutes the dominant component of the drag force within the supersonic regime.
Skin friction drag, arising from the interaction of air with an object’s surface, exhibits diminished significance in the supersonic regime compared to wave drag. Pressure drag, conversely, originates from the compression of air both preceding and following the projectile. Within the supersonic domain, pressure waves propagate at the speed of sound, culminating in the formation of a shock wave.
In the transonic regime, as the projectile velocity approaches the speed of sound, a sharp increase in pressure drag is observed. This phenomenon is attributed to the intensified compression of air ahead of the projectile, resulting in the formation of a shock wave.
However, upon exceeding the speed of sound and entering the supersonic regime, the rate of increase in drag force decelerates. This phenomenon arises from the stabilization of the shock wave, whose form undergoes negligible alteration with further projectile velocity augmentation. Consequently, the pressure drag no longer escalates at the rapid pace observed during the transonic transition.
Furthermore, in the supersonic regime, the influence of frictional drag becomes increasingly evident, exhibiting a gradual rise in magnitude concurrent with the projectile’s velocity. Consequently, the total drag experienced within the supersonic region is a composite of pressure drag and frictional drag, wherein the former no longer demonstrates the steep ascent observed during the transitional flow regime.
Figure 12 presents a comparative analysis of the drag coefficient (
Cd) results derived from CFD simulations using Ansys Fluent, juxtaposed with the fundamental G1 and G7 ballistic coefficient curves, as well as the G1 and G7 curves specifically adapted for the .223 rem caliber projectile under investigation. It is evident that, as anticipated, the G7 function exhibits a significantly closer correlation for this slender projectile. This concordance, characterized by minimal deviations, is noteworthy.
As evident in
Figure 9, the barrel length indirectly influences the practically observed ballistic coefficient by affecting the projectile’s muzzle velocity.
Figure 12 then illustrates that a longer barrel enables a higher muzzle velocity to be achieved. This is attributed to the propellant gases exerting force on the projectile for an extended duration, consequently accelerating it further. The ballistic coefficient of a projectile is not entirely constant and varies as a function of its velocity. This variation arises from the changes in aerodynamic drag across different velocity regimes (subsonic, transonic, and supersonic).
In this case, a longer barrel increases the projectile’s muzzle velocity, such that during its flight along the examined 98 m trajectory, the projectile operates within higher velocity regimes where the condition holds that increased velocity corresponds to a lower ballistic coefficient. Under these circumstances, for the .223 rem caliber, which is generally designed as a lighter, higher-velocity projectile, the barrel length influences the effective ballistic coefficient, which manifests in the projectile’s trajectory [
21,
32,
33].
The coefficients G1 and G7 are the most frequently used drag functions in ballistics for describing the aerodynamic resistance of projectiles. The G1 coefficient represents an older and more traditional standard, predicated on a projectile with a flat base and a short, rounded nose, commonly referred to as a ‘spitzer’. It is particularly suited for older projectile designs and those with lower ballistic coefficients. Conversely, the G7 coefficient represents a more contemporary and precise standard for rifle projectiles, modeling a projectile with a long, slender nose and a tapered boat tail. It is particularly apt for modern projectiles with high ballistic coefficients, employed in long-range shooting, and more accurately reflects the behavior of contemporary projectiles [
34].
These observations will become apparent in
Section 3.3, where it will be demonstrated that the G7 function is significantly more suitable for the examined caliber.
Also, the G7 model maintains a high degree of generality; Ansys Fluent possesses the capability to capture a broader spectrum of flow phenomena. Subsequently, the fine-tuned model was employed for a detailed analysis of flow dynamics and shock wave character.
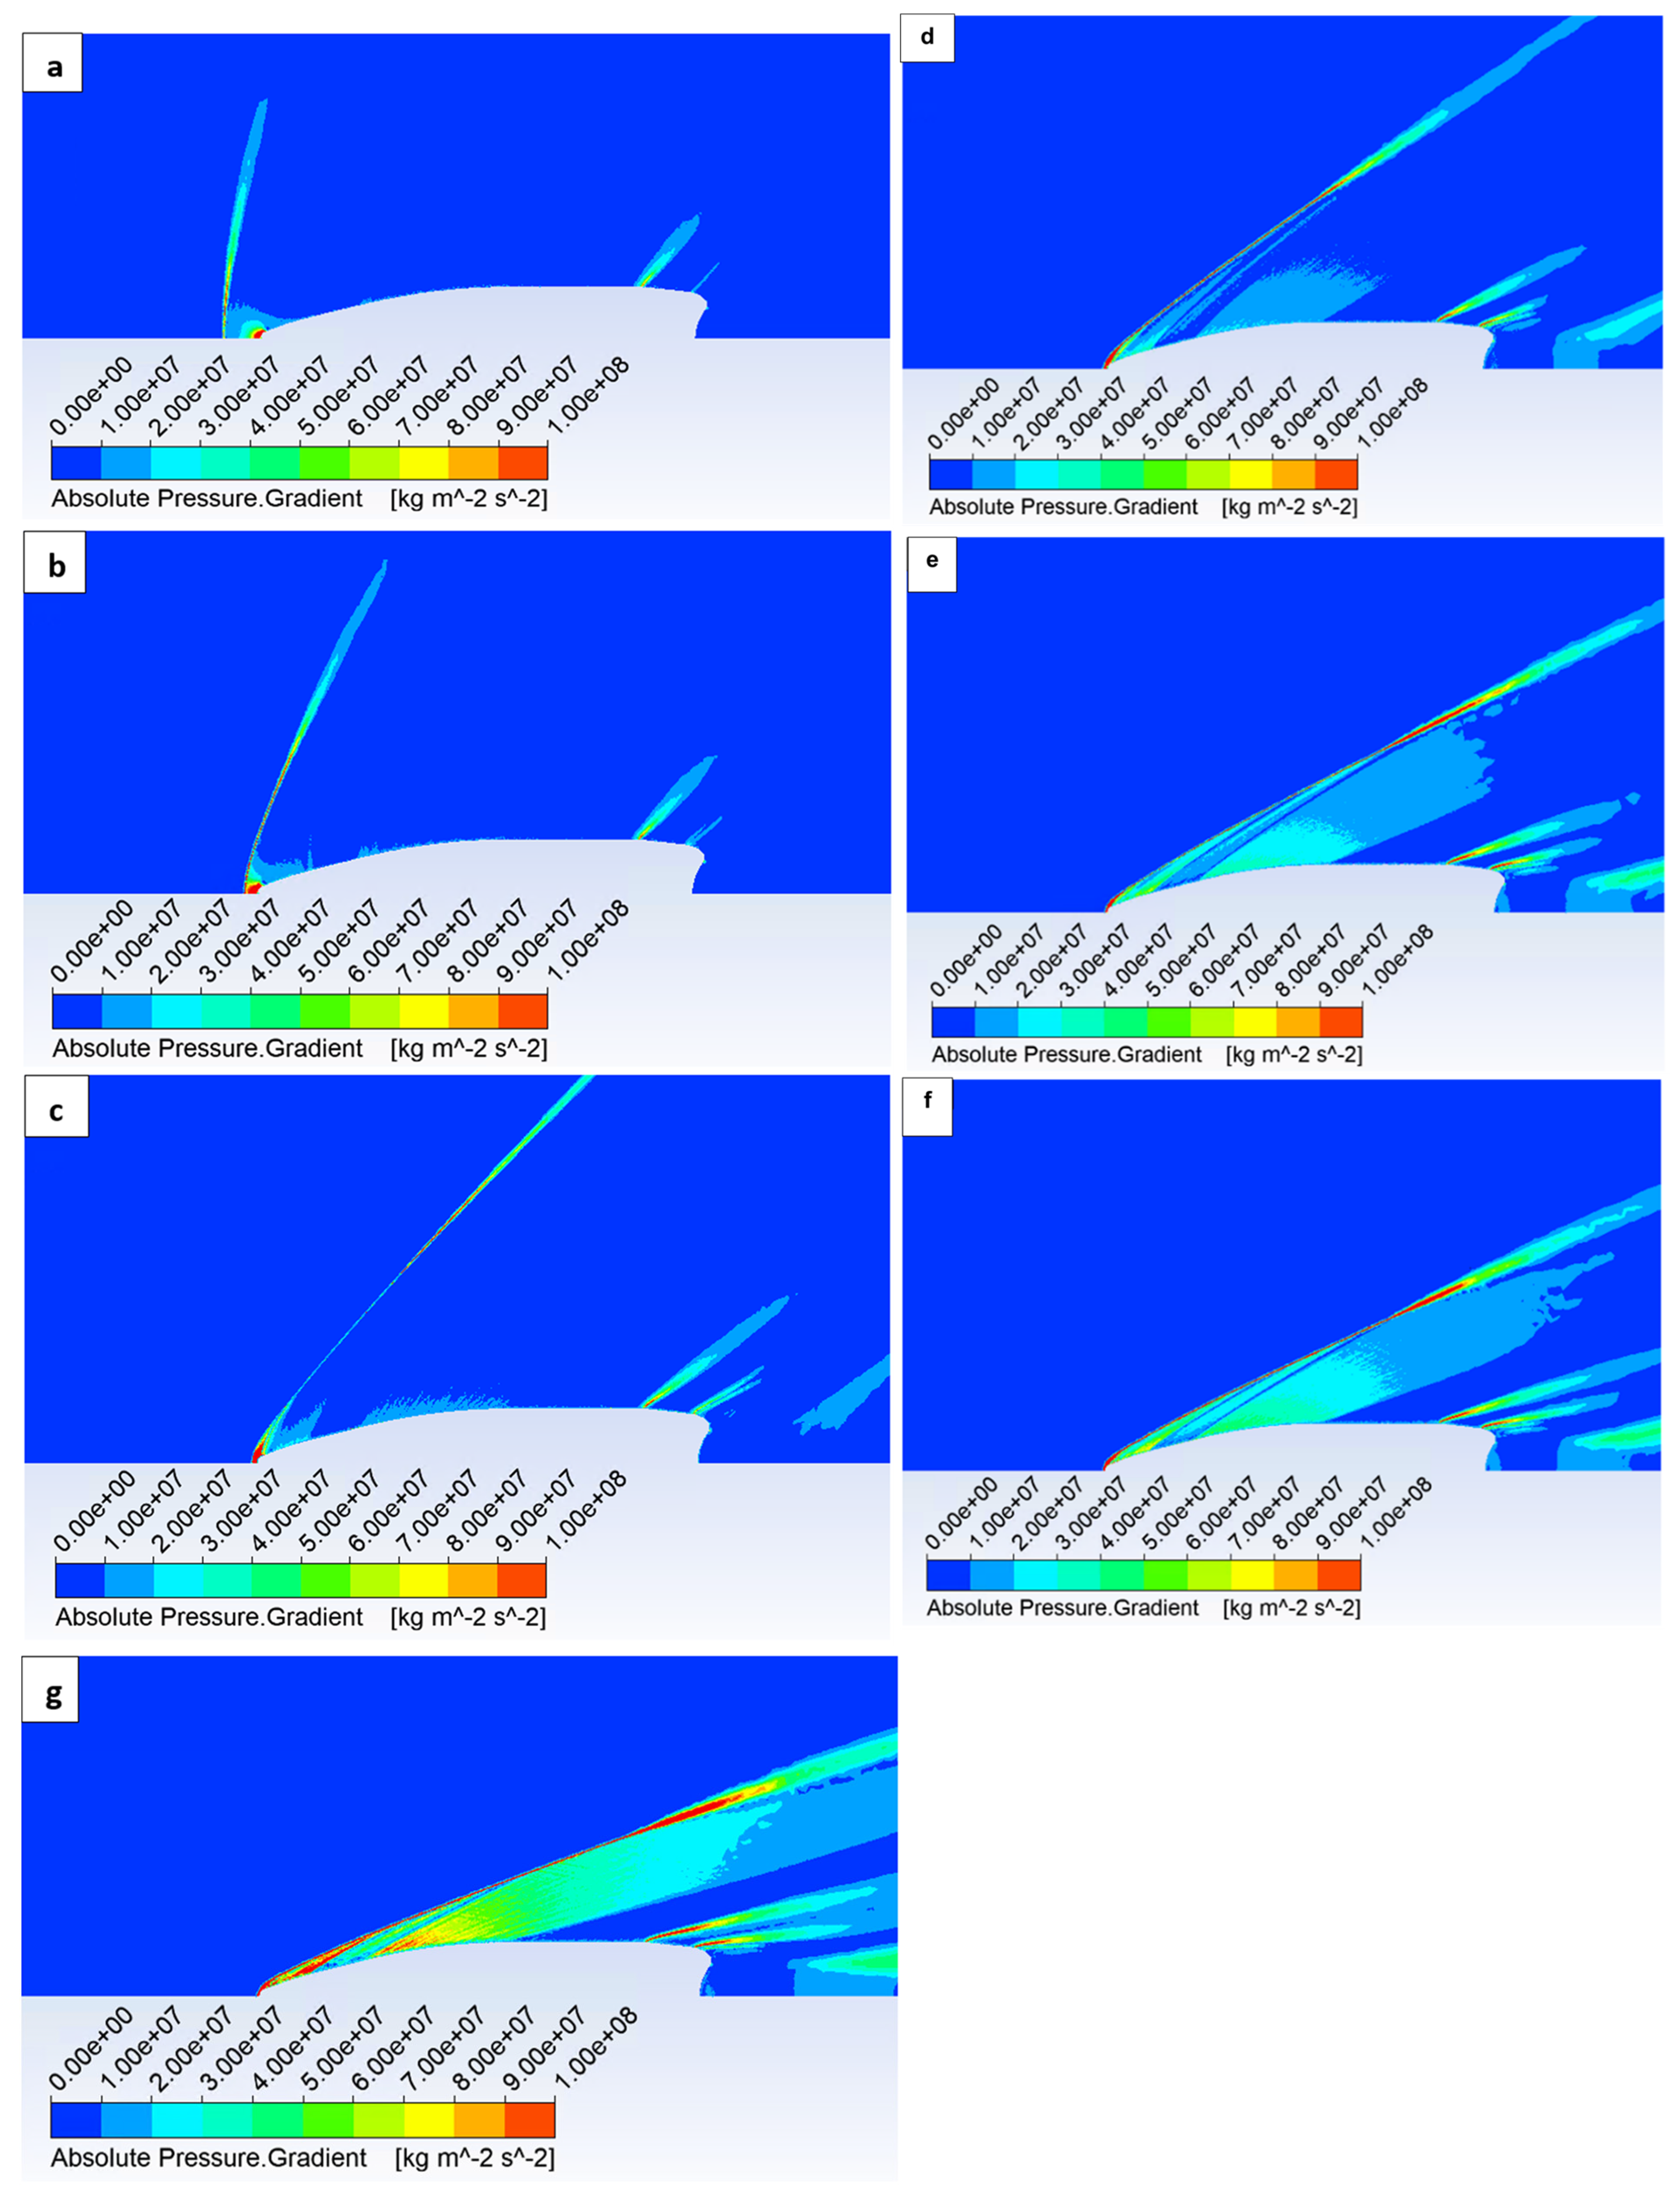
Initially, the character of the shock waves was analyzed.
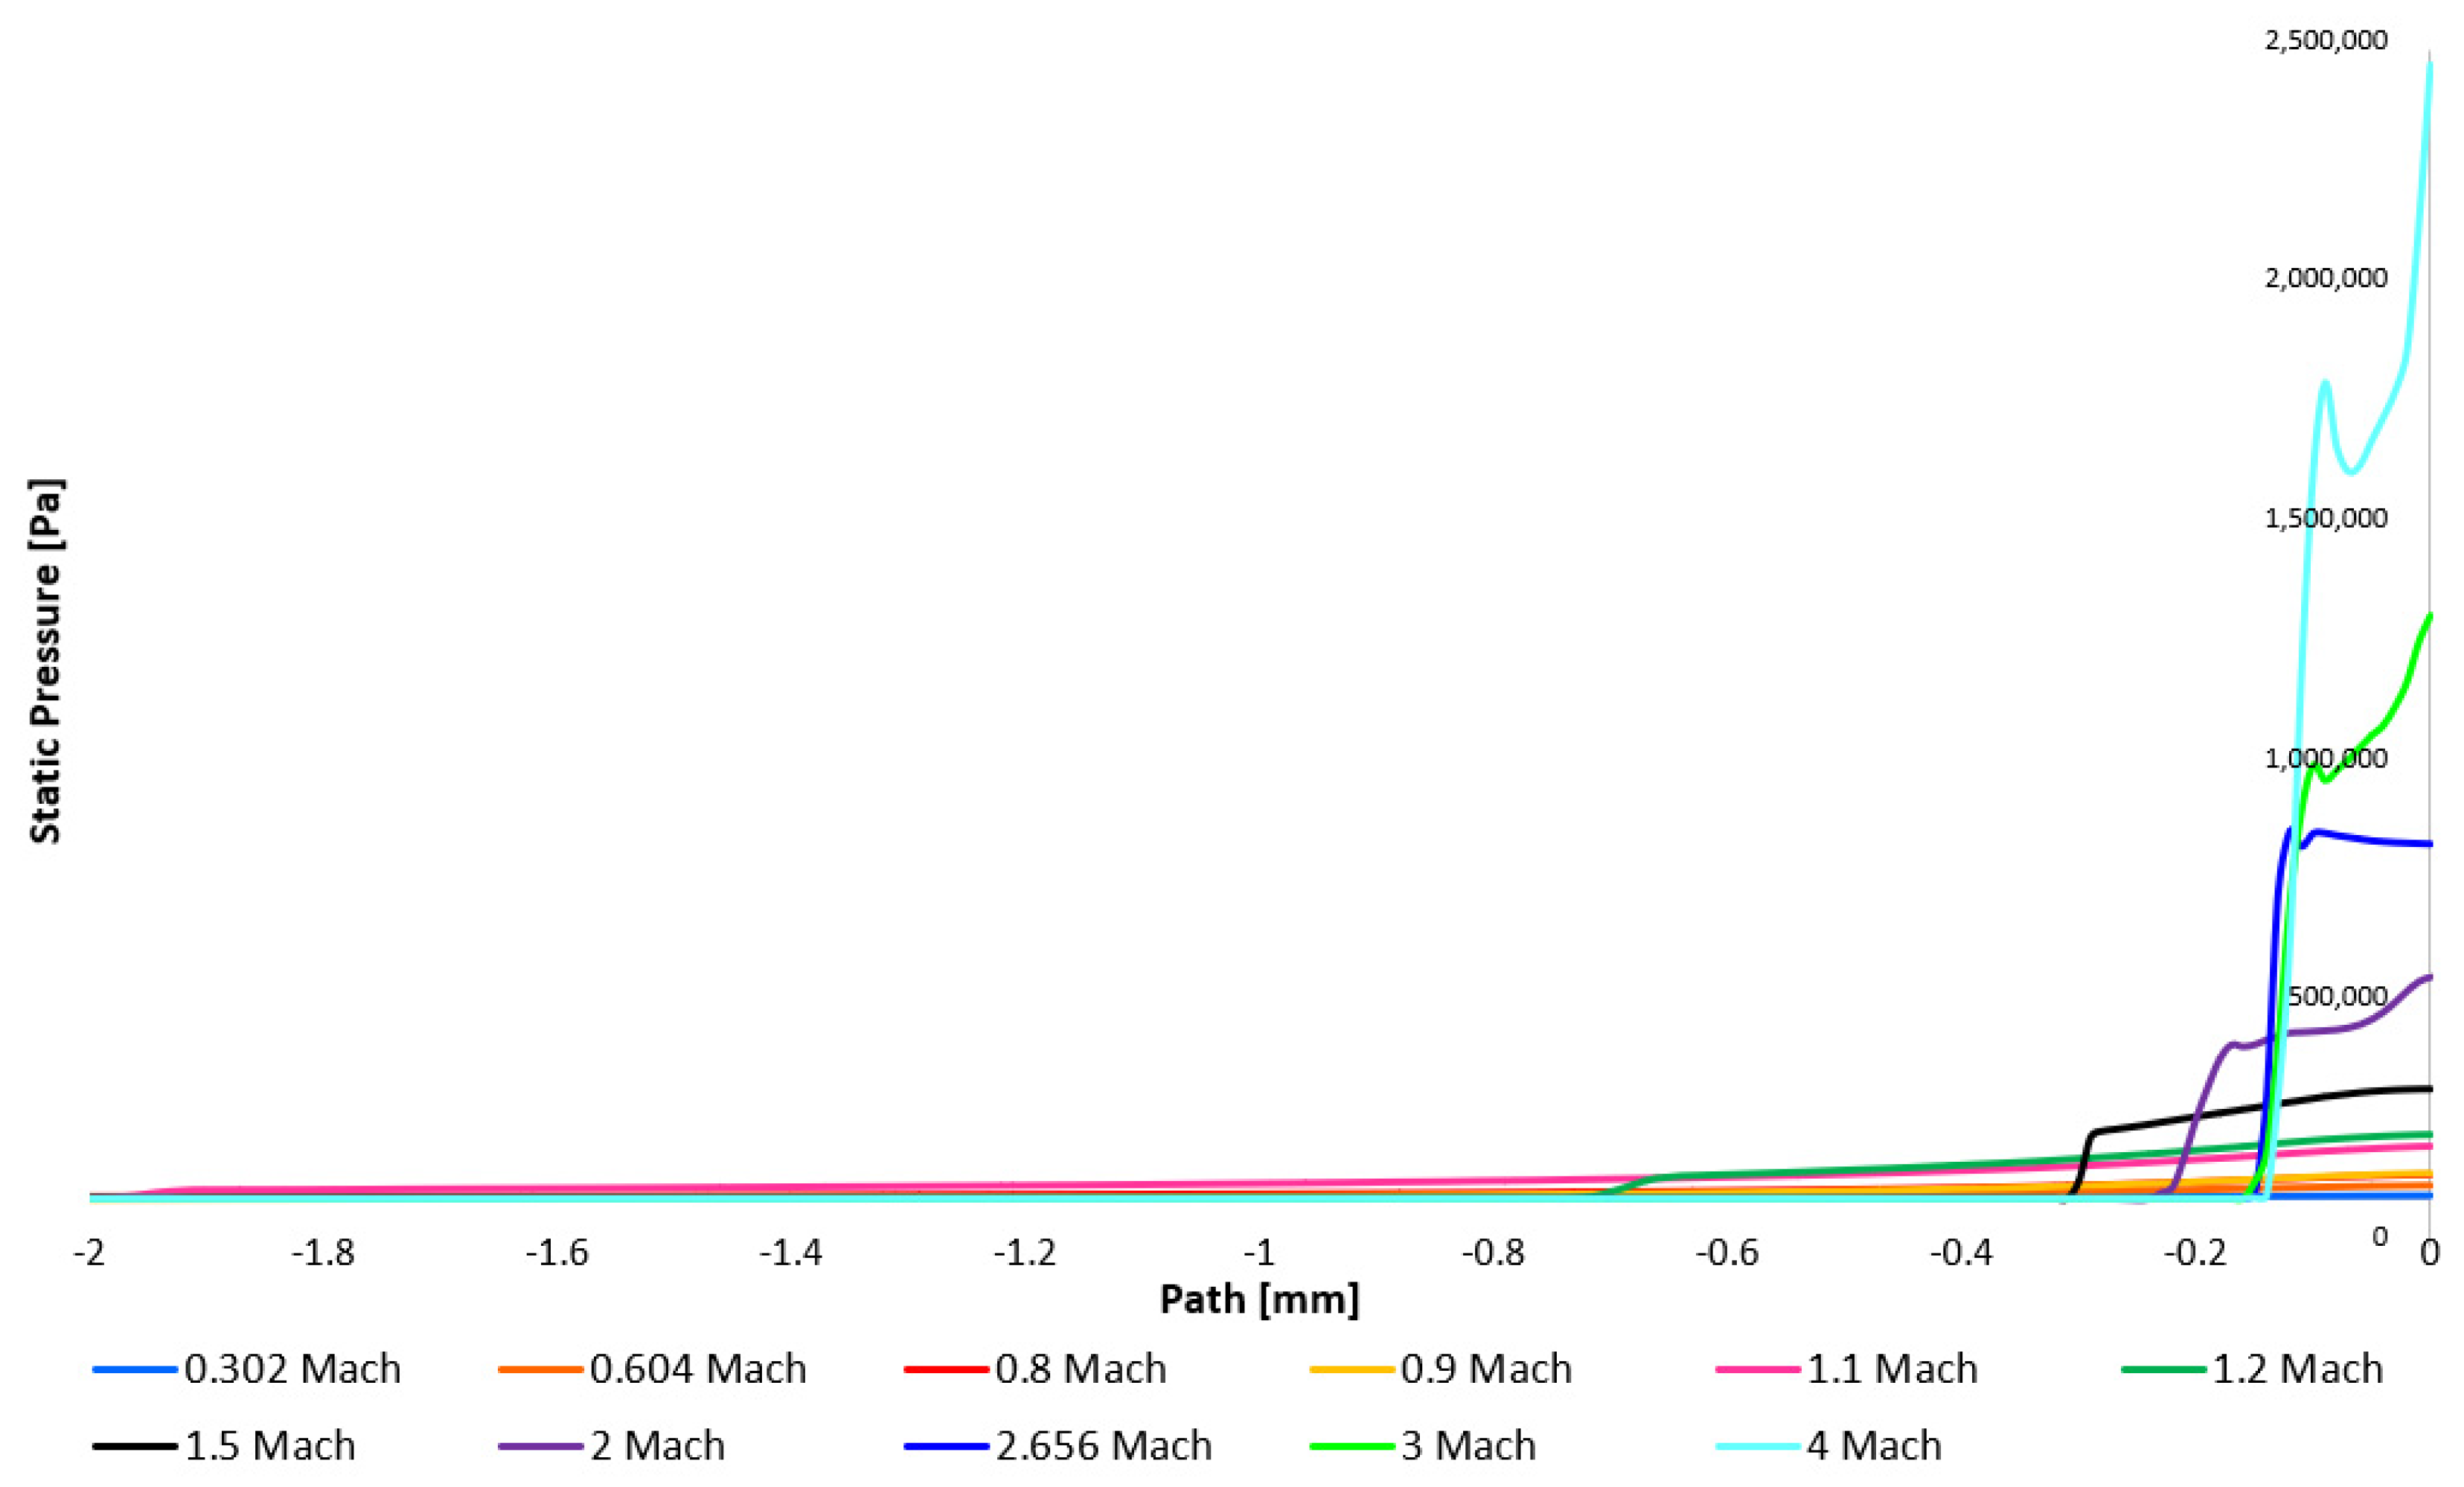
Figure 13 depicts the path along which the static pressure profile, illustrated in
Figure 14, was subsequently plotted. Due to the wide range of values,
Figure 15, featuring an adjusted static pressure scale, is also provided.
The static pressure profile demonstrates that the air pressure magnitude at the projectile’s leading edge increases with velocity. Consequently, the projectile traverses a denser medium as pressure escalates. The influence of a shock wave, characterized by an abrupt pressure value increase, is evident. As previously stated, this shock wave formation is limited to supersonic velocities, specifically variants exceeding 1 Mach.
Figure 14 and
Figure 15 reveal a gradual pressure increase within the subsonic regime. This is attributable to the flow’s incompressibility up to approximately 30% of the speed of sound, where the relationship between velocity and pressure is accurately described by Bernoulli’s equation. This domain is not addressed by the majority of the presented variants, with the lowest velocity variant (0.302 Mach) positioned at the threshold. The variants presented and detailed in
Table 9 can be categorized into two distinct regimes: subsonic, yet compressible flow (0.302 to 0.9 Mach), and supersonic flow (1.1 to 4 Mach).
For flow velocities exceeding 30% of the speed of sound, the fluid must be treated as compressible. In the theory of compressible flow, it is imperative to account for the fact that the static pressure at the projectile’s leading edge will no longer be equivalent to the ambient static pressure but rather will assume the stagnation value of static pressure, which is greater than the surrounding static pressure. The relationship between static and stagnation pressure can be determined from Equations (21) and (22):
where
pstat is the static pressure of the area, through which the projectile traverses,
ϱstat is the density of the area, through which the projectile traverses,
pstag is the stagnation pressure on the projectiles head, which arises from isentropic deceleration and compression, γ is the Poisson constant,
Cp is the heat capacity at constant pressure,
Cv is the heat capacity at constant volume, ans
cv and
cp are the respective specific heat capacities.
In the supersonic regime (
M > 1), a shock wave forms ahead of the projectile’s leading edge. The gas is initially decelerated non-isentropically to subsonic velocity and subsequently decelerates isentropically to zero velocity at the stagnation point. The relationship between static and stagnation pressure can be discerned from a more complex equation:
These phenomena demonstrate that within the subsonic, yet in this instance, compressible region preceding the projectile’s leading edge, a gradual and continuous increase in static pressure values occurs. In the supersonic regime, a discrete rise in static pressure is evident at the shock wave, followed by a subsequent increase towards the projectile’s leading edge. As illustrated in
Figure 16, the static pressure increase at the projectile’s leading edge is significantly steeper within the supersonic domain. The corresponding values are tabulated in
Table 10. Furthermore,
Figure 14 and
Figure 15 reveal that the shock wave approaches the projectile’s leading edge with increasing velocity, contributing to the elevated pressure. This proximity contributes to an elevated pressure at the projectile’s front, which the projectile must overcome, thereby influencing the drag force. Concurrently, the shock wave exhibits a more acute angle with increasing velocity, as depicted in
Appendix A,
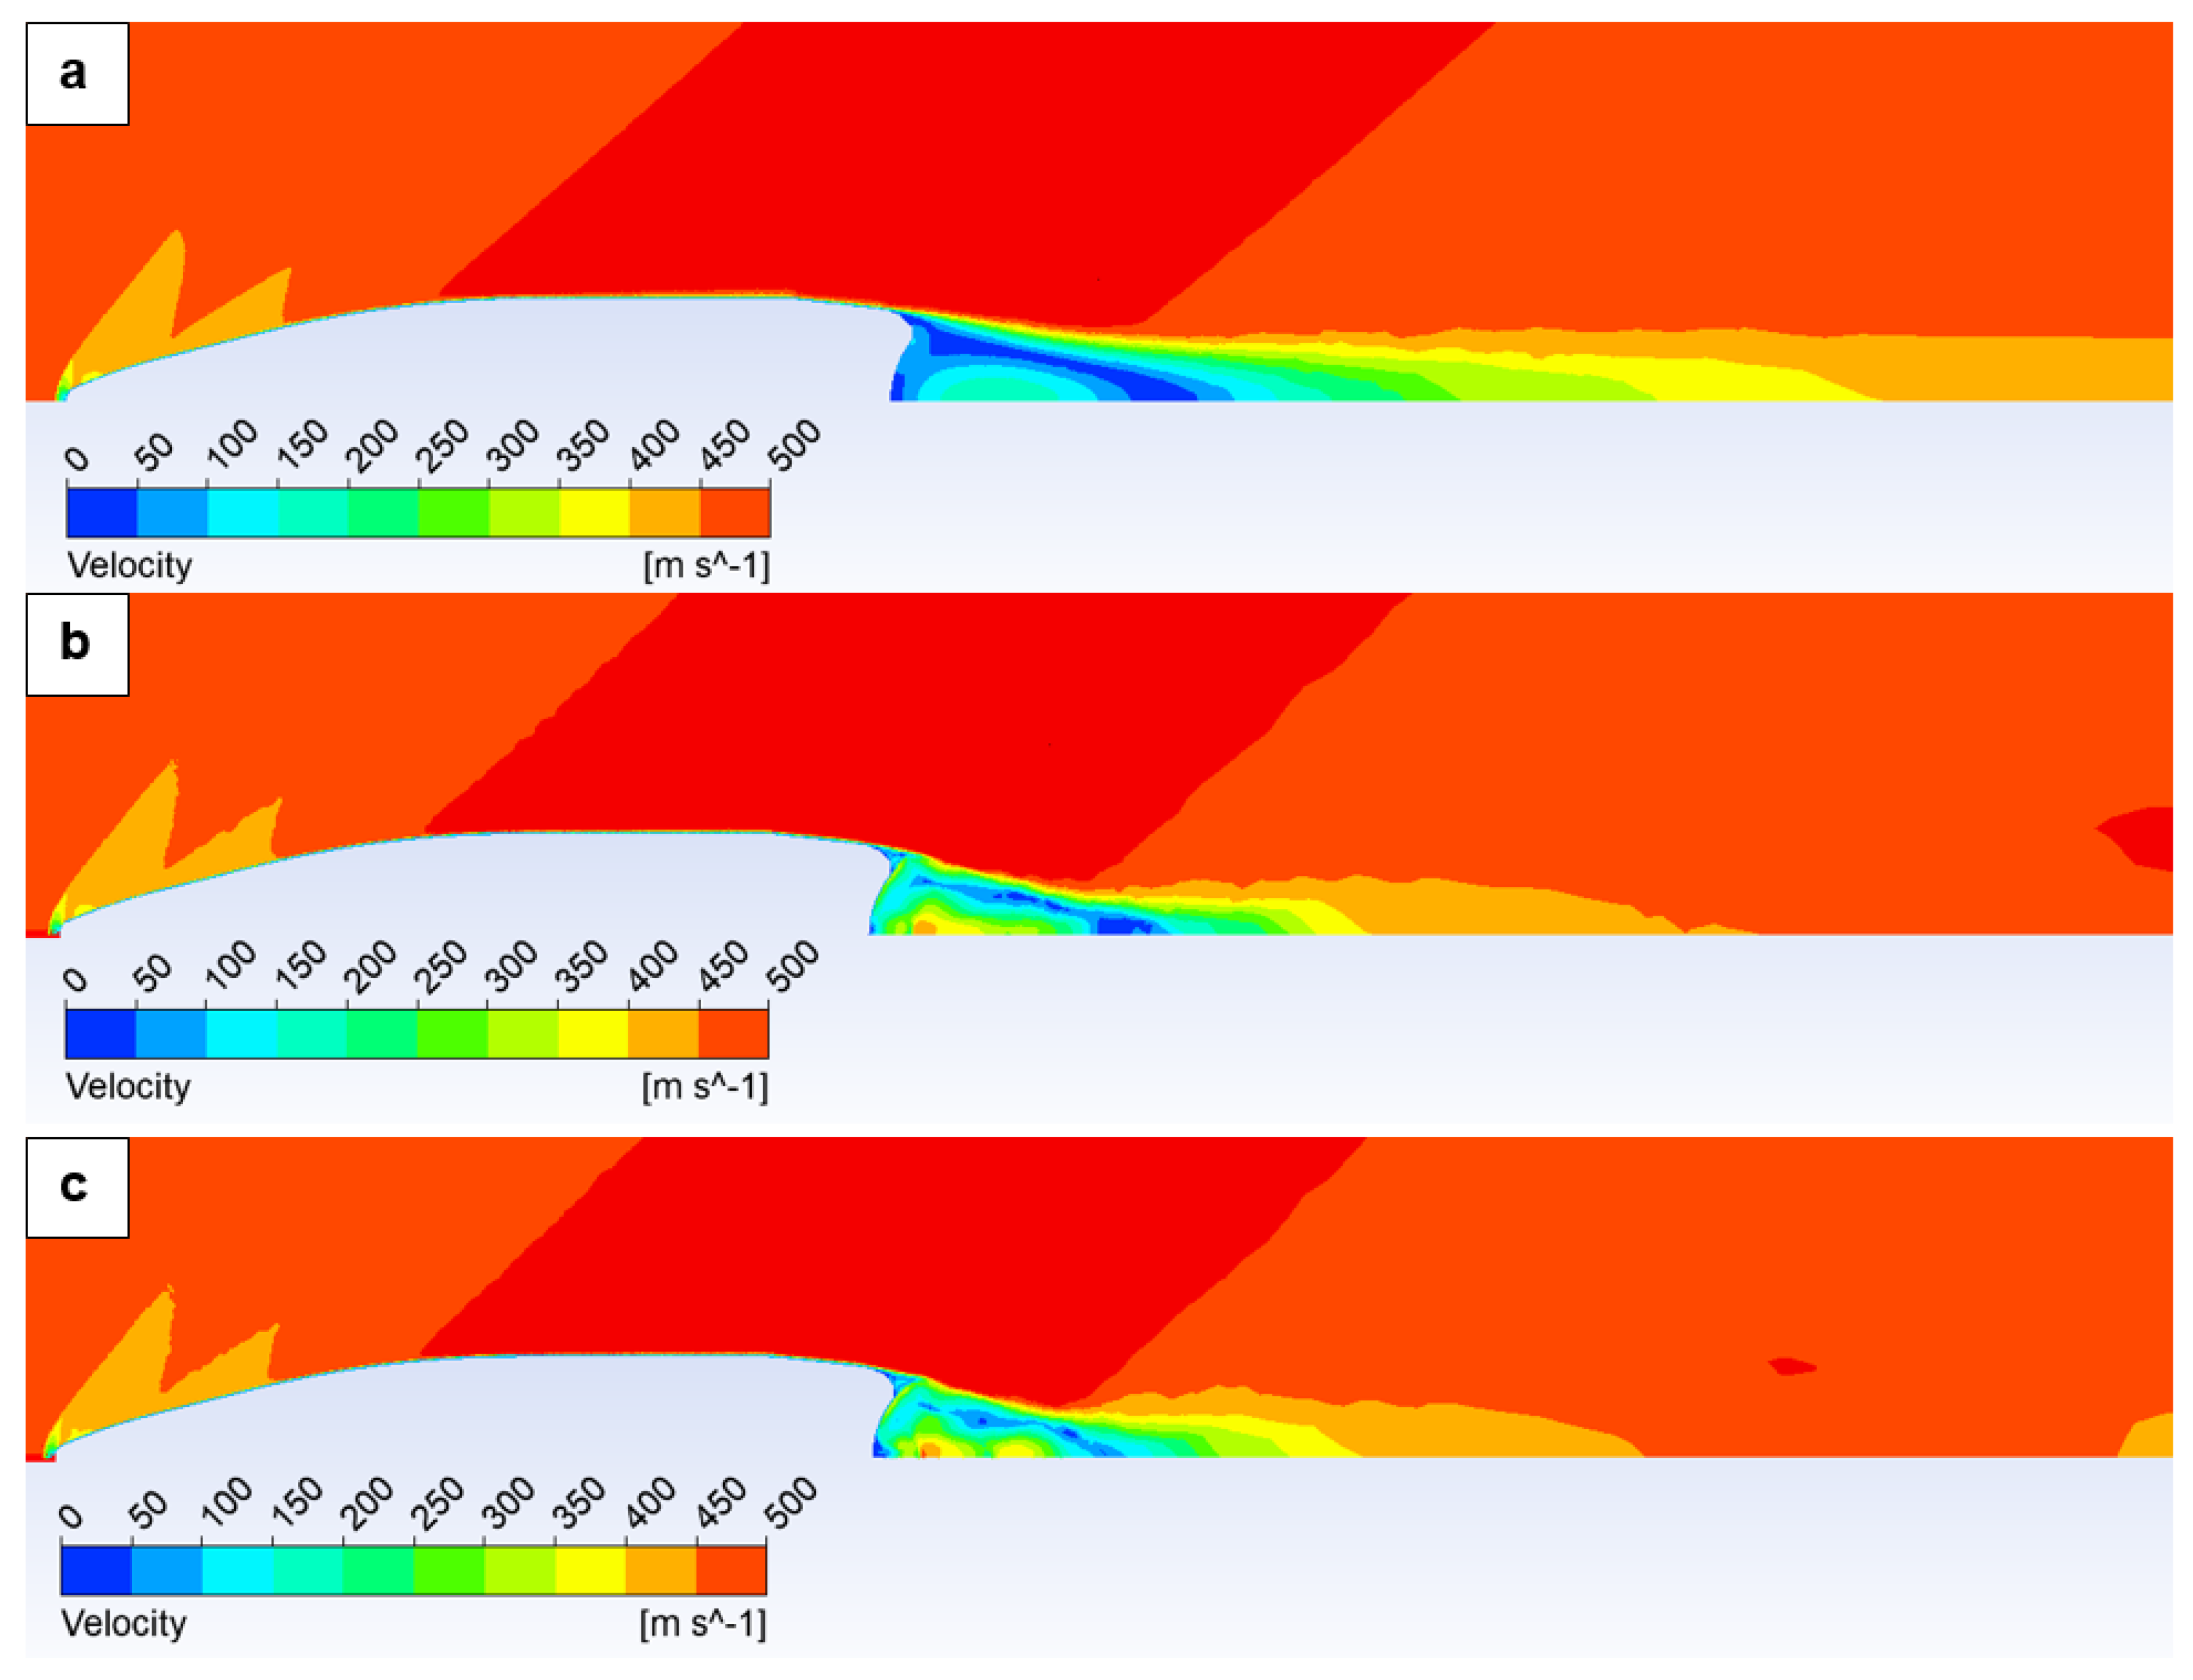
Figure A2. An additional observation derived from the results is the occurrence of pulsation at higher velocities, manifested as a pressure fluctuation preceding the shock wave’s leading edge. This fluctuation becomes more pronounced from 2 Mach onwards, with the pressure distribution in
Figure 17 illustrating this effect for the 4 Mach variant.
These findings will enable the future paper to proceed with the analysis of projectiles’ nose shape influences on shock wave characteristics and their consequential impact on stagnation pressure and drag coefficient.
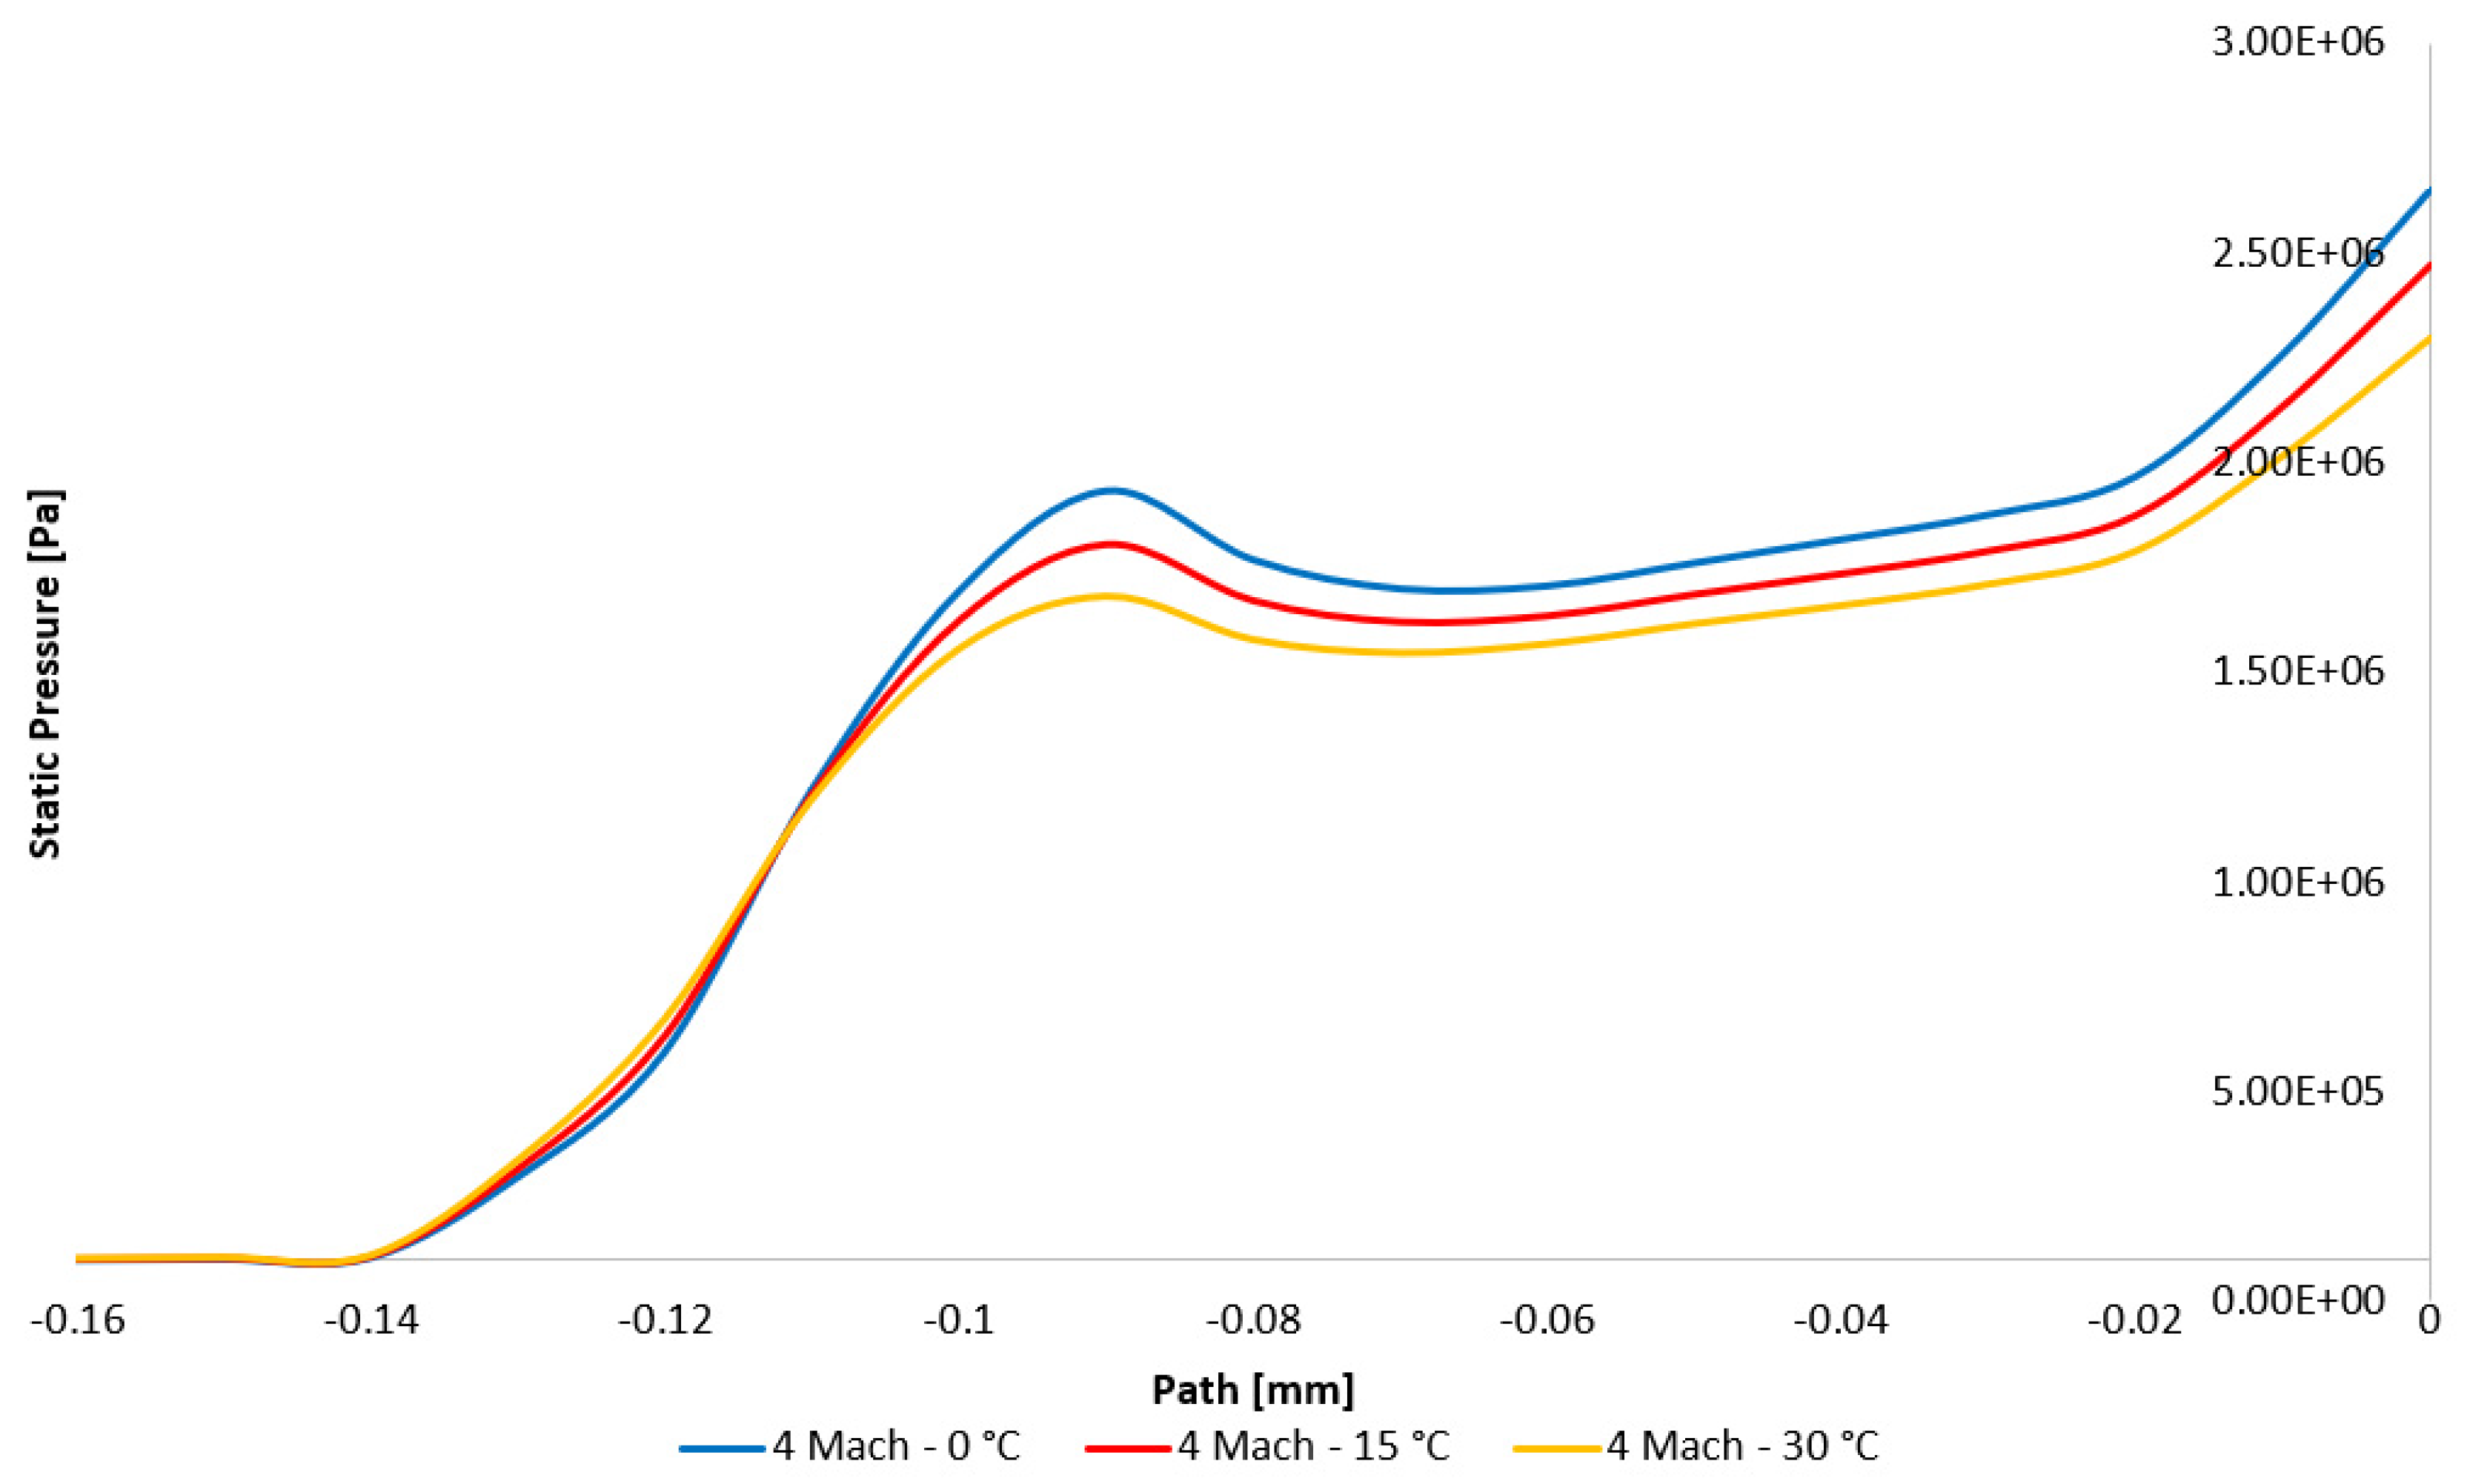
Finally, the fine-tuned system was used for an initial analysis of the influence of ambient temperature on drag force and drag coefficient. In addition to the ambient temperature of 15 °C, under which all previous analyses were conducted and which, as previously stated, was selected based on the temperature at which the manufacturer performed experiments and reported results, comparative analyses were performed with temperatures 15 °C higher and lower, thus for temperatures of 0 °C and 30 °C.
Figure 18 illustrates the drag force profile, from which it is evident that the effect of the temperature variation is primarily manifested in the supersonic regime, subsequently influencing the drag coefficient profile depicted in
Figure 19.
This alteration in drag force within the supersonic regime is primarily influenced by variations in the material properties of the medium, notably density. Furthermore, the aforementioned shock wave, characterized by a discontinuous change in density, exerts a significant influence on this alteration. These changes within the supersonic regime can be summarized as follows: A variation in ambient temperature leads to a change in density → A change in density leads to a change in Reynolds number → A change in Reynolds number leads to a change in pressure → A change in pressure leads to a change in drag force → The higher the velocity, the greater the difference in drag force for disparate temperatures, a phenomenon attributable to the relationship defining the Reynolds number as the product of density and flow velocity (Equation (14)).
Furthermore, in this instance, temperature exerts a significant influence upon the determination of the Reynolds number (Equation (14)), as evidenced by Sutherland’s law (Equation (15)).
These variations are observable in the shock wave characteristics depicted in
Figure 19 for a velocity of 4 Mach across all three temperature variants. It is evident that a decrease in temperature correlates with an increase in the static pressure value at the projectile’s leading edge.
Figure 20 delineates the velocity ranges over the previously mentioned hundred-meter projectile flight path, comparing both the 20-inch barrel length, as specified by the manufacturer in their experiment, and the 22-inch barrel length utilized in our experiment. The results indicate that both configurations operate within a region of lower drag coefficient values. Furthermore, the data reveal a notable trend: while barrel length variations between 12 and 20 inches appear to exert a significant influence, the impact of length variations beyond 20 inches, up to 24 inches, is considerably diminished. However, the results presented in
Figure 20 demonstrate a substantial influence. The V-AR version with a 22-inch barrel exhibits superior drag coefficient conditions throughout the majority of the flight path. This advantage would likely be further amplified at extended ranges, such as 300 m, which is well within the capabilities of this caliber.
