Abstract
Hyperspectral imaging (HSI) is an advanced imaging technique that captures detailed spectral information across multiple fields. This review explores its applications in counterfeit detection, remote sensing, agriculture, medical imaging, cancer detection, environmental monitoring, mining, mineralogy, and food processing, specifically highlighting significant achievements from the past five years, providing a timely update across several fields. It also presents a cross-disciplinary classification framework to systematically categorize applications in medical, agriculture, environment, and industry. In counterfeit detection, HSI identified fake currency with high accuracy in the 400–500 nm range and achieved a 99.03% F1-score for counterfeit alcohol detection. Remote sensing applications include hyperspectral satellites, which improve forest classification accuracy by 50%, and soil organic matter, with the prediction reaching R2 = 0.6. In agriculture, the HSI-TransUNet model achieved 86.05% accuracy for crop classification, and disease detection reached 98.09% accuracy. Medical imaging benefits from HSI’s non-invasive diagnostics, distinguishing skin cancer with 87% sensitivity and 88% specificity. In cancer detection, colorectal cancer identification reached 86% sensitivity and 95% specificity. Environmental applications include PM2.5 pollution detection with 85.93% accuracy and marine plastic waste detection with 70–80% accuracy. In food processing, egg freshness prediction achieved R2 = 91%, and pine nut classification reached 100% accuracy. Despite its advantages, HSI faces challenges like high costs and complex data processing. Advances in artificial intelligence and miniaturization are expected to improve accessibility and real-time applications. Future advancements are anticipated to concentrate on the integration of deep learning models for automated feature extraction and decision-making in hyperspectral imaging analysis. The development of lightweight, portable HSI devices will enable more on-site applications in agriculture, healthcare, and environmental monitoring. Moreover, real-time processing methods will enhance efficiency for field deployment. These improvements seek to enhance the accessibility, practicality, and efficacy of HSI in both industrial and clinical environments.
1. Introduction
Hyperspectral imaging (HSI) is an advanced imaging method that records a wide range of wavelengths from the visible region to the near-infrared (NIR) region [1]. It records continuous spectral bands and provides detailed spectral data for every pixel in the image [2]. Traditional imaging records images in the primary colors, whereas HSI divides the spectrum into many more bands, allowing for the detection of slight changes in the material properties of the objects being imaged [3]. HSI, as a term, was initially used in a study that examined the preliminary findings of the imaging spectrometry method [4] but was only introduced as a scientific term in the late 1980s [5]. HSI is a technique that is used in many fields such as biomedical imaging [6], precision agriculture [7], remote sensing [8], mining [9], cancer detection [10], and counterfeit detection [11].
Different types of HSI systems have different ways of gathering spectral information. The point-scanning system, also referred to as the whiskbroom camera, moves a single detector back and forth across the image to gather spectral information one pixel at a time [12]. The push-broom camera, often known as the line-scanning system, concurrently records whole lines of spatial data as the picture passes in front of the sensor [13]. Spectral scanning-based hyperspectral cameras make use of tunable filters to take one picture at a time at a given wavelength and combine them into a whole spectral dataset [14]. Snapshot camera is the latest HSI system, and it decreases the time required by capturing a single frame of the hyperspectral image [15]. The speed, resolution, and accuracy of the HSI systems have increased due to advancements in sensor technology and data processing algorithms [16]. Deep learning (DL) techniques can be integrated with HSI to improve interpretation, data analysis, and utility [17,18].
Conventional imaging methods like RGB cameras are limited in their capacity to distinguish between materials since they only record a small portion of the light spectrum [19], whereas in HSI, distinct spectral signatures help to identify the materials [20]. RGB images are characterized by three color bands: red, green, and blue. However, HSI captures thousands of spectral bands and gives a continuous spectral profile for each pixel [21,22]. Due to this high spectral resolution, it is possible to detect subtle changes in material properties, which is not possible with traditional RGB imaging. Because HSI is made up of thousands of hypercubes, it has a high resolution and a vast quantity of embedded information, including temporal, spectral, and spatial information. By utilizing this data, numerous applications can identify and describe land covers, which are the most extensively studied [23]. The ability to capture and analyze such detailed information sets HSI apart from traditional methods.
HSI can be used in multiple fields with a significant advantage over the traditional method. In agriculture, HSI can be used to monitor crop health by detecting specific wavelengths associated with plant stress, nutrient deficiencies, or disease [24]. In mineralogy, it can identify different minerals based on their unique spectral signatures [25]. Environmental monitoring applications include the identification of contaminants in waterways and the evaluation of the health of forest vegetation [26]. In medicine, HSI can be utilized to distinguish between healthy and diseased cells, which helps to detect diseases earlier and plan treatment [27]. HSI is also used in food quality control to assess freshness and detect contaminants by analyzing the composition of various food products [28]. In artwork investigations, HSI is used for the non-invasive inspection of almost flat artworks like paintings, drawings, graphics, miniatures, and historical documents such as ancient manuscripts. For manuscripts, HSI enhances the readability of the deteriorated text, and for polychrome surfaces, it identifies and maps pigments and captures accurate color images [29]. In pharmaceuticals, HSI is used to analyze the falsification of solid pharmaceutical products due to its non-invasive, ecological, and non-destructive properties. Due to its non-contact, non-destructive nature, HSI is also employed in forensic analysis and crime scene investigation. It is primarily used in the examination of blood traces, detection of document forgery, identification of fingerprints, and analysis of gunshot residues [30].
Despite its numerous advantages and diverse applications, HSI is still predominantly used as a laboratory tool. This can be attributed to several factors. HSI requires complex equipment, which is often expensive and hence not accessible to most people [31]. Hyperspectral sensors also generate large volumes of data, which requires a significant amount of analysis and processing to obtain relevant information out of it [32]. Highly skilled personnel are required for the operation of the equipment and analysis of the results; this is another significant barrier to the widespread adoption. Integrating HSI into the existing workflow also presents a challenge. For many organizations, the benefits of using HSI must be compared with the improvements it brings. In many industries where the results of traditional imaging are satisfactory, the additional expense of the HSI may not be justifiable. Despite these limitations, some researchers are focused on building more affordable and user-friendly HSI systems, which can help facilitate wider adoption, as shown in Figure 1 [33].
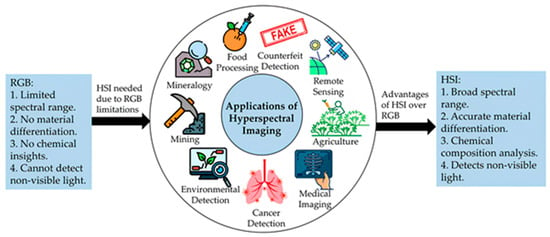
Figure 1.
Application of HSI in various fields.
HSI has developed as a transformational technique due to its capacity to record both spatial and spectral information, facilitating thorough material characterization across several areas. The swift increase in HSI-related research necessitates a thorough, interdisciplinary examination. This paper seeks to address the gap by reviewing recent accomplishments, identifying significant application trends, and highlighting existing problems, thus guiding future research and promoting the wider implementation of HSI technology. In this study, the multifaceted applications of HSI across various domains are explored, and the reasons behind its limited commercial use despite its potential are examined. Many examples, in the fields of agriculture, medicine, environmental monitoring, and art conservation, demonstrate that HSI offers detailed spectral information that cannot be matched by conventional imaging systems. The challenges that are preventing its wider adoption, such as high equipment costs, data processing complexities, and the need for specialized expertise, are also addressed. In the following sections, the various applications of HSI are discussed in detail, followed by the limitations that block its wider adoption. The potential solutions to these limitations are also analyzed and finally conclude by emphasizing how the development of more affordable HSI systems will ease their adoption into the mainstream industries.
2. Applications of HSI
This section gives a critical review of the latest and most influential research undertaken in the area. Selection for this review was based on the stringent inclusion and exclusion criteria to attain a high standard of relevance and quality. A thorough literature analysis was performed across various scientific databases, including PubMed, Scopus, and Web of Science, to guarantee extensive coverage of peer-reviewed articles. The inquiry was confined to articles published in the past five years. The subsequent keywords and Boolean combinations employed were: “hyperspectral imaging” AND (“application” OR “detection” OR “classification”) AND (“agriculture” OR “medical imaging” OR “environmental monitoring” OR “counterfeit detection” OR “food processing” OR “mining” OR “remote sensing”). Search results were constrained by language (English), document type (original research papers), and journal classification (Q1 or Q2). Following the elimination of duplicates and the evaluation of titles and abstracts for pertinence, comprehensive assessments of the complete texts were performed according to the established inclusion and exclusion criteria.
Inclusion criteria:
- Only the research papers published within the last five years were considered (2019–2024);
- Each of the selected studies should have an H-index of at least 70 to reflect influence and recognition within the scientific community;
- Only works in Q1 or Q2 journals have been included to maintain the focus on high-impact research.
Exclusion criteria:
- Non-English language publications;
- Conference proceedings;
- Review article;
- Prospective and retrospective studies.
This strict selection process ensures that the discussed studies will give a strong and reliable backbone of knowledge related to the applications of HSI in different fields. Appendix A provides an overview of all the studies choses in this study.
2.1. Counterfeit Detection
HSI has been shown to be a very effective technology for counterfeit detection across multiple domains, as shown in Figure 2. Mukundan et al. created a system that uses a Raspberry Pi camera and a Raspberry Pi 4 model B for the detection of counterfeit money [34]. It made use of the VIS-HSI technique, which created hyperspectral images from RGB images. Three samples of authentic 100 NTD Taiwanese currency notes were chosen, and the mean gray values (MGV) of two different regions of interest were compared with counterfeit 100 NTD notes. The findings indicated that the currency notes may be readily distinguished from one another using MGV, having a spectral range between 400 and 500 nm. Frosch et al. performed counterfeit testing and multicomponent concentration analysis of the anti-malarial tablets in the pharmaceutical industry [35]. This was performed using a Raman spectroscopy based on a fiber array by utilizing a wavelength of 532 nm in the visible range. Raman spectroscopy and Partial Least Squares regression (PLSR) modeling were applied to precisely measure multiple API concentrations in pharmaceutical tablets, effectively detecting counterfeit antimalarial drugs.
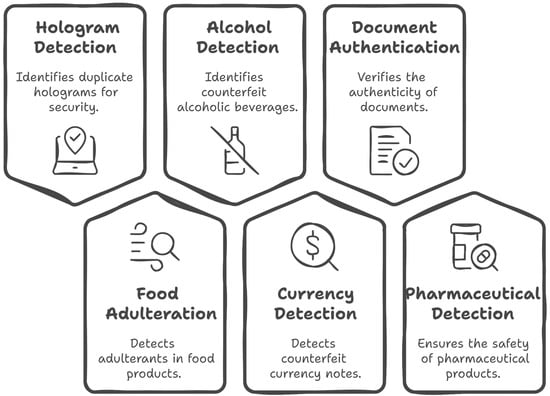
Figure 2.
Applications of hyperspectral imaging (HSI) in counterfeit detection. HSI enables the identification of counterfeit currency, documents, and consumer products by detecting subtle spectral differences in materials, inks, and surface textures, often invisible to the human eye.
Coic et al. applied HSI to falsified medicine, detecting inorganic and organic compounds in a single analysis [36]. Initially, Raman chemical imaging analyses and Fourier-transform infrared spectroscopy (FT-IR) were performed on both counterfeit and standard tablets, and the multivariate curve resolution—alternating least squares (MCR-ALS) algorithm was used for the extraction of spectra of the pure compounds. Raman microscopy and FTIR techniques were compared to see which detects falsified medical products better, and Raman microscopy was better suited for detecting low-dose substances, possibly due to the smaller sampling sizes. Wu et al. used principal component analysis (PCA), AdaBoost, and fluorescence hyperspectral techniques for detecting counterfeit alcohol, which showed that it could differentiate real products from fake [37]. The AdaBoost model had the best performance with 99.03% F1-score, 98.08% Precision, and 100% recall. On the other hand, Laborde et al. applied NIR HSI with the chemometric technique MCR-ALS to detect peanut flour present in chocolate powder [38]. The samples consisted of different proportions of peanut flour: 0%, 0.1%, 1%, 10%, and 100%. Due to the very similar spectral signatures, PCA alone was unable to detect adulteration. When used with a selectivity constraint, MCR-ALS advanced the detection: the levels of adulteration changed from 0% to 2.2% for the unconstrained analysis and from 0.03% to 17.0% under the constraint. This then proved that NIR-HSI has the potential to use the developed method to detect even lower levels of peanut adulteration in chocolate powder.
Jiang et al. compared NIRS and HSI techniques to identify adulteration in Ganoderma lucidum spore powder (GLSP) and predict its level [39]. The study involved 290 adulterated and 58 authentic GLSP samples collected from six provinces in China. The HSI technique used a spectral range with wavelength peaks at 4200, 4250, 5600, 5800, and 8300 cm⁻1. The potential of NIRS for the detection of adulteration was better compared to the use of the HSI technique; nevertheless, the mid-level fusion (MLF) data fusion strategy achieved 100% precision, accuracy, recall, and F1 score; hence, it enhanced the efficacy of detection and prediction. Shang et al. proposed a technique to detect adulteration in camellia seed oil based on HSI technology [40]. In this study, binary samples were used to adulterate the concentration level to a range of 0% to 100%. Hyperspectral data were collected and analyzed using techniques such as support vector machine (SVM) and linear discriminant analysis (LDA) for qualitative discrimination, and it was as high as 100% accuracy. For quantitative prediction, the models implemented were partial least squares (PLS) and synergy interval partial least squares (Si-PLS). The Si-PLS model had a high prediction accuracy: R2 = 97.8% and root mean square error of prediction (RMSEP) = 4.69%.
Hu et al. developed a technique using fluorescence HSI to detect adulteration in Tieguanyin tea [41]. The support vector classification (SVC) model with derivative pre-processing was shown to obtain 100% accuracy, precision, and recall in the discrimination of the possible qualitative parameters. The samples of Benshen and Tieguanyin tea were adulterated in the range of 0–100% (w/w), and corresponding hyperspectral information was collected. For quantifying the levels of adulteration, the calibration model 2nd Der-PCA support vector regression (SVR) was developed, and high predictability was achieved with the correlation coefficients (Rc2 and Rp2) of 92% and 91%, respectively. Puglia et al. used HSI along with SVM to identify the most relevant regions in tablets to identify counterfeit medicine [42]. It classified the testing data set of Cialis and Viagra with 100% accuracy. Mukundan et al. designed a low-cost and portable module to detect duplicate holograms [43]. It utilized a VIS-HSI algorithm to change RGB images into hyperspectral images.
2.2. Remote Sensing
HSI is widely utilized in remote sensing to improve the ability to monitor and manage natural resources, as shown in Figure 3. Qian et al., in a survey on the development and evolution of space-borne hyperspectral imagers, found that at least 25 such instruments have been deployed around the globe [44]. The basic technologies used here involve dispersive elements, spectral filters, and Fourier transform interferometers. Among these, 19 are around Earth, while the six instruments are deployed for missions around the Moon, Mars, Venus, and comets. The wavelength covered by hyperspectral imagers mostly ranges from visible and near-infrared (VNIR) to short-wave infrared (SWIR), carrying quite some detail in the spectral content. This diverse suite of instruments attests to advances in HSI technology and applications across the full spectrum of space exploration. Flores-Anderson et al. suggested a semi-empirical algorithm on the basis of the three-band model that could evaluate water quality through the concentration of chlorophyll-a in the water column. They calculated water surface reflectance from the hyperspectral spaceborne sensor Hyperion to relate it to in situ chlorophyll-a samples from Lake Atitlán. The above-mentioned algorithm, based on the 467 nm to 559 nm blue-to-green ratio bands, has been able to generate a relative error of 33% in modeling chlorophyll-a. This proves that hyperspectral data are much more effective in representing water quality parameters, although the limitation associated with higher concentrations will be corrected in future calibration with multispectral sensors [45].
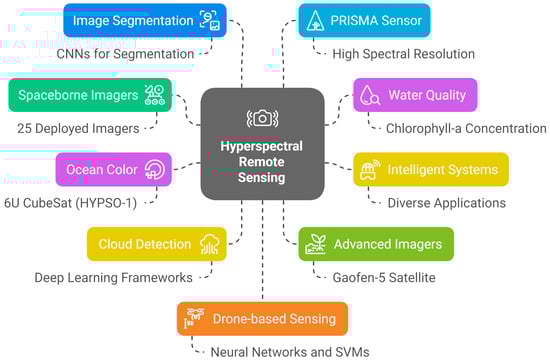
Figure 3.
HSI in remote sensing. Used extensively in satellite and aerial imaging, HSI supports land cover classification, forest mapping, and soil property assessment through high-resolution spectral data.
Zhang et al. further discussed the smart remote sensing satellite system as a new trend in the remote sensing satellite system that will replace the traditional remote sensing satellite systems [46]. However, such next-generation satellites are built with an application of hyperspectral data in nature to conduct real-time customized remote sensing services. The most notable developments have been in imaging payloads and onboard processing systems, which allow real-time data capture and interactivity between the satellites and users. This evolution widens the application of remote sensing from industrial and governmental users to individual consumers. However, this includes the challenges associated with such evolution: privacy preservation, social impacts, and regulatory restrictions on data sharing. Grøtte et al. introduced the 6U CubeSat or HYPSO-1, designed for ocean color hyperspectral remote detection, and achieved high-resolution data, which is essential for studying marine ecosystems [47]. Sun et al. used DL frameworks for satellite data cloud detection [48]. It demonstrated an overall accuracy improvement in identifying cloud-covered areas in hyperspectral images. Liu et al. described the advanced hyperspectral imager aboard China’s Gaofen-5 satellite, which has 330 spectral bands and provides improved spectral resolution for various environmental monitoring tasks [49].
For segmenting hyperspectral satellite images, Nalepa et al. used spectral and spectral-spatial convolution neural networks (CNN), which demonstrated enhanced effectiveness when tested against test data obtained under various conditions [50]. When Vangi et al. examined the Precursore IperSpettrale della Missione Applicativa (PRISMA) hyperspectral sensor compared to other sensors, they discovered that because of its high spectral resolution, it was superior at distinguishing between various forest kinds in both nomenclature system levels and study areas [51]. In one region, it differentiated coniferous and broadleaves better by 50%, and in another, by 30%. In the study of drone-based hyperspectral remote detection methods, Pascucci et al. demonstrated that neural networks, random forests (RF), and SVMs could be used for the classification of intricate terrestrial ecosystems [52]. Meng et al. utilized hyperspectral information from the Gaofen-5 satellite to predict soil organic matter (SOM) more accurately [53]. It identified 0.6-order discrete wavelet transform (DWT) as the best approach for reducing noise and improving prediction accuracy. RF models, along with spectral indexes and feature selection via the recursive feature elimination (RFE) algorithm, gave high accuracy in SOM content prediction.
2.3. Agriculture
HSI has found great application in agriculture for advanced crop monitoring, disease detection, and yield estimation as shown in Figure 4. For instance, Wang et al., evaluated satellite hyperspectral (Orbita) and multispectral (Gaofen-1) data in the process of monitoring cotton in China [54]. It was shown that Orbita hyperspectral data presented slightly higher values of spectral reflectance and classification accuracy than Gaofen-1 multi-spectral data, and hence, it was more capable of detailed crop monitoring. Another study by Agilandeeswari et al. discussed crop classification for agricultural purposes using HSI. They obtained very high accuracy rates in classifying the different crop types, specifically corn, soybeans, and wheat, thus exemplifying success in precision agriculture with HSI [55].
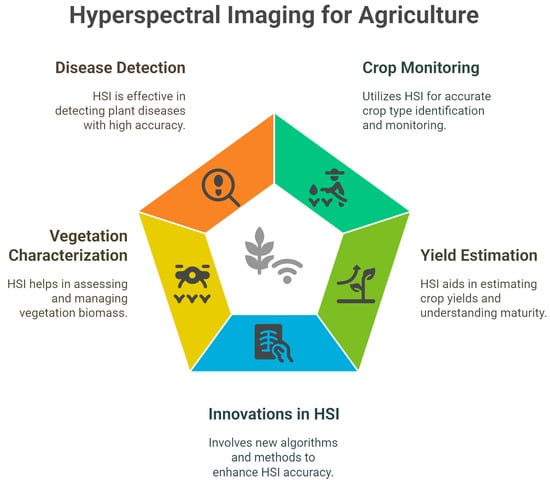
Figure 4.
HSI in agriculture. HSI facilitates crop monitoring, growth monitoring, and disease detection by capturing unique spectral signatures of vegetation, improving precision agriculture practices.
Niu et al. applied a developed HSI-TransUNet model that was a modified transformer-based model in semantic segmentation for crop type. The performance of this model achieved an overall accuracy of 86.05% in the identification of crops, thus enabling precise crop mapping when HSI is combined with advanced machine learning (ML) techniques [56]. Geipel et al. employed HSI to estimate forage yield and quality by capturing data on canopy reflectance in Norway. It was found that HSI can predict forage mass with an R2 of 0.27, thereby demonstrating the potential of this technique in non-invasive forage yield estimation [57]. Singh et al. used HSI data to evaluate canola seedpod maturity using data from a UAV in Canada. His study showed strong relationships between spectral indices derived from hyperspectral images and seedpod maturity, which suggests the utility of this method for monitoring crop development [58].
Ground-based HSI has also been utilized to estimate yield in fruit crops. Gutiérrez et al. were able to show how ground-based HSI could be used to estimate mango yield in Spain. Their study achieved high determination coefficients for various yield parameters, showing the precise and reliable nature of HSI fruit yield estimates [59]. In the area of disease detection, Shi et al. came up with an automated approach for potato late blight disease detection using DL with an HSI CropdocNet model. This had an accuracy of 98.09% with a validation dataset, which proves that HSI combined with DL is very effective in plant disease diagnostics [60]. HSI has also been found to be applicable in ecological research and vegetation characterization. In the study by Putkiranta et al., 2024, they assessed the use of hyperspectral unmanned aerial vehicle (UAV) imagery in the characterization of tundra vegetation in Finland. Their findings showed that HSI had a high level of accuracy in biomass estimation compared to multispectral data, giving R2 values reaching 60% as the best value for biomass. Such results showed that HSI was positively advantageous in ecological research [61].
Matese et al. reported a study on UAV-based HSI and ML regarding precision viticulture in the USA and reported a variability in the results of different studies, and that such studies showed a high potential for increasing operational efficiencies in vineyard management through these technologies [62]. Sahadevan et al. developed an unsupervised technique-based algorithm to extract spatial-spectral homogeneous patterns in crop images that provided improved segmentation accuracy [63]. Cao et al. used the successive projection algorithm in the inversion modeling of japonica rice canopy chlorophyll content in China. Their study achieved R2 = 79.1% and RMSE = 8.215 mg/L, which highlights the precision of HSI for estimating crop health parameters [64].
2.4. Medical Imaging
HSI is quickly evolving as a medical technology with the development of novel techniques for non-invasive diagnosis and surgical procedures in recent years, as shown in Figure 5. Numerous fields, including dermatology, ophthalmology, cardiovascular illness, and neurodegenerative diseases, have found success with it.
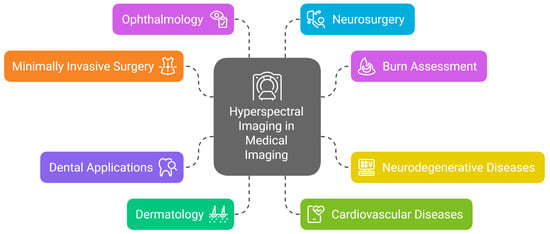
Figure 5.
HSI in medical imaging. In healthcare, HSI offers non-invasive visualization of tissue composition and pathology, aiding in early disease detection and surgical guidance.
Dremin et al. used polarization-enhanced HSI combined with neural networks to assess skin complications in diabetic patients [65]. The study was conducted using a hyperspectral snapshot camera of Senop Optronics that had a spectral bandwidth of 510 to 900 nm and 6–10 nm spectral resolution. The study created two-dimensional distributions of skin blood oxygenation (SBO) and blood volume fraction (BVF) and found elevated BVF and lowered SBO levels in diabetic patients compared to controls, which indicates microcirculation impairments. A neural network-based methodology was presented by La Salvia et al. for in situ dermatologic diagnosis using HSI for the distinction of skin cancer lesions [66]. A customized HSI system was used with a Cubert UHD 185 camera, which had a wavelength range of 450-950 nm with a spectral resolution of 8 nm and a 50 × 50 pixels spatial resolution. Conducted in Spain, the study assessed 76 hyperspectral images from 61 patients and achieved a specificity and sensitivity of 88% and 87% to distinguish between malignant and benign lesions.
El-Sharkawy et al. described a novel utilization of HSI for the non-invasive characterization of human eye vasculature using measurements of diffuse reflection in the wavelength range from 400 to 950 nm [67]. Performed in Egypt with the RESONON Pika XC2 hyperspectral camera and a 5 W halogen lamp, the study differentiated the veins and atrium of the eye at wavelengths of 750 nm and 470 nm, respectively, through k-means clustering and quantitative phase analysis. The study had ten volunteers, and it showed great reliability in the differentiation of vascular structures. Manni et al. used a spectral-spatial approach in a hybrid 2D-3D CNN to classify brain tumor tissue using HSI data [68]. The study examined twelve hyperspectral images of nine patients that had glioblastoma multiforme (GBM) tumors using the ant colony optimization (ACO) band-selection algorithm to determine the spectral range from 410–824 nm and collected data from two hospitals in Spain and the UK. This method outperformed traditional DL methods in detecting tumor features with 80% and 76% accuracy and sensitivity, respectively.
In contrast to a well-established open surgery system (HSI-Open), Thomaßen et al. employed an HSI system that is CE-certified for surgeries that are minimally invasive (HSI-MIS) [69]. Involving 19 patients undergoing gastrointestinal resections, the study used the TIVITA® Mini Endoscopy Edition camera, which operated in the 500–1000 nm range and at 5 nm resolution. PLS regression was used to calculate parameters like tissue oxygen saturation (StO₂) and organ hemoglobin index (OHI). The study indicated that PLS considerably decreased the mean absolute error (MAE) for StO₂ and OHI and enhanced surgeons’ acceptance of the images. MacCormac et al. performed wide-field, label-free intra-operative tissue differentiation in real time during neuro-oncology surgery by utilizing light-field HSI [70]. Conducted in the UK, the study used a Cubert Ultris ×50 HSI camera and captured 155 spectral bands across a 350–1000 nm range at 1.5 Hz. The system was evaluated in a first-in-human study involving a patient with a posterior fossa meningioma. Results indicated that the light-field HSI system was easy to include in the neurosurgical workflow while providing significant spectral data to aid tissue differentiation and hence enhancing surgical precision in neuro-oncology.
In a German study, Schulz et al. used HSI to measure the burn depth of patients who had second- and third-degree burns [71]. Using the TIVITA® Tissue HSI system, which records images in the 500–1000 nm spectral region, the study assessed changes in skin layer hemoglobin volume and oxygenation. Due to problems with data quality, only 49 of the 59 patients in the dataset were examined. The study showed that, with a sensitivity of 92% and specificity of 71%, the burn index (BI) calculated from HSI data could distinguish between wounds healing spontaneously and those needing grafts, underlining its potential for early burn assessment. Using non-invasive HSI of the retina, Hadoux et al. examined the accumulation of amyloid beta (Aβ) to determine if it may be utilized as a biomarker for Alzheimer’s disease [72]. The study, which took place in Canada, used an optina diagnostics metabolic hyperspectral retinal camera (MHRC) to capture images in the 450–900 nm spectral region. Retinal reflectance spectra from the 35 participants in the study showed substantial changes between the case (Aβ PET+) and control (Aβ PET−) groups, indicating that retinal HSI could be a non-invasive biomarker for brain Aβ burden in AD.
Ueda et al. identified unique spectral signatures in Parkinson’s disease (PD) patients using retinal HSI [73]. An XIMEA SNm4 VIS hyperspectral camera was used to record data for the 40 participants in this Japanese study, which covered a spectral range of 463–598 nm. Although the small sample size limits the effectiveness of HSI as a tool for diagnosing PD, the results showed substantial variations in retinal reflectance spectra between PD patients and controls. In Germany, Vosahlo et al. looked into the use of HSI to distinguish between carious lesions and occlusal discolorations. The study included 65 removed permanent teeth and used the diaspective vision TIVITA® Tissue camera with a bandwidth range of 505–1000 nm [74]. The potential of HSI as an additional diagnostic tool in dental treatment was demonstrated by a fine k-nearest neighbor algorithm, which had a Matthews Correlation Coefficient (MCC) of 0.75, sensitivity of 95%, and specificity of 80%.
2.5. Cancer Detection
The detection and diagnosis of cancer may be greatly enhanced by recent developments in HIS, as shown in Figure 6. Several studies conducted worldwide have performed studies on HSI, frequently in combination with ML algorithms, to distinguish between healthy and malignant tissues.

Figure 6.
HSI in cancer detection. HSI assists in identifying cancerous tissues, such as skin, colorectal, and oral cancers, by analyzing spectral biomarkers, improving diagnostic accuracy and surgical outcomes.
2.5.1. Colorectal Cancer Detection
Jansen-Winkeln et al. used a feedforward artificial neural network (ANN) and HSI to distinguish colorectal cancer (CRC) from healthy mucosa [75]. Fifty-four patients receiving colorectal resections participated in the study, which used the TIVITA® Tissue system that has a 640 × 480 pixel resolution with a spectral bandwidth of 500 to 1000 nm. Using leave-one-patient-out cross-validation, the neural network had 86% sensitivity and 95% specificity. These results emphasize the potential of HSI for non-invasive CRC diagnoses by demonstrating variations in malignant tissue perfusion that are linked to angiogenesis.
2.5.2. Intraoperative Brain Cancer Detection
In order to improve intraoperative brain cancer diagnosis, Leon et al. studied the combination of NIR(900–1700 nm) and VNIR (400–1000 nm) HSI in Spain [76]. The data from two push-broom HSI cameras were combined to create an enhanced spectral range of 435–1638 nm. Tumor delineation capabilities were improved by this fusion compared to using VNIR or NIR data alone, as classification accuracy increased by up to 21%, making real-time, label-free guidance during brain tumor surgeries possible.
A real-time HSI system that makes use of multi-GPU platforms was created by Florimbi et al. to improve intraoperative decision-making to identify brain tumors [76]. Utilizing a Headwall Photonics Hyperspec® VNIR A-Series push-broom camera, the investigation was carried out in Spain and collected data with a 1004 × 1787 pixels spatial resolution, which covered a spectral bandwidth of 400 to 1000 nm. Using data from four patients diagnosed with grade IV glioblastoma (GB), the system was evaluated and was able to classify in under three seconds, meeting the standards for real-time surgery. This development represents a significant step toward better tumor identification through the integration of HSI into surgical workflows.
As part of the HELICoiD project, Fabelo et al. developed an in vivo HSI system for brain cancer detection and established the first publicly accessible database of human brain images [77]. Utilizing a Hyperspec VNIR A-Series camera from Headwall Photonics, the investigation was carried out in Spain and the UK and recorded 826 spectral bands between 400 and 1000 nm. The technology, when used on 22 patients, successfully distinguished tumor tissue from healthy brain tissue and other structures during surgery, providing a great deal of hope for better surgical results. Puustinen et al. explored the use of HSI with ML for improved intraoperative brain tumor surgery [78]. This work includes intraoperative analysis during high-grade glioma procedures using a Senop HSC-2 hyperspectral camera, which has wavelengths between 500 and 900 nm and a spatial resolution of 1024 × 1024 pixels. The technology showed the ability of HSI to precisely define tissue boundaries during neurosurgery by achieving an 80% multi-tissue classification accuracy. The results highlight how important it is to use ML tools and standardized HSI data gathering in therapeutic contexts.
2.5.3. Esophageal Cancer Detection
Tsai et al. applied HSI along with a DL model for the early detection of esophageal cancer [79]. The research utilized narrow-band imaging (NBI) and white-light (WLI) endoscopic imaging on 1232 images by using hyperspectral conversion technologies. The prediction accuracy increased from 83% to 88% for WLI and from 86% to 91% for NBI, showing that the single-shot multi-box detector based on the VGG-16 Atrous network enhances diagnostic accuracy. This shows how HSI can outperform conventional endoscopy in non-invasive, real-time cancer detection.
In another study, Tsung-Jung Tsai et al. studied band-selective HSI in conjunction with a DL algorithm for identifying esophageal cancer earlier [80]. Classifying phases into squamous cell carcinoma (SCC), dysplasia, and normal was performed using 1780 esophageal cancer images that included 935 NBIs and 845 WLIs. The study was carried out in Taiwan. It demonstrated that HSI had 5% higher accuracy than traditional imaging, obtaining a sensitivity of 85.6% and an average precision of 88.5% for detecting SCC using a VGG-16 network-based single-shot multi-box detector.
2.5.4. Head and Neck Cancer Detection
Halicek et al. utilized HSI in order to identify malignant margins in head and neck squamous cell carcinoma (HNSCC) in the US [81]. The research included 102 individuals and made use of a Maestro spectral imaging system to record 91 spectral bands between 450 and 900 nm. DL algorithms outperformed conventional dye-based techniques in the differentiation of malignant from normal tissues, obtaining an AUC of 0.85 to 0.95 for conventional SCC and 0.91 for HPV+ SCC. This non-ionizing, label-free optical modality has potential applications in real-time intraoperative guidance during cancer surgery. Halicek et al. also developed an optical biopsy technique for head and neck cancer that combines HSI with CNNs [82]. The study included 21 individuals who had SCC surgically removed. A CRI Maestro imaging system was used, and CNN differentiated cancerous and normal tissue with an AUC of 0.82, sensitivity and accuracy of 81%, and specificity of 80%.
2.5.5. Glioblastoma Detection
Ortega et al. utilized CNNs in conjunction with HSI to identify GB tumor cells on H&E-stained slides [83]. With wavelengths ranging from 400–1000 nm, the Hyper-spec® VNIR A-Series camera from HeadWall Photonics was used in the study to record 826 spectral channels from 517 hyperspectral cubes belonging to 13 individuals with GB. In separating tumor from non-tumor tissue, CNN obtained 77% specificity and 88% sensitivity, which is an 8% and 7% improvement over RGB image classification. This work illustrates how DL and HSI might improve computational pathology.
2.6. Environmental Detection
HSI has turned out to be one of the most important tools in environmental monitoring as it provides very precise and non-invasive methods for analyzing ecosystems, as shown in Figure 7. Since HSI covers a large range of wavelengths, it enables the accurate detection of pollutants, microplastics, and atmospheric/marine conditions. Applications range from air and water quality monitoring to the identification of marine litter and soil and mineral analyses.
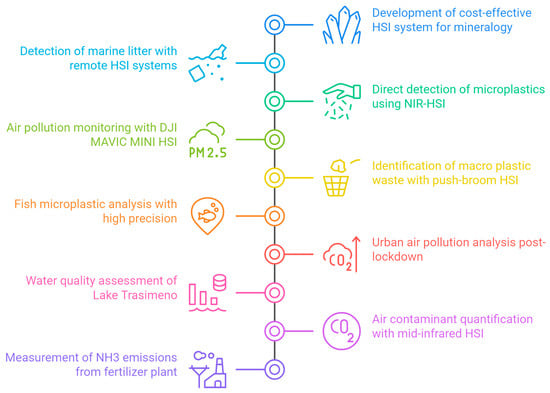
Figure 7.
HSI in environmental detection. From air pollution detection to macro plastic waste identification, HSI provides a valuable tool for tracking environmental contaminants and ecosystem health.
Stuart et al. developed a cost-effective, high-resolution HSI system suitable for mineralogy and environmental monitoring [84]. They used commercially available components to develop a system at the University of Sheffield, including a Hamamatsu C13440 camera to observe light between 450–650 nm with a 0.29 nm spectral resolution. The system showed that it could capture fine-scale surface details in gneiss and basalt, which can obtain hyperspectral images at the millimeter scale. Freitas et al. used a remote HSI system that can automatically identify and define areas of marine litter accumulation in oceanic settings [85]. The study utilized a Specim FX10e camera, which works in the range 400 to 1000 nm, as well as one HySpex Mjolnir S-620 covering 1000–2500 nm. The system was tested with manned and unmanned aerial platforms on artificial targets afloat, simulating marine litter at three different altitudes. The study used RF and SVM for litter detection with a 70–80% accuracy.
Piarulli et al. established a technique utilizing NIR-HSI for direct and rapid identification of small microplastics (MP) within aquatic samples [86]. The study was carried out in Italy using a Specim SWIR-3 HSI camera with wavelengths between 1000 and 2500 nm, and it was focused on the capability to detect MP directly onto the filters without manual pre-sorting. This method made the detection of MPs in particles as small as 80 µm possible. Mukundan et al. introduced a new snapshot HSI method for detecting atmospheric pollution, especially PM2.5 concentrations [87]. This study was conducted in Taiwan, and hyperspectral images were collected using a DJI MAVIC MINI light-detecting camera to acquire data that had a spectral range between 380–780 nm with a 1 nm spectral resolution. The dataset consisted of 3340 images classified according to PM2.5 concentration into good, moderate, or severe categories. Three models were used: a 3D Convolutional Neural Network Auto Encoder (CAE), PCA with visual geometry group (VGG-16), and a standard RGB method. The PCA with the VGG-16 approach achieved the best classification accuracy of 85.93%.
Balsi et al. studied high-resolution aerial detection of marine plastic waste using HSI [88]. Using a push-broom spectral sensor installed on a DJI Matrice 600 drone, the investigation performed in Italy collected spectral information in the 900–1700 nm region. This technique was created to identify macro plastic waste with an emphasis on polymers such as polyethylene and PET. To accomplish this, the researchers created a unique technique that combines feature selection algorithms with LDA. Zhang et al. developed an HSI-based method to rapidly detect MPs in fish intestines, which effectively bypasses the need for conventional digestion and separation techniques [89]. The study used a Headwall Photonics HyperSpec NIR system that operated in the 900–1700 nm range along with an SVM classification model to accurately identify and characterize MPs directly from hyperspectral images. The system showed high precision that exceeded 96.22% and recall rates above 98.80%, and successfully identified five types of MPs larger than 0.2 mm within fish intestinal contents.
Naethe et al. used a VIS-NIR field spectrometer to track changes in urban NOx levels [90]. Using an automated field spectrometer called RoX, down-welling light was continually monitored from December 2019 to March 2020 in a 450–900 nm spectral region. The study was conducted to identify decreases in NO2 levels by comparing data gathered prior to and following the enforcement of lockdown measures in March 2020. The decision tree model based on the principal components of the hyperspectral data was able to detect a considerable decline in NO2 concentrations with an accuracy of 87.3%. To evaluate the quality of the water in Lake Trasimeno, Italy, Niroumand-Jadidi et al. used PRISMA HSI [91]. Chl-a, total suspended matter (TSM), and colored dissolved organic matter (CDOM) were among the metrics that were extracted from PRISMA photos and compared with Sentinel-2 data. The Italian Space Agency’s PRISMA satellite produced hyperspectral images in 239 bands ranging from 400 to 2500 nm with a 30 m spatial resolution. For physics-based inversion, the study used the water color simulator (WASI) processor. It found that PRISMA and Sentinel-2 data had similar results, especially for TSM, but that there was a slight overestimation at shorter wavelengths.
To swiftly quantify air contaminants, Meléndez and Guarnizo devised a technique that combines PCA with mid-infrared HSI [92]. With column densities of 258, 107.5, and 215 ppm·m, respectively, the study carried out at the Universidad Carlos III de Madrid aimed to identify CH4, N2O, and C3H8. The imaging Fourier-transform spectrometer spanned a spectral range of 1850–6667 cm⁻1 at a resolution of 1 cm⁻1. PCA was able to improve accuracy and reduce calculation time by over a thousand times by increasing the signal-to-noise ratio and accelerating the retrieval process. Noppen et al. measured the amount of NH3 released by industrial sources using HSIR [93]. With a high spatial resolution of 4 m, the study used the Telops Hyper-Cam LW to record data in the longwave infrared spectrum (800–1350 cm⁻1). Significant NH3 plumes were seen during two flights over a sizable fertilizer production facility. The estimated annual emission fluxes were about 2200 tons, which is five times greater than what was recorded in the European pollutant release and transfer register (E-PRTR).
2.7. Mining
HSI can, to a large extent, be used for effective restoration of ecology, mineral exploration, and environmental monitoring in the mining sector, as shown in Figure 8. These works indicate the viability of HSI in the noninvasive and efficient detection of heavy metals, mineralogical variables, and ecological disturbances for many applications in the mining-related industry.

Figure 8.
HSI in mining. HSI enhances the detection and mapping of mineral deposits by analyzing surface reflectance patterns, supporting efficient exploration and extraction processes.
Jeong et al. designed a SWIR HSI system for the measurement of the level of heavy metals in tailings from gold mines in Samgwang, South Korea [94]. The main target of the prediction was the concentration of chromium, for which 120 soil samples were scanned with a SPECIM SWIR hyperspectral camera covering wavelengths between 916 and 2500 nm over 288 spectral bands. An R2 value of 70% and a normalized root mean square error (NRMSE) around 11–12% proved the feasibility of HSI in this comprehensive environmental monitoring imaging model in mining areas. Zhang et al. quantified the concentration of soil heavy metals in a study area located within the Ordos Opencast coal mine, Inner Mongolia, China, using the GF-5 hyperspectral satellite [95]. The calibration of the spectral data analysis within 390–2513 nm was performed with the help of the direct standardization algorithm. Heavy metal concentrations were predicted by ML models like RF and Extreme Learning Machine (ELM), which had R2 values equal to 625% for nickel and 77% for zinc. These results show that HSI is effectively used as a tool for monitoring soil pollution in mine areas.
Hyperspectral remote sensing was employed by He and Barton to delineate geotechnical issues at the Ray mine in Arizona with a specific focus on the non-structural causes of highwall instability [96]. This study used Headwall Photonics Micro-Hyperspec devices for VNIR between 400 and 1000 nm and SWIR between 600 and 2500 nm. These devices were either mounted on drones or tripods. Spectral activity results showed that the primary spectrally active mineral causing slope movements at the Indian Springs site is swelling montmorillonite clay. This confirms the utility of HSI in detecting mineralogical elements that may contribute to geotechnical instability. The hierarchical classification system that Tang et al. implemented in Heidaigou, Inner Mongolia, China, combined LiDAR with HSI to monitor flora restoration on the semi-arid mine dumps of an open-pit mining area [97]. It was supported by an S185 hyperspectral sensor and a LiAir 220 UAV LiDAR system that had a wavelength ranging from 450–998 nm. For the whole technique, the Kappa coefficient and the overall classification accuracy were 0.79 and 87.45%, respectively, and a variety of plant kinds, including grasses, trees, and shrubs, were precisely classified. It gives valuable data regarding the structure and biodiversity of the plants, which makes it possible to monitor ecological restoration in an accurate manner through the integration.
Zhou et al. studied the hyperspectral features of vegetation leaves in the rare earth reclamation mining area of Jiangxi, China [98]. A stepwise discrimination method (SD) and a multilayer perceptron (MLP) model were applied in this research to discriminate six types of typical reclaimed vegetation. Wetland pine was identified with 93.6% accuracy in the study. Thus, the research firmly supports the potential of the application of HSI with advanced discrimination models for monitoring ecological restoration actions in mining areas. Tan et al. elaborated on a comprehensive data correction technique for seamless mosaicking of airborne hyperspectral images over the complete mining site in Inner Mongolia, China [99]. To work against challenges like radiation distortion due to the bidirectional reflectance distribution function (BRDF) effect, VNIR and SWIR sensors were used: the Headwall A-Series and HySpex SWIR-384. In this case, 37 image strips showed that brightness mismatch was successfully eliminated. Thus, high-quality data were obtained for the ecological monitoring of mining areas.
In another study, Tan et al. came up with a novel classification technique by coupling HSI with a parallel Gaussian-Bernoulli restricted Boltzmann machine (GBRBM) in Xuzhou, China [100]. The HySpex imaging spectrometer used in the image covers the 415–2508 nm spectral range and showed that this DL model far outperforms traditional classifiers by providing increased accuracy as well as dramatically faster prediction times. This technique is useful for large-scale environmental monitoring in mining areas. Xiao et al. applied the shortwave airborne spectrographic imager (SASI) to a CH4 emission detection study in an oil shale mining area and its retorting plant located in the southeastern Junggar Basin, China [101]. Working in the tSWIR between 950 and 2450 nm, the SASI system detected the high CH4 locations using a band ratio method combined with the wavelet transform singularity detection technique. The main CH4 emissions sources were located in the industrial smelting area, especially in and around the oil shale retorting plant. This work shows that airborne HIS can be used for the detection and localization of CH4 emissions to support more informed environmental monitoring regarding hydrocarbon development.
2.8. Mineralogy
HSI has developed into an effective tool in mineralogy, providing precise spectrum analysis with very high spatial resolution to identify and map minerals across a broad range of geological settings, as shown in Figure 9. Because it can collect data over a wide range of wavelengths, HSI will permit the detection of mineral compositions at high precision even in very complex or hostile environments. Recent growth in sensor technologies and ML methods has made HSI more robust and valuable, particularly in the current mineral exploration and geological research.
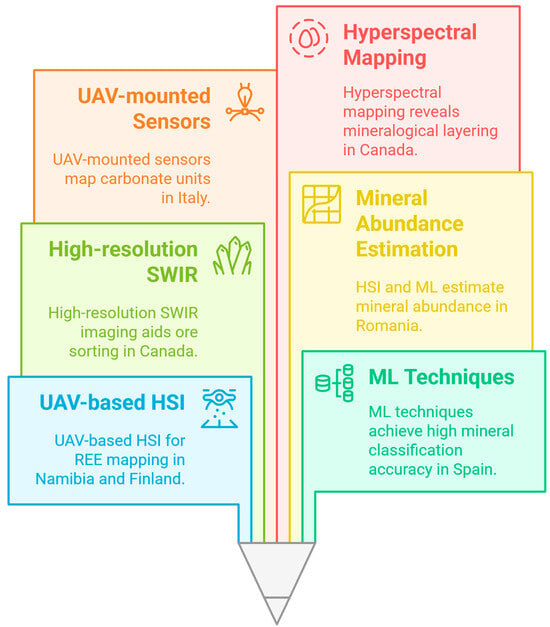
Figure 9.
HSI in mineralogy. HSI enables precise identification of mineral composition and structures in geological samples, supporting both academic research and industrial applications.
Booysen et al. studied the capability of HSI based on UAV for the mapping of rare earth elements (REEs) on carbonatite complexes in Namibia and Finland [102]. The study was performed using the Senop Rikola Hyperspectral Imager with 1.5 cm and 3 cm data resolutions. Field validation for Nd absorption features at 580, 750, and 800 nm was confirmed. It was demonstrated that such an approach can be characterized by an easy and fast way of REE detection with sufficient accuracy for any needs in various and isolated conditions. The latter work built further on this and was conducted by Booysen et al., using the Specim AisaFENIX hyperspectral sensor to map lithium-bearing pegmatites in Namibia [103]. VNIR-SWIR imaging surveys, conducted at a spatial resolution of about 8 cm, identified and mapped minerals like Cookeite and Montebrasite within the pegmatites. These results were validated by laboratory analyses, including X-ray diffraction (XRD) and laser-induced breakdown spectroscopy (LIBS), which support the capability of the sensor toward detailed mineral exploration.
Lobo et al. used several hyperspectral image analyses with the aid of ML techniques, e.g., LDA and RF, to classify minerals of the San Finx tin-tungsten mine, Spain [104]. Using Specim FX10 and FX17 cameras in laboratory conditions enabled overall classification accuracies up to 98%, by distinguishing minerals such as cassiterite and wolframite. This pointed out the potential for precise ore mapping in complex geological settings. In another study, Lypaczewski et al. applied the Specim SisuROCK hyperspectral scanner to the analysis of mineralogy in the Highland Valley Copper district, British Columbia, Canada [105]. This was a high-resolution SWIR imaging on rock samples and drill cores for identification of key minerals, such as muscovite, kaolinite, and prehnite. The results showed discrete mineralogical patterns that help exploration and potential ore sorting at the regional scale of porphyry copper systems.
For their part, Tuşa et al. used the SisuROCK drill-core scanner with the AisaFE-NIX hyperspectral sensor for the estimation of mineral abundance from drill-core samples at the Bolcana porphyry copper-gold system, Romania [106]. The study dealt with VNIR-SWIR HSI and applied several ML models, such as RF, to scale up mineralogical data from scanning electron microscopy with mineral liberation analysis (SEM-MLA) analyses. This is how minerals like white mica, feldspars, and sulfides have been mapped across entire drill cores. Thiele et al. acquired hyperspectral VNIR-SWIR data from cliffs in the Dolomites, Italy, via a HySpex Mjolnir VS-620 system mounted on a UAV [107]. Geometric and radiometric corrections of the data enabled the first successful mapping of dolomitic and calcitic carbonate units in complex geologies that indicate mineralogical differences.
Van Ruitenbeek et al. presented an approach to quantify rock microstructure on hyperspectral mineral maps using a Specim SWIR-LVDS-100-N25E camera [108]. This enabled the successful differentiation of various microstructures—phenocrysts, xenocrysts, and amygdales—through the application of shape parameters to segmented mineral maps of hydrothermally altered volcanic and sedimentary rocks from South Africa. Thus, this proved that a detailed geological study might indeed be possible. MacLagan et al. used HSI to examine drill cores from the Steen River impact structure in Alberta, Canada [109]. The findings showed mineralogical layering in breccias by VNIR, SWIR, and thermal infrared (TIR) hyperspectral mapping that revealed clear sedimentary and crystalline basement-derived units. The presence of alteration minerals, in particular within the SWIR region, indicated a post-impact hydrothermal process. Raza et al. applied HSI technology over the VNIR to SWIR spectral range in their work on stalagmite MAJ-4 from Anjokipoty Cave, Madagascar [110]. To classify and map mineralogical variability in the stalagmite, including major minerals such as aragonite and calcite, ML algorithms were used. A non-invasive method was used to obtain high-resolution information regarding past environmental conditions, and also pointed out the efficiency of HSI application in paleoclimate studies.
2.9. Food Processing
HSI is used in the food processing industry due to its noninvasive and non-destructive properties. It can detect contaminants and identify the differences in food quality and authenticity, as shown in Figure 10.
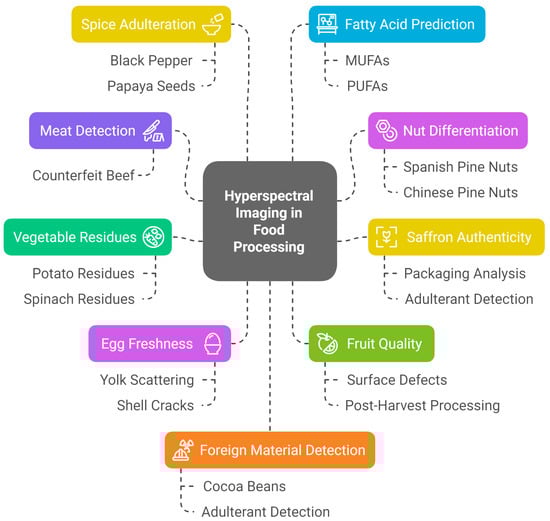
Figure 10.
HSI in food processing. Used to assess freshness, contamination, and classification of food products (e.g., eggs and nuts), HSI ensures quality control in food processing.
Jo et al. worked with diffuse reflectance spectroscopy supported by DL to identify counterfeit beef with particular attention to adulteration using colorants and curing agents [111]. The work was performed on 60 samples of beef from South Korea over the 344–1040 nm range. In the internal validation set, the proposed model, based on AlexNet architecture, reached a classification accuracy of 98.84%, while in the external validation set, it reached 97.61%. This goes far above that of classical methods, such as SVM or logistic regression. Using Grad-CAM, the central key wavelength region for classification was identified as 580–600 nm, showing the capability of HSI in the detection of adulterated beef products. The potential of NIR-HSI coupled with chemometrics for the differentiation of Spanish and Chinese pine nuts was assessed by Ríos-Reina et al. [112]. Analysis was undertaken on 63 nuts using a hyperspectral camera between 940 and 1625 nm with a spatial resolution equal to 200 µm. PCA and MCR were employed to identify key chemical differences, with the methodology demonstrating 84–100% accuracy in classifying nuts according to their labeled origin, thus providing a reliable tool for food authenticity verification.
Ostovar et al. verified whether the saffron stigmas were intact through the packaging by visible-short wavelength NIR-HSI combined with chemometric techniques [113]. A total of 38 saffron samples were measured from Khorasan Razavi, Iran, in the spectral bandwidth of 400 nm–950 nm. MCR-ALS and PLS discriminant analysis reached a classification accuracy of over 97%, correctly classifying authentic and fake saffron, such as calendula, safflower, and saffron style. Seo et al. recently performed VNIR-HSI along with DL for the non-destructive identification of vegetable organic residues on stainless steel surfaces in food processing facilities [114]. With six concentration levels of diluted potato and spinach juices, the VNIR HSI system combined with a spectral bandwidth of 400 nm–1000 nm with a 1D CNN obtained classification accuracies of 99% for potato residues and 98% for spinach residues, demonstrating the effectiveness of the technique for providing food safety by detection of organic contaminants.
Yao et al. tested egg quality for freshness, scattered yolk, and eggshell cracks using the HSI technique [115]. The experiment included 450 eggs purchased from Zhenjiang, China, and a VNIR hyperspectral camera with wavelengths ranging from 401 to 1002 nm. The XGBoost model in this work achieved an R2 of 91% for freshness detection and classification accuracies of 97.33% for scattered yolk eggs and 93.33% for cracked eggs, which is indicative of HSI’s potential to be applied in non-destructive egg quality assessment. Recently, Mahanti et al. used emerging non-invasive imaging methods developed for the detection of fruit damage like biospeckle, X-ray imaging, HSI, and thermal imaging [116]. HSI was particularly found to identify surface defects while assessing fruit quality parameters, which is a very important tool in post-harvest processing for ensuring fruit quality and reducing waste.
Orrillo et al. used NIR-HSI in combination with chemometric methods in detecting adulteration of black pepper by papaya seeds [117]. The research study thus achieved 100% classification accuracy for whole berry samples and more than 90% sensitivity for ground samples, which indicates that NIR-HSI can be reliable in the authentication study. Ma et al. applied predictive models for monounsaturated fatty acids (MUFAs) and polyunsaturated fatty acids (PUFAs) in processed pork meats using NIR HSI [118]. The authors reported high coefficients of determination in the prediction of MUFAs (R2 = 81%) and PUFAs (R2 = 89%), and hence proved HSI as an effective, rapid, non-destructive technique for fatty acid content determination in pork.
Saeidan et al. used SWIR HSI along with chemometric models for detecting foreign materials in cocoa beans, achieving classification accuracies greater than 89% [119]. This study has shown the importance of HSI in guaranteeing quality through the identification of contaminants in cocoa beans. Lastly, Kiani et al. utilized HSI to detect adulteration with materials such as pericarp and shell in nutmegs [120]. As found in the study, an ANN model can detect adulteration levels as low as 5%, giving high accuracy compared to the rest.
2.10. Other Applications
HSI has shown its capabilities to be versatile in all fields and has been successful beyond the traditional application areas. Environmental monitoring for cultural heritage protection its applications are continuously progressing because of increased accuracy and efficiency in applications, as shown in Figure 11. This section will review some emerging applications in this area and innovative uses of HSI across domain areas.
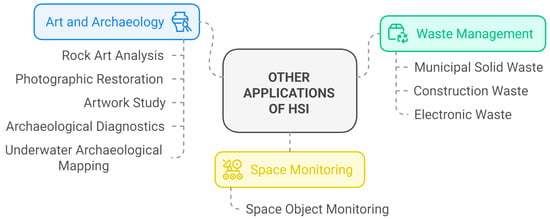
Figure 11.
Other applications of HSI.
Tao et al. developed a new technique combining HSI with ML to classify municipal solid waste (MSW) in northeast China [121]. The study utilized the 900–1700 nm HSI system to identify the inorganic components with an accuracy of almost 100%. Carbon, hydrogen, oxygen contents, and nitrogen contents, along with the low-heating values, were also predicted, with mean relative errors being 7.4%, 13.1%, 19.6%, 45.3%, and 9.5%, respectively. This provides hope for the development of MSW sorting processes. Similarly, Xiao et al. introduced a strong classification algorithm on the basis of an NIR hyperspectral system to effectively separate waste into six categories: wood, plastic, brick, concrete, rubber, and black brick [122]. The work was conducted using a hyperspectral camera with a spectral range of 900 nm–1700 nm. Through 180 samples, the identification rate reached up to 100%. The approach developed in this study is therefore deemed to effectively enhance the sorting efficiency of construction waste under complex conditions.
Possibilities of using the SWIR HSI characterization and sorting of polymeric materials from waste electrical and electronic equipment (WEEE) in the SisuCHEMA XL system were tested by Bonifazi et al. [123]. Here, the group focused on identifying plastic flakes, differentiating polymers, and detecting contaminants in mixed plastic waste streams. This approach exhibited great accuracy in the identification of materials in support of recycling and quality control processes, which are important for the overall improvement of WEEE management. In this context, Vasile et al. investigated HSI coupled with ML to characterize the surface composition and attitude motion of space objects [124]. In performing material identification and attitude reconstruction using light reflected and emitted by space objects against laboratory experiments, this work is expected to have potential accuracy capabilities within a validated high-fidelity simulation model. In this way, this is an approach to improving space situational awareness and monitoring of space debris.
Bayarri et al. applied spectral angle mapper (SAM) and mixture tuned matched filtering (MTMF) to the results of a Specim V10E VNIR HSI system (400–1000 nm) for the investigation of Palaeolithic rock art at the Cave of El Castillo, Spain [125]. They encountered 76% more figures than those obtained with traditional methods. The approach successfully documented pigment cartography, revealing new details of this ancient cultural heritage and significantly contributing to its conservation. Picollo et al. used HSI to study damaged photographic materials for the “Memoria Fotografica” project in Italy [126]. Working with a modified HSI scanner within the 400–900 nm range, they checked the state of color of negative and positive films affected by the flood that happened in 2017 in Leghorn. The method fully supported digital restoration of these materials, showing that the HSI technique could be promising for non-invasive analysis in the interest of cultural heritage.
The technical potential of multifocus HDR VIS/NIR HSI was applied by Martínez et al. for two artworks, “Transfiguration” and an exact copy of “The Golden Haggadah” from the British Library in London [127]. A hyperspectral line scanner has been used for such work, running in the 384–1016 nm spectral range divided into 150 bands, to obtain data with high spectral resolution. The pigment identification and colorimetric analysis under uncontrolled illumination conditions are now feasible, showing an improvement over techniques based on the low dynamic range. Cucci et al. carried out a remote-sensing HSI study of the wall paintings and inscriptions within the archaeological site of Pompeii, Italy [128]. Noninvasively, they identified and mapped pigments and degradation products, such as gypsum, on the surface, using a 400–2500 nm spectral range SIMGA Avionic hyperspectral imager. It was proved that HSI is an effective tool for noninvasive diagnostics in archaeological contexts. Finally, Guyot et al. applied airborne HSI based on a NEO HySpex VNIR-1600 sensor working between 400 and 1000 nm, in an attempt to map submerged archaeological sites in France [129]. Studying the megalithic site of Er Lannic, they used anomaly detection algorithms and radiative transfer modeling to successfully identify and characterize submerged steles. This one-off study formed the basis for the potential use of HSI in non-invasive underwater archaeological mapping.
3. Future Scope and Discussion
3.1. Limitations of HSI
HSI is predominantly utilized in the fields of agriculture and medical imaging. In agriculture, HSI is extensively utilized for crop classification, disease identification, and precision farming because of its capacity to identify nuanced spectral variations in plant health. The non-invasive and label-free characteristics of HSI render it exceptionally beneficial for early illness diagnosis and tissue distinction, particularly in oncology and dermatology. These domains profit from the technological advancement of HSI systems and the urgent need for high-resolution, real-time diagnostics. As technology obstacles diminish, wider implementation is anticipated in fields such as environmental monitoring and food safety. Although HSI has gained much attention in many areas, including remote sensing [130], agriculture [131], and biomedical imaging [132], because of its capability to capture an enormous amount of spectral information, it also poses certain challenges. The main concern associated with HSI is the enormous amount of data generated [133]. The huge advantage of high spectral resolution, while good for detailed analysis, brings about very large datasets that demand an immense number of computational resources in storage, processing, and analysis. Data-intensive outputs like that are particularly demanding, and many times their management requires advanced algorithms and hardware for real-time applications. Currently, an HSI system includes several bulky components, including spectrographs, cameras, light sources, and data processing platforms. These resources are mostly embedded in a black box, making the system cumbersome, large, and hard to carry. Hence, such systems can only be applied within controlled environments, such as laboratories or at an industrial site. Limited size, portability, and mobility make even more demanding field-based or real-time applications especially challenging in agriculture or other fields [134]. Furthermore, this demands further miniaturization of the HSI technology to become versatile and adaptable on-site.
Another limiting factor is how either spatial or spectral resolution is compromised [135]. Higher spatial resolution often means less spectral resolution, which will reduce the capability of HSI for applications that might need high spatial detail. Also, poor spatial resolution may create a problem in distinguishing closely located objects or features, especially in complicated environments. HSI is also sensitive to environmental conditions. Factors such as variations in illumination [136], atmospheric interferences, and weather changes are some of the major variables capable of significantly affecting the quality of data collected, especially outdoors. Most of these factors require long calibration and correction processes to be included to maintain accuracy in the spectral measurements made. Furthermore, hyperspectral data acquisition time can be very slow, which translates to motion artifacts in dynamic scenes, hence a critical issue in medical and surveillance applications.
Cost is another major limitation since hyperspectral cameras and sensors are costlier than traditional imaging systems and, therefore, not adoptable for the broader application of commercial and industrial use in industry and consumers [137]. Hyperspectral hardware is costly because of the complexity of the configuration and associated control, making it unattractive for low-priced applications. High costs cause HSI technology to not be easily accessible in low-resource settings or smaller research institutions. In addition, there may be a problem of spectral redundancy in such a way that bands adjacent to each other may contain duplicate information, really making the extraction of features useful for a classification/prediction task very intricate [138]. Overall, HSI offers unrivaled spectral detail, but its limitations include data complexity, sensitivity to environmental factors, cost, and interpretation challenges in practical applications.
The substantial expenditures of equipment, data volume, and technological complexity are frequently recognized as constraints of HSI, with a notably pronounced effect on industrial applications. The requirement for specialized, frequently cumbersome sensors constrains portability and scalability in field operations. The substantial volume of high-dimensional spectral data necessitates robust computational infrastructure, which may be impractical in real-time or resource-limited settings. These characteristics lead to elevated operational expenses, protracted deployment, and integration difficulties within current industrial pipelines. Overcoming these obstacles via compact hardware, real-time processing algorithms, and economical sensor development is essential for the widespread industrial implementation of HSI technologies. Notwithstanding the extensive promise of HSI, numerous technological obstacles persist, impeding its widespread implementation. A significant constraint is the challenge of spectrum calibration. Precise spectrum calibration is crucial for guaranteeing the dependability of hyperspectral data, especially when contrasting outcomes across instruments, temporal intervals, or environmental circumstances. Calibration mistakes may result in inconsistent spectral signatures, hence impacting classification accuracy and model generalizability. Comprehensive calibration protocols and consistency across HSI systems require additional advancement. A significant difficulty is the substantial computational resource requirement for HSI data processing. Hyperspectral images possess tremendous dimensionality, comprising hundreds of spectral bands for each pixel. This necessitates considerable storage, memory, and computing capabilities, particularly for real-time or mobile applications. Effective data compression, dimensionality reduction, and edge computing solutions are essential for enhancing the scalability and practicality of HSI. To mitigate these constraints, researchers are increasingly utilizing AI-accelerated algorithms that employ deep learning models for expedited and precise data interpretation. Methods like lightweight neural networks and model pruning can substantially decrease processing demands while preserving performance. Moreover, progress in the development of economical sensors, such as miniaturized and chip-based HSI systems, is enhancing the technology’s accessibility for field applications. These developments offer potential for enhancing HSI adoption in resource-constrained environments and real-time applications across sectors like agricultural, medical diagnostics, and environmental monitoring. Future research must persist in merging AI with hardware innovations to surmount existing restrictions and realize the complete promise of HSI.
In conclusion, HSI encounters numerous significant hurdles that restrict its wider implementation. A significant concern is the elevated expense and intricacy of HSI hardware, especially for portable and real-time applications. The substantial quantity of high-dimensional spectral data presents considerable challenges in storage, processing, and interpretation. The efficient extraction of significant features necessitates sophisticated algorithms; nonetheless, numerous existing techniques exhibit a deficiency in generalizability across various domains. The trade-off between spectral and spatial resolution constitutes a technical limitation, frequently necessitating concessions in image quality. Moreover, there exists a deficiency of extensive, annotated datasets essential for training resilient deep learning models, particularly in medical and environmental domains. Ultimately, the absence of consistency in acquisition technologies and evaluation standards impedes reproducibility and comparability among investigations. Confronting these obstacles is crucial for the effective implementation of HSI technologies and for realizing their complete potential in practical applications.
3.2. Future Scope of HSI
Although HSI possesses immense potential in a wide range of applications, its full adoption is still restricted by shortcomings that involve issues with data complexity, various spectral-spatial trade-offs, slow data acquisition, high costs, and spectral redundancy. The breaking down of these present limitations opens up further avenues for narrowing the gap, both in capability and access to the technology.
One of the main methods to manage large datasets in HSI is by utilizing AI and DL techniques [139]. AI can enhance the processing and interpretation of volumes of data, hence increasing efficiency in such analysis. DL algorithms can extract insights that will be accurate and actionable in many fields, like environmental monitoring, counterfeit detection, and medical diagnostics. AI can assist in leveraging a huge and complex amount of data generated by HSI for effective data analysis to enable better real-time decision-making across different sectors. Due to the limitations of imaging devices, there is always a spectral-spatial tradeoff in HSI. This makes it impossible to maintain high spatial resolution while maintaining high spectral resolution. Recently, with great progress in DL, hyperspectral image super-resolution techniques have been developed to enhance the spatial resolution while maintaining the spectral integrity [140]. Deep neural networks learn complex spatial-spectral correlations in HSI and then reconstruct high-resolution images. DL methods have achieved much promise in recent years by utilizing external datasets and advanced network architectures to maintain fine spectral detail with improved spatial resolution, thereby outperforming the trade-off compared to conventional methods.
Another major drawback of HSI is that data acquisition is very slow, especially in the case of dynamic scenes. A very good remedy for this is adaptive acquisition and data analysis (AADA), which integrates ML techniques with adaptive sampling algorithms that would optimize scanning [141]. AADA focuses on the most informative image regions in the scene, hence accelerating the acquisition process while reducing motion artifacts. This development works well in applications requiring rapid data collection, such as medical imaging and surveillance. The high cost associated with HSI systems has been the reason that it has not been exploited to a greater extent for commercial and industrial uses [142]. Recent developments have therefore put great hopes on developing low-cost hyperspectral systems that would be created utilizing commercially off-the-shelf elements. These low-budget imagers could achieve quantitative and qualitative hyperspectral measurements using miniature spectrometers and simple configurations, similar to advanced high-end systems. In this direction, HSI will become more accessible for laboratory-based environmental applications and smaller research institutions.
Techniques such as PCA handle huge HSI datasets by reducing the complexity of the data to focus on key spectral features that streamline analysis. RGB-to-HSI conversion algorithms also allow the simulation of HSI using standard RGB cameras, hence decreasing system costs while maintaining the majority of the essential spectral information. This makes HSI more accessible for a wide range of applications. To deal with spectral redundancy, Inter-Band Redundancy Analysis is used, which is a dimensionality reduction technique that evaluates and determines collinearity among bands to retain only the most informative bands by removing redundant data [143]. This is performed to handle computational load and storage requirements by retaining only the essential data required for effective classification and prediction. A contribution of this nature in the area of HSI makes the data more manageable and enhances its practical utility in various fields. In the remote sensing field, satellite-based hyperspectral imagery generally suffers from low spatial resolution, which hampers its broader application. For instance, classical satellite hyperspectral sensors such as EO-1 Hyperion (30 m), PRISMA (30 m), and Gaofen-5 (30 m) exemplify the typical spatial limitations encountered.
Recent developments in hyperspectral image super-resolution (HSI-SR) have mitigated the limited spatial resolution of satellite HSI, hence enhancing its remote sensing applications [144,145]. Unsupervised deep learning techniques, including Enhanced Deep Image Prior, Model-Informed Multistage Networks, and X-shaped Interactive Autoencoders with cross-modality mutual learning, have exhibited encouraging outcomes [146,147,148]. These methodologies enhance spatial resolution without dependence on extensive training datasets, providing pragmatic options for improving hyperspectral image quality in practical applications and broadening their applicability. In addition to domain-specific applications, advanced image processing techniques are playing an increasingly important role in enhancing HSI capabilities. For example, causal knowledge fusion has demonstrated effectiveness in complex tasks such as 3D cross-modality cardiac image segmentation, providing a framework for integrating heterogeneous data sources to improve diagnostic accuracy [149]. Generative adversarial networks (GANs) have also made significant contributions to medical imaging, particularly in image enhancement, data augmentation, and modality translation, which could be extended to HSI applications facing data scarcity and noise challenges [150]. Furthermore, real-time requirements in precision agriculture may benefit from approaches like efficient sparse tensor core networks, which have achieved notable success in high-speed insect classification using minimal computational resources [151]. Incorporating such state-of-the-art image processing strategies into HSI workflows can enhance data interpretation, improve computational efficiency, and broaden the scope of real-world deployment across sectors such as healthcare, agriculture, and environmental monitoring.
4. Conclusions
The contribution of HSI to various diverse fields, from counterfeit detection and remote sensing to medical imaging and cancer detection, is already significant. Detailed spectral information capture ensures the possibility of enabling more precise material analyses and early detection than is possible by traditional approaches in so many applications. Despite carrying enormous potential, there are a number of challenges with HSI. Some of these challenges include the high cost of equipment, requirements for advanced data processing, and requirements for high levels of expertise. Apart from these, high tradeoffs between spectral-spatial resolution and environmental sensitivity during data collection are also limiting. In the near future, these challenges should be resolved by AI, DL, and the creation of affordable HSI systems. With such continuous development, in the future it will be easier to access and apply HSI in various industries and research areas, making greater improvements in precision diagnosis, environmental regulation, and scientific research.
Author Contributions
Conceptualization, H.-C.W. and A.M.; data curation, M.A.E.V., J.J. and A.M.; formal analysis, J.J., R.K. and A.M.; funding acquisition, M.-F.C., A.M. and H.-C.W.; investigation, J.J., R.K. and A.M.; methodology, J.J., H.-C.W. and A.M.; project administration, M.-F.C., A.M. and H.-C.W.; resources, M.-F.C., H.-C.W. and A.M.; software, M.A.E.V., J.J. and A.M.; supervision, M.-F.C., R.K. and H.-C.W.; validation, J.J. and R.K.; writing—original draft, M.A.E.V., J.J., R.K. and A.M.; writing—review and editing, J.J., R.K., A.M. and H.-C.W. All authors have read and agreed to the published version of the manuscript.
Funding
National Science and Technology Council, the Republic of China, under grants NSTC 113-2221-E-194-011-MY3 and Zuoying Armed Forces General Hospital Research Program ZYAFGH_A_114015 in Taiwan.
Data Availability Statement
Not applicable.
Conflicts of Interest
Author Hsiang-Chen Wang was employed by Hitspectra Intelligent Technology Co., Ltd. The rest authors declare that the research was conducted in the absence of any commercial or financial relationships that could be construed as a potential conflict of interest.
Appendix A
Appendix A.1. Counterfeit Detection

Table A1.
Application of HSI in counterfeit detection.
Table A1.
Application of HSI in counterfeit detection.
| Author | Title | Technique Used | Result |
|---|---|---|---|
| Arvind Mukundan | Automatic Counterfeit Currency Detection Using a Novel Snapshot Hyperspectral Imaging Algorithm. The mean gray values (MGVs) of two distinct regions of interest (ROIs) are selected from three samples of 100 NTD Taiwanese currency notes and compared with three samples of counterfeit 100 NTD notes. | Using Raspberry Pi 4 Model B and Raspberry Pi Camera | Developed a snapshot-based VIS-HSI algorithm that converts RGB images into hyperspectral images. Effective detection of Taiwanese counterfeit currency without using moving components or expensive hyperspectral cameras. |
| Timea Frosch | Counterfeit and Substandard Test of the Antimalarial Tablet Riamet® by Means of Raman Hyperspectral Multicomponent Analysis | Raman Spectroscopy Imaging and PLSR Modelling | Fast, noninvasive, and precise measurement of multiple API concentrations in pharmaceutical tablets. Detection of counterfeit antimalarial tablets. |
| Laureen Coic | Comparison of hyperspectral imaging techniques for the elucidation of falsified medicines composition | Raman microscopy and Fourier Transform Infrared (FT-IR) microscopy | Applied HSI for the detection of falsified medicines. The formulation composition of organic and inorganic compounds is explained. Compared Raman microscopy and FT-IR microscopy. Raman hyperspectral imaging seems to be more suited to detect low-dose compounds, possibly due to the smallest sampling volume. |
| Faryal Aurooj Nasir | A hyperspectral unmixing approach for ink mismatch detection in unbalanced clusters | k-means clustering and Gaussian mixture models (GMMs) | Demonstrates that HSI can be used to distinguish virtually similar inks and can be used for verifying document authenticity. |
| Youli Wu | Counterfeit detection of bulk Baijiu based on fluorescence hyperspectral technology and machine learning | Principal component analysis, AdaBoost | Demonstrates that Fluorescence hyperspectral technology, along with machine learning, can be used to detect adulterated bulk baijiu effectively. The AdaBoost Model had the best performance with 99.03% F1-score, 98.08% Precision, and 100% recall. |
| Antoine Laborde | Detection of chocolate powder adulteration with peanut using near-infrared hyperspectral imaging and Multivariate Curve Resolution | PCA, MCR-ALS, MCR-ALS-CSEL | Demonstrated the ability of NIR-HSI, along with the chemometric method MCR-ALS, to detect peanut flour in chocolate powder. |
| Zhiwei Jiang | Data fusion based on near-infrared spectroscopy and hyperspectral imaging technology for rapid adulteration detection of Ganoderma lucidum spore powder | NIRS, HIS, LLF, MLF | NIRS and HSI techniques are used to detect adulteration in GLSP and predict the level. The performance of NIRS was better than that of HSI. MLF had the best accuracy (100%). |
| S. S. Veling | Fake Indian Currency Recognition System by using MATLAB | Fluorescence-based HSI analysis and Extraction and comparison of features from real and fake | Implementation of a fake note detection unit with image processing algorithms. |
| Yuqian Shang | Authenticity, Discrimination, and Adulteration Level Detection of Camellia Seed Oil via Hyperspectral Imaging Technology | Support Vector Machine (SVM), Linear Discriminant Analysis (LDA), Partial Least Squares regression (PLS), Synergy Interval Partial Least Squares regression | Demonstrated that the HSI technique can be used to detect the adulteration level in camellia seed oil. The accuracy of SVM and LDA models in verifying the authenticity of camellia seed oil could reach up to 100%. |
| Yan Hu | Non-destructive detection of Tieguanyin adulteration based on fluorescence hyperspectral technique | support vector classification (SVC), support vector regression (SVR), PCA | Fluorescence HSI technology can be used in the non-destructive detection of adulterated tea. SVC with derivative pre-processing had a recall, precision, and accuracy of 100%. Second derivative PCA-SVR had the best result in detecting the adulteration degree with Rc2 and Rp2 of 0.9298 and 0.9124. And RMSEC and RMSEP of 0.09 and 0.1044. |
| Fábio do Prado Puglia | Identifying the most relevant tablet regions in the image detection of counterfeit medicines | Support Vector Machine (SVM) | Classified the testing data set of Cialis and Viagra with 100% accuracy. |
| Arvind Mukundan | Portable and low-cost hologram verification module using a snapshot-based hyperspectral imaging algorithm | Using the Raspberry Pi 4 processor and the Raspberry Pi Camera, the VIS-HSI conversion algorithm | Designed a low-cost and portable module to detect duplicate holograms. Developed a VIS-HSI algorithm to convert RGB images into hyperspectral images. |
Appendix A.2. Remote Sensing
Table A2.
Application of HSI in Remote Sensing.
Table A2.
Application of HSI in Remote Sensing.
| Author | Title | Technique Used | Result |
|---|---|---|---|
| Arvind Mukundan | Automatic Counterfeit Currency Detection Using a Novel Snapshot Hyperspectral Imaging Algorithm. The mean gray values (MGVs) of two distinct regions of interest (ROIs) are selected from three samples of 100 NTD Taiwanese currency notes and compared with three samples of counterfeit 100 NTD notes. | Using Raspberry Pi 4 Model B and Raspberry Pi Camera | Developed a snapshot-based VIS-HSI algorithm that converts RGB images into hyperspectral images. Effective detection of Taiwanese counterfeit currency without using moving components or expensive hyperspectral cameras. |
| Timea Frosch | Counterfeit and Substandard Test of the Antimalarial Tablet Riamet® by Means of Raman Hyperspectral Multicomponent Analysis | Raman Spectroscopy Imaging and PLSR Modelling | Fast, noninvasive, and precise measurement of multiple API concentrations in pharmaceutical tablets. Detection of counterfeit antimalarial tablets. |
| Laureen Coic | Comparison of hyperspectral imaging techniques for the elucidation of falsified medicines composition | Raman microscopy and Fourier Transform Infrared (FT-IR) microscopy | Applied HSI for the detection of falsified medicines. The formulation composition of organic and inorganic compounds is explained. Compared Raman microscopy and FT-IR microscopy. Raman hyperspectral imaging seems to be more suited to detect low-dose compounds, possibly due to the smallest sampling volume. |
| Faryal Aurooj Nasir | A hyperspectral unmixing approach for ink mismatch detection in unbalanced clusters | k-means clustering and Gaussian mixture models (GMMs) | Demonstrates that HSI can be used to distinguish virtually similar inks and can be used for verifying document authenticity. |
| Youli Wu | Counterfeit detection of bulk Baijiu based on fluorescence hyperspectral technology and machine learning | Principal component analysis, AdaBoost | Demonstrates that Fluorescence hyperspectral technology, along with Machine learning, can be used to detect adulterated bulk baijiu effectively. The AdaBoost Model had the best performance with 99.03% F1-score, 98.08% Precision, and 100% recall. |
| Antoine Laborde | Detection of chocolate powder adulteration with peanut using near-infrared hyperspectral imaging and Multivariate Curve Resolution | PCA, MCR-ALS, MCR-ALS-CSEL | Demonstrated the ability of NIR-HSI, along with the chemometric method MCR-ALS, to detect peanut flour in chocolate powder. |
| Zhiwei Jiang | Data fusion based on near-infrared spectroscopy and hyperspectral imaging technology for rapid adulteration detection of Ganoderma lucidum spore powder | NIRS, HIS, LLF, MLF | NIRS and HSI techniques are used to detect adulteration in GLSP and predict the level. The performance of NIRS was better than that of HSI. MLF had the best accuracy (100%). |
| S. S. Veling | Fake Indian Currency Recognition System by using MATLAB | Fluorescence-based HSI analysis and Extraction and comparison of features from real and fake | Implementation of a fake note detection unit with image processing algorithms. |
| Yuqian Shang | Authenticity, Discrimination, and Adulteration Level Detection of Camellia Seed Oil via Hyperspectral Imaging Technology | Support Vector Machine (SVM), Linear Discriminant Analysis (LDA), Partial Least Squares regression (PLS), Synergy Interval Partial Least Squares regression | Demonstrated that the HSI technique can be used to detect the adulteration level in camellia seed oil. The accuracy of SVM and LDA models in verifying the authenticity of camellia seed oil could reach up to 100%. |
| Yan Hu | Non-destructive detection of Tieguanyin adulteration based on fluorescence hyperspectral technique | support vector classification (SVC), support vector regression (SVR), PCA | Fluorescence HSI technology can be used in the non-destructive detection of adulterated tea. SVC with derivative pre-processing had a recall, precision, and accuracy of 100%. Second derivative PCA-SVR had the best result in detecting the adulteration degree with Rc2 and Rp2 of 0.9298 and 0.9124, and an RMSEC and RMSEP of 0.09 and 0.1044. |
| Fábio do Prado Puglia | Identifying the most relevant tablet regions in the image detection of counterfeit medicines | Support Vector Machine (SVM) | Classified the testing data set of Cialis and Viagra with 100% accuracy. |
| Arvind Mukundan | Portable and low-cost hologram verification module using a snapshot-based hyperspectral imaging algorithm | Using the Raspberry Pi 4 processor and the Raspberry Pi Camera, the VIS-HSI conversion algorithm | Designed a low-cost and portable module to detect duplicate holograms. Developed a VIS-HSI algorithm to convert RGB images into hyperspectral images. |
| Shen-En Qian | Hyperspectral Satellites, Evolution, and Development History | Survey on space-borne hyperspectral imagers | Identified 25 space-borne HSI instruments (19 around Earth, 6 for missions to the Moon, Mars, Venus, and comets). |
| Africa Ixmucane Flores-Anderson | Hyperspectral Satellite Remote Sensing of Water Quality in Lake Atitlán, Guatemala | Semi-empirical algorithm based on the three-band model to evaluate water quality (chlorophyll-a) | Generated a 33% relative error in modeling chlorophyll-a concentration using hyperspectral data. |
| Bing Zhang | Progress and Challenges in Intelligent Remote Sensing Satellite Systems | Smart remote sensing satellite system | Enabled real-time customized remote sensing services using hyperspectral data, with challenges like privacy and data sharing regulations. |
| Mariusz E. Grøtte | Ocean Color Hyperspectral Remote Sensing With High Resolution and Low Latency—The HYPSO-1 CubeSat Mission | 6U CubeSat for ocean color hyperspectral remote detection | Achieved high-resolution data essential for marine ecosystem studies. |
| Lin Sun | Satellite data cloud detection using deep learning supported by hyperspectral data | Deep learning frameworks for satellite data cloud detection | Improved overall accuracy in identifying cloud-covered areas in hyperspectral images. |
| Yin-Nian Liu | The Advanced Hyperspectral Imager: Aboard China’s GaoFen-5 Satellite | Gaofen-5 satellite for environmental monitoring | Provided improved spectral resolution for environmental monitoring tasks using 330 spectral bands. |
| Jakub Nalepa | Towards On-Board Hyperspectral Satellite Image Segmentation: Understanding Robustness of Deep Learning through Simulating Acquisition Conditions | Spectral and spectral-spatial CNN for segmenting hyperspectral satellite images | Demonstrated enhanced effectiveness for segmentation when tested against test data obtained under various conditions. |
| Elia Vangi | The New Hyperspectral Satellite PRISMA: Imagery for Forest Types Discrimination | Comparison of the PRISMA hyperspectral sensor with other sensors | PRISMA sensor superior in distinguishing various forest types, outperforming others by 50% in one region and 30% in another region. |
| Simone Pascucci | Special Issue “Hyperspectral Remote Sensing of Agriculture and Vegetation” | Drone-based HSI with neural networks, random forests, and SVMs for terrestrial ecosystem classification | Demonstrated effectiveness of using HSI with neural networks, RF, and SVMs for classifying intricate terrestrial ecosystems. |
| Xiangtian Meng | Soil Organic Matter Prediction Model with Satellite Hyperspectral Image Based on Optimized Denoising Method | Gaofen-5 hyperspectral data and RF models to predict soil organic matter (SOM) | Identified 0.6-order discrete wavelet transform (DWT) as the best approach for reducing noise and improving prediction accuracy of SOM content using RF models. |
Appendix A.3. Agriculture
Table A3.
Application of HSI in agriculture.
Table A3.
Application of HSI in agriculture.
| Author | Title | Technique Used | Result |
|---|---|---|---|
| Changwei Wang | Evaluating satellite hyperspectral (Orbita) and multispectral (Landsat 8 and Sentinel-2) imagery for identifying cotton acreage | Comparison of satellite hyperspectral (Orbita) and multispectral (Gaofen-1) data for cotton monitoring. | Orbita HSI had higher spectral reflectance and classification accuracy than Gaofen-1, making it more effective for detailed crop monitoring. |
| Loganathan Agilandeeswari | Crop Classification for Agricultural Applications in Hyperspectral Remote Sensing Images | Crop classification using HSI. | Accuracy—Indian Pines dataset: Corn (96.81%) and Soya (97.75%). Salinas dataset: Fallow (97.93%) and Romaine Lettuce (98.01%). |
| Imran Ali | Hyperspectral Images-Based Crop Classification Scheme for Agricultural Remote Sensing | Hyperspectral Imaging (HSI): VNIR range of 400–1000 nm, 180 spectral bands. Edge-Preserving Features (EPF): Extracted using edge-preserving filters. Component Analysis (PCA): Applied to reduce dimensionality. Support Vector Machines (SVM): Used for multiclass crop classification. | Achieved over 90% accuracy across all evaluation metrics. Outperformed existing methods with up to 99% classification accuracy. |
| Anand S. Sahadevan | Extraction of spatial-spectral homogeneous patches and fractional abundances for field-scale agriculture monitoring using airborne hyperspectral images | An unsupervised algorithm to extract spatial-spectral homogeneous patterns in crop images. | Improved Accuracy: Enhanced segmentation accuracy and better detection of homogeneous regions. Effective on Multiple Datasets: Proven robust across various hyperspectral datasets. |
| Alessandro Matese | Are unmanned aerial vehicle-based hyperspectral imaging and machine learning advancing crop science? | UAV-based hyperspectral imaging (HSI) and machine learning (ML). Used for crop field data collection, including yield, nitrogen content, leaf chlorophyll, biomass estimation, leaf area index (LAI), and stress detection. Data Analysis: Employed various models and indices to interpret hyperspectral data for specific crop applications. | Inconsistent Outcomes: Studies reviewed showed varied and often contradictory results. High Complexity and Cost: HSI and ML are sophisticated but expensive, especially for low-value crops. Potential: Despite challenges, HSI and ML have significant potential for improving precision agriculture by enhancing data accuracy and reliability. |
| Bowen Niu | HSI-TransUNet: A transformer-based semantic segmentation model for crop mapping from UAV hyperspectral imagery | HSI-TransUNet model for semantic segmentation of crop types. | Accuracy: Achieved 86.05% overall in crop identification. Effectiveness: Outperformed other segmentation models. |
| J. Geipel | Forage yield and quality estimation by means of UAV and hyperspectral imaging | Canopy reflectance for forage yield estimation. | Prediction Accuracy: FM: R2 = 0.60, RMSE = 2550 kg/ha DM: R2 = 0.65, RMSE = 555 kg/ha CP: R2 = 0.79, RMSE = 1.32 g/100 g DM DMD: R2 = 0.46, RMSE = 1.71 g/100 g DM NDF: R2 = 0.48, RMSE = 2.72 g/100 g DM iNDF: R2 = 0.28, RMSE = 1.32 g/100 g DM. Comparison with SLR Models: PPLSR models outperformed SLR models in all metrics. |
| Keshav D. Singh | UAV-Based Hyperspectral Imaging Technique to Estimate Canola (Brassica napus L.) Seedpods Maturity | UAV-based HSI for evaluating canola seedpod maturity. | Accuracy: CPMI showed strong relationships with pod and seed moisture (R2 = 0.81–0.98 for pods and R2 = 0.66–0.85 for seeds). Effectiveness: CPMI effectively differentiated genotypes with variable maturity times. |
| Salvador Gutiérrez | Ground-based hyperspectral imaging for extensive mango yield estimation | Ground-based HSI for mango yield estimation. | Accuracy: Achieved determination coefficients up to 0.75 against manual field counts and 0.83 against RGB mango counts. Effectiveness: Demonstrated that HSI can accurately estimate mango yield, supporting its use for multiple traits in orchards. |
| Yingli Cao | Inversion modeling of japonica rice canopy chlorophyll content with UAV hyperspectral remote sensing | Successive Projection Algorithm (SPA): Used for dimension reduction of hyperspectral data, selecting characteristic bands (410 nm, 481 nm, 533 nm, 702 nm, 798 nm). Extreme Learning Machine (ELM) with Particle Swarm Optimization (PSO): Developed an inversion model to predict chlorophyll content. | Accuracy: Achieved an R2 of 0.791 and RMSE of 8.215 mg/L, significantly better than conventional methods. |
| Yue Shi | Novel CropdocNet Model for Automated Potato Late Blight Disease Detection from Unmanned Aerial Vehicle-Based Hyperspectral Imagery | CropdocNet Model: A deep learning model designed to detect late blight disease from UAV hyperspectral imagery. Spectral-Spatial Hierarchical Structure: Utilizes multiple capsule layers to capture the relationship between spectral and spatial features. | Accuracy: Achieved 98.09% accuracy on the testing dataset and 95.75% accuracy on the independent dataset. |
| Pauli Putkiranta | The value of hyperspectral UAV imagery in characterizing tundra vegetation | Hyperspectral UAV Imaging: Compared to multispectral UAV imaging and traditional broadband aerial imaging. Random Forest Regression and Classification: Used to model plant biomass, leaf area index, species richness, Shannon’s diversity index, and community composition. | Accuracy: Best R2 values were 0.60 for biomass and 0.65 for leaf area index, 0.53 for species richness, and 0.46 for Shannon’s index. Hyperspectral imaging outperformed multispectral imaging when topographic data was excluded, but improvements were minimal when topographic data was included (0–10 percentage point increase). |
Appendix A.4. Medical Imaging
Table A4.
Application of HSI in medical imaging.
Table A4.
Application of HSI in medical imaging.
| Author | Title | Technique Used | Result |
|---|---|---|---|
| Viktor Dremin | Skin Complications of Diabetes Mellitus Revealed by Polarized Hyperspectral Imaging and Machine Learning | Polarization-enhanced HSI combined with neural networks to assess skin complications in diabetic patients. | Elevated BVF and lowered SBO in diabetic patients, indicating microcirculation impairments. |
| Marco La Salvia | Neural Networks-Based On-Site Dermatologic Diagnosis through Hyperspectral Epidermal Images | CNN,ResNet-18, ResNet-50, ResNet-101. | ResNet3D: Specificity 88%, Sensitivity 87%. |
| Yasser H. El-Sharkawy | Automated hyperspectral imaging for non-invasive characterization of human eye vasculature: A potential tool for ocular vascular evaluation | K-means clustering. | Reliable differentiation of vascular structures with k-means clustering and phase analysis. |
| Francesca Manni | Hyperspectral Imaging for Glioblastoma Surgery: Improving Tumor Identification Using a Deep Spectral-Spatial Approach | 2D CNN, 1D DNN, SVM, | Specificity 80%. |
| Oscar MacCormac | Lightfield hyperspectral imaging in neuro-oncology surgery: an IDEAL 0 and 1 study | Light-field HSI for intraoperative tissue differentiation in neuro-oncology surgery. | The system integrated well into the neurosurgical workflow, providing significant spectral data for tissue differentiation. |
| Madeleine T. Thomaßen | In vivo evaluation of a hyperspectral imaging system for minimally invasive surgery (HSI-MIS) | CE-certified HSI system for minimally invasive gastrointestinal surgery. | (RMSE)-0.14 (±0.06). |
| Torsten Schulz | Burn depth assessment using hyperspectral imaging in a prospective single-center study. | HSI to measure burn depth in second and third-degree burns. | Specificity 71%, Sensitivity 92%. |
| Xavier Hadoux | Non-invasive in vivo hyperspectral imaging of the retina for potential biomarker use in Alzheimer’s disease | Retinal HSI to examine amyloid beta accumulation as a biomarker for Alzheimer’s disease. | Significant differences in retinal spectra between Aβ PET+ and Aβ PET− groups, suggesting non-invasive HSI as a biomarker for brain Aβ burden. |
| Emi Ueda | Distinct retinal reflectance spectra from retinal hyperspectral imaging in Parkinson’s disease | Retinal HSI to identify spectral signatures in Parkinson’s disease patients. | Inferotemporal retina: Accuracy 55%, Specificity 50%, Sensitivity 60%. Superonasal retina: Sensitivity 60.0%, Specificity 55.0%, Accuracy 57.5%. |
| Robin Vosahlo | Differentiation of Occlusal Discolorations and Carious Lesions with Hyperspectral Imaging In Vitro | kNN, SVM. | Specificity 80.00%, Sensitivity 95.00% |
Appendix A.5. Cancer Detection
Table A5.
Application of HSI in cancer detection.
Table A5.
Application of HSI in cancer detection.
| Author | Title | Technique Used | Result |
|---|---|---|---|
| Boris Jansen-Winkeln | Feedforward Artificial Neural Network-Based Colorectal Cancer Detection Using Hyperspectral Imaging: A Step towards Automatic Optical Biopsy | HSI with a feedforward ANN for colorectal cancer (CRC) detection | Sensitivity: 86%, Specificity: 95% |
| Raquel Leon | VNIR–NIR hyperspectral imaging fusion targeting intraoperative brain cancer detection | Combination of NIR and VNIR HSI for intraoperative brain cancer detection | Classification accuracy improved by 21% |
| Cho-Lun Tsai | Hyperspectral Imaging Combined with Artificial Intelligence in the Early Detection of Esophageal Cancer | HSI with DL for early detection of esophageal cancer | WLI prediction accuracy: 88%, NBI prediction accuracy: 91% |
| Giordana Florimbi | Towards Real-Time Computing of Intraoperative Hyperspectral Imaging for Brain Cancer Detection Using Multi-GPU Platforms | HSI (VNIR A-Series push-broom camera) | Real-time classification in less than 3 s |
| Himar Fabelo | In-Vivo Hyperspectral Human Brain Image Database for Brain Cancer Detection | In-vivo HSI system for brain cancer detection, part of the HELICoiD project | Successfully distinguished tumor tissue from healthy tissue in 22 patients |
| Tsung-Jung Tsai | Intelligent Identification of Early Esophageal Cancer by Band-Selective Hyperspectral Imaging | Band-selective HSI with DL for esophageal cancer detection | Sensitivity: 85.6%, Precision: 88.5% |
| Martin Halisek | Hyperspectral Imaging of Head and Neck Squamous Cell Carcinoma for Cancer Margin Detection in Surgical Specimens from 102 Patients Using Deep Learning | HSI with DL for head and neck squamous cell carcinoma (HNSCC) detection | AUC of 0.85–0.95 for conventional SCC, AUC of 0.91 for HPV+ SCC |
| Martin Halicek | Optical biopsy of head and neck cancer using hyperspectral imaging and convolutional neural networks | HSI with CNNs for optical biopsy of head and neck cancer | Accuracy: 81%, Sensitivity: 81%, Specificity: 80%, AUC: 0.82 |
| Samuel Ortega | Hyperspectral Imaging for the Detection of Glioblastoma Tumor Cells in H&E Slides Using Convolutional Neural Networks | CNNs with HSI for glioblastoma detection on H&E-stained slides | Sensitivity: 88%, Specificity: 77% (7% and 8% improvement over RGB classification) |
| Sami Puustinen | Hyperspectral Imaging in Brain Tumor Surgery—Evidence of Machine Learning-Based Performance | HSI with ML for intraoperative brain tumor surgery | 80% multi-tissue classification accuracy |
Appendix A.6. Environmental Detection
Table A6.
Application of HSI in environmental detection.
Table A6.
Application of HSI in environmental detection.
| Author | Title | Technique Used | Result |
|---|---|---|---|
| Mary B. Stuart | High-Resolution Hyperspectral Imaging Using Low-Cost Components: Application within Environmental Monitoring Scenarios | Cost-effective HSI system developed using a Hamamatsu C13440 camera | Captured fine-scale surface details in gneiss and basalt |
| Sara Freitas | Remote Hyperspectral Imaging Acquisition and Characterization for Marine Litter Detection | Specim FX10e camera for litter detection, RF and SVM models for analysis | 70–80% accuracy in litter detection from manned/unmanned aerial platforms |
| Stefania Piarulli | Rapid and direct detection of small microplastics in aquatic samples by a new near-infrared hyperspectral imaging (NIR-HSI) method | NIR-HSI used for detecting microplastics in aquatic samples | Detected MPs as small as 80 µm on filters without manual pre-sorting |
| Arvind Mukundan | Air Pollution Detection Using a Novel Snapshot Hyperspectral Imaging Technique | HSI using DJI MAVIC MINI camera, 3D CNN Auto Encoder, and PCA with VGG-16 | 85.93% classification accuracy of PM2.5 concentration categories |
| Marco Balsi | High-Resolution Aerial Detection of Marine Plastic Litter by Hyperspectral Sensing | Push-broom spectral sensor installed on a DJI Matrice 600 drone for marine plastic detection | Identified macro plastic waste, focusing on polyethylene and PET, using feature selection and LDA |
| Yituo Zhang | Hyperspectral Imaging-Based Method for Rapid Detection of Microplastics in the Intestinal Tracts of Fish | Headwall Photonics HyperSpec NIR system for detecting MPs in fish intestines | Precision >96.22%, recall >98.80%, identified five types of MPs larger than 0.2 mm |
| Paul Naethe | Changes of NOx in urban air detected with monitoring VIS-NIR field spectrometer during the coronavirus pandemic: A case study in Germany | VIS-NIR field spectrometer (RoX) for continuous monitoring of down-welling light | Detected a decrease in NO2 levels with an accuracy of 87.3% |
| Milad Niroumand-Jadidi | Water Quality Retrieval from PRISMA Hyperspectral Images: First Experience in a Turbid Lake and Comparison with Sentinel-2 | PRISMA HSI used for water quality analysis compared with Sentinel-2 data | Accurate estimation of Chl-a, TSM, CDOM; slight overestimation at shorter wavelengths |
| Juan Meléndez | Fast Quantification of Air Pollutants by Mid-Infrared Hyperspectral Imaging and Principal Component Analysis | PCA with mid-infrared HSI for identifying CH4, N2O, and C3H8 | Improved signal-to-noise ratio, identified column densities of CH4, N2O, C3H8 |
| Lara Noppen | Constraining industrial ammonia emissions using hyperspectral infrared imaging | HSIR using Telops Hyper-Cam LW to measure NH3 emissions | An estimated 2200 tons of annual NH3 emission, five times higher than European records |
Appendix A.7. Mining
Table A7.
Application of HSI in mining.
Table A7.
Application of HSI in mining.
| Author | Title | Technique Used | Result |
|---|---|---|---|
| Yongsik Jeong | Bulk scanning method of a heavy metal concentration in the tailings of a gold mine using a SWIR hyperspectral imaging system | SWIR HSI system for measuring heavy metals in mine tailings | R2 = 70%, NRMSE = 11–12%, showing feasibility for environmental monitoring |
| Jingping He | Hyperspectral remote sensing for detecting geotechnical problems at Ray mine | Hyperspectral remote sensing to study highwall instability in mines | Detected montmorillonite clay as the cause of slope movement, confirming the utility of HSI |
| Kun Tan | Complete and accurate data correction for seamless mosaicking of airborne hyperspectral images: A case study at a mining site in Inner Mongolia, China | Airborne HSI image mosaicking technique to eliminate brightness mismatch in mining areas | Successfully eliminated brightness mismatch and obtained high-quality data. |
| Beibei Zhou | Analysis and discrimination of hyperspectral characteristics of typical vegetation leaves in a rare earth reclamation mining area | HSI combined with the MLP model to discriminate vegetation in the reclamation mining area | Identified wetland pine with 93.6% accuracy |
| Kun Tan | A Parallel Gaussian–Bernoulli Restricted Boltzmann Machine for Mining Area Classification With Hyperspectral Imagery | New classification method using GBRBM model with hyperspectral imagery for large-scale mining monitoring | Outperformed traditional classifiers with increased accuracy and faster predictions |
| Chunlei Xiao | Detecting the Sources of Methane Emission from Oil Shale Mining and Processing Using Airborne Hyperspectral Data | SASI system for CH4 emission detection in oil shale mining areas | Detected CH4 emission sources around the oil shale retorting plant using wavelet transform |
| Bo Zhang | Retrieving soil heavy metal concentrations based on GaoFen-5 hyperspectral satellite image at an opencast coal mine, Inner Mongolia, China | GF-5 hyperspectral satellite to quantify heavy metals in soil | R2 = 62.5% for nickel, 77% for zinc, effectively used for monitoring soil pollution |
| Jiajia Tang | Revealing the Structure and Composition of the Restored Vegetation Cover in Semi-Arid Mine Dumps Based on LiDAR and Hyperspectral Images | LiDAR combined with HSI for monitoring flora restoration in mining dumps | Kappa coefficient = 0.79, accuracy = 87.45%, precisely classified flora |
Appendix A.8. Mineralogy
Table A8.
Application of HSI in mineralogy.
Table A8.
Application of HSI in mineralogy.
| Author | Title | Technique Used | Result |
|---|---|---|---|
| René Booysen | Detection of REEs with lightweight UAV-based hyperspectral imaging | UAV-based HSI for mapping rare earth elements (REEs) in carbonatite complexes | Confirmed Nd absorption features at 580, 750, and 800 nm with fast REE detection |
| René Booysen | Accurate hyperspectral imaging of mineralised outcrops: An example from lithium-bearing pegmatites at Uis, Namibia | VNIR-SWIR imaging for mapping lithium-bearing pegmatites | Identified and mapped Cookeite and Montebrasite with validation from XRD and LIBS analyses |
| Agustin Lobo | Machine Learning for Mineral Identification and Ore Estimation from Hyperspectral Imagery in Tin–Tungsten Deposits: Simulation under Indoor Conditions | ML (LDA, RF) with HSI for mineral classification in the tin-tungsten mine | Achieved classification accuracy up to 98% for minerals like cassiterite and wolframite |
| Philip Lypaczewski | Characterization of Mineralogy in the Highland Valley Porphyry Cu District Using Hyperspectral Imaging, and Potential Applications | High-resolution SWIR imaging of rock samples and drill cores for mineral identification | Identified muscovite, kaolinite, and prehnite; helped with ore sorting. |
| Laura Tuşa | Drill-Core Mineral Abundance Estimation Using Hyperspectral and High-Resolution Mineralogical Data | VNIR-SWIR HSI combined with ML models (RF) for estimating mineral abundance in drill-core samples | Mapped minerals like white mica, feldspars, and sulfides |
| Samuel T. Thiele | Mineralogical Mapping with Accurately Corrected Shortwave Infrared Hyperspectral Data Acquired Obliquely from UAVs | UAV-based HSI for mapping dolomitic and calcitic carbonate units in complex geologies | Successfully mapped carbonate units after corrections |
| F.J.A. van Ruitenbeek | Measuring rock microstructure in hyperspectral mineral maps | HSI for differentiating rock microstructures using shape parameters in mineral maps | Differentiated phenocrysts, xenocrysts, and amygdales in altered volcanic/sedimentary rocks |
| E. A. MacLagan | Hyperspectral imaging of drill core from the Steen River impact structure, Canada: Implications for hydrothermal activity and formation of suevite-like breccias | HSI for examining drill cores in an impact structure | Mapped mineralogical layers, indicating post-impact hydrothermal processes |
| Ali Raza | Characterizing stalagmite composition using hyperspectral imaging | ML algorithms with VNIR-SWIR HSI to classify and map minerals in the stalagmite | Classified aragonite and calcite; used for paleoclimate studies |
Appendix A.9. Food Processing
Table A9.
Application of HSI in food processing.
Table A9.
Application of HSI in food processing.
| Author | Title | Technique Used | Result |
|---|---|---|---|
| Eunjung Jo | Rapid identification of counterfeited beef using deep learning-aided spectroscopy: Detecting colourant and curing agent adulteration | Diffuse reflectance spectroscopy with DL (AlexNet) for identifying counterfeit beef | 98.84% internal classification accuracy, 97.61% external validation accuracy |
| R. Ríos-Reina | Feasibility of a rapid and non-destructive methodology for the study and discrimination of pine nuts using near-infrared hyperspectral analysis and chemometrics | NIR-HSI with chemometrics (PCA, MCR) for differentiating pine nuts based on origin | 84–100% accuracy in classifying nuts by origin |
| Mona Ostovar | Rapid authentication of intact saffron stigma through the package using Vis-SWNIR hyperspectral imaging coupled with chemometrics | Visible-short wavelength NIR-HSI with chemometric techniques (MCR-ALS, PLS) for saffron verification | Over 97% classification accuracy for authentic and fake saffron |
| Youngwook Seo | Non-Destructive Detection Pilot Study of Vegetable Organic Residues Using VNIR Hyperspectral Imaging and Deep Learning Techniques | VNIR-HSI with DL (1D CNN) for identifying vegetable organic residues on stainless steel | 99% accuracy for potato residue, 98% for spinach residue |
| Kunshan Yao | Non-destructive detection of egg qualities based on hyperspectral imaging | VNIR-HSI with XGBoost model for testing egg quality (freshness, yolk, cracks) | 91% R2 for freshness, 97.33% accuracy for scattered yolk, 93.33% for cracked eggs |
| Naveen Kumar Mahanti | Emerging non-destructive imaging techniques for fruit damage detection: Image processing and analysis | HSI for detecting surface defects in fruits during post-harvest processing | Effective in identifying surface defects to assess fruit quality |
| Imer Orrillo | Hyperspectral imaging as a powerful tool for the identification of papaya seeds in black pepper | NIR-HSI with chemometrics for detecting black pepper adulteration with papaya seeds | 100% accuracy for whole berry samples, >90% sensitivity for ground samples |
| Ji Ma | Prediction of monounsaturated and polyunsaturated fatty acids of various processed pork meats using improved hyperspectral imaging technique | NIR-HSI with predictive models for determining MUFA and PUFA content in pork | R2 of 81% for MUFA, R2 of 89% for PUFA |
| Ali Saeidan | Detection of foreign materials in cocoa beans by hyperspectral imaging technology | SWIR-HSI with chemometrics for detecting foreign materials in cocoa beans | Classification accuracies greater than 89% |
| Sajad Kiani | Hyperspectral imaging as a novel system for the authentication of spices: A nutmeg case study | HSI with ANN model for detecting adulteration in nutmeg | High accuracy in detecting adulteration levels as low as 5% |
Appendix A.10. Other Applications
Table A10.
Application of HSI in other applications.
Table A10.
Application of HSI in other applications.
| Author | Title | Technique Used | Result |
|---|---|---|---|
| Junyu Tao | Combination of hyperspectral imaging and machine learning models for fast characterization and classification of municipal solid waste | HSI with ML for classifying municipal solid waste (MSW) | 100% accuracy in identifying inorganic components, low-heating values predicted with error rates |
| Wen Xiao | A robust classification algorithm for the separation of construction waste using an NIR hyperspectral system | NIR-HSI with a classification algorithm to separate waste into six categories | 100% identification rate for wood, plastic, brick, concrete, rubber, and black brick |
| Giuseppe Bonifazi | Hyperspectral Imaging Applied to WEEE Plastic Recycling: A Methodological Approach | SWIR-HSI with SisuCHEMA XL system for sorting polymeric materials from waste electrical/electronic equipment | Great accuracy in the identification of plastic flakes, polymers, and contaminants |
| Massimiliano Vasile | Intelligent characterisation of space objects with hyperspectral imaging | HSI with ML for material identification and attitude motion characterization of space objects | Accurate material identification and attitude reconstruction in space debris monitoring |
| Vicente Bayarri | Hyperspectral Imaging Techniques for the Study, Conservation, and Management of Rock Art | SAM and MTMF with Specim V10E VNIR HSI system for investigating Palaeolithic rock art | Discovered 76% more figures compared to traditional methods |
| Marcello Picollo | Hyper-Spectral Imaging Technique in the Cultural Heritage Field: New Possible Scenarios | HSI for studying damaged photographic materials in the “Memoria Fotografica” project | Supported the digital restoration of color negative and positive films affected by flood |
| Miguel Á. Martínez | Multifocus HDR VIS/NIR hyperspectral imaging and its application to works of art | Multifocus HDR VIS/NIR HSI with a line scanner for pigment identification and colorimetric analysis | Enabled pigment identification and colorimetric analysis under uncontrolled illumination |
| Costanza Cucci | Remote-sensing hyperspectral imaging for applications in archaeological areas: Non-invasive investigations on wall paintings and on mural inscriptions in the Pompeii site. | Remote-sensing HSI study for non-invasive diagnostics of Pompeii wall paintings | Identified pigments and degradation products (e.g., gypsum), proving effective for archaeological diagnostics |
| Alexandre Guyot | Airborne Hyperspectral Imaging for Submerged Archaeological Mapping in Shallow Water Environments | Airborne HSI with anomaly detection algorithms for mapping submerged archaeological sites | Successfully identified and characterized submerged steles at the Er Lannic megalithic site. |
References
- Reshef, E.R.; Miller, J.B.; Vavvas, D.G. Hyperspectral imaging of the retina: A review. Int. Ophthalmol. Clin. 2020, 60, 85–96. [Google Scholar] [CrossRef] [PubMed]
- Qureshi, R.; Uzair, M.; Khurshid, K.; Yan, H. Hyperspectral document image processing: Applications, challenges and future prospects. Pattern Recognit. 2019, 90, 12–22. [Google Scholar] [CrossRef]
- Lone, Z.A.; Pais, A.R. Object detection in hyperspectral images. Digit. Signal Process. 2022, 131, 103752. [Google Scholar] [CrossRef]
- Goetz, A.F.H.; Vane, G.; Solomon, J.E.; Rock, B.N. Imaging spectrometry for earth remote sensing. Science 1985, 228, 1147–1153. [Google Scholar] [CrossRef]
- Goetz, A.F. Three decades of hyperspectral remote sensing of the Earth: A personal view. Remote Sens. Environ. 2009, 113, S5–S16. [Google Scholar] [CrossRef]
- Gutiérrez-Gutiérrez, J.A.; Pardo, A.; Real, E.; López-Higuera, J.M.; Conde, O.M. Custom scanning hyperspectral imaging system for biomedical applications: Modeling, benchmarking, and specifications. Sensors 2019, 19, 1692. [Google Scholar] [CrossRef]
- Avola, G.; Matese, A.; Riggi, E. An Overview of the Special Issue on “Precision Agriculture Using Hyperspectral Images”. Remote Sens. 2023, 15, 1917. [Google Scholar] [CrossRef]
- Paoletti, M.E.; Haut, J.M.; Pereira, N.S.; Plaza, J.; Plaza, A. Ghostnet for hyperspectral image classification. IEEE Trans. Geosci. Remote Sens. 2021, 59, 10378–10393. [Google Scholar] [CrossRef]
- Krupnik, D.; Khan, S. Close-range, ground-based hyperspectral imaging for mining applications at various scales: Review and case studies. Earth-Sci. Rev. 2019, 198, 102952. [Google Scholar] [CrossRef]
- Zhang, Y.; Wu, X.; He, L.; Meng, C.; Du, S.; Bao, J.; Zheng, Y. Applications of hyperspectral imaging in the detection and diagnosis of solid tumors. Transl. Cancer Res. 2020, 9, 1265–1277. [Google Scholar] [CrossRef]
- Huang, S.Y.; Mukundan, A.; Tsao, Y.M.; Kim, Y.; Lin, F.C.; Wang, H.C. Recent advances in counterfeit art, document, photo, hologram, and currency detection using hyper-spectral imaging. Sensors 2022, 22, 7308. [Google Scholar] [CrossRef] [PubMed]
- Sinha, R.; Khot, L.R.; Gao, Z.; Chandel, A.K. Sensors III: Spectral sensing and data analysis. Fundam. Agric. Field Robot. 2021, 79–110. [Google Scholar] [CrossRef]
- Sousa, J.J.; Toscano, P.; Matese, A.; Di Gennaro, S.F.; Berton, A.; Gatti, M.; Poni, S.; Pádua, L.; Hruška, J.; Morais, R.; et al. UAV-based hyperspectral monitoring using push-broom and snapshot sensors: A multisite assessment for precision viticulture applications. Sensors 2022, 22, 6574. [Google Scholar] [CrossRef]
- Baek, S.-H.; Ikoma, H.; Jeon, D.S.; Li, Y.; Heidrich, W.; Wetzstein, G.; Kim, M.H. Single-shot hyperspectral-depth imaging with learned diffractive optics. In Proceedings of the IEEE/CVF International Conference on Computer Vision, Montreal, BC, Canada, 11–17 October 2021. [Google Scholar]
- Tran, M.H.; Fei, B. Compact and ultracompact spectral imagers: Technology and applications in biomedical imaging. J. Biomed. Opt. 2023, 28, 040901. [Google Scholar] [CrossRef]
- Liu, S.; Liu, S.; Zhang, S.; Li, B.; Hu, W.; Zhang, Y.D. SSAU-Net: A spectral–spatial attention-based U-Net for hyperspectral image fusion. IEEE Trans. Geosci. Remote Sens. 2022, 60, 1–16. [Google Scholar] [CrossRef]
- Paoletti, M.E.; Haut, J.M.; Plaza, J.; Plaza, A. Deep learning classifiers for hyperspectral imaging: A review. ISPRS J. Photogramm. Remote Sens. 2019, 158, 279–317. [Google Scholar] [CrossRef]
- Li, S.; Song, W.; Fang, L.; Chen, Y.; Ghamisi, P.; Benediktsson, J.A. Deep learning for hyperspectral image classification: An overview. IEEE Trans. Geosci. Remote Sens. 2019, 57, 6690–6709. [Google Scholar] [CrossRef]
- Schmitt, B.; Souidi, Z.; Duquesnoy, F.; Donzé, F.-V. From RGB camera to hyperspectral imaging: A breakthrough in Neolithic rock painting analysis. Herit. Sci. 2023, 11, 91. [Google Scholar] [CrossRef]
- Khan, M.J.; Khan, H.S.; Yousaf, A.; Khurshid, K.; Abbas, A. Modern trends in hyperspectral image analysis: A review. IEEE Access 2018, 6, 14118–14129. [Google Scholar] [CrossRef]
- Giri, R.N.; Janghel, R.R.; Pandey, S.K.; Govil, H.; Sinha, A. Enhanced hyperspectral image classification through pretrained CNN model for robust spatial feature ex-traction. J. Opt. 2024, 53, 2287–2300. [Google Scholar] [CrossRef]
- Ortega, S.; Fabelo, H.; Iakovidis, D.K.; Koulaouzidis, A.; Callico, G.M. Use of hyperspectral/multispectral imaging in gastroenterology. Shedding some–different–light into the dark. J. Clin. Med. 2019, 8, 36. [Google Scholar] [CrossRef] [PubMed]
- Datta, D.; Mallick, P.K.; Bhoi, A.K.; Ijaz, M.F.; Shafi, J.; Choi, J. Hyperspectral image classification: Potentials, challenges, and future directions. Comput. Intell. Neurosci. 2022, 2022, 3854635. [Google Scholar] [CrossRef] [PubMed]
- Mahlein, A.-K.; Barbedo, J.G.A.; Chiang, K.-S.; Del Ponte, E.M.; Bock, C.H. From Detection to Protection: The Role of Optical Sensors, Robots, and Artificial Intelligence in Modern Plant Disease Management. Phytopathology 2024, 114, 1733–1741. [Google Scholar] [CrossRef] [PubMed]
- Laukamp, C.; Rodger, A.; LeGras, M.; Lampinen, H.; Lau, I.C.; Pejcic, B.; Stromberg, J.; Francis, N.; Ramanaidou, E. Mineral physicochemistry underlying feature-based extraction of mineral abundance and composition from shortwave, mid and thermal infrared reflectance spectra. Minerals 2021, 11, 347. [Google Scholar] [CrossRef]
- Gholizadeh, A.; Kopačková, V. Detecting vegetation stress as a soil contamination proxy: A review of optical proximal and remote sensing techniques. Int. J. Environ. Sci. Technol. 2019, 16, 2511–2524. [Google Scholar] [CrossRef]
- Pallua, J.D.; Brunner, A.; Zelger, B.; Huck, C.W.; Schirmer, M.; Laimer, J.; Putzer, D.; Thaler, M.; Zelger, B. New perspectives of hyperspectral imaging for clinical research. NIR News 2021, 32, 5–13. [Google Scholar] [CrossRef]
- Mladenov, M.I. Model-based approach for assessment of freshness and safety of meat and dairy products using a simple method for hyperspectral analysis. J. Food Nutr. Res. 2020, 59, 108–119. [Google Scholar]
- Cucci, C.; Casini, A. Hyperspectral Imaging for Artworks Investigation, in Data Handling in Science and Technology; Elsevier: Amsterdam, The Netherlands, 2019; pp. 583–604. [Google Scholar]
- Pallocci, M.; Treglia, M.; Passalacqua, P.; De Luca, L.; Zanovello, C.; Mazzuca, D.; Guarna, F.; Gratteri, S.; Marsella, L.T. Forensic applications of hyperspectral imaging technique: A narrative review. Med. -Leg. J. 2022, 90, 216–220. [Google Scholar] [CrossRef]
- Johansen, T.H.; Møllersen, K.; Ortega, S.; Fabelo, H.; Garcia, A.; Callico, G.M.; Godtliebsen, F. Recent advances in hyperspectral imaging for melanoma detection. Wiley Interdiscip. Rev. Comput. Stat. 2020, 12, e1465. [Google Scholar] [CrossRef]
- Ang, K.L.-M.; Seng, J.K.P. Big data and machine learning with hyperspectral information in agriculture. IEEE Access 2021, 9, 36699–36718. [Google Scholar] [CrossRef]
- Mishra, P.; Sytsma, M.; Chauhan, A.; Polder, G.; Pekkeriet, E. All-in-one: A spectral imaging laboratory system for standardised automated image acquisition and real-time spectral model deployment. Anal. Chim. Acta 2022, 1190, 339235. [Google Scholar] [CrossRef] [PubMed]
- Mukundan, A.; Tsao, Y.-M.; Cheng, W.-M.; Lin, F.-C.; Wang, H.-C. Automatic counterfeit currency detection using a novel snapshot hyperspectral imaging algorithm. Sensors 2023, 23, 2026. [Google Scholar] [CrossRef] [PubMed]
- Frosch, T.; Wyrwich, E.; Yan, D.; Domes, C.; Domes, R.; Popp, J.; Frosch, T. Counterfeit and substandard test of the antimalarial tablet Riamet® by means of Raman hyperspectral multicomponent analysis. Molecules 2019, 24, 3229. [Google Scholar] [CrossRef] [PubMed]
- Coic, L.; Sacré, P.-Y.; Dispas, A.; Sakira, A.K.; Fillet, M.; Marini, R.D.; Hubert, P.; Ziemons, E. Comparison of hyperspectral imaging techniques for the elucidation of falsified medicines composition. Talanta 2019, 198, 457–463. [Google Scholar] [CrossRef]
- Wu, Y.; Li, X.; Xu, L.; Fan, R.; Lin, Y.; Zhan, C.; Kang, Z. Counterfeit detection of bulk Baijiu based on fluorescence hyperspectral technology and machine learning. J. Food Meas. Charact. 2024, 18, 3032–3041. [Google Scholar] [CrossRef]
- Laborde, A.; Puig-Castellví, F.; Bouveresse, D.J.-R.; Eveleigh, L.; Cordella, C.; Jaillais, B. Detection of chocolate powder adulteration with peanut using near-infrared hyperspectral imaging and Multivariate Curve Resolution. Food Control 2021, 119, 107454. [Google Scholar] [CrossRef]
- Jiang, Z.; Zhong, L.; Xue, J.; Lv, J.; Zhou, F.; Zhou, Y.; Xu, Y.; Shao, Q.; Zhang, A. Data fusion based on near-infrared spectroscopy and hyperspectral imaging technology for rapid adulteration detection of Ganoderma lucidum spore powder. Microchem. J. 2023, 193, 109190. [Google Scholar] [CrossRef]
- Shang, Y.; Bao, L.; Bi, H.; Guan, S.; Xu, J.; Gu, Y.; Zhao, C. Authenticity discrimination and adulteration level detection of camellia seed oil via hyperspectral imaging technology. Food Anal. Methods 2024, 17, 450–463. [Google Scholar] [CrossRef]
- Hu, Y.; Xu, L.; Huang, P.; Sun, J.; Wu, Y.; Geng, J.; Fan, R.; Kang, Z. Non-destructive detection of Tieguanyin adulteration based on fluorescence hyperspectral technique. J. Food Meas. Charact. 2023, 17, 2614–2622. [Google Scholar] [CrossRef]
- Puglia, F.D.P.; Anzanello, M.J.; Scharcanski, J.; Fontes, J.d.A.; de Brito, J.B.G.; Ortiz, R.S.; Mariotti, K. Identifying the most relevant tablet regions in the image detection of counterfeit medicines. J. Pharm. Biomed. Anal. 2021, 205, 114336. [Google Scholar] [CrossRef]
- Mukundan, A.; Tsao, Y.-M.; Lin, F.-C.; Wang, H.-C. Portable and low-cost hologram verification module using a snapshot-based hyperspectral imaging algorithm. Sci. Rep. 2022, 12, 18475. [Google Scholar] [CrossRef] [PubMed]
- Qian, S.-E. Hyperspectral satellites, evolution, and development history. IEEE J. Sel. Top. Appl. Earth Obs. Remote Sens. 2021, 14, 7032–7056. [Google Scholar] [CrossRef]
- Flores-Anderson, A.I.; Griffin, R.; Dix, M.; Romero-Oliva, C.S.; Ochaeta, G.; Skinner-Alvarado, J.; Moran, M.V.R.; Hernandez, B.; Cherrington, E.; Page, B.; et al. Hyperspectral satellite remote sensing of water quality in Lake Atitlán, Guatemala. Front. Environ. Sci. 2020, 8, 7. [Google Scholar] [CrossRef]
- Zhang, B.; Wu, Y.; Zhao, B.; Chanussot, J.; Hong, D.; Yao, J.; Gao, L. Progress and challenges in intelligent remote sensing satellite systems. IEEE J. Sel. Top. Appl. Earth Obs. Remote Sens. 2022, 15, 1814–1822. [Google Scholar] [CrossRef]
- Grotte, M.E.; Birkeland, R.; Honore-Livermore, E.; Bakken, S.; Garrett, J.L.; Prentice, E.F.; Sigernes, F.; Orlandic, M.; Gravdahl, J.T.; Johansen, T.A. Ocean color hyperspectral remote sensing with high resolution and low latency—The HYPSO-1 CubeSat mission. IEEE Trans. Geosci. Remote Sens. 2021, 60, 1–19. [Google Scholar] [CrossRef]
- Sun, L.; Yang, X.; Jia, S.; Jia, C.; Wang, Q.; Liu, X.; Wei, J.; Zhou, X. Satellite data cloud detection using deep learning supported by hyperspectral data. Int. J. Remote Sens. 2020, 41, 1349–1371. [Google Scholar] [CrossRef]
- Liu, Y.-N.; Zhang, J.; Zhang, Y.; Sun, W.-W.; Jiao, L.-L.; Sun, D.-X.; Hu, X.-N.; Ye, X.; Li, Y.-D.; Liu, S.-F.; et al. The advanced hyperspectral imager: Aboard China’s GaoFen-5 satellite. IEEE Geosci. Remote Sens. Mag. 2019, 7, 23–32. [Google Scholar] [CrossRef]
- Nalepa, J.; Myller, M.; Cwiek, M.; Zak, L.; Lakota, T.; Tulczyjew, L.; Kawulok, M. Towards on-board hyperspectral satellite image segmentation: Understanding robustness of deep learning through simulating acquisition conditions. Remote Sens. 2021, 13, 1532. [Google Scholar] [CrossRef]
- Vangi, E.; D’amico, G.; Francini, S.; Giannetti, F.; Lasserre, B.; Marchetti, M.; Chirici, G. The new hyperspectral satellite PRISMA: Imagery for forest types discrimination. Sensors 2021, 21, 1182. [Google Scholar] [CrossRef]
- Pascucci, S.; Pignatti, S.; Casa, R.; Darvishzadeh, R.; Huang, W. Special issue “hyperspectral remote sensing of agriculture and vegetation”. Remote Sens. 2020, 12, 3665. [Google Scholar] [CrossRef]
- Meng, X.; Bao, Y.; Ye, Q.; Liu, H.; Zhang, X.; Tang, H.; Zhang, X. Soil organic matter prediction model with satellite hyperspectral image based on optimized denoising method. Remote Sens. 2021, 13, 2273. [Google Scholar] [CrossRef]
- Wang, C.; Chen, Q.; Fan, H.; Yao, C.; Sun, X.; Chan, J.; Deng, J. Evaluating satellite hyperspectral (Orbita) and multispectral (Landsat 8 and Sentinel-2) imagery for identifying cotton acreage. Int. J. Remote Sens. 2021, 42, 4042–4063. [Google Scholar] [CrossRef]
- Agilandeeswari, L.; Prabukumar, M.; Radhesyam, V.; Phaneendra, K.L.N.B.; Farhan, A. Crop classification for agricultural applications in hyperspectral remote sensing images. Appl. Sci. 2022, 12, 1670. [Google Scholar] [CrossRef]
- Niu, B.; Feng, Q.; Chen, B.; Ou, C.; Liu, Y.; Yang, J. HSI-TransUNet: A transformer based semantic segmentation model for crop mapping from UAV hyperspectral imagery. Comput. Electron. Agric. 2022, 201, 107297. [Google Scholar] [CrossRef]
- Geipel, J.; Bakken, A.K.; Jørgensen, M.; Korsaeth, A. Forage yield and quality estimation by means of UAV and hyperspectral imaging. Precis. Agric. 2021, 22, 1437–1463. [Google Scholar] [CrossRef]
- Singh, K.D.; Duddu, H.S.; Vail, S.; Parkin, I.; Shirtliffe, S.J. UAV-based hyperspectral imaging technique to estimate canola (Brassica napus L.) seedpods maturity. Can. J. Remote Sens. 2021, 47, 33–47. [Google Scholar] [CrossRef]
- Gutiérrez, S.; Wendel, A.; Underwood, J. Ground based hyperspectral imaging for extensive mango yield estimation. Comput. Electron. Agric. 2019, 157, 126–135. [Google Scholar] [CrossRef]
- Shi, Y.; Han, L.; Kleerekoper, A.; Chang, S.; Hu, T. Novel cropdocnet model for automated potato late blight disease detection from unmanned aerial vehicle-based hyperspectral imagery. Remote Sens. 2022, 14, 396. [Google Scholar] [CrossRef]
- Putkiranta, P.; Räsänen, A.; Korpelainen, P.; Erlandsson, R.; Kolari, T.H.; Pang, Y.; Villoslada, M.; Wolff, F.; Kumpula, T.; Virtanen, T. The value of hyperspectral UAV imagery in characterizing tundra vegetation. Remote Sens. Environ. 2024, 308, 114175. [Google Scholar] [CrossRef]
- Matese, A.; Czarnecki, J.M.; Samiappan, S.; Moorhead, R. Are unmanned aerial vehicle-based hyperspectral imaging and machine learning advancing crop science? Trends Plant Sci. 2024, 29, 196–209. [Google Scholar] [CrossRef]
- Sahadevan, A.S. Extraction of spatial-spectral homogeneous patches and fractional abundances for field-scale agriculture monitoring using airborne hyperspectral images. Comput. Electron. Agric. 2021, 188, 106325. [Google Scholar] [CrossRef]
- Cao, Y.; Jiang, K.; Wu, J.; Yu, F.; Du, W.; Xu, T. Inversion modeling of japonica rice canopy chlorophyll content with UAV hyperspectral remote sensing. PLoS ONE 2020, 15, e0238530. [Google Scholar] [CrossRef] [PubMed]
- Dremin, V.; Marcinkevics, Z.; Zherebtsov, E.; Popov, A.; Grabovskis, A.; Kronberga, H.; Geldnere, K.; Doronin, A.; Meglinski, I.; Bykov, A. Skin complications of diabetes mellitus revealed by polarized hyperspectral imaging and machine learning. IEEE Trans. Med. Imaging 2021, 40, 1207–1216. [Google Scholar] [CrossRef] [PubMed]
- La Salvia, M.; Torti, E.; Leon, R.; Fabelo, H.; Ortega, S.; Balea-Fernandez, F.; Martinez-Vega, B.; Castano, I.; Almeida, P.; Carretero, G.; et al. Neural networks-based on-site dermatologic diagnosis through hyperspectral epidermal images. Sensors 2022, 22, 7139. [Google Scholar] [CrossRef]
- El-Sharkawy, Y.H. Automated hyperspectral imaging for non-invasive characterization of human eye vasculature: A po-tential tool for ocular vascular evaluation. Exp. Eye Res. 2024, 240, 109792. [Google Scholar] [CrossRef]
- Manni, F.; van der Sommen, F.; Fabelo, H.; Zinger, S.; Shan, C.; Edström, E.; Elmi-Terander, A.; Ortega, S.; Callicó, G.M.; de With, P.H.N. Hyperspectral imaging for glioblastoma surgery: Improving tumor identification using a deep spectral-spatial approach. Sensors 2020, 20, 6955. [Google Scholar] [CrossRef]
- Thomaßen, M.T.; Köhler, H.; Pfahl, A.; Stelzner, S.; Mehdorn, M.; Thieme, R.; Jansen-Winkeln, B.; Gockel, I.; Chalopin, C.; Moulla, Y. In vivo evaluation of a hyperspectral imaging system for minimally invasive surgery (HSI-MIS). Surg. Endosc. 2023, 37, 3691–3700. [Google Scholar] [CrossRef]
- MacCormac, O.; Noonan, P.; Janatka, M.; Horgan, C.C.; Bahl, A.; Qiu, J.; Elliot, M.; Trotouin, T.; Jacobs, J.; Patel, S.; et al. Lightfield hyperspectral imaging in neuro-oncology surgery: An IDEAL 0 and 1 study. Front. Neurosci. 2023, 17, 1239764. [Google Scholar] [CrossRef]
- Schulz, T.; Marotz, J.; Seider, S.; Langer, S.; Leuschner, S.; Siemers, F. Burn depth assessment using hyperspectral imaging in a prospective single center study. Burns 2022, 48, 1112–1119. [Google Scholar] [CrossRef]
- Hadoux, X.; Hui, F.; Lim, J.K.H.; Masters, C.L.; Pébay, A.; Chevalier, S.; Ha, J.; Loi, S.; Fowler, C.J.; Rowe, C.; et al. Non-invasive in vivo hyperspectral imaging of the retina for potential biomarker use in Alzheimer’s disease. Nat. Commun. 2019, 10, 4227. [Google Scholar] [CrossRef]
- Ueda, E.; Watanabe, M.; Nakamura, D.; Matsuse, D.; Tanaka, E.; Fujiwara, K.; Hashimoto, S.; Nakamura, S.; Isobe, N.; Sonoda, K.-H. Distinct retinal reflectance spectra from retinal hyperspectral imaging in Parkinson’s disease. J. Neurol. Sci. 2024, 461, 123061. [Google Scholar] [CrossRef] [PubMed]
- Vosahlo, R.; Golde, J.; Walther, J.; Koch, E.; Hannig, C.; Tetschke, F. Differentiation of occlusal discolorations and carious lesions with hyperspectral imaging in vitro. Appl. Sci. 2022, 12, 7312. [Google Scholar] [CrossRef]
- Jansen-Winkeln, B.; Barberio, M.; Chalopin, C.; Schierle, K.; Diana, M.; Köhler, H.; Gockel, I.; Maktabi, M. Feedforward artificial neural network-based colorectal cancer detection using hyperspectral im-aging: A step towards automatic optical biopsy. Cancers 2021, 13, 967. [Google Scholar] [CrossRef] [PubMed]
- Leon, R.; Fabelo, H.; Ortega, S.; Piñeiro, J.F.; Szolna, A.; Hernandez, M.; Espino, C.; O’shanahan, A.J.; Carrera, D.; Bisshopp, S.; et al. VNIR–NIR hyperspectral imaging fusion targeting intraoperative brain cancer detection. Sci. Rep. 2021, 11, 19696. [Google Scholar] [CrossRef]
- Fabelo, H.; Ortega, S.; Szolna, A.; Bulters, D.; Pineiro, J.F.; Kabwama, S.; J-O’Shanahan, A.; Bulstrode, H.; Bisshopp, S.; Kiran, B.R.; et al. In-vivo hyperspectral human brain image database for brain cancer detection. IEEE Access 2019, 7, 39098–39116. [Google Scholar] [CrossRef]
- Puustinen, S.; Vrzáková, H.; Hyttinen, J.; Rauramaa, T.; Fält, P.; Hauta-Kasari, M.; Bednarik, R.; Koivisto, T.; Rantala, S.; Fraunberg, M.v.U.z.; et al. Hyperspectral imaging in brain tumor surgery—Evidence of machine learning-based performance. World Neurosurg. 2023, 175, e614–e635. [Google Scholar] [CrossRef]
- Tsai, C.-L.; Mukundan, A.; Chung, C.-S.; Chen, Y.-H.; Wang, Y.-K.; Chen, T.-H.; Tseng, Y.-S.; Huang, C.-W.; Wu, I.-C.; Wang, H.-C. Hyperspectral imaging combined with artificial intelligence in the early detection of esophageal cancer. Cancers 2021, 13, 4593. [Google Scholar] [CrossRef]
- Tsai, T.-J.; Mukundan, A.; Chi, Y.-S.; Tsao, Y.-M.; Wang, Y.-K.; Chen, T.-H.; Wu, I.-C.; Huang, C.-W.; Wang, H.-C. Intelligent identification of early esophageal cancer by band-selective hyperspectral imaging. Cancers 2022, 14, 4292. [Google Scholar] [CrossRef]
- Halicek, M.; Dormer, J.D.; Little, J.V.; Chen, A.Y.; Myers, L.; Sumer, B.D.; Fei, B. Hyperspectral imaging of head and neck squamous cell carcinoma for cancer margin detection in surgical specimens from 102 patients using deep learning. Cancers 2019, 11, 1367. [Google Scholar] [CrossRef]
- Halicek, M.; Little, J.V.; Wang, X.; Chen, A.Y.; Fei, B. Optical biopsy of head and neck cancer using hyperspectral imaging and convolutional neural networks. J. Biomed. Opt. 2019, 24, 036007. [Google Scholar] [CrossRef]
- Ortega, S.; Halicek, M.; Fabelo, H.; Camacho, R.; Plaza, M.d.l.L.; Godtliebsen, F.; Callicó, G.M.; Fei, B. Hyperspectral imaging for the detection of glioblastoma tumor cells in H&E slides using convolutional neural networks. Sensors 2020, 20, 1911. [Google Scholar] [CrossRef] [PubMed]
- Stuart, M.B.; Davies, M.; Hobbs, M.J.; Pering, T.D.; McGonigle, A.J.S.; Willmott, J.R. High-resolution hyperspectral imaging using low-cost components: Application within environmental monitoring scenarios. Sensors 2022, 22, 4652. [Google Scholar] [CrossRef]
- Freitas, S.; Silva, H.; Silva, E. Remote hyperspectral imaging acquisition and characterization for marine litter detection. Remote Sens. 2021, 13, 2536. [Google Scholar] [CrossRef]
- Piarulli, S.; Sciutto, G.; Oliveri, P.; Malegori, C.; Prati, S.; Mazzeo, R.; Airoldi, L. Rapid and direct detection of small microplastics in aquatic samples by a new near infrared hyperspectral imaging (NIR-HSI) method. Chemosphere 2020, 260, 127655. [Google Scholar] [CrossRef] [PubMed]
- Mukundan, A.; Huang, C.-C.; Men, T.-C.; Lin, F.-C.; Wang, H.-C. Air pollution detection using a novel snap-shot hyperspectral imaging technique. Sensors 2022, 22, 6231. [Google Scholar] [CrossRef]
- Balsi, M.; Moroni, M.; Chiarabini, V.; Tanda, G. High-resolution aerial detection of marine plastic litter by hyperspectral sensing. Remote Sens. 2021, 13, 1557. [Google Scholar] [CrossRef]
- Zhang, Y.; Wang, X.; Shan, J.; Zhao, J.; Zhang, W.; Liu, L.; Wu, F. Hyperspectral imaging based method for rapid detection of microplastics in the intestinal tracts of fish. Environ. Sci. Technol. 2019, 53, 5151–5158. [Google Scholar] [CrossRef]
- Naethe, P.; Delaney, M.; Julitta, T. Changes of NOx in urban air detected with monitoring VIS-NIR field spectrometer during the coronavirus pandemic: A case study in Germany. Sci. Total Environ. 2020, 748, 141286. [Google Scholar] [CrossRef]
- Niroumand-Jadidi, M.; Bovolo, F.; Bruzzone, L. Water quality retrieval from PRISMA hyperspectral images: First expe-rience in a turbid lake and comparison with sentinel-2. Remote Sens. 2020, 12, 3984. [Google Scholar] [CrossRef]
- Meléndez, J.; Guarnizo, G. Fast quantification of air pollutants by mid-infrared hyperspectral imaging and principal component analysis. Sensors 2021, 21, 2092. [Google Scholar] [CrossRef]
- Noppen, L.; Clarisse, L.; Tack, F.; Ruhtz, T.; Merlaud, A.; Van Damme, M.; Van Roozendael, M.; Schuettemeyer, D.; Coheur, P. Constraining industrial ammonia emissions using hyperspectral infrared imaging. Remote Sens. Environ. 2023, 291, 113559. [Google Scholar] [CrossRef]
- Jeong, Y.; Yu, J.; Wang, L.; Lee, K.-J. Bulk scanning method of a heavy metal concentration in tailings of a gold mine using SWIR hyperspectral imaging system. Int. J. Appl. Earth Obs. Geoinf. 2021, 102, 102382. [Google Scholar] [CrossRef]
- Zhang, B.; Guo, B.; Zou, B.; Wei, W.; Lei, Y.; Li, T. Retrieving soil heavy metals concentrations based on GaoFen-5 hyperspectral satellite image at an opencast coal mine, Inner Mongolia, China. Environ. Pollut. 2022, 300, 118981. [Google Scholar] [CrossRef]
- He, J.; Barton, I. Hyperspectral remote sensing for detecting geotechnical problems at Ray mine. Eng. Geol. 2021, 292, 106261. [Google Scholar] [CrossRef]
- Tang, J.; Liang, J.; Yang, Y.; Zhang, S.; Hou, H.; Zhu, X. Revealing the structure and composition of the restored vegetation cover in semi-arid mine dumps based on LiDAR and hyperspectral images. Remote Sens. 2022, 14, 978. [Google Scholar] [CrossRef]
- Zhou, B.; Li, H.; Xu, F. Analysis and discrimination of hyperspectral characteristics of typical vegetation leaves in a rare earth reclamation mining area. Ecol. Eng. 2022, 174, 106465. [Google Scholar] [CrossRef]
- Tan, K.; Niu, C.; Jia, X.; Ou, D.; Chen, Y.; Lei, S. Complete and accurate data correction for seamless mosaicking of airborne hyperspectral images: A case study at a mining site in Inner Mongolia, China. ISPRS J. Photogramm. Remote Sens. 2020, 165, 1–15. [Google Scholar] [CrossRef]
- Tan, K.; Ma, W.; Chen, L.; Wang, H.; Du, Q.; Du, P.; Yan, B.; Liu, R.; Li, H. Estimating the distribution trend of soil heavy metals in mining area from HyMap airborne hyperspectral imagery based on ensemble learning. J. Hazard. Mater. 2021, 401, 123288. [Google Scholar] [CrossRef]
- Xiao, C.; Fu, B.; Shui, H.; Guo, Z.; Zhu, J. Detecting the sources of methane emission from oil shale mining and processing using airborne hyperspectral data. Remote Sens. 2020, 12, 537. [Google Scholar] [CrossRef]
- Booysen, R.; Jackisch, R.; Lorenz, S.; Zimmermann, R.; Kirsch, M.; Nex, P.A.M.; Gloaguen, R. Detection of REEs with lightweight UAV-based hyperspectral imaging. Sci. Rep. 2020, 10, 17450. [Google Scholar] [CrossRef]
- Booysen, R.; Lorenz, S.; Thiele, S.T.; Fuchsloch, W.C.; Marais, T.; Nex, P.A.; Gloaguen, R. Accurate hyperspectral imaging of mineralised outcrops: An example from lithium-bearing pegmatites at Uis, Namibia. Remote Sens. Environ. 2022, 269, 112790. [Google Scholar] [CrossRef]
- Lobo, A.; Garcia, E.; Barroso, G.; Martí, D.; Fernandez-Turiel, J.-L.; Ibáñez-Insa, J. Machine learning for mineral identification and ore estimation from hyperspectral imagery in tin–tungsten deposits: Simulation under indoor conditions. Remote Sens. 2021, 13, 3258. [Google Scholar] [CrossRef]
- Lypaczewski, P.; Rivard, B.; Lesage, G.; Byrne, K.; D’Angelo, M.; Lee, R.G. Characterization of mineralogy in the highland valley porphyry cu district using hyperspectral im-aging, and potential applications. Minerals 2020, 10, 473. [Google Scholar] [CrossRef]
- Tuşa, L.; Khodadadzadeh, M.; Contreras, C.; Shahi, K.R.; Fuchs, M.; Gloaguen, R.; Gutzmer, J. Drill-core mineral abundance estimation using hyperspectral and high-resolution mineralogical data. Remote Sens. 2020, 12, 1218. [Google Scholar] [CrossRef]
- Thiele, S.T.; Bnoulkacem, Z.; Lorenz, S.; Bordenave, A.; Menegoni, N.; Madriz, Y.; Dujoncquoy, E.; Gloaguen, R.; Kenter, J. Mineralogical mapping with accurately corrected shortwave infrared hyperspectral data acquired obliquely from UAVs. Remote Sens. 2021, 14, 5. [Google Scholar] [CrossRef]
- van Ruitenbeek, F.; van der Werff, H.; Bakker, W.; van der Meer, F.; Hein, K. Measuring rock microstructure in hyperspectral mineral maps. Remote Sens. Environ. 2019, 220, 94–109. [Google Scholar] [CrossRef]
- MacLagan, E.A.; Walton, E.L.; Herd, C.D.; Rivard, B. Hyperspectral imaging of drill core from the Steen River impact structure, Canada: Implications for hydrothermal activity and formation of suevite-like breccias. Meteorit. Planet. Sci. 2020, 55, 1564–1580. [Google Scholar] [CrossRef]
- Raza, A.; Voarintsoa, N.R.G.; Khan, S.D.; Qasim, M. Characterizing stalagmite composition using hyperspectral imaging. Sediment. Geol. 2024, 467, 106654. [Google Scholar] [CrossRef]
- Jo, E.; Lee, Y.; Lee, Y.; Baek, J.; Kim, J.G. Rapid identification of counterfeited beef using deep learning-aided spectroscopy: Detecting colourant and curing agent adulteration. Food Chem. Toxicol. 2023, 181, 114088. [Google Scholar] [CrossRef]
- Ríos-Reina, R.; Callejón, R.; Amigo, J. Feasibility of a rapid and non-destructive methodology for the study and discrim-ination of pine nuts using near-infrared hyperspectral analysis and chemometrics. Food Control 2021, 130, 108365. [Google Scholar] [CrossRef]
- Ostovar, M.; Hashemi-Nasab, F.S.; Parastar, H. Rapid authentication of intact saffron stigma thorough the package using Vis-SWNIR hyperspectral imaging coupled with chemometrics. J. Food Compos. Anal. 2023, 124, 105702. [Google Scholar] [CrossRef]
- Seo, Y.; Kim, G.; Lim, J.; Lee, A.; Kim, B.; Jang, J.; Mo, C.; Kim, M.S. Non-destructive detection pilot study of vegetable organic residues using VNIR hyperspectral imaging and deep learning techniques. Sensors 2021, 21, 2899. [Google Scholar] [CrossRef] [PubMed]
- Yao, K.; Sun, J.; Chen, C.; Xu, M.; Zhou, X.; Cao, Y.; Tian, Y. Non-destructive detection of egg qualities based on hyperspectral imaging. J. Food Eng. 2022, 325, 111024. [Google Scholar] [CrossRef]
- Mahanti, N.K.; Pandiselvam, R.; Kothakota, A.; Chakraborty, S.K.; Kumar, M.; Cozzolino, D. Emerging non-destructive imaging techniques for fruit damage detection: Image processing and analysis. Trends Food Sci. Technol. 2022, 120, 418–438. [Google Scholar] [CrossRef]
- Orrillo, I.; Cruz-Tirado, J.; Cardenas, A.; Oruna, M.; Carnero, A.; Barbin, D.F.; Siche, R. Hyperspectral imaging as a powerful tool for identification of papaya seeds in black pepper. Food Control 2019, 101, 45–52. [Google Scholar] [CrossRef]
- Ma, J.; Sun, D.-W. Prediction of monounsaturated and polyunsaturated fatty acids of various processed pork meats using improved hyperspectral imaging technique. Food Chem. 2020, 321, 126695. [Google Scholar] [CrossRef]
- Saeidan, A.; Khojastehpour, M.; Golzarian, M.R.; Mooenfard, M.; Khan, H.A. Detection of foreign materials in cocoa beans by hyperspectral imaging technology. Food Control 2021, 129, 108242. [Google Scholar] [CrossRef]
- Kiani, S.; van Ruth, S.M.; van Raamsdonk, L.W.; Minaei, S. Hyperspectral imaging as a novel system for the authentication of spices: A nutmeg case study. LWT 2019, 104, 61–69. [Google Scholar] [CrossRef]
- Tao, J.; Gu, Y.; Hao, X.; Liang, R.; Wang, B.; Cheng, Z.; Yan, B.; Chen, G. Combination of hyperspectral imaging and machine learning models for fast characterization and classification of municipal solid waste. Resour. Conserv. Recycl. 2023, 188, 106731. [Google Scholar] [CrossRef]
- Xiao, W.; Yang, J.; Fang, H.; Zhuang, J.; Ku, Y. A robust classification algorithm for separation of construction waste using NIR hyperspectral system. Waste Manag. 2019, 90, 1–9. [Google Scholar] [CrossRef]
- Bonifazi, G.; Fiore, L.; Gasbarrone, R.; Palmieri, R.; Serranti, S. Hyperspectral imaging applied to weee plastic recycling: A methodological approach. Sustainability 2023, 15, 11345. [Google Scholar] [CrossRef]
- Vasile, M.; Walker, L.; Dunphy, R.D.; Zabalza, J.; Murray, P.; Marshall, S.; Savitski, V. Intelligent characterisation of space objects with hyperspectral imaging. Acta Astronaut. 2023, 203, 510–534. [Google Scholar] [CrossRef]
- Bayarri, V.; Sebastián, M.A.; Ripoll, S. Hyperspectral imaging techniques for the study, conservation and management of rock art. Appl. Sci. 2019, 9, 5011. [Google Scholar] [CrossRef]
- Picollo, M.; Cucci, C.; Casini, A.; Stefani, L. Hyper-spectral imaging technique in the cultural heritage field: New possible scenarios. Sensors 2020, 20, 2843. [Google Scholar] [CrossRef]
- Martínez, M.Á.; Valero, E.M.; Nieves, J.L.; Blanc, R.; Manzano, E.; Vílchez, J.L. Multifocus HDR VIS/NIR hyperspectral imaging and its application to works of art. Opt. Express 2019, 27, 11323–11338. [Google Scholar] [CrossRef]
- Cucci, C.; Picollo, M.; Chiarantini, L.; Uda, G.; Fiori, L.; De Nigris, B.; Osanna, M. Remote-sensing hyperspectral imaging for applications in archaeological areas: Non-invasive investigations on wall paintings and on mural inscriptions in the Pompeii site. Microchem. J. 2020, 158, 105082. [Google Scholar] [CrossRef]
- Guyot, A.; Lennon, M.; Thomas, N.; Gueguen, S.; Petit, T.; Lorho, T.; Cassen, S.; Hubert-Moy, L. Airborne hyperspectral imaging for submerged archaeological mapping in shallow water environments. Remote Sens. 2019, 11, 2237. [Google Scholar] [CrossRef]
- Vivone, G. Multispectral and hyperspectral image fusion in remote sensing: A survey. Inf. Fusion 2023, 89, 405–417. [Google Scholar] [CrossRef]
- Lu, B.; Dao, P.D.; Liu, J.; He, Y.; Shang, J. Recent advances of hyperspectral imaging technology and applications in agriculture. Remote Sens. 2020, 12, 2659. [Google Scholar] [CrossRef]
- Batshev, V.; Machikhin, A.; Martynov, G.; Pozhar, V.; Boritko, S.; Sharikova, M.; Lomonov, V.; Vinogradov, A. Polarizer-free AOTF-based SWIR hyperspectral imaging for biomedical applications. Sensors 2020, 20, 4439. [Google Scholar] [CrossRef]
- Hong, D.; He, W.; Yokoya, N.; Yao, J.; Gao, L.; Zhang, L.; Chanussot, J.; Zhu, X. Interpretable hyperspectral artificial intelligence: When nonconvex modeling meets hyperspectral remote sensing. IEEE Geosci. Remote Sens. Mag. 2021, 9, 52–87. [Google Scholar] [CrossRef]
- Wang, Y.; Ou, X.; He, H.-J.; Kamruzzaman, M. Advancements, limitations and challenges in hyperspectral imaging for comprehensive assessment of wheat quality: An up-to-date review. Food Chem. X 2024, 21, 101235. [Google Scholar] [CrossRef] [PubMed]
- Chen, N.; Sui, L.; Zhang, B.; He, H.; Gao, K.; Li, Y.; Junior, J.M.; Li, J. Fusion of Hyperspectral-Multispectral images joining Spatial-Spectral Dual-Dictionary and structured sparse Low-rank representation. Int. J. Appl. Earth Obs. Geoinf. 2021, 104, 102570. [Google Scholar] [CrossRef]
- Tang, Y.; Song, S.; Gui, S.; Chao, W.; Cheng, C.; Qin, R. Active and low-cost hyperspectral imaging for the spectral analysis of a low-light environment. Sensors 2023, 23, 1437. [Google Scholar] [CrossRef]
- Jaiswal, G.; Rani, R.; Mangotra, H.; Sharma, A. Integration of hyperspectral imaging and autoencoders: Benefits, applications, hyperparameter tunning and challenges. Comput. Sci. Rev. 2023, 50, 100584. [Google Scholar] [CrossRef]
- Guerri, M.F.; Distante, C.; Spagnolo, P.; Bougourzi, F.; Taleb-Ahmed, A. Deep Learning Techniques for Hyperspectral Image Analysis in Agriculture: A Review. arXiv e-prints 2023, arXiv:2304.13880. [Google Scholar] [CrossRef]
- Khonina, S.N.; Kazanskiy, N.L.; Oseledets, I.V.; Nikonorov, A.V.; Butt, M.A. Synergy between Artificial Intelligence and Hyperspectral Imagining—A Review. Technologies 2024, 12, 163. [Google Scholar] [CrossRef]
- Wang, X.; Hu, Q.; Cheng, Y.; Ma, J. Hyperspectral image super-resolution meets deep learning: A survey and perspective. IEEE/CAA J. Autom. Sin. 2023, 10, 1668–1691. [Google Scholar] [CrossRef]
- Holman, E.A.; Krishnan, H.; Holman, D.R.; Holman, H.-Y.N.; Sternberg, P.W. Toward implementing autonomous adaptive data acquisition for scanning hyperspectral imaging of biological systems. Appl. Phys. Rev. 2023, 10, 011319. [Google Scholar] [CrossRef]
- Stuart, M.B.; Stanger, L.R.; Hobbs, M.J.; Pering, T.D.; Thio, D.; Mcgonigle, A.J.S.; Willmott, J.R. Low-cost hyperspectral imaging system: Design and testing for laboratory-based environmental applica-tions. Sensors 2020, 20, 3293. [Google Scholar] [CrossRef]
- Morales, G.; Sheppard, J.W.; Logan, R.D.; Shaw, J.A. Hyperspectral dimensionality reduction based on inter-band redundancy analysis and greedy spectral selection. Remote Sens. 2021, 13, 3649. [Google Scholar] [CrossRef]
- Li, J.; Zheng, K.; Liu, W.; Li, Z.; Yu, H.; Ni, L. Model-Guided Coarse-to-Fine Fusion Network for Unsupervised Hyperspectral Image Super-Resolution. IEEE Geosci. Remote Sens. Lett. 2023, 20, 5508605. [Google Scholar] [CrossRef]
- Li, J.; Zheng, K.; Yao, J.; Gao, L.; Hong, D. Deep Unsupervised Blind Hyperspectral and Multispectral Data Fusion. IEEE Geosci. Remote Sens. Lett. 2022, 19, 6007305. [Google Scholar] [CrossRef]
- Li, J.; Zheng, K.; Gao, L.; Han, Z.; Li, Z.; Chanussot, J. Enhanced Deep Image Prior for Unsupervised Hyperspectral Image Super-Resolution. IEEE Trans. Geosci. Remote Sens. 2025, 63, 5504218. [Google Scholar] [CrossRef]
- Li, J.; Zheng, K.; Gao, L.; Ni, L.; Huang, M.; Chanussot, J. Model-Informed Multistage Unsupervised Network for Hyperspectral Image Super-Resolution. IEEE Trans. Geosci. Remote Sens. 2024, 62, 5516117. [Google Scholar] [CrossRef]
- Li, J.; Zheng, K.; Li, Z.; Gao, L.; Jia, X. X-shaped interactive autoencoders with cross-modality mutual learning for unsupervised hyperspectral image super-resolution. IEEE Trans. Geosci. Remote Sens. 2013, 61, 1–17. [Google Scholar] [CrossRef]
- Guo, S.; Liu, X.; Zhang, H.; Lin, Q.; Xu, L.; Shi, C.; Gao, Z.; Guzzo, A.; Fortino, G. Causal knowledge fusion for 3D cross-modality cardiac image segmentation. Inf. Fusion 2023, 99, 101864. [Google Scholar] [CrossRef]
- Islam, S.; Aziz, T.; Nabil, H.R.; Jim, J.R.; Mridha, M.F.; Kabir, M.; Asai, N.; Shin, J.; Showrov, A.A. Generative adversarial networks (GANs) in medical imaging: Advancements, applications and challenges. IEEE Access 2024, 12, 35728–35753. [Google Scholar] [CrossRef]
- Rao, P.K.; Prakash, P.S.; Kumar, N.J.; Reddy, V.K.; Kumar, A.S. Efficient Sparse Tensor Core Networks for Real-Time Insect Classification in Agriculture. In Proceedings of the International Conference on Advanced Network Technologies and Intelligent Computing, Varanasi, India, 19–21 December 2024; Springer Nature: Cham, Switzerland, 2024. [Google Scholar]
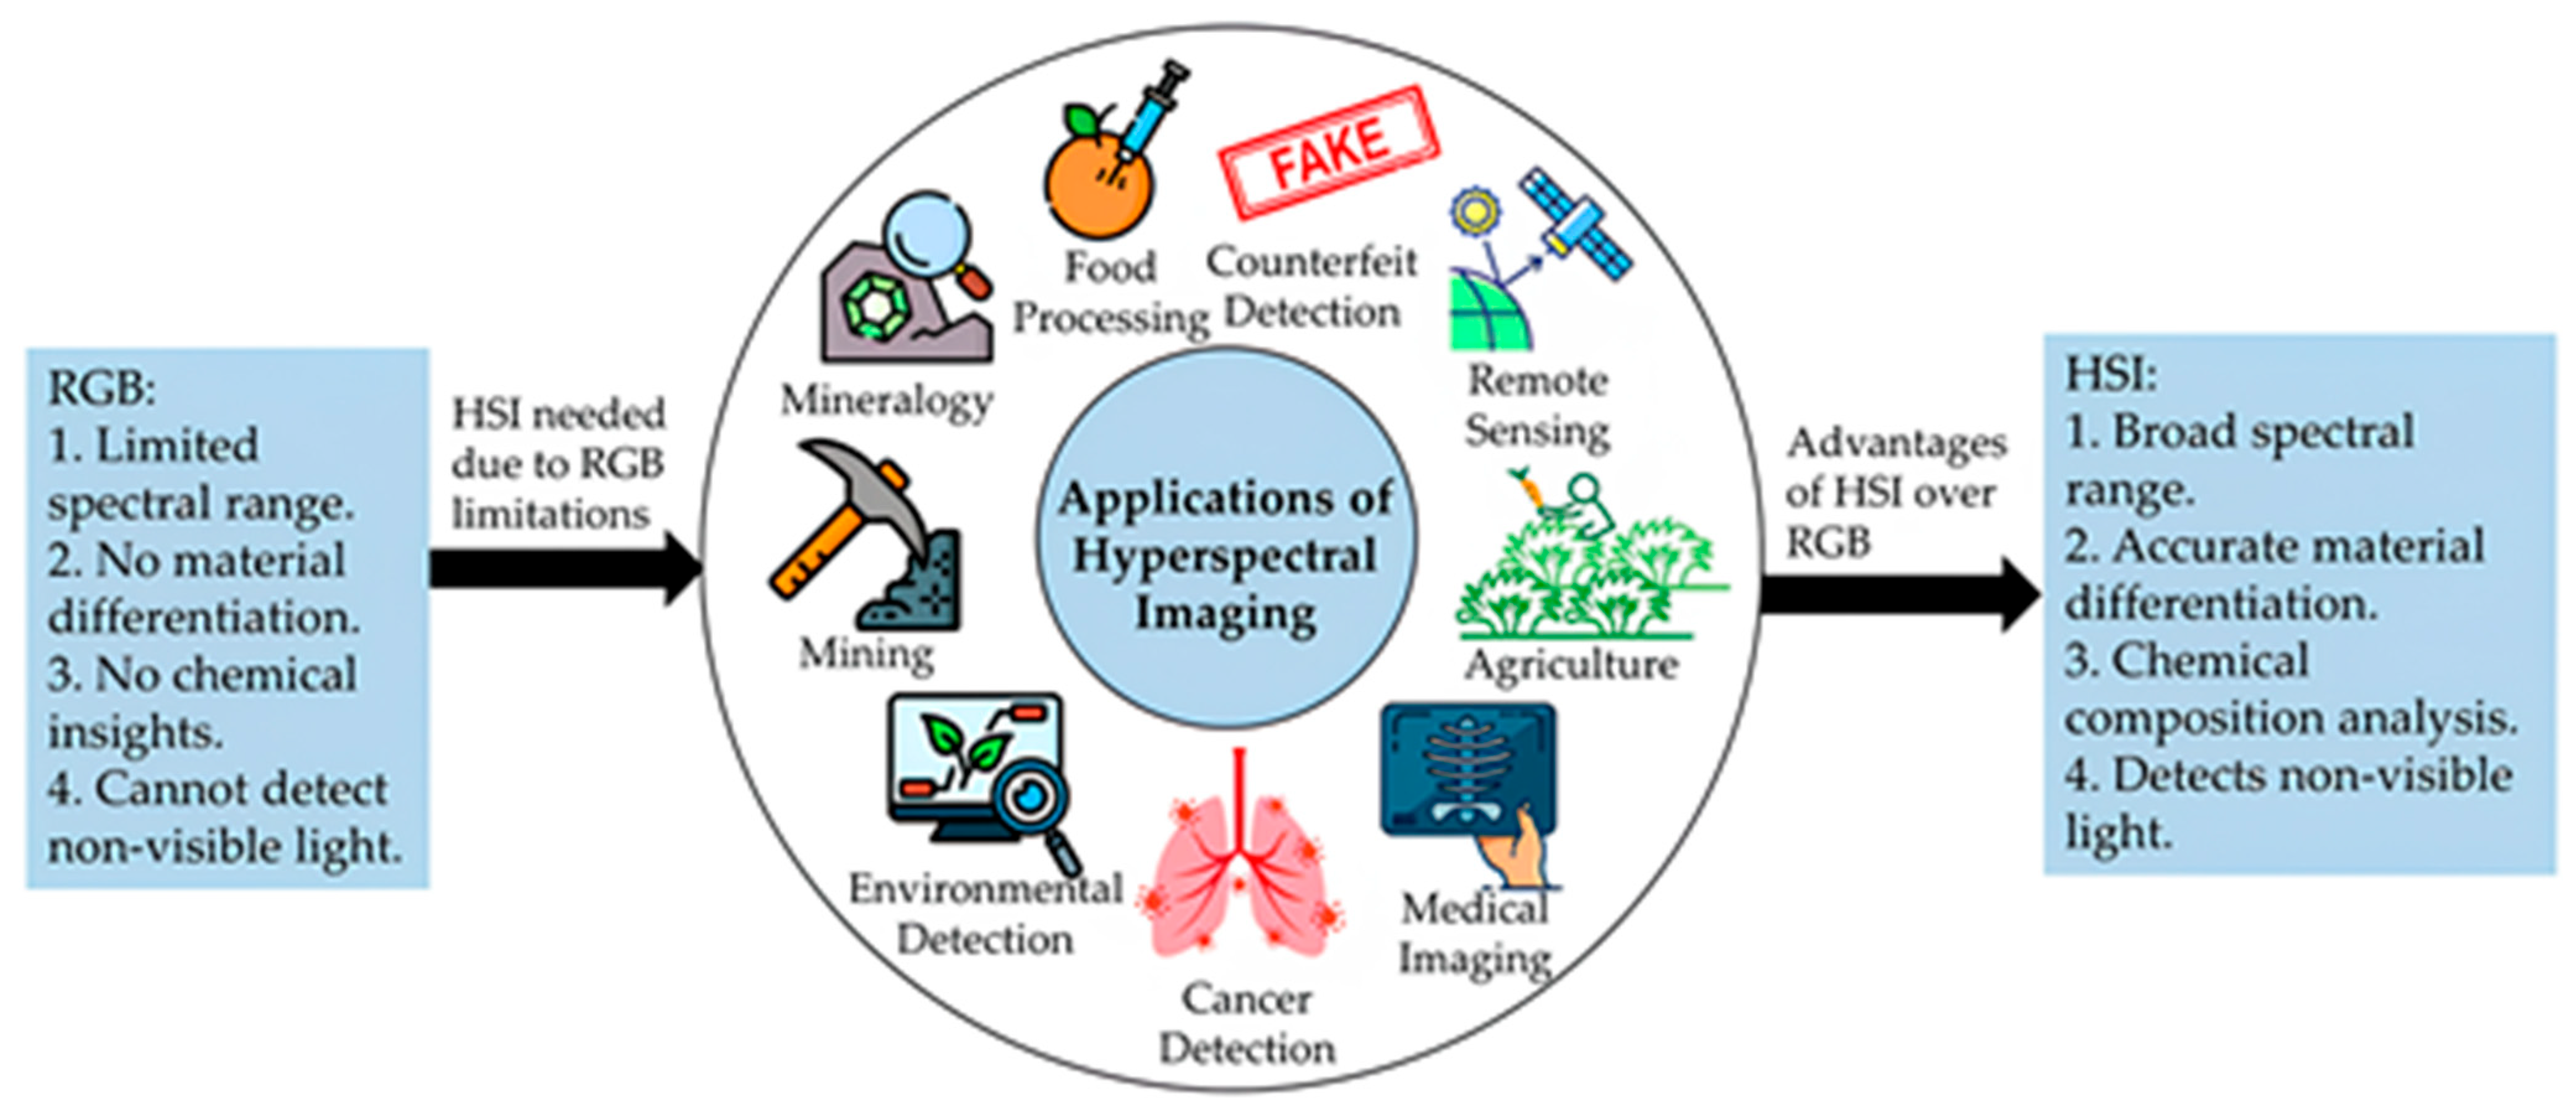
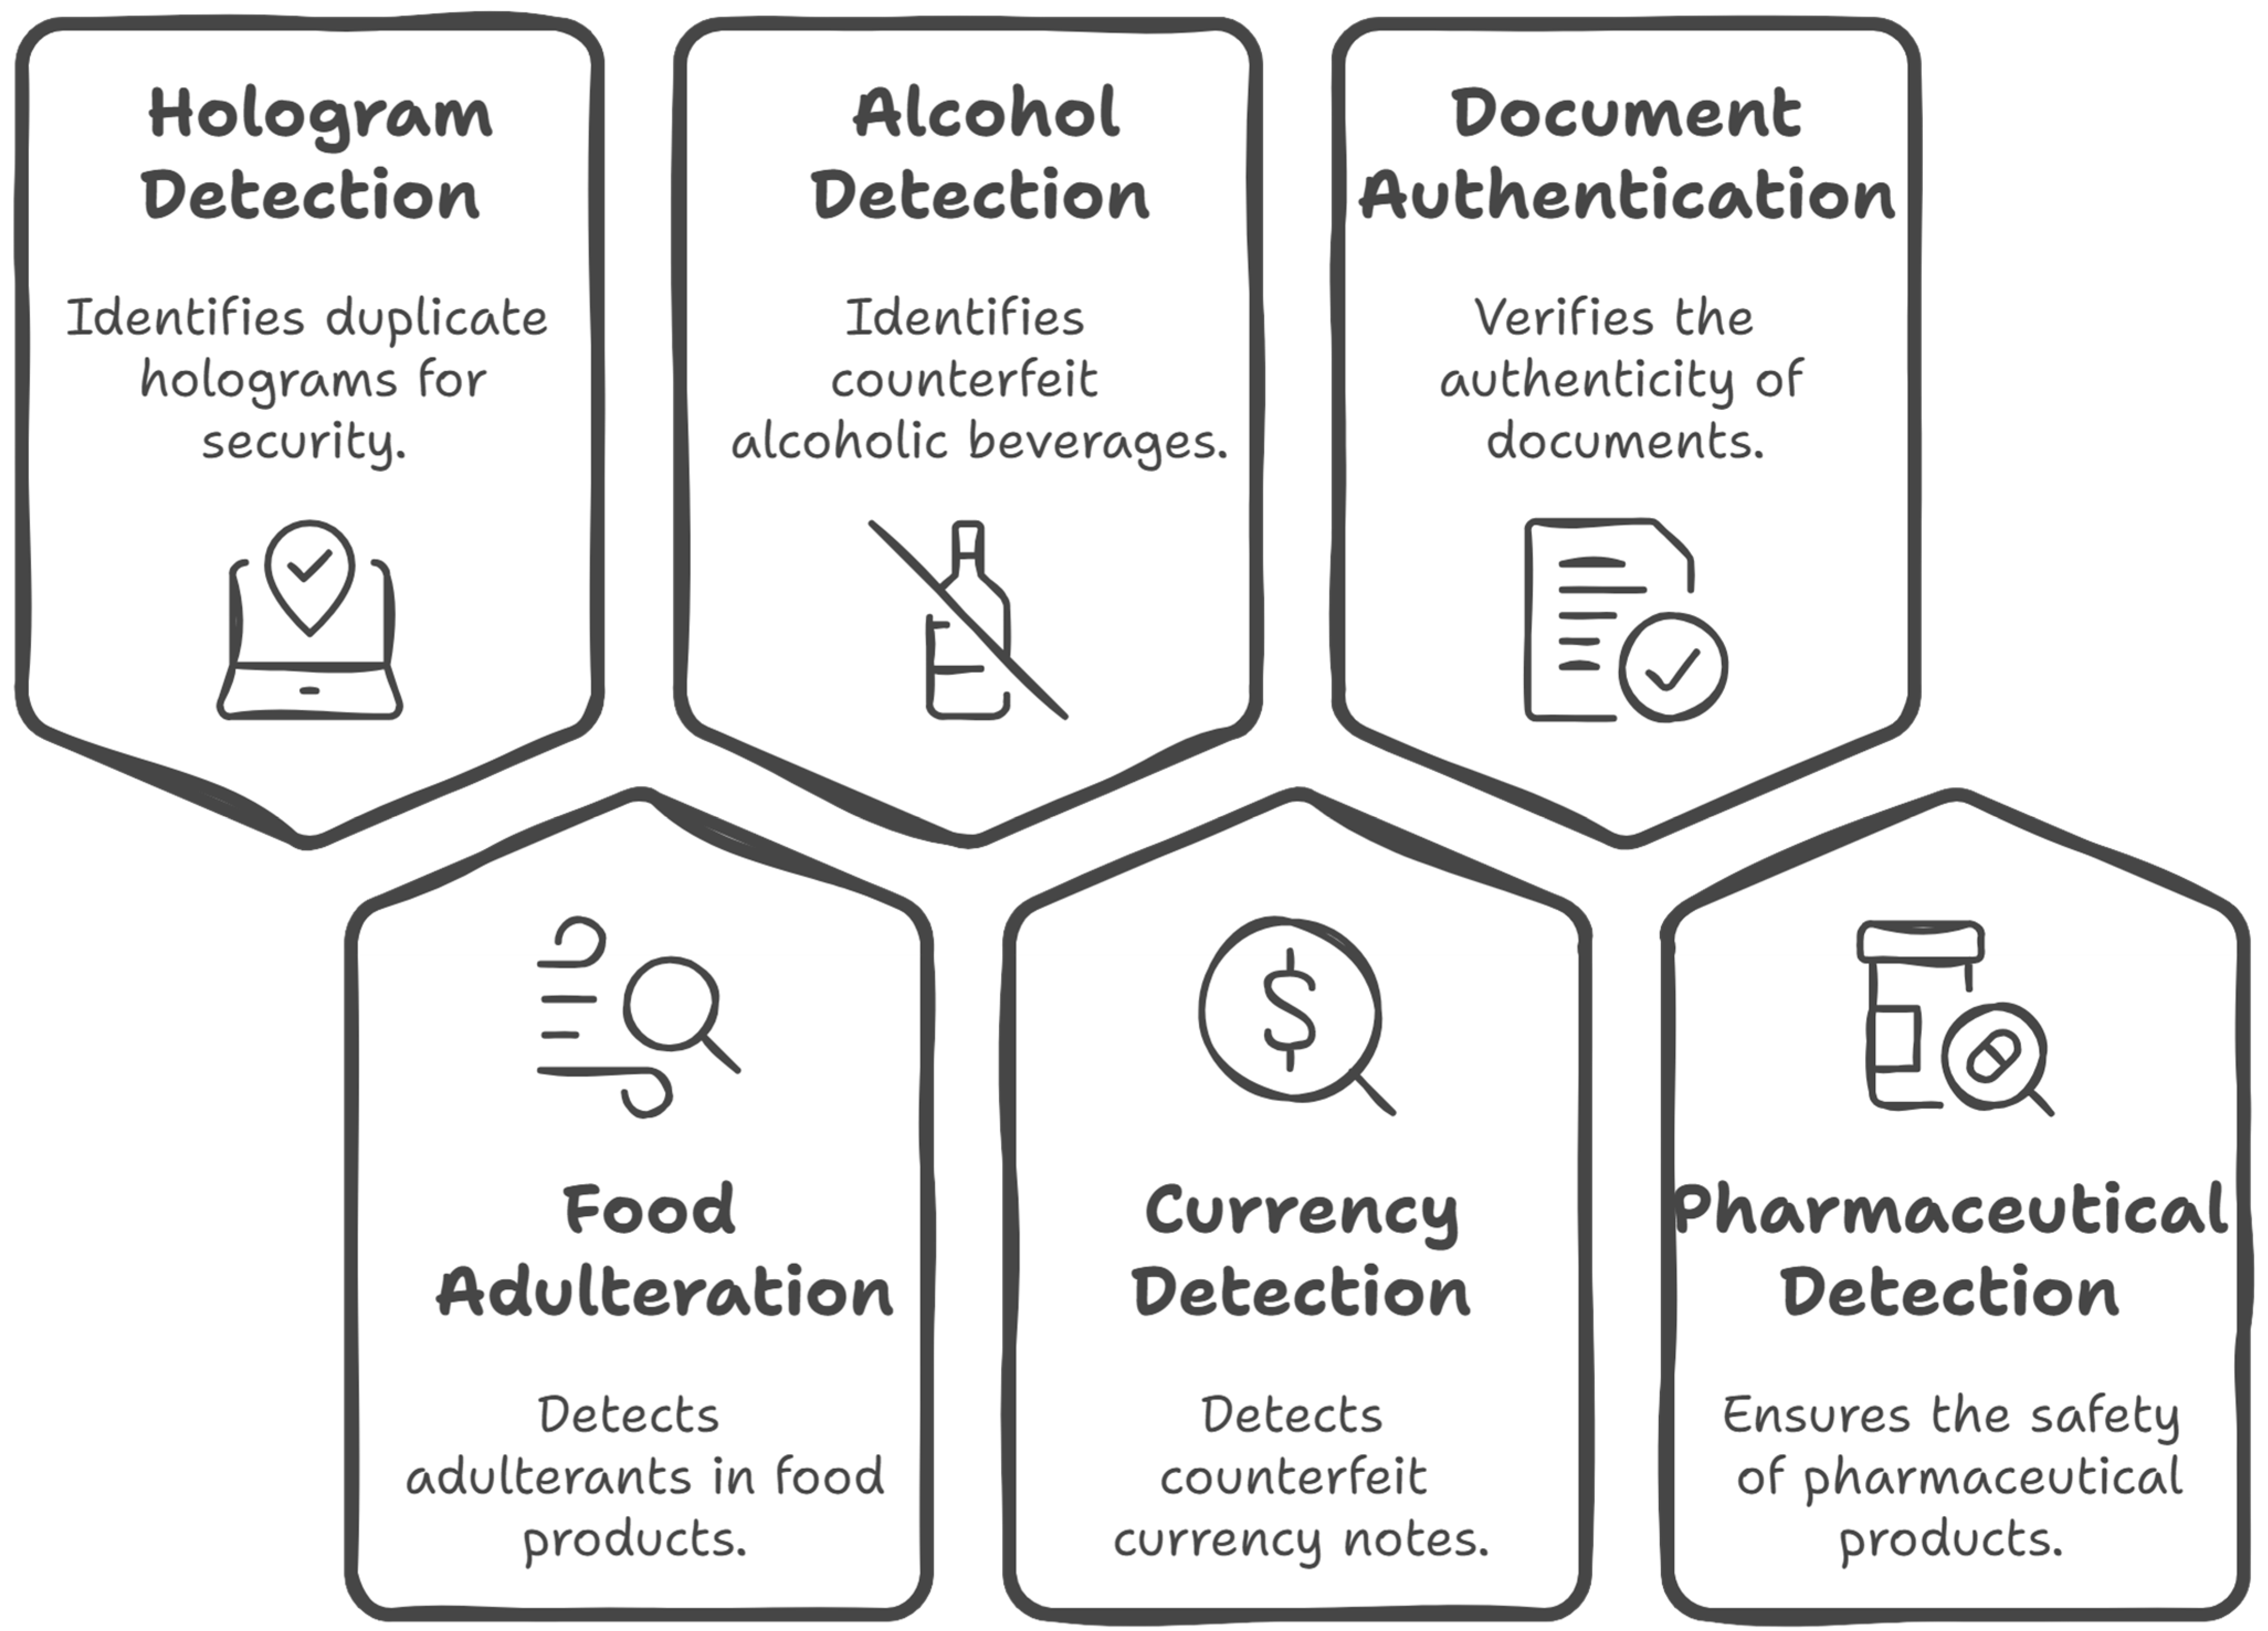

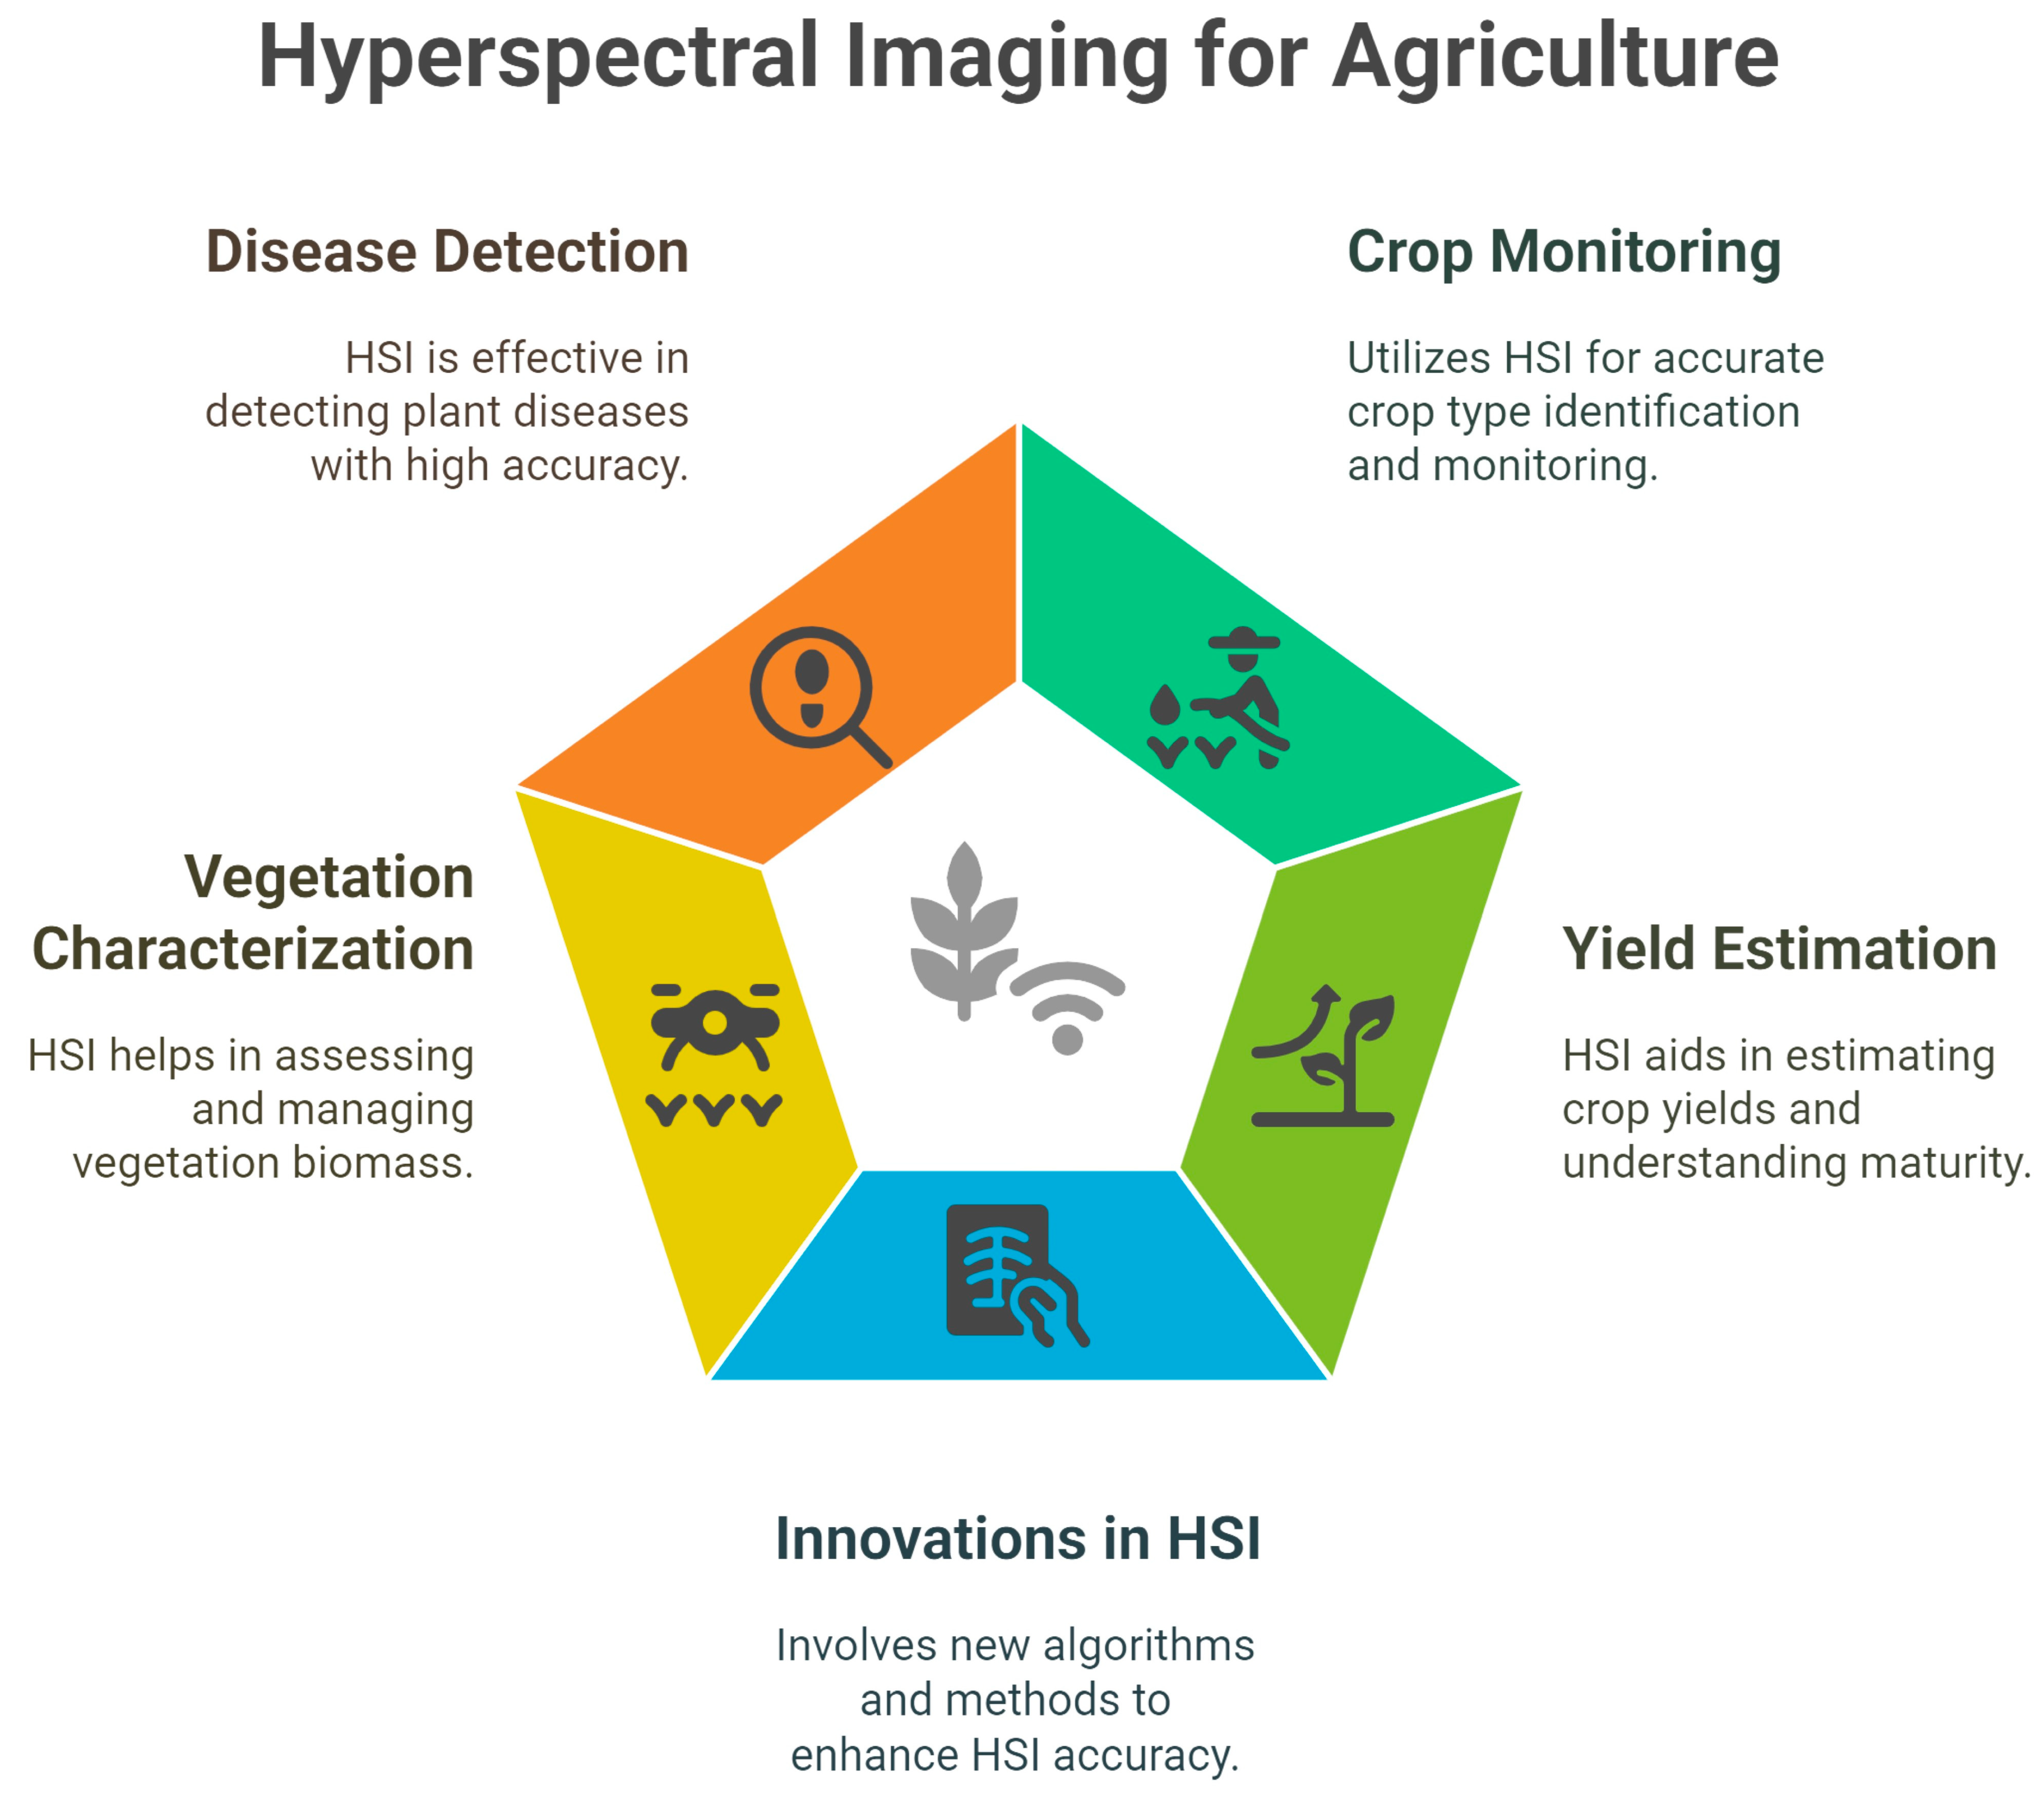
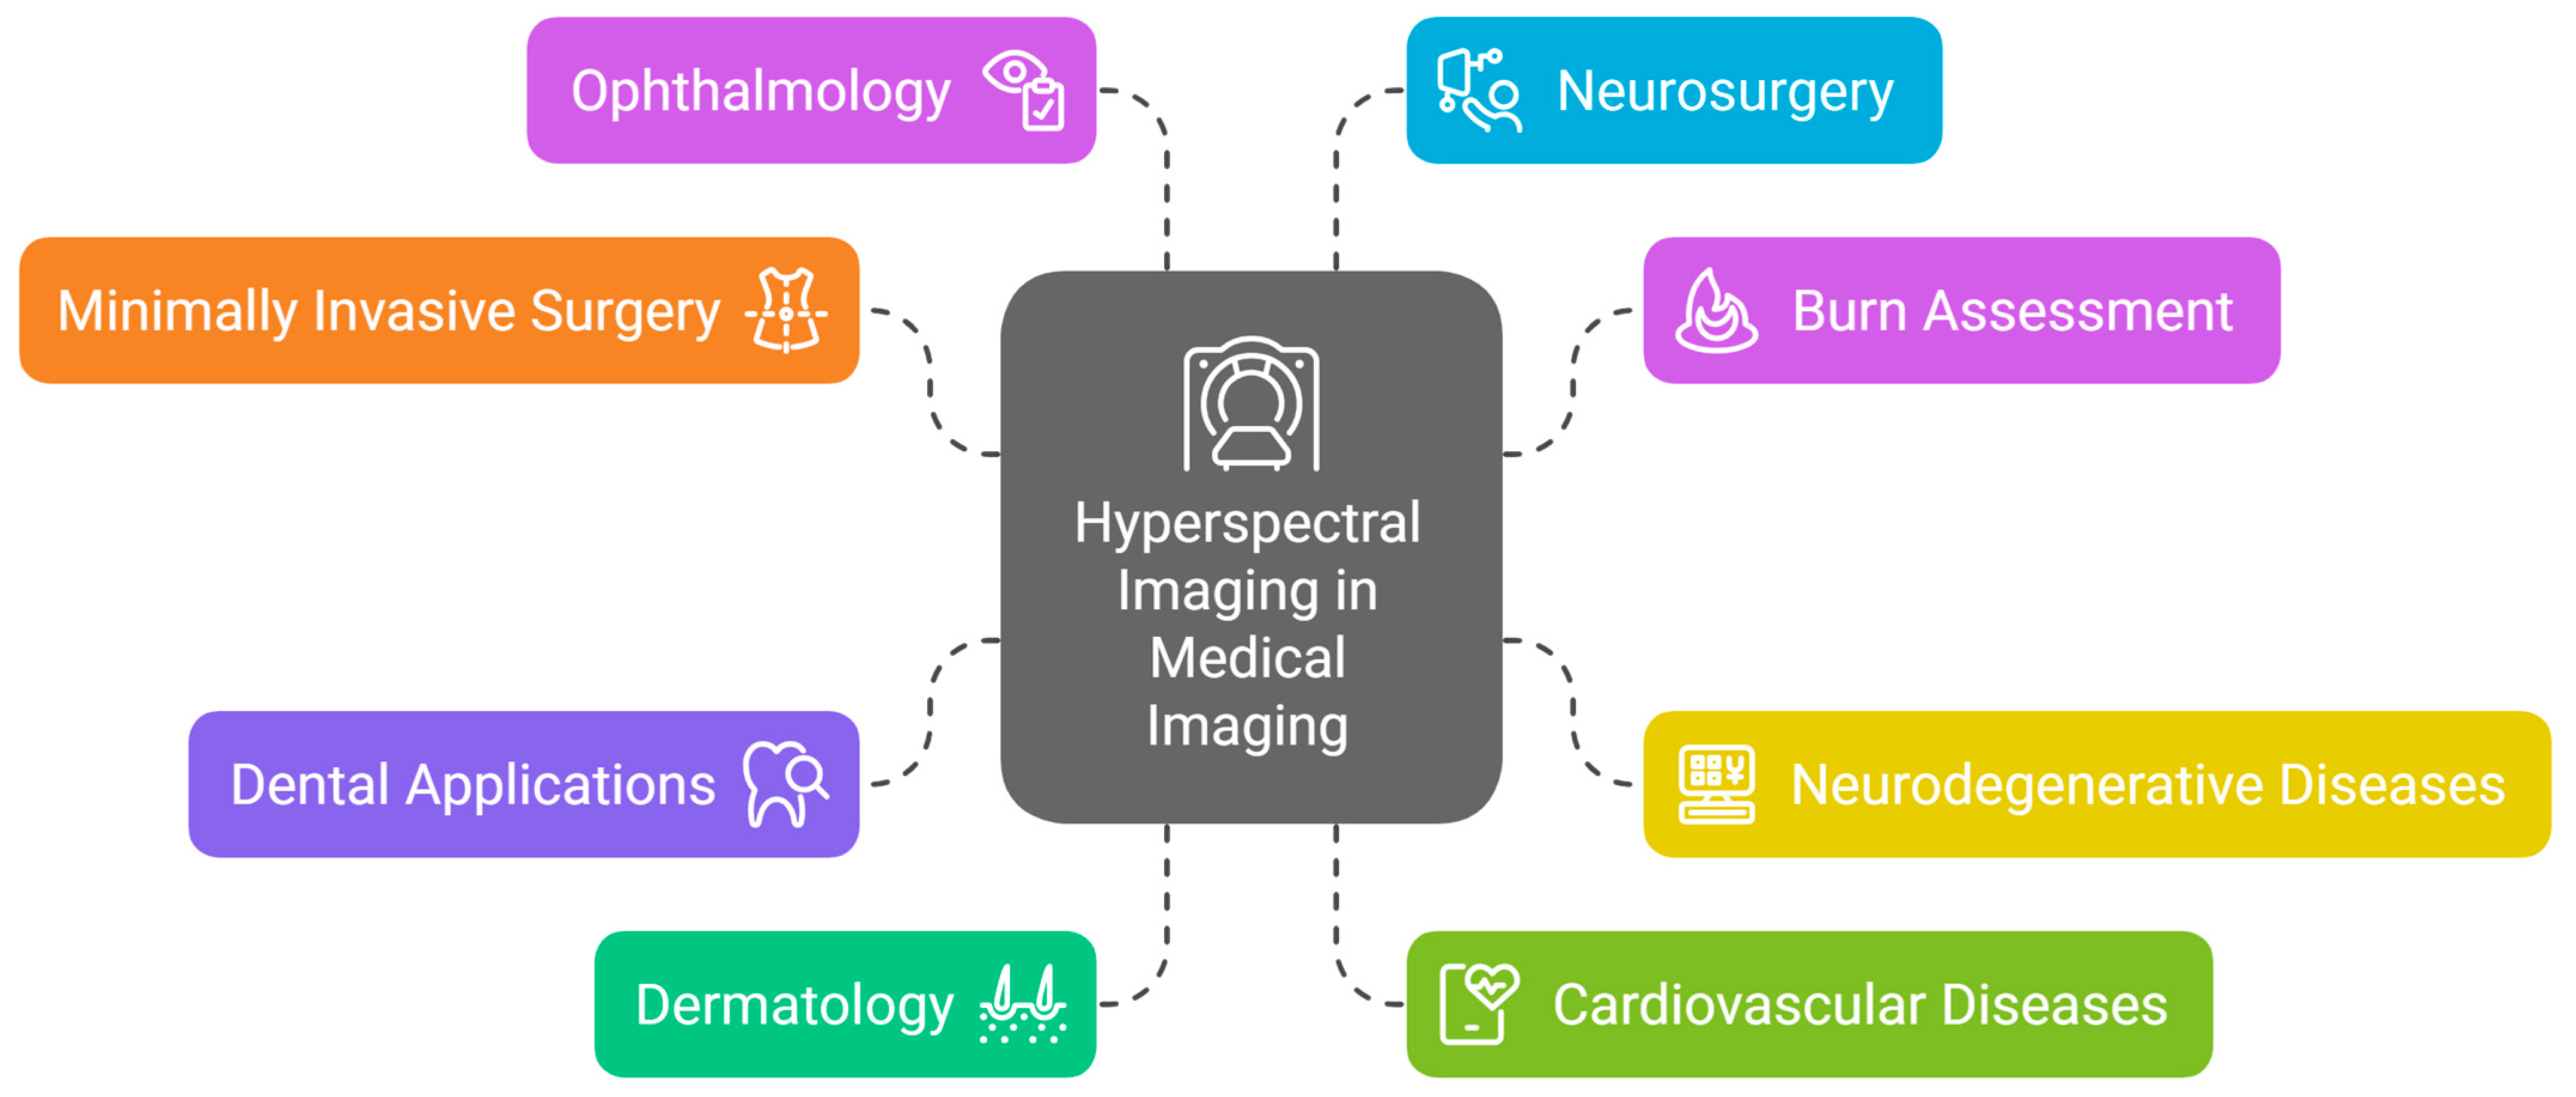
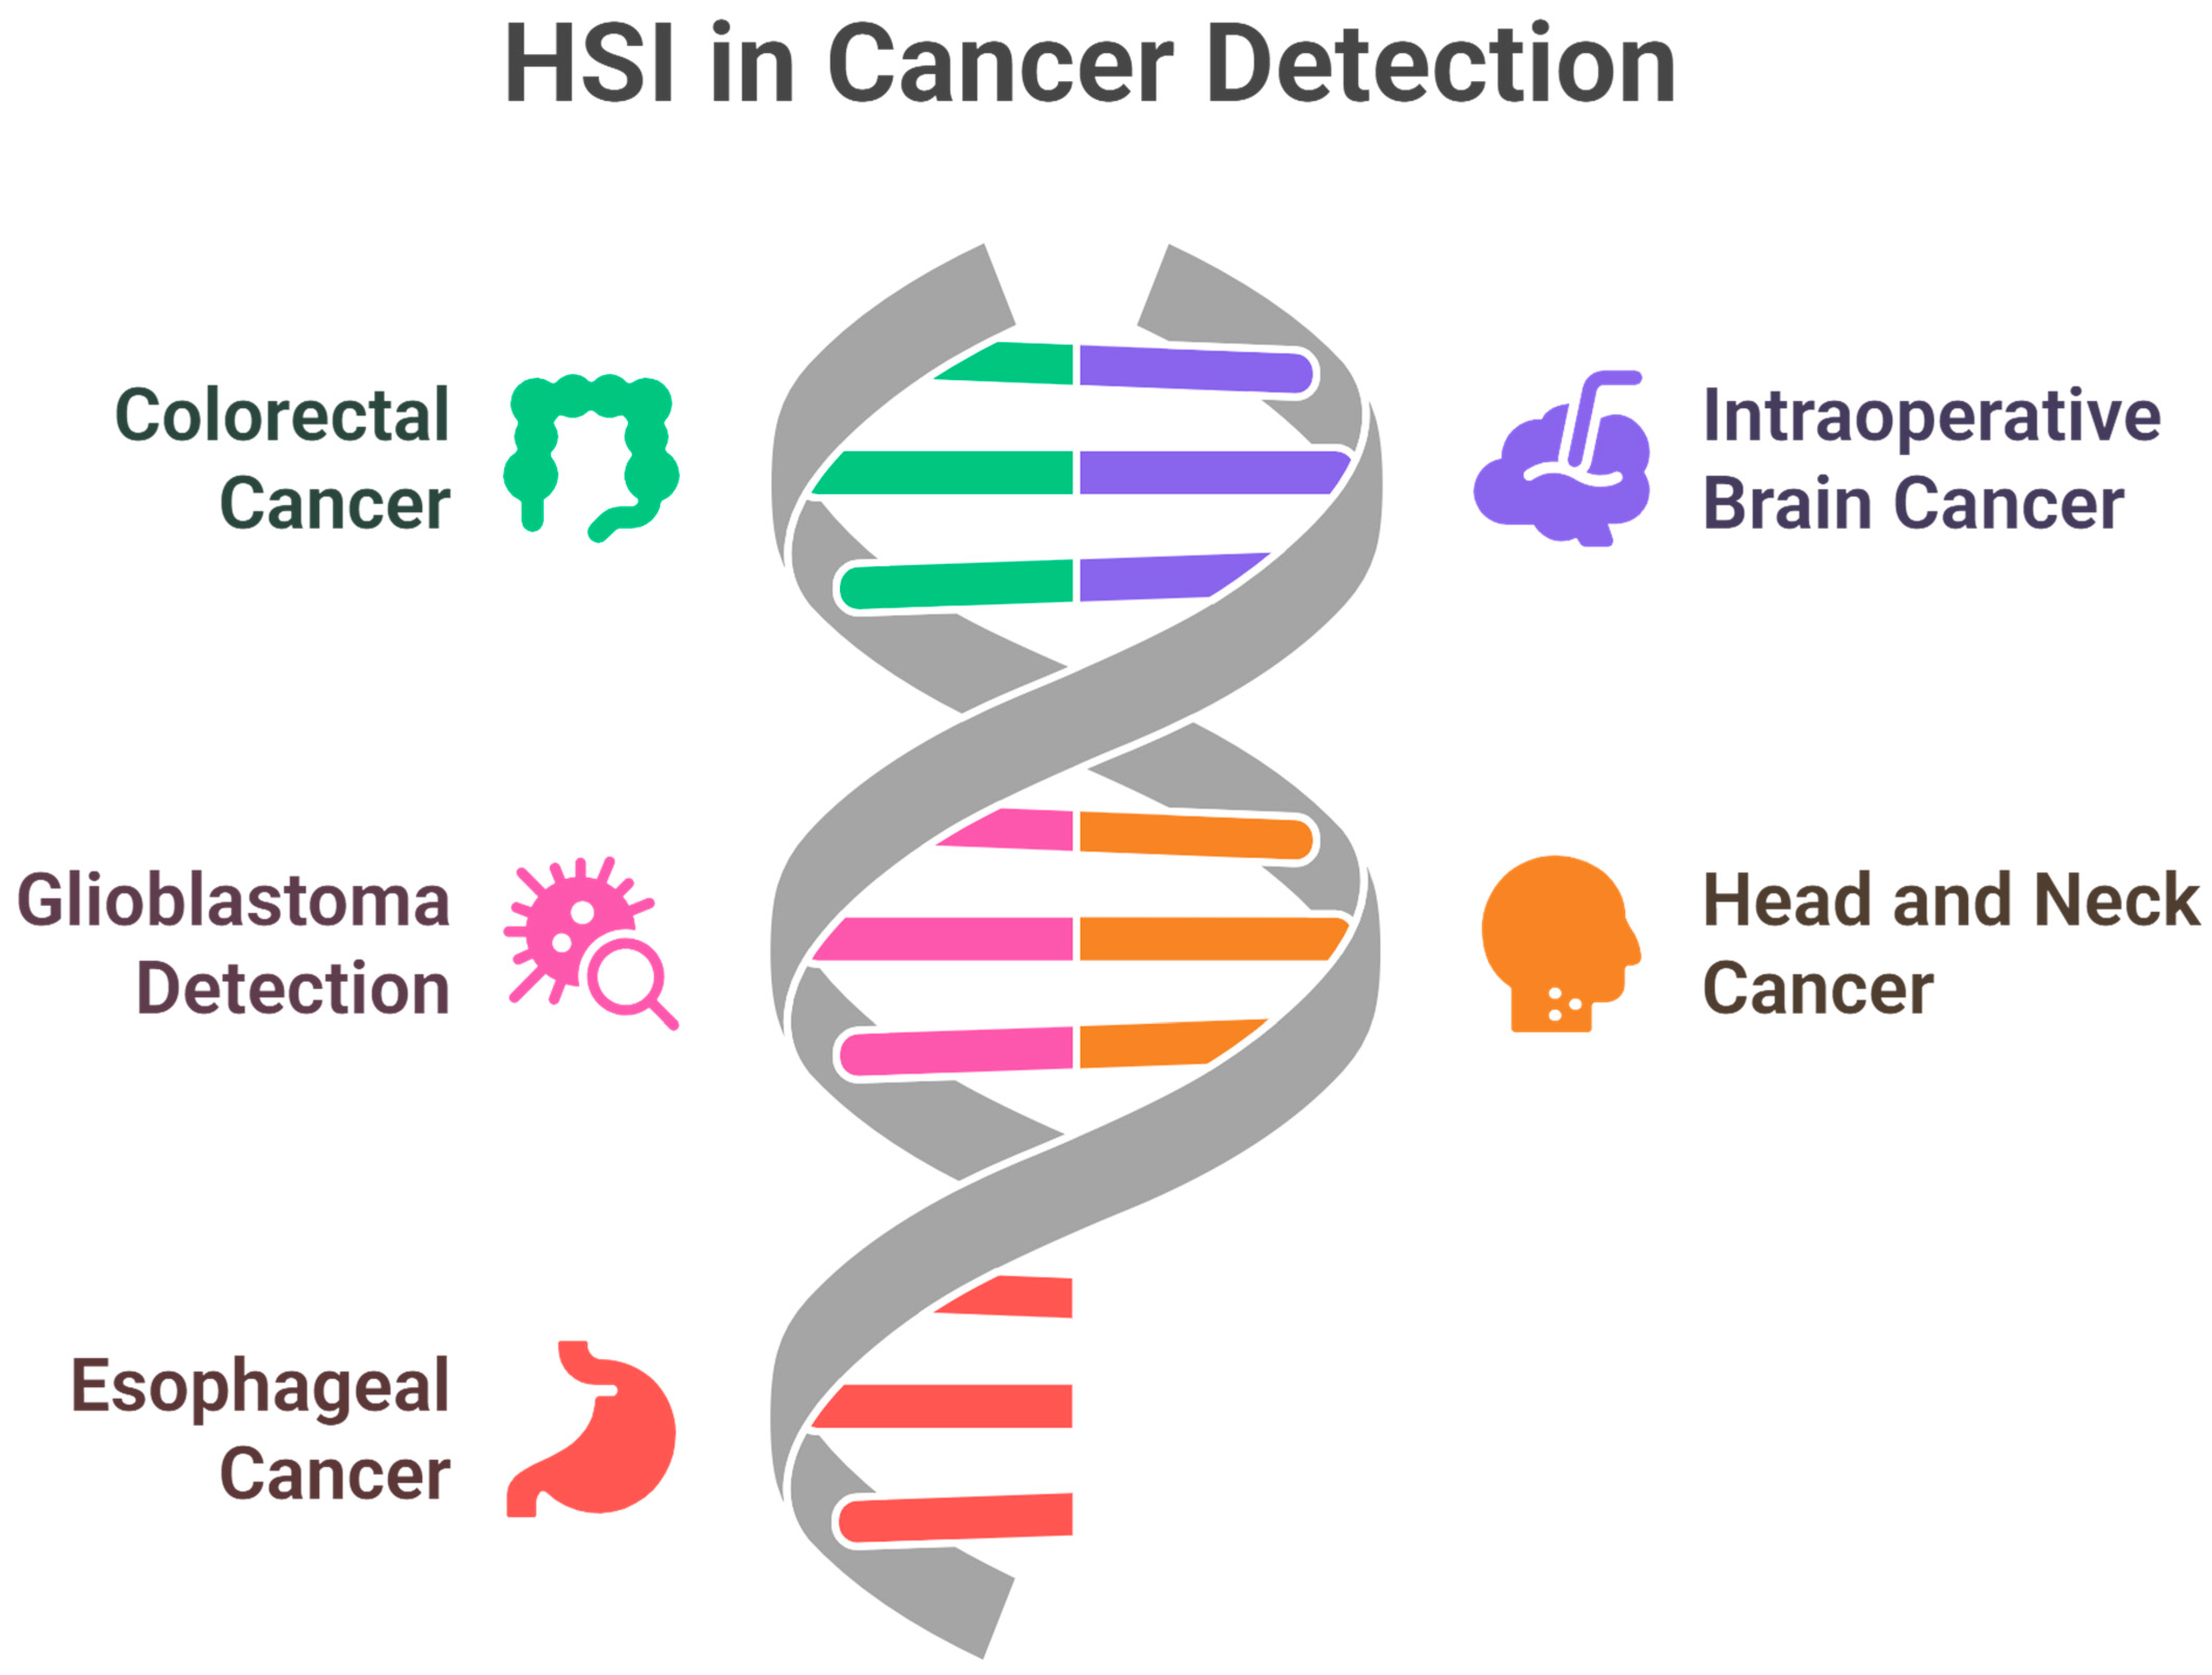
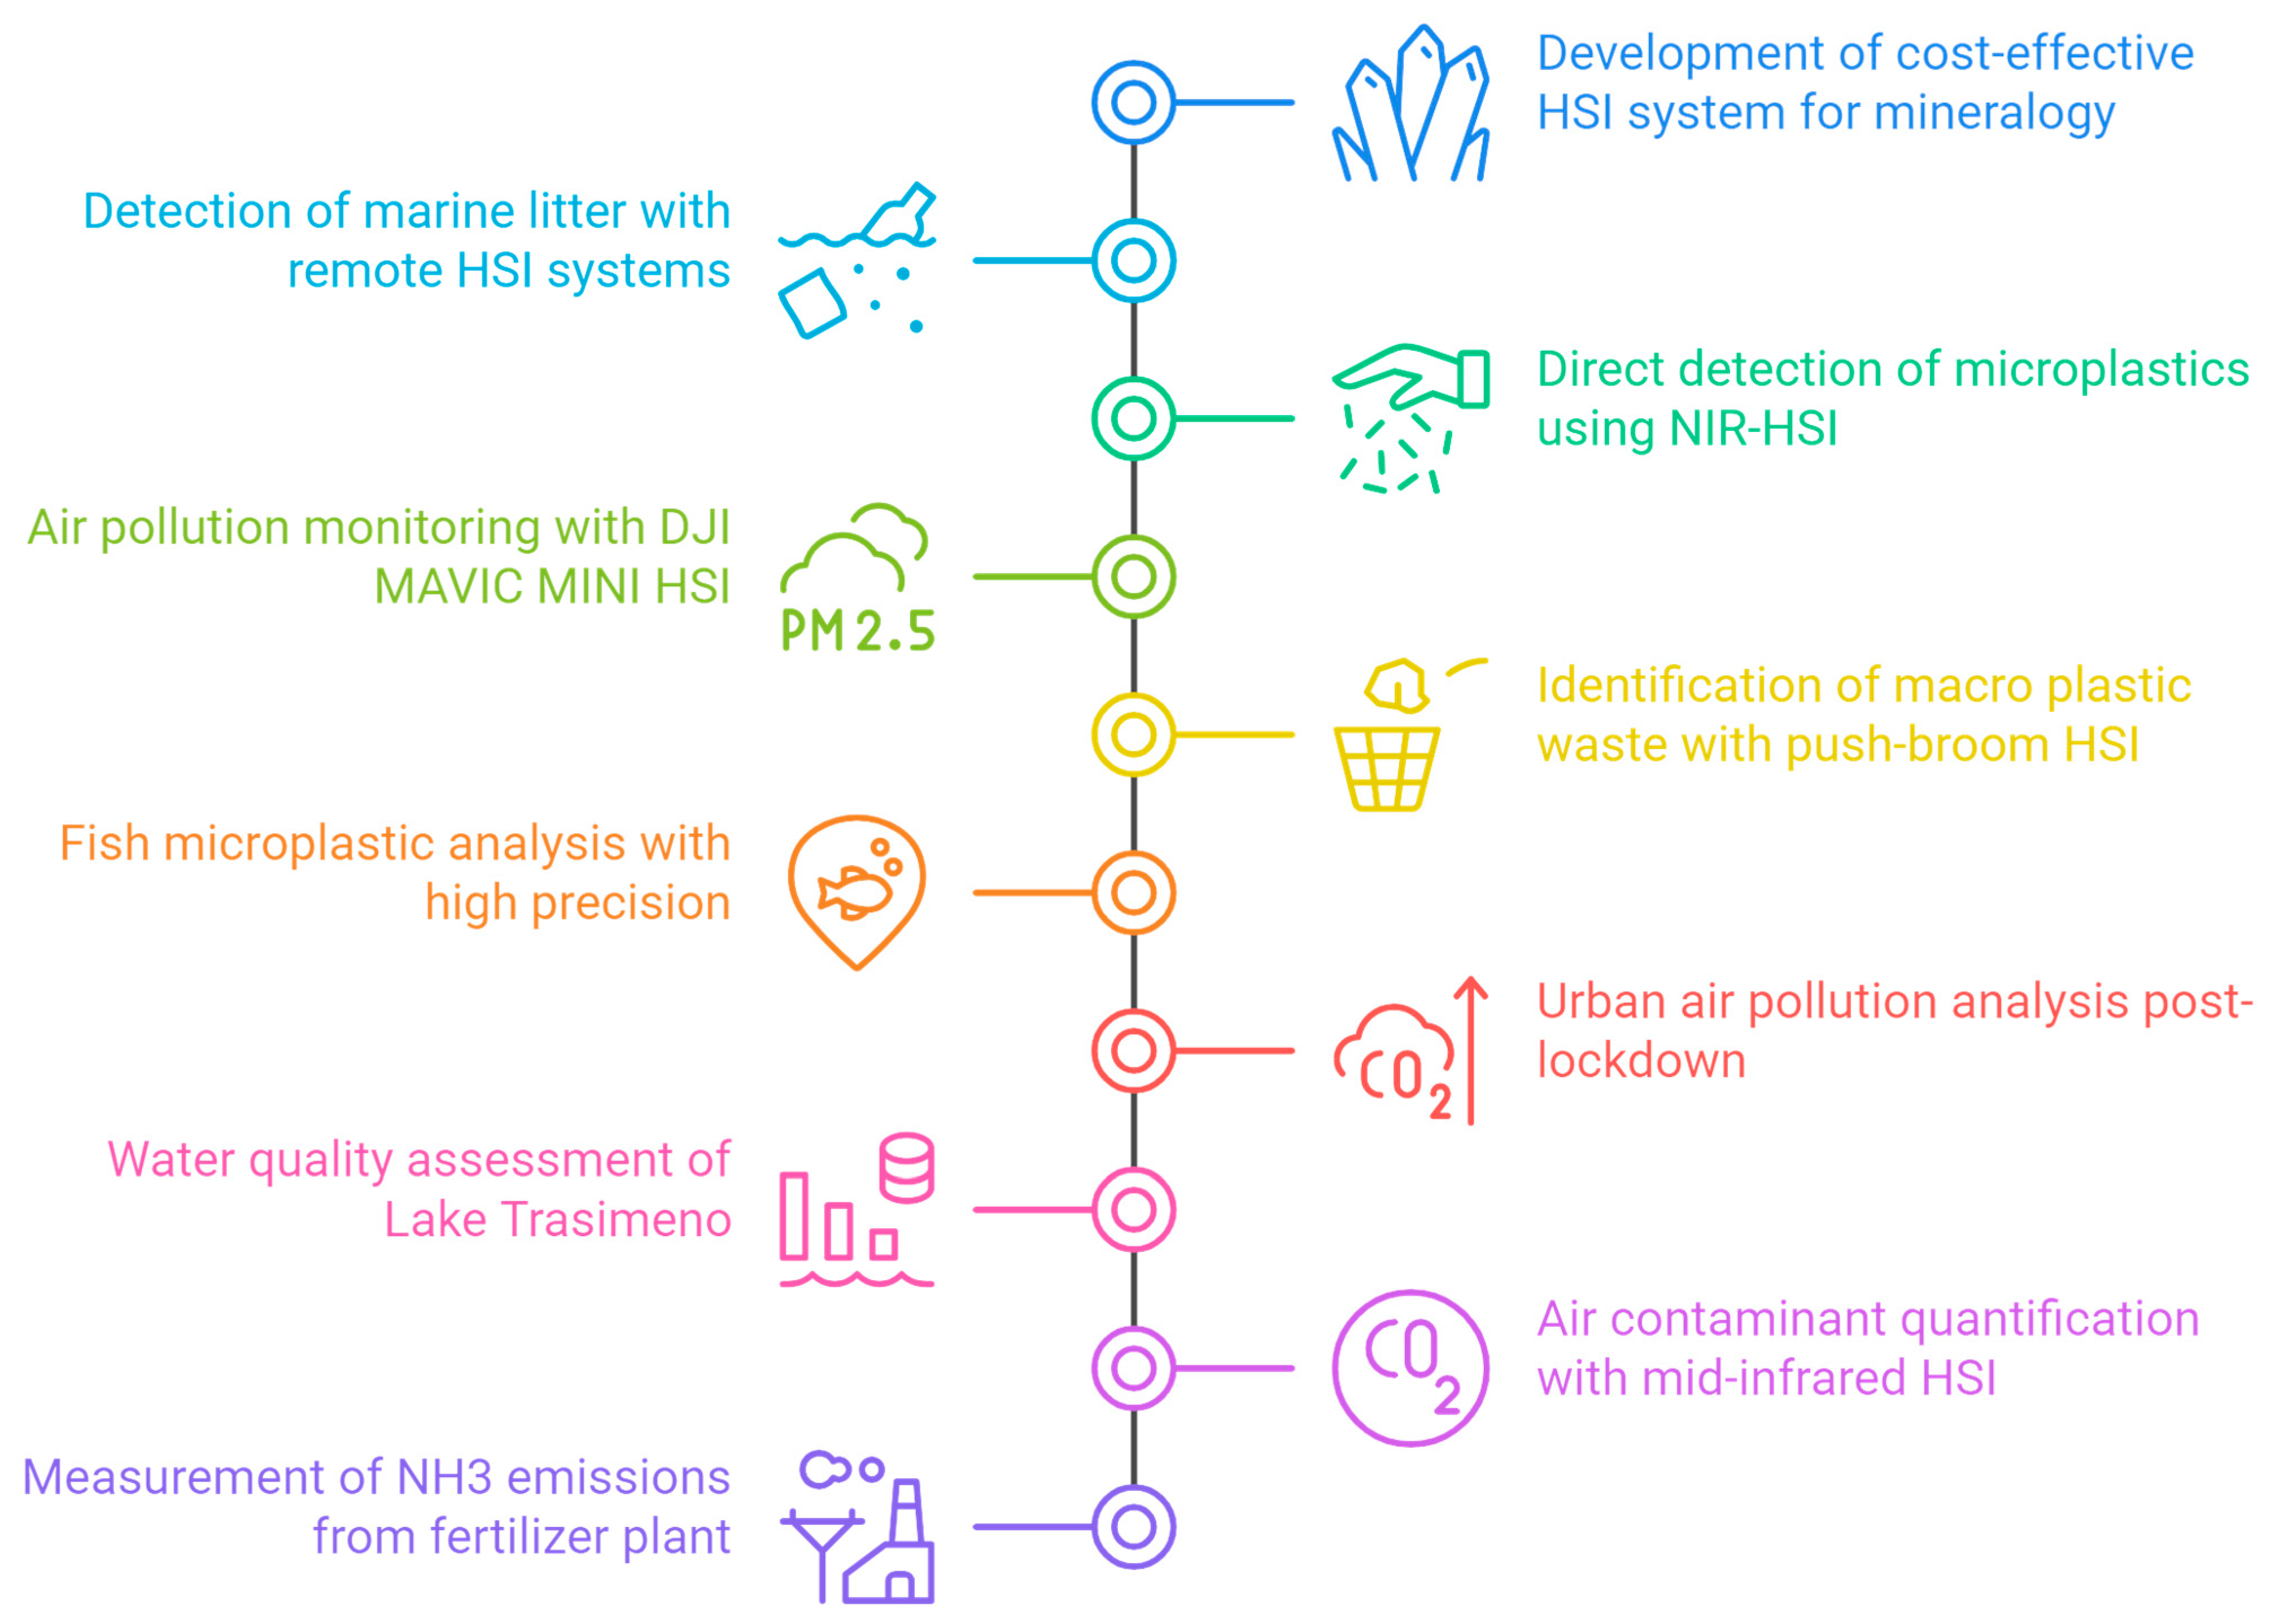
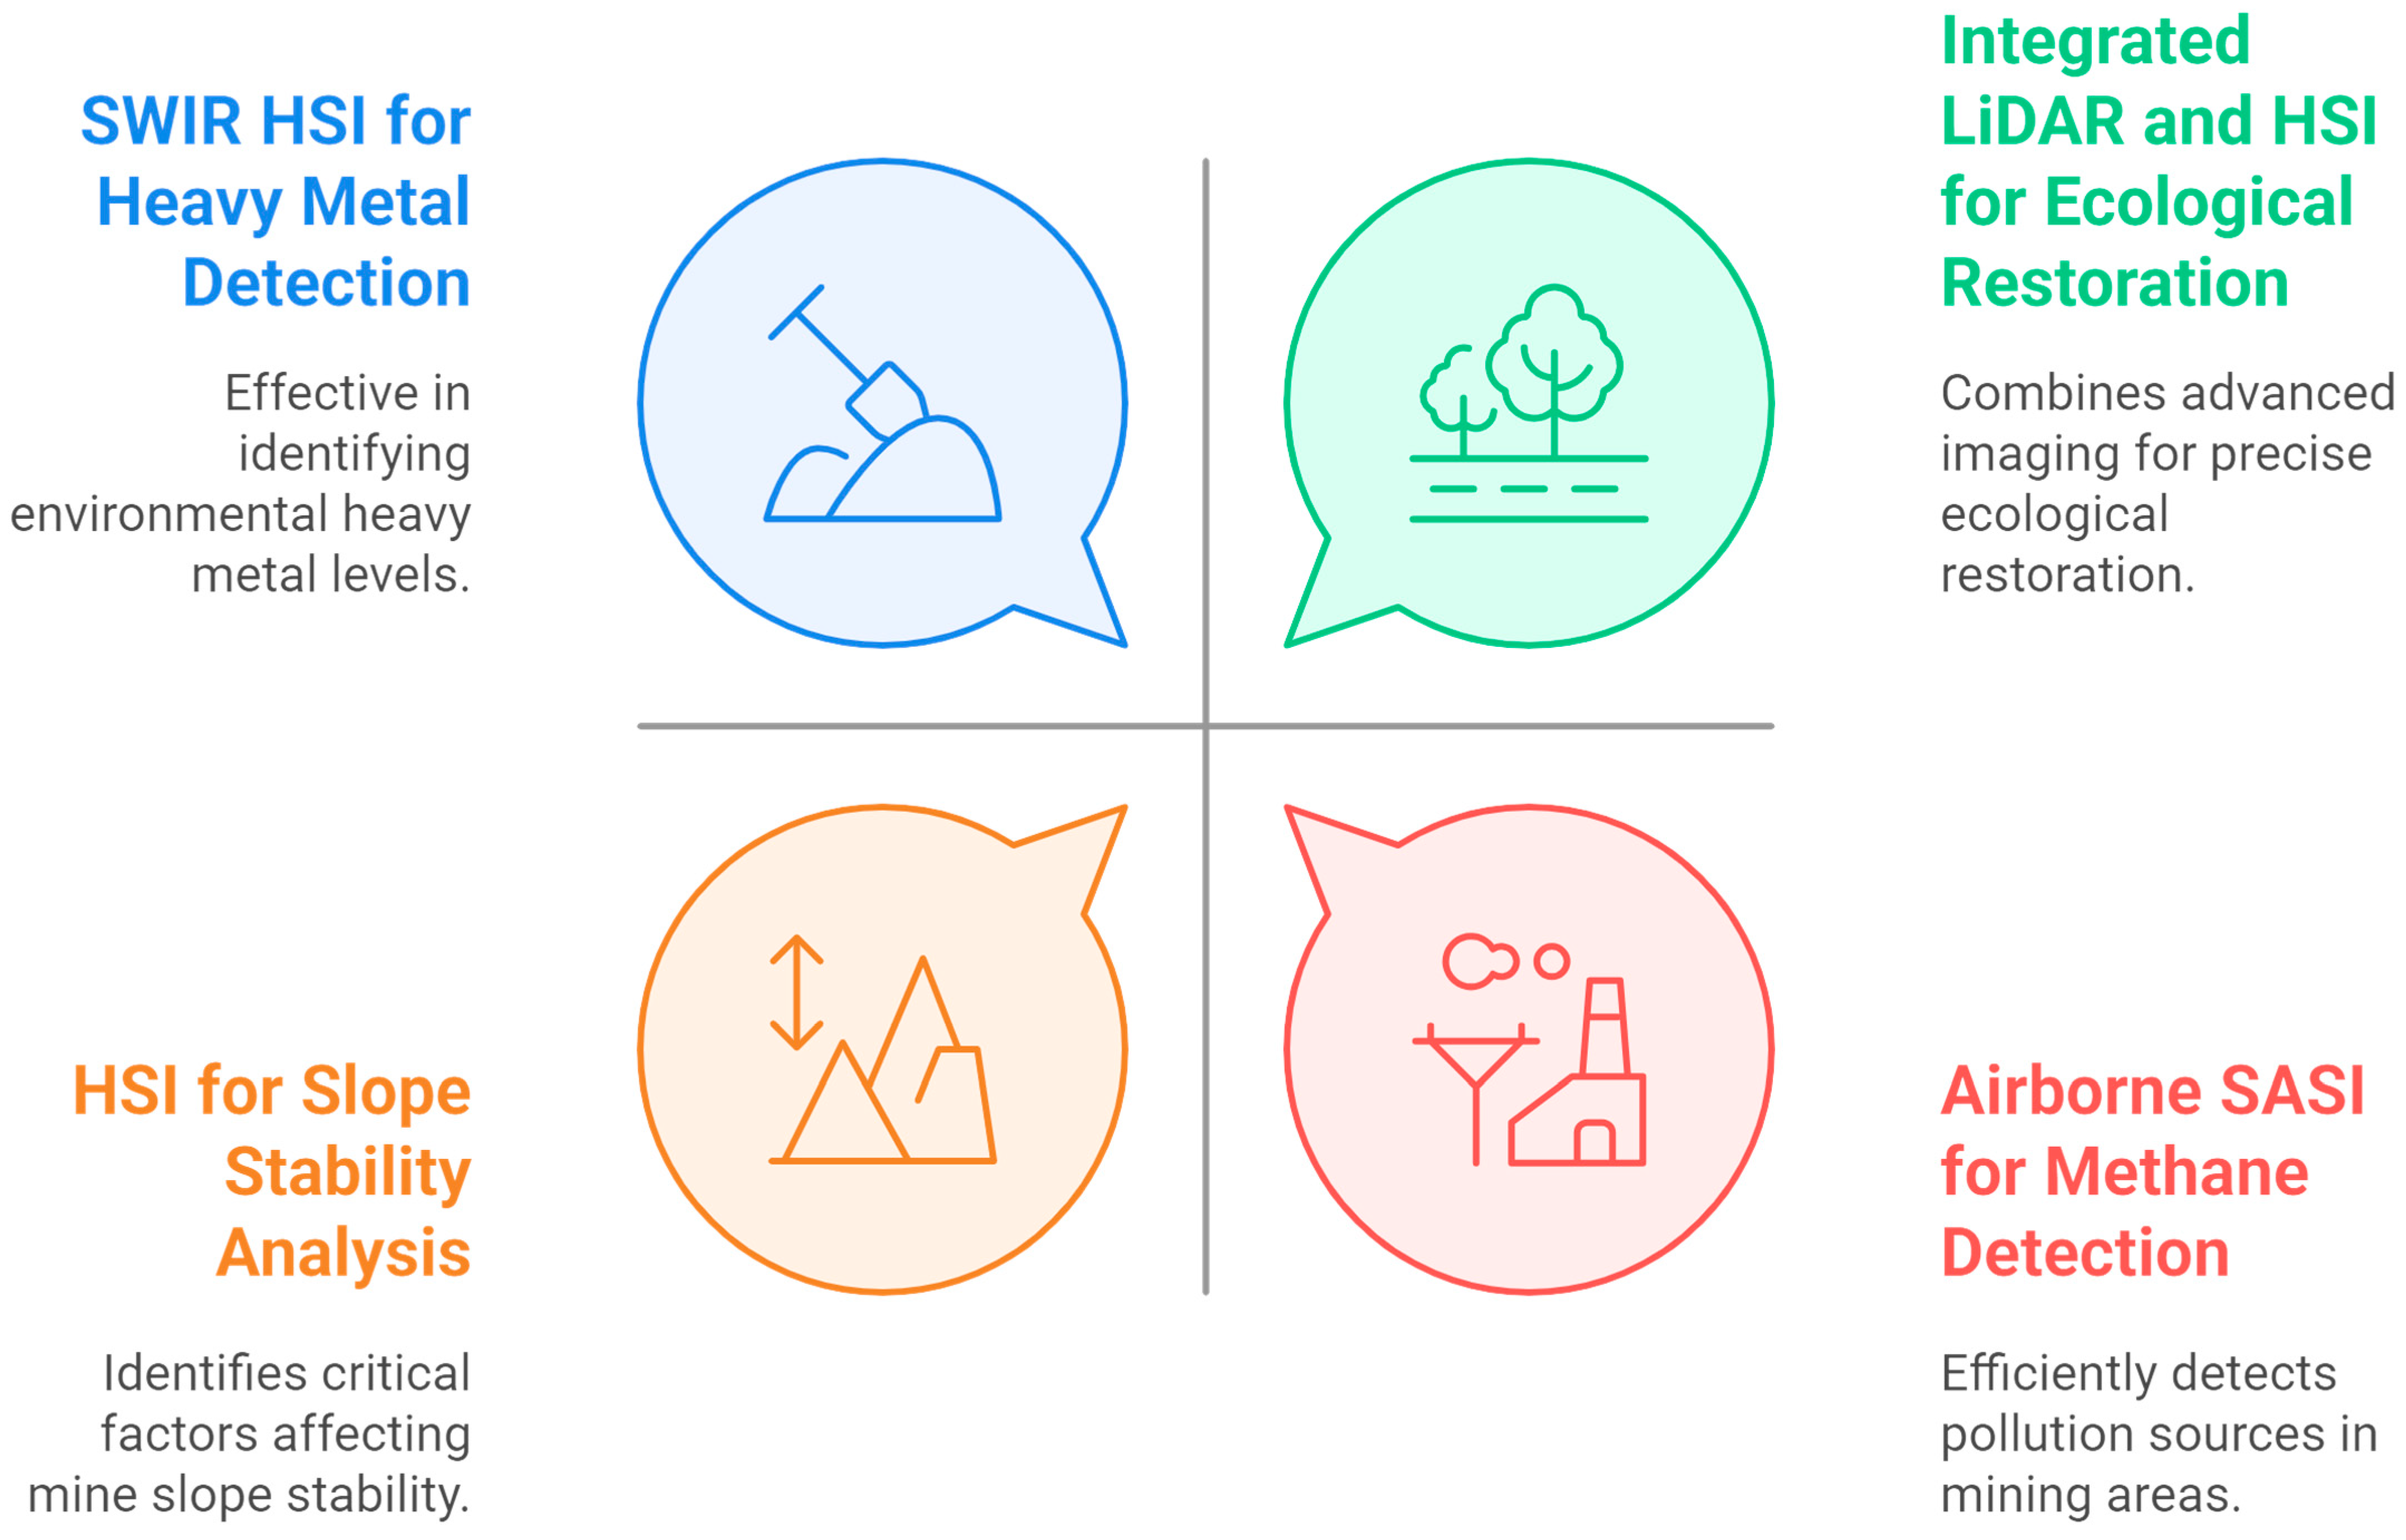
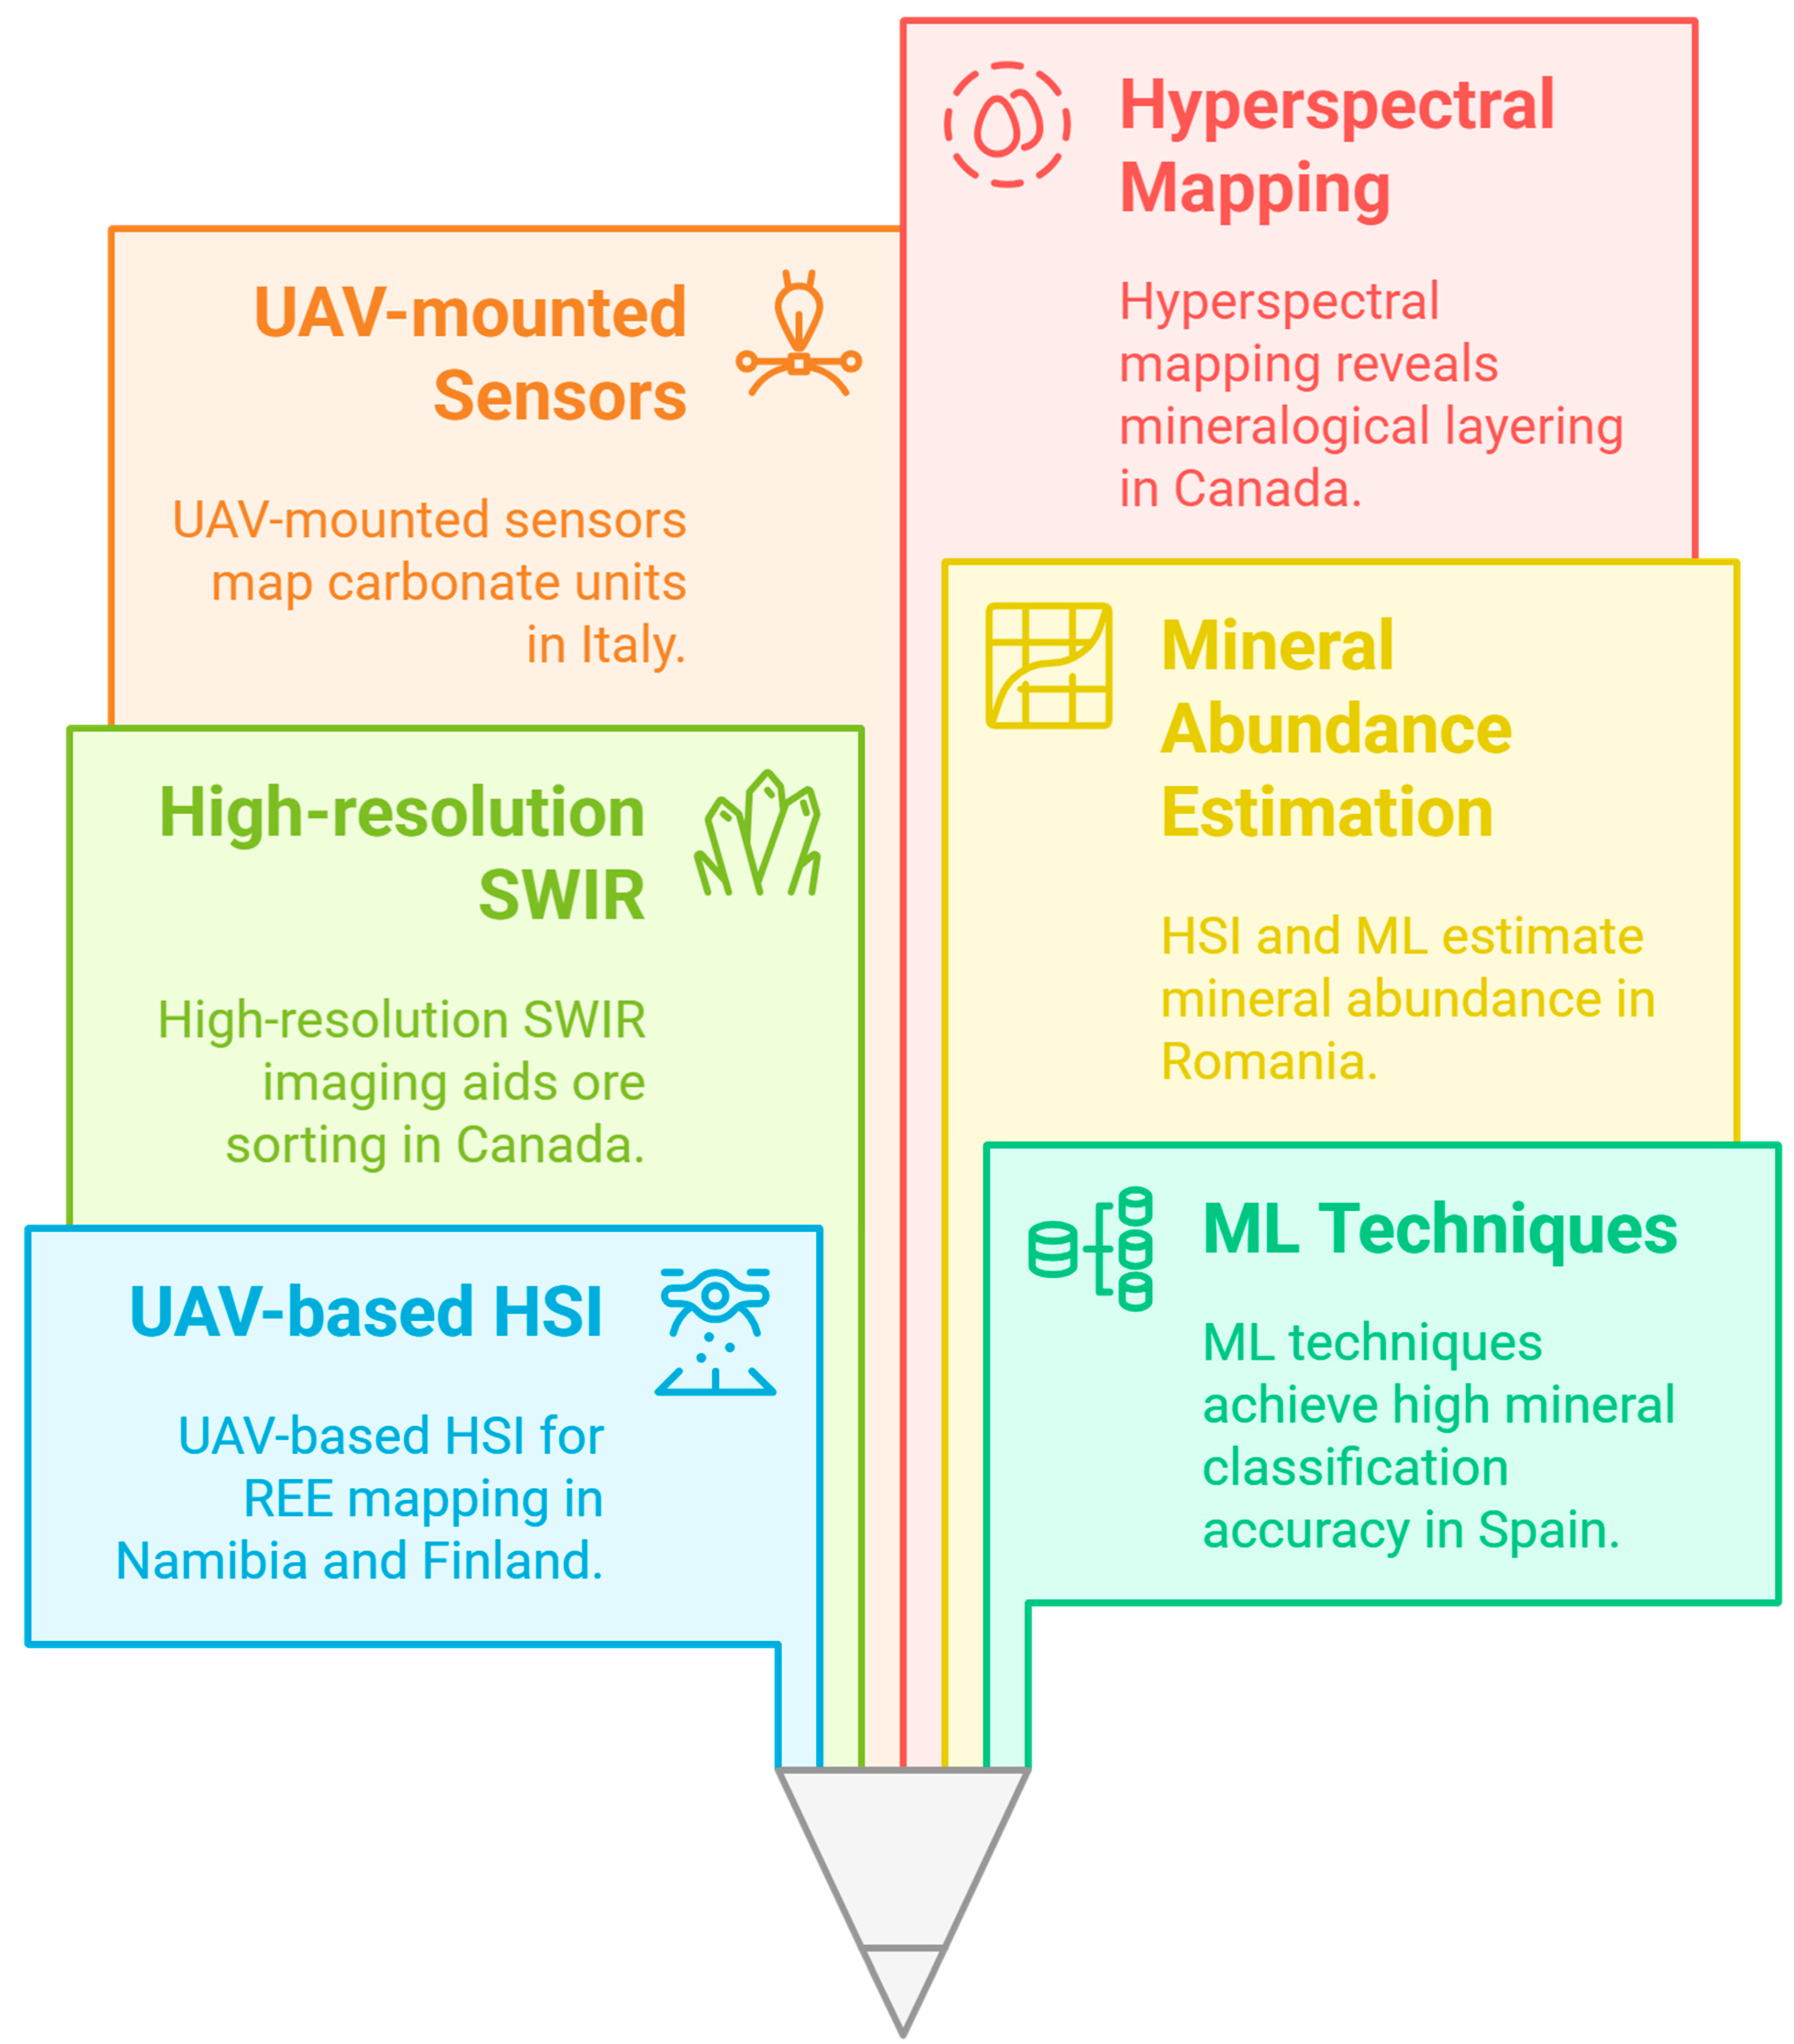
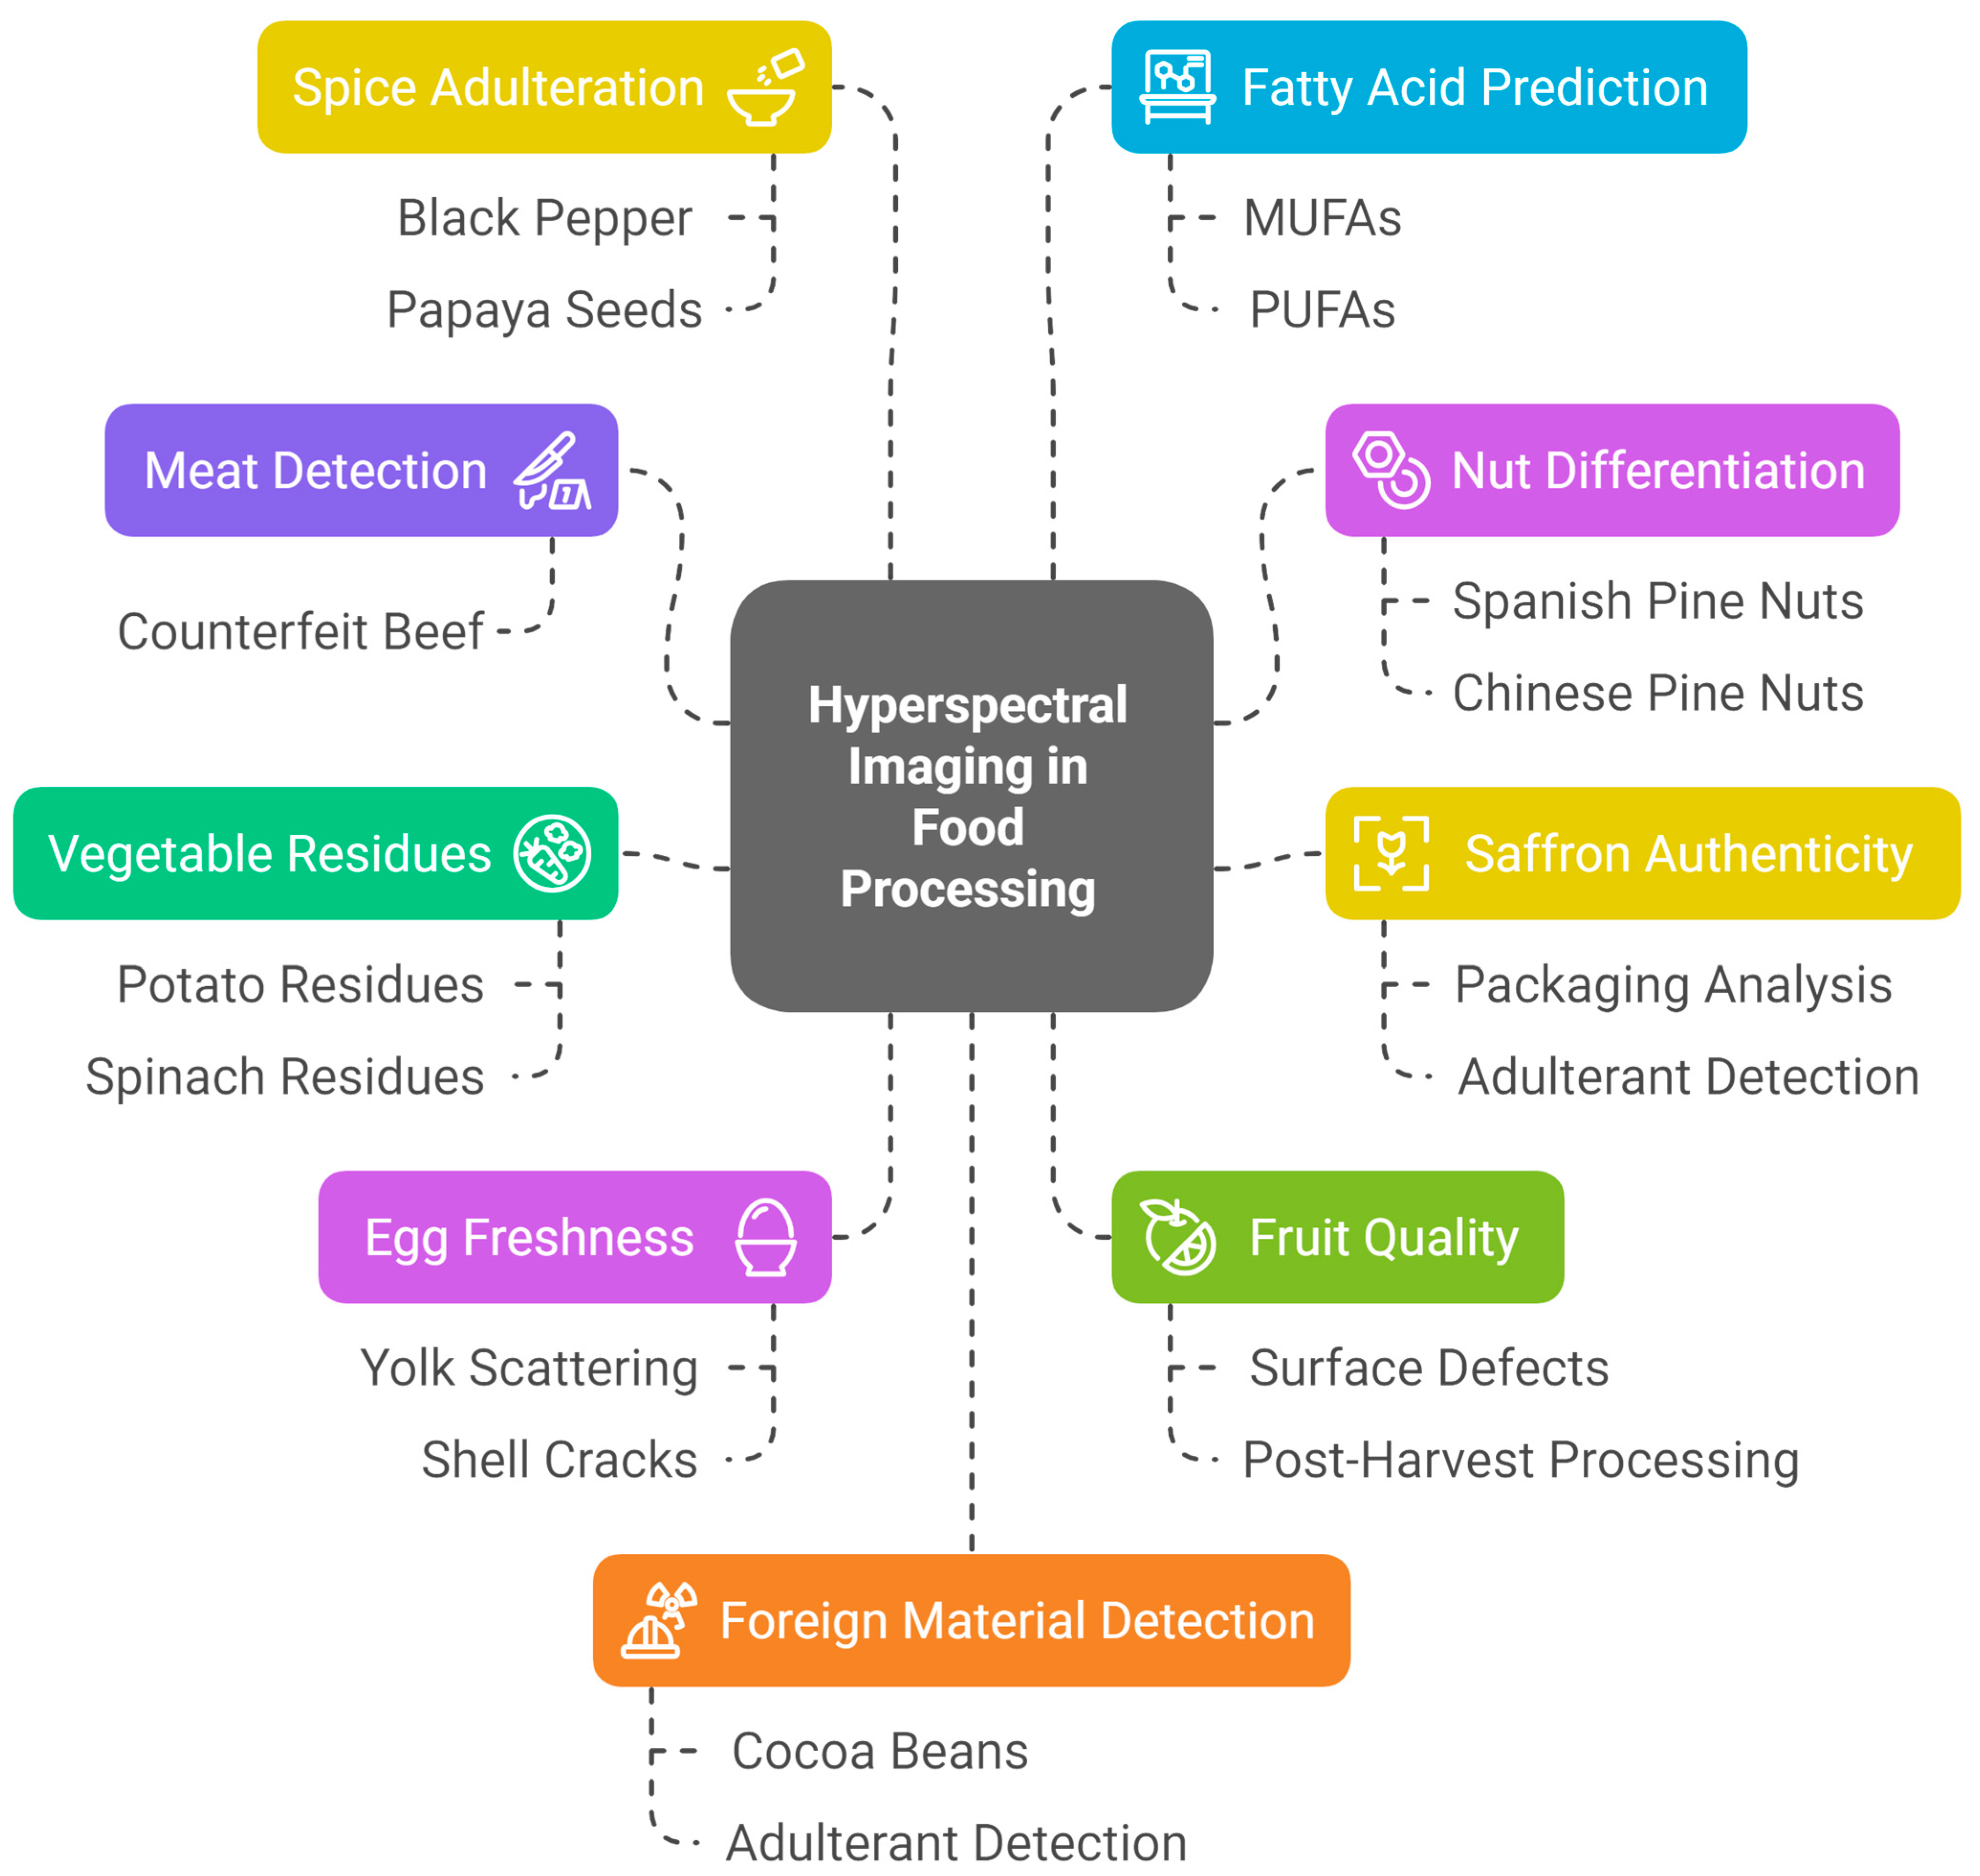
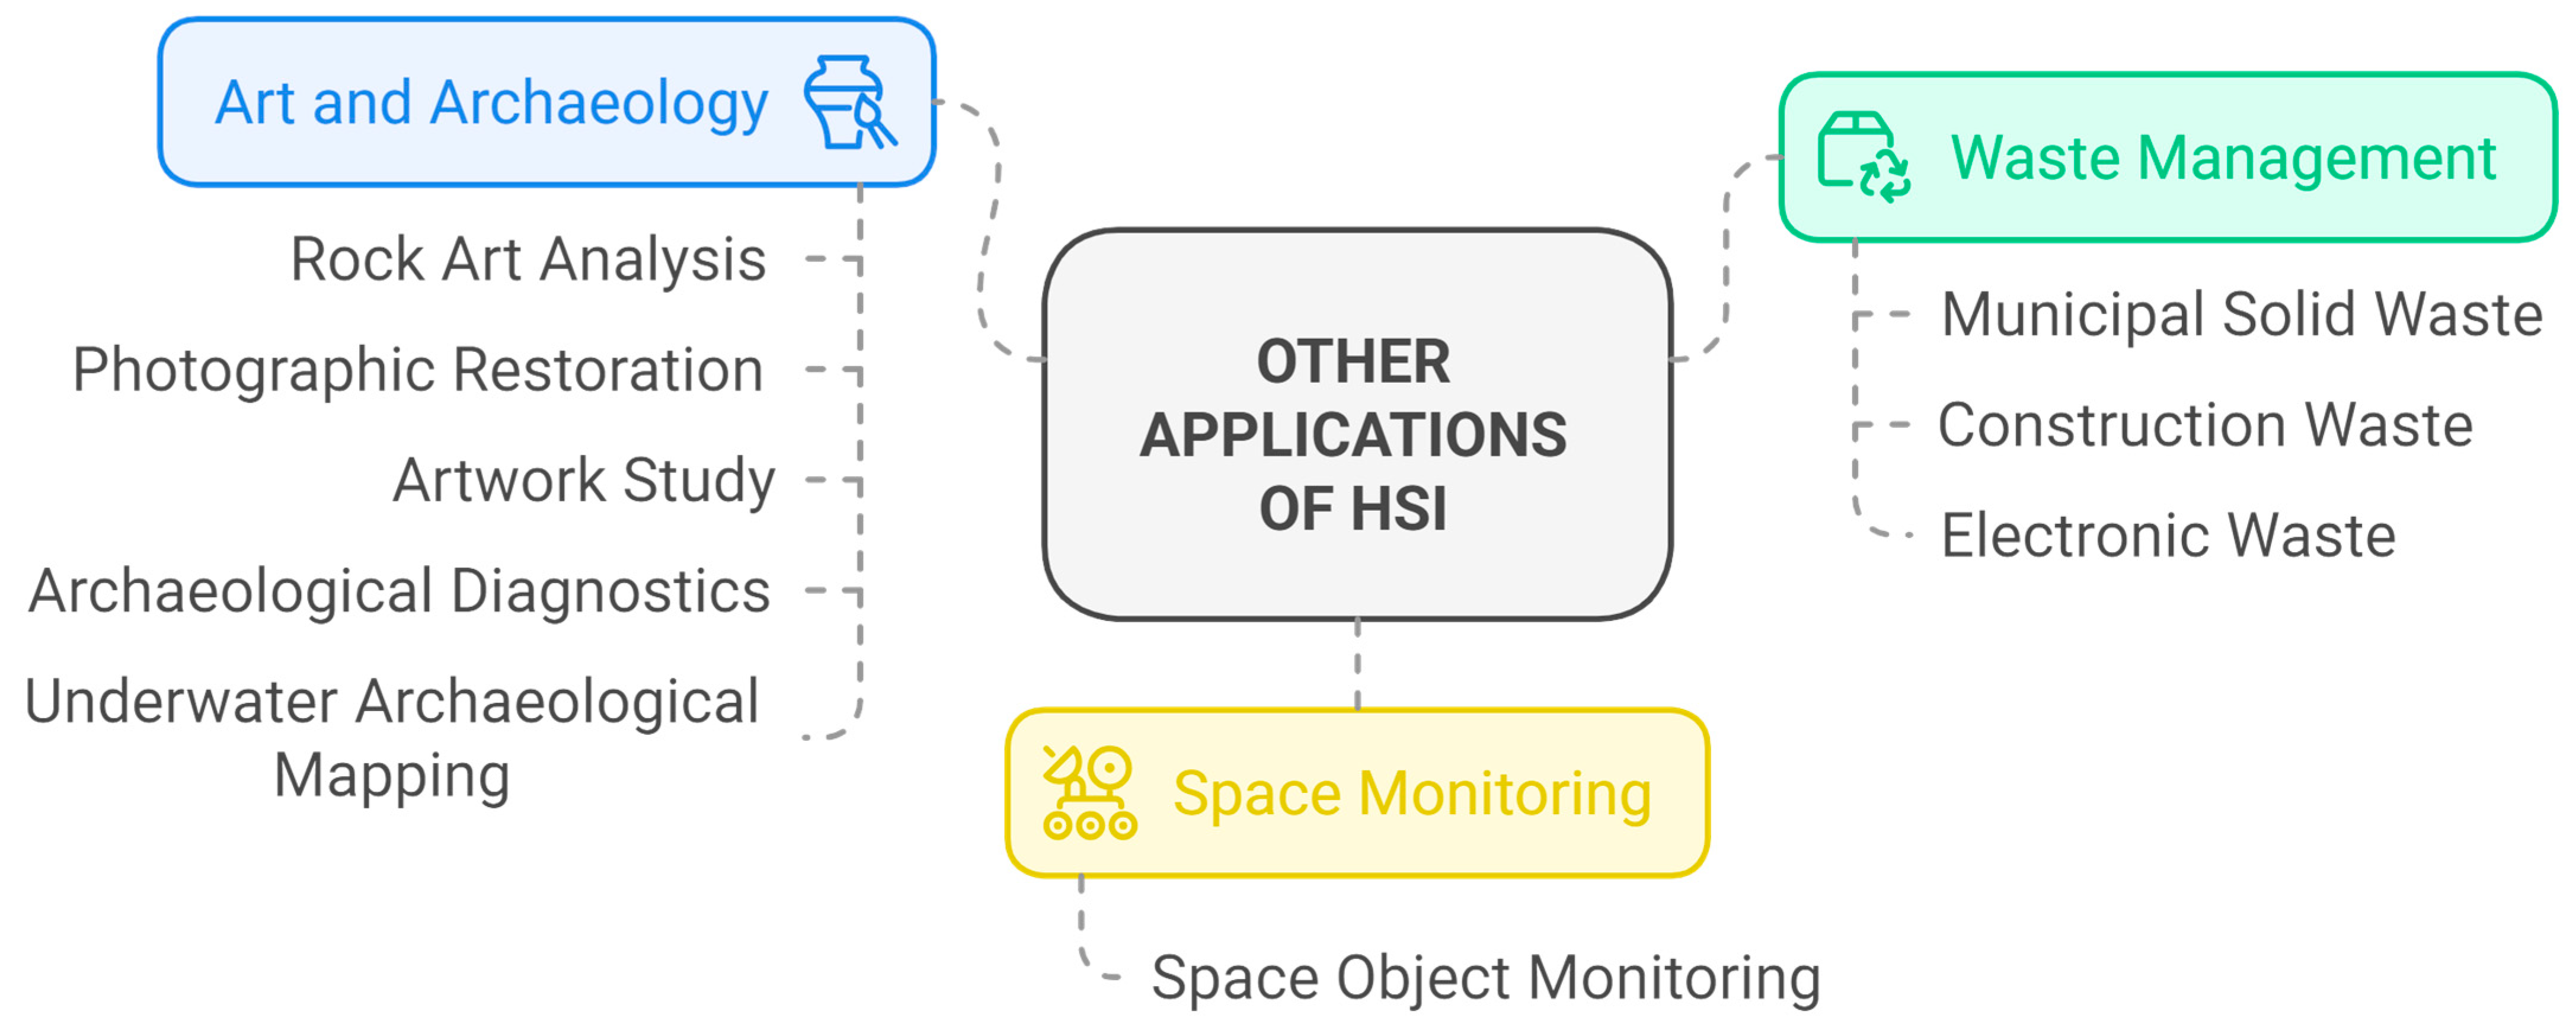
Disclaimer/Publisher’s Note: The statements, opinions and data contained in all publications are solely those of the individual author(s) and contributor(s) and not of MDPI and/or the editor(s). MDPI and/or the editor(s) disclaim responsibility for any injury to people or property resulting from any ideas, methods, instructions or products referred to in the content. |
© 2025 by the authors. Licensee MDPI, Basel, Switzerland. This article is an open access article distributed under the terms and conditions of the Creative Commons Attribution (CC BY) license (https://creativecommons.org/licenses/by/4.0/).