Article

Effect of Pore Characteristics of Biomass-Derived Activated Carbon for Automobile Canisters via Chemical Stabilization Method on Butane Adsorption Characteristics

1
R&BD Group1, Industrialization Division, Korea Carbon Industry Promotion Agency, Jeonju 54853, Republic of Korea
2
Department of Carbon Materials and Fiber Engineering, Jeonbuk University, Jeonju 54896, Republic of Korea
3
Department of Polymer Engineering, Chonnam National University, Gwangju 611186, Republic of Korea
4
Department of Materials Science and Chemical Engineering, Jeonju University, Jeonju 55069, Republic of Korea
*
Authors to whom correspondence should be addressed.
These authors contributed equally to this work.
Technologies 2025, 13(3), 89; https://doi.org/10.3390/technologies13030089
Submission received: 27 December 2024 / Revised: 16 February 2025 / Accepted: 19 February 2025 / Published: 21 February 2025
(This article belongs to the Special Issue Recent Advances in Applied Activated Carbon Research)

Abstract

:
In this study, kenaf-derived activated carbons (AK-AC) was prepared for automobile canisters via chemical stabilization and physical activation methods. The thermogravimetric analysis and differential thermogravimetry revealed a crystallite change in the kenaf with chemical stabilization. The AK-AC texture properties were studied using the Brunauer–Emmett–Teller, Dubinin–Radushkevitch, and non-local density functional theory equations, with N2/77K isotherm adsorption–desorption curves. The AK-AC nanocrystallite characteristics were observed through X-ray diffraction and Raman spectroscopy. The AK-AC butane adsorption characteristics were analyzed via breakthrough curves and compared with those of commercial coconut-derived activated carbon (Coconut AC). As the activation time increased, the specific surface area and mesopore volume ratio of the AK-AC increased to 1080–1940 m2/g and 10.6–50.0%, respectively. The AK-AC also exhibited better mesoporous pore characteristics than the Coconut AC. The AK-AC butane adsorption capacity increased from 0.31 to 0.79 g/g. In particular, the AK-AC had an approximately 50% improved butane adsorption capacity compared to the Coconut AC. In addition, the butane adsorption characteristics of the AK-AC were determined using the mesopore volume, with a diameter of 3.0–4.0 nm. The results suggest that AK-AC may be proposed as an adsorbent to improve evaporative emissions from automotive canisters in the future.

1. Introduction

The past few decades have witnessed severe air pollution stemming from rapid economic growth and increased fossil fuel consumption [1,2,3]. In urban areas, particularly, internal combustion engine vehicles account for approximately two-thirds of air pollution [4]. The emissions from internal combustion engine vehicles are classified as (1) exhaust gas resulting from fuel combustion in engines, producing COX, NOX, and SOX; and (2) evaporative gas resulting from fuel evaporation from fuel tanks, primarily consisting of hydrocarbons (HCs) [5,6].
Exhaust gas, which is produced during power generation in internal combustion engine vehicles, can be reduced through various methods, including selective catalyst reduction, exhaust gas recirculation, and diesel particulate filter [7,8]. Conversely, evaporative gas, which primarily emanates from vehicle fuel tanks during stationary periods (parking or refueling), can only be reduced through adsorption reactions using activated carbons (AC) in canisters [9,10,11]. Therefore, these canisters have become a critical component of evaporative emission control systems. During stationary conditions, the AC in canisters captures the evaporative gas from fuel tanks. During subsequent driving conditions, the adsorbed gas is desorbed into the engine’s air intake, where it undergoes combustion, thereby reducing evaporative emissions [12]. Therefore, the performance of a canister fundamentally depends on the pore characteristics of the AC within it. The environmental regulations for vehicle emissions have become increasingly stringent, with evaporative gas (HC) limits decreasing from 500 mg/test (LEV-II) to 300 mg/test (LEV-III) [13,14]. In other words, to meet these stringent standards, AC with enhanced butane capacity is required.
Generally, the pore characteristics of AC are determined by the precursor and the activation method [15]. Traditionally, the AC for canisters has been manufactured using wood precursors through chemical activation to achieve a high specific surface area and a high mesopore ratio [16,17]. Wood has a naturally porous structure composed of vascular bundles and cell walls, making it advantageous for producing AC with a high mesopore ratio. Additionally, chemical activation using phosphoric acid partially removes cellulose and lignin from the wood, and the decomposition of phosphorus compounds leads to the expansion of the crystalline structure, further promoting mesopore development [18]. However, although the demand for AC continues to increase, wood is also widely used in various industries, such as pulp, furniture, and construction. Therefore, it is necessary to find alternative precursors to replace wood. Among biomass precursors, kenaf has been identified as a highly suitable precursor for AC production due to its high cellulose content and fixed carbon [19]. In particular, several advantages have been attributed to kenaf, including a fast growth rate, high yield per unit area, the potential for biannual harvesting, and a reduction in air pollution due to its high CO2 absorption capacity [20]. In addition, unlike other biomass precursors, kenaf has been confirmed to be less affected by climate change, ensuring a stable supply. In our previous study, the AC prepared by the chemical activation method used (phosphoric acid activation) was confirmed to have a specific surface area of 1810 m2/g and a mesopore volume of 1.63 cm3/g. Additionally, the produced kenaf-derived AC exhibited a 5% improvement in its butane adsorption capacity compared to commercial AC [16], confirming that kenaf has sufficient potential as an alternative precursor to wood for canister-grade AC.
However, although chemical activation using phosphoric acid is an effective method for producing mesoporous carbon, it still presents several challenges, including high treatment costs, significant wastewater generation, the need for additional post-treatment (such as washing), and the risk of equipment corrosion due to the use of chemical activators. In contrast, physical activation using steam or CO2 offers advantages in terms of cost efficiency and environmental impact. However, due to the physical activation mechanism, where the micropores develop first and the mesopores form later, achieving mesoporous carbons through this method results in low yields, making the process highly uneconomical. Therefore, to produce AC for canisters, it is essential to develop a new activation process that can serve as an alternative to conventional chemical and physical activation methods.
This research aimed to produce canister-grade AC via the physical activation method. Kenaf was utilized as the primary precursor material, and a chemical stabilization process was used to establish to the crystallite structure of the isotropic carbon material. The stabilized kenaf was then manufactured into AC through the steam activation method, with careful control of the activation process (activation time) to achieve the desired pore characteristics. The analysis of the pore development behavior of the kenaf-derived activated carbons (AK-AC) focused on examining the changes in both the crystallite structure and textural properties. In addition, the butane adsorption characteristics of the AK-AC were analyzed by comparing their breakthrough curves with those of commercial coconut shell-derived activated carbons (Coconut AC).

2. Materials and Methods

2.1. Materials

Kenaf was obtained from Jeonbuk Agricultural Research & Extension Services (Iksan-sim Jeonbuk-do, Republic of Korea). It was crushed into 2 × 3 cm size and dried in an oven at 80 °C for 24 h. For kenaf stabilization, diammonium hydrogen phosphate ((NH4)2HPO4) was sourced from Daejung Chemical & Metals Co., Siheung, Republic of Korea. Also, commercial Coconut AC was purchased from Haycarb PLC (Badalgama, Sri Lanka) and used in this study.

2.2. Chemical Stabilization

Kenaf was stabilized using diammonium hydrogen phosphate. A 10 g sample of kenaf underwent impregnation in 100 mL of diammonium hydrogen phosphate solution (4 M), followed by stabilization at 100–300 °C for 24 h. Subsequently, the stabilized kenaf was washed with distilled water at 100 °C until pH 7 was achieved, followed by drying in an oven at 100 °C for 24 h.

2.3. Steam Activation

Three grams of stabilized kenaf samples were placed in alumina boats and activated using a custom-designed cylindrical tubular furnace (SiC heater: 120 × 670 mm). The stabilized kenaf was heated to an activation temperature of 900 °C at a rate of 10 °C/min under nitrogen atmosphere (N2, 99.999%). Upon reaching the activation temperature, the nitrogen atmosphere was replaced by steam flow at 0.5 mL/min for 10–100 min (activation period).
The AC samples were named K-AP-20-H-9-1 to K-AP-20-H-9-10, denoting kenaf stabilization agent (AP: diammonium hydrogen phosphate), stabilization temperature, activation agent (H:H2O), activation temperature, and activation time. A comparative analysis of the activated carbon manufactured by chemical stabilization (AK-AC, A: diammonium hydrogen phosphate) and activated carbon manufactured by carbonization (CK-AC, C: carbonization) was conducted.

2.4. Characterization

Thermal property analysis of kenaf under stabilization conditions (stabilization temperature) employed thermogravimetric analysis (TGA, TA instrument, TGA550, New Castle, DE, USA). The analysis utilized 8 mg samples in alumina boats, with measurements conducted from 25 to 800 °C at a rate of 10 °C/min under nitrogen atmosphere (N2, 99.999%).
Crystallite structure change evaluation of AK-AC involved both X-ray diffraction (XRD, MiniFlex 600, Rigaku, Akishima-shi, Japan) and Raman spectroscopy (HEDA-SERA, NOST, Seongnam, Republic of Korea).
XRD measurements employed CuKα radiation (1.5406 Å) over 10–60° at a rate of 2°/min. Interplanar spacing (d002 and d10l) calculations utilized Bragg’s law (Equation (1)), while crystallite structure dimensions (La and Lc) were determined via the Scherrer equation (Equation (2)) [21].
d   ( Å ) = n λ 2 sin θ
L   ( Å ) = K λ B cos θ
where λ denotes X-ray wavelength, B represents full width at half maximum (FWHM), and K corresponds to lattice constants (0.91 for Lc and 1.84 for La).
Raman spectroscopy analysis employed a 532 nm laser source over 800–2000 cm−1, with the spectra deconvoluted into four peaks (G1, G2, D1, and D2) using Gaussian equations [22].
The morphology of the AK-AC was analyzed by field-emission scanning electron microscopy (FE-SEM, Hitachi SU8600, Hitachi High-Tech Corporation, Toranomon, Japan) under vacuum conditions at a 5 kV acceleration voltage. The biomass precursor (kenaf) was observed at 100 and 500 magnifications, followed by observation of all AK-AC at 1000 and 5000 magnifications.
Pore characteristics measurements utilized an isothermal gas adsorption analyzer (BELSORP-max, MicrotracBEL, Suminoe-ku, Japan) after samples were dried at 300 °C under 0.133 Pa for 12 h. The analysis involved the Brunauer–Emmett–Teller (BET) equation for specific surface area [23], Dubinin–Radushkevitch (DR) equation for micropore volume [24], and non-local density functional theory (NLDFT) for determining pore size distribution (PSD) [25].
The butane adsorption behavior of the AK-AC in relation to activation time was analyzed through breakthrough experiments utilizing a quadrupole mass spectrometer (Q-mass BELMASS, MicrotracBEL, Suminoe-ku, Japan). The schematic diagram of the breakthrough experiment was shown in Figure 1. Kenaf-derived activated carbon (KAC) was dried at 100 °C for 24 h, after which 1 g was loaded into a quartz reactor with a fixed volume (approximately 8.6 cc). Butane (99.99%) was continuously supplied at 50 mL/min until reaching adsorbent saturation. Subsequently, N2 (99.99%) was introduced at 50 mL/min for 20 min for the desorption of adsorbed butane. Breakthrough time was determined at the point when the butane concentration at the reactor outlet reached 10% of the initial concentration, and the adsorption amount was determined using Equation (3).
A   ( g / g ) = B C D E
where A represents the mass-specific butane adsorption capacity, B denotes the butane flow rate, C denotes the absolute density of butane at 25 °C, D corresponds to the breakthrough time, and E signifies the mass of AC.

3. Results and Discussion

3.1. Thermogravimetric Analysis

TGA is an effective method for examining the thermal decomposition behavior of materials during temperature elevation. Differential thermogravimetry (DTG), derived from TGA curve differentiation, enables a more precise analysis of material mass changes that are difficult to detect by a TGA analysis through differential curve variations. For this investigation, both TGA and DTG analyses were employed to examine the thermal decomposition behavior of kenaf under various stabilization conditions. Figure 2a,b present the TGA and DTG curves of kenaf, respectively, according to the stabilization conditions. Furthermore, Table 1 presents the stabilization, carbonization, and total (stabilization yield × carbonization yield) yields of kenaf calculated from Figure 2.
Based on the mass reduction rate changes with an increase in temperature, the thermal decomposition behavior of the stabilized kenaf, as shown in Figure 2, was analyzed for two distinct phases at 400 °C. Step I (T < 400 °C) corresponds to the mass reduction due to the thermal decomposition of the crystallite components (cellulose, hemicellulose, and lignin) of the kenaf. Figure 2b reveals a decreasing DTG peak area and intensity with an increasing chemical stabilization temperature. Notably, the DTG peak becomes undetectable at stabilization temperatures above 200 °C. In addition, Table 1 indicates a steady decrease in the stabilization yield of the kenaf, from 93.3% to 43.1%, with an increasing stabilization temperature. Biomass materials such as kenaf contain cellulose, hemicellulose, and lignin, which undergo thermal decomposition at 240–350, 200–260, and 280–500 °C, respectively [26,27]. Phosphorous compounds induce crystallite decomposition and crosslinking reactions in biomass materials such as kenaf, with their crosslinking density increasing at higher stabilization temperatures [16,28]. These results suggest that some of the cellulose, hemicellulose, and lignin that make up kenaf are decomposed during chemical stabilization processes, and some are transformed into a crystallite structure that is not pyrolysis through crosslinking reactions.
(NH4)2HPO4 ⇌ 2NH4++ HPO42−,
HPO42− + H2O ⇌ H2PO4 + OH or HPO42− ⇌ PO43− + H+,
Step II (T > 400 °C) represents the carbonization phase of the kenaf crystallite. Figure 2b demonstrates the increasing DTG peak intensity and area with a rising stabilization temperature. In addition, Table 1 shows that the carbonization yield of the kenaf increased from 17.6% to 56.3% as the stabilization temperature increased. Upon dissolution, the diammonium hydrogen phosphate used in this study dissociated into 2NH4+ and HPO42− (Equation (4)), with the HPO42− partially converted into H2PO4 in water (Equation (5)) [29]. The resulting H2PO4 interacted with the OH groups in the OH cellulose crystallite, leading to cellulose crosslinking through dehydration reactions [30,31]. As previously mentioned, the crosslinking reaction rate intensified with higher stabilization temperatures. The cellulose component of the kenaf crystallite underwent crosslinking, through the H2PO4 formed as a result of the diammonium hydrogen phosphate dissociation, and the accelerated crosslinking rates can be attributed to the elevated stabilization temperatures. In other words, the crystallite structure of the kenaf, which was changed through the crosslinking reaction in step 1, was carbonized as the temperature increased, and it is concluded that the crosslinking density of the kenaf increased as the stabilization temperature increased, resulting in an increase in the carbonization yield. In addition, since phosphate linkages formed in the kenaf crystallite that decomposed above 450 °C, the chemically stabilized DTG peak intensity and area of the kenaf increased with the stabilization temperature.
Consequently, both the decomposition rate and crosslinking density of the kenaf increased with the stabilization temperature. Among the chemically stabilized kenaf samples, K-AP-20 demonstrated a superior total yield (stabilization yield × carbonization yield). Therefore, K-AP-20 was selected as the optimal stabilization process for producing butane adsorption AC for enhanced economic efficiency.

3.2. X-Ray Diffraction Analysis

An XRD analysis serves as an effective method for examining crystallite structure changes in isotropic carbon materials. In this study, XRD techniques were employed to evaluate the crystallite structure changes in the AK-AC as a function of activation time.
Figure 3a,b present the XRD patterns for the chemically stabilized kenaf and the change in the AK-AC XRD patterns during the activation process. In Figure 3a, the XRD pattern of the as-received specimen exhibits typical cellulose XRD pattern features (cellulose (110) and (200) peaks). In contrast, the K-AP-20 displays a distinctly broad C(002) peak at a diffraction angle of approximately 23°, deviating from the biomass XRD patterns. In Section 3.1, the TGA analysis confirmed that the crystallite structure of kenaf undergoes both decomposition and crosslinking reactions during chemical stabilization. This process appears to transform the crystallite structure of kenaf from its original biomass form into an isotropic carbon material configuration through stabilization reactions (decomposition and crosslinking).
As shown in Figure 3b, all the AK-AC samples exhibit XRD patterns characteristic of an isotropic carbon material, exhibiting both C(002) and C(101) peaks. These patterns demonstrate a decreasing intensity with an extended activation time. This indicates ongoing oxidation reactions in the crystallite structure throughout the activation period, thus explaining the progressive decrease in the XRD pattern intensity. In addition, the AK-AC reveals a shift in the C(002) peak diffraction angle, from 23.2° to 21.9°, as the activation time increases. Previous TGA analyses have reported that phosphate linkages formed during the chemical stabilization of kenaf decompose above 450 °C [16,29]. In other words, the AK-AC is considered to have the weak bond energy of a crystal structure. Consequently, as the activation time increases, these weakly bound crystallite edges undergo continuous oxidation by the physical activating agent (H2O), leading to increased interplanar spacing and a reduced C(002) peak central diffraction angle. Notably, all the AK-AC samples show exclusively isotropic carbon material XRD patterns, indicating an ash content below 1% for all the samples.
Figure 4a,b illustrate the evolution of the structural parameters (Lc: crystal height; La: crystal size) and interplanar distance (d002, d10l) in the AK-AC, respectively, with respect to the activation time. The graphitic crystal structure exhibits strong hybridized sp2 bonds in the C(002) plane, whereas weak π bonds characterize the perpendicular direction. Physical activation mechanisms create pores through the oxidation of both the amorphous regions and crystallite edges in isotropic carbon materials [15,18]. Given that the AK-AC underwent steam activation, oxidation reactions occurred predominantly in the amorphous regions and crystallite edges, leading to more pronounced changes in d002 relative to d10l.
Figure 4a reveals that during the first 60 min, the AK-AC exhibited increases in the Lc and La of 9.87–11.33 and 31.90–43.02 Å, respectively. However, beyond 60 min, these values decreased to 10.28 and 33.80 Å, respectively. An XRD analysis provides statistical data for the crystallite structure changes in porous carbon materials. As previously noted, physical activation induces oxidation reactions in the amorphous regions and crystallite edges [15,18]. The observed increases in the Lc and La reflect relative increases due to the amorphous region’s oxidation rather than crystallite growth, whereas the La reduction indicates a crystallite size decrease due to the crystallite edge oxidation. This suggests that the AK-AC predominantly underwent oxidation in the amorphous regions during the first 40 min, followed by crystallite edge oxidation, causing the La to decrease with extended activation time.
Figure 4b demonstrates that the d002 of the AK-AC increased from 3.84 to 3.94 Å during the first 80 min and then decreased to 3.82 Å over time, whereas d10l remained relatively stable throughout. As shown in Figure 3a, the kenaf precursor underwent crystallite reorganization during chemical stabilization. The phosphate linkages formed during this process decomposed during carbonization. The chemical stabilization process likely induced the formation of the AK-AC’s crystallite edge, characterized by weak bond energy due to the low crosslinking density. Notably, the expanded crystallite, resulting from the phosphate linkage decomposition, enhanced the activating agent’s (H2O) penetration, promoting the oxidation of the amorphous regions and the weakly bound crystallite edge. This mechanism explains the increasing interplanar distance up to 80 min, followed by a rapid d002 decrease due to the complete oxidation of the mono- or di-layer structures during the extended activation time.

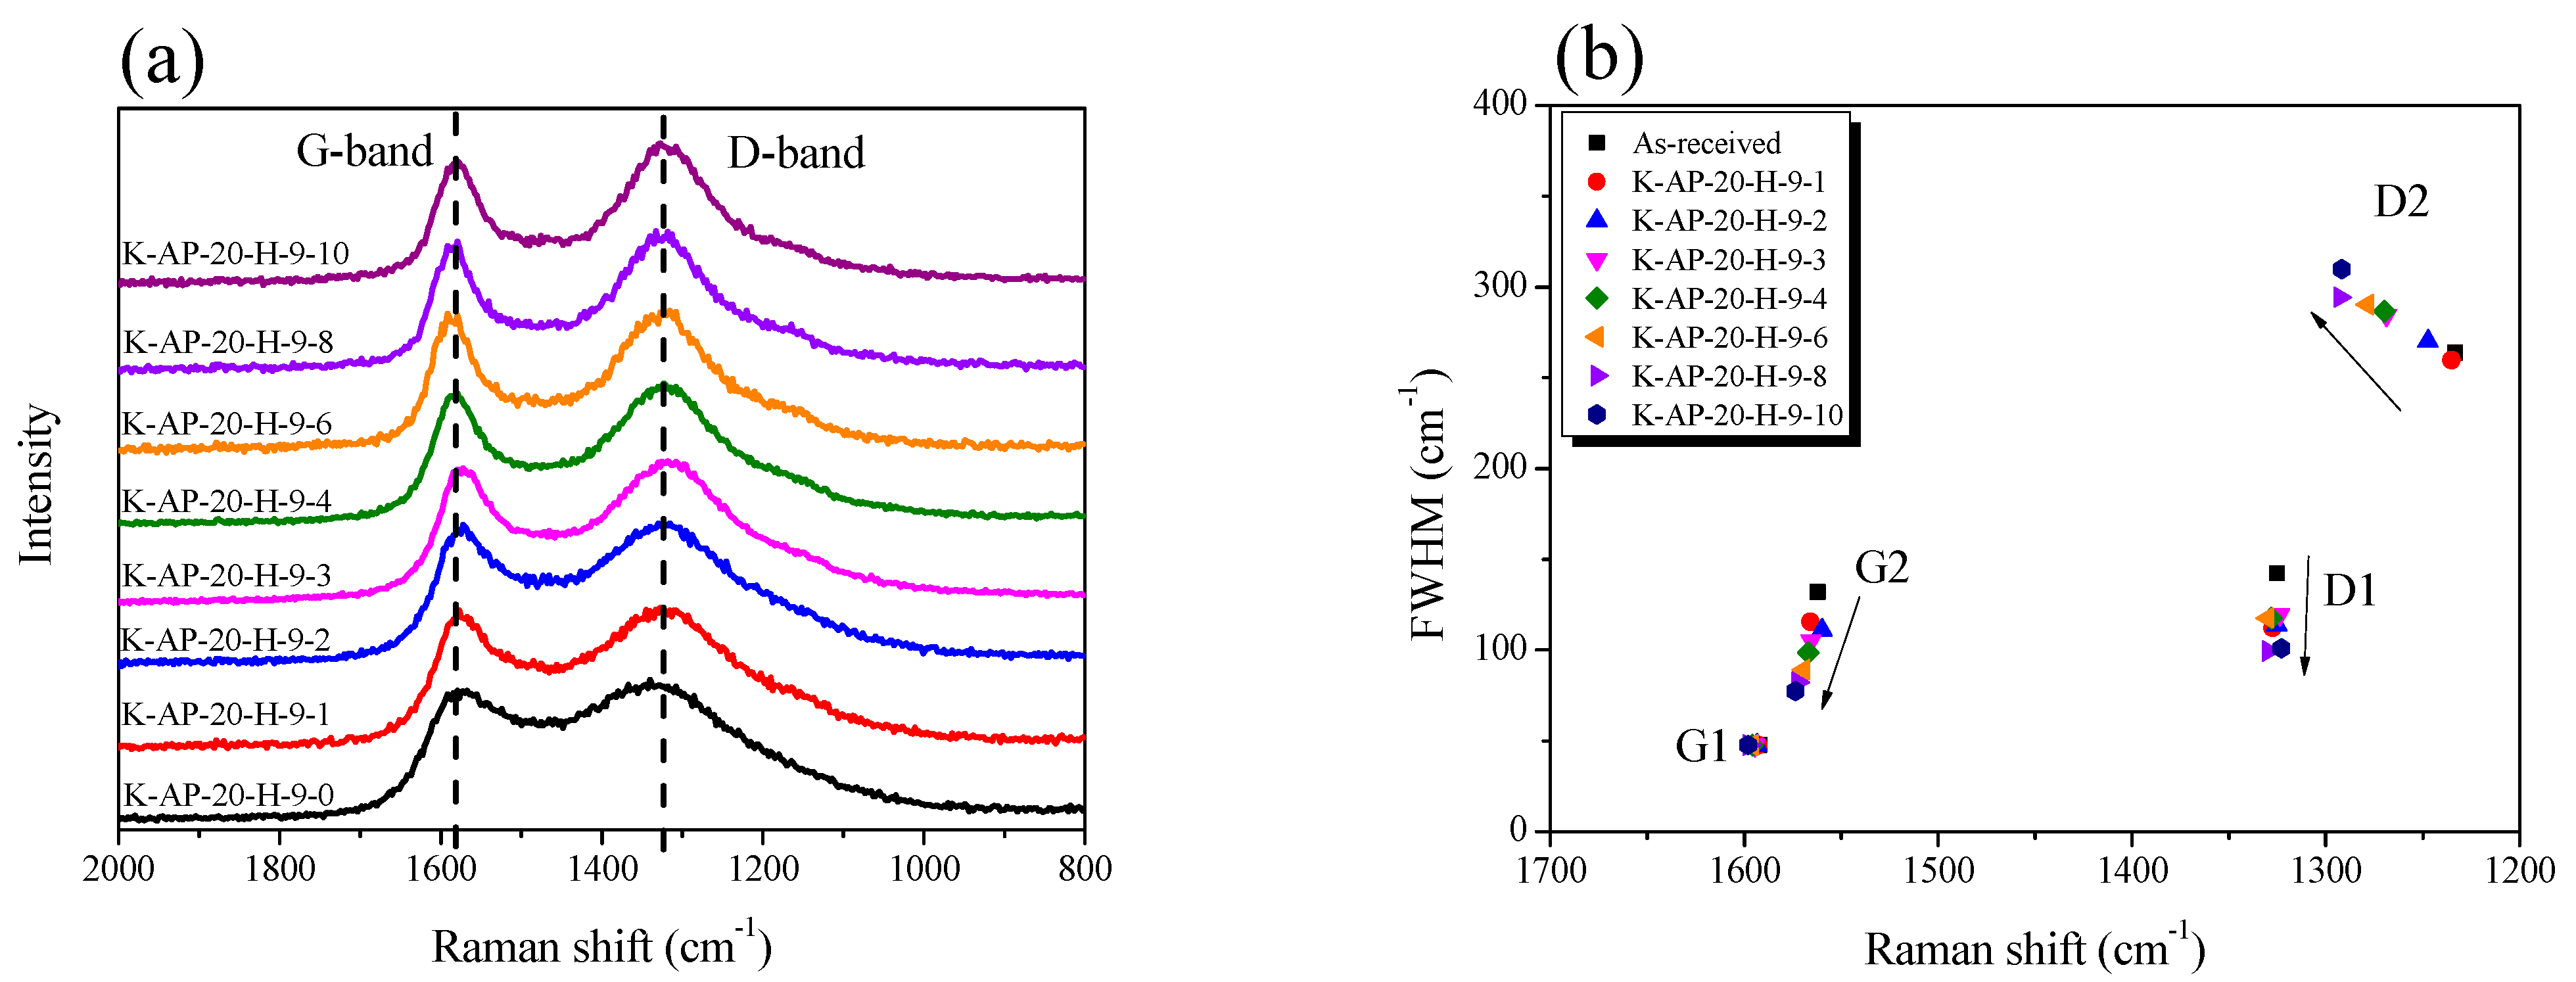
3.3. Raman Spectroscopy Analysis

Together with XRD, Raman spectroscopy serves as a valuable analytical method for examining crystallite changes in porous carbon materials. As opposed to an XRD analysis, Raman spectroscopy is a useful method for analyzing the crystallite changes in carbon materials by providing information regarding the atomic bonding of different aspects of the microstructures of carbon materials. This study employed Raman spectroscopy to conduct a detailed analysis of the AK-AC evolution in terms of its carbon atomic bonding, structural defects, and crystallite changes throughout the activation period. Figure 5a presents the Raman spectra of the AK-AC at various activation times, revealing two characteristic peaks: a G-band at 1580 cm−1 (sp2 hybridized graphitic structure) and D-band at 1360 cm−1 (disordered graphitic lattice) [23]. Furthermore, the valley between these bands exhibits an increasing depth with extended activation time, indicating continuous oxidation reactions in the amorphous region and crystallite structure, which aligns with the XRD results in Section 3.2.
The Raman spectra analysis of the AK-AC employed Gaussian equation fitting for the four peaks (G1, G2, D1, and D2), with Figure 5a illustrating the evolution of the FWHM for each peak during activation. The Raman spectrum components represent distinct structural features: G1 corresponds to sp2 hybridized bonding (C–C bond) in the carbon crystallite basal plane, G2 indicates amorphous carbon and small crystallites, D1 represents crystallite edges, and D2 signifies a disordered graphitic lattice [32]. First, in Figure 5b, the FWHM of G1 shows no significant changes. As mentioned earlier, physical activation occurs through oxidation reactions in the amorphous regions of the porous carbon and at the edges of the crystallite. In addition, it must be taken into consideration that the basal plane of the sp² hybridized bonding (C-C bond) cannot be oxidized by the physical activation method [32]. Therefore, the FWHM and intensity of the G1 peak does not change.
Second, both G2 and D1 show a progressive FWHM decrease during activation, with G2 exhibiting a more pronounced reduction. In the earlier XRD analysis, the oxidation reaction of AC-AC predominantly occurred in the amorphous region, followed by crystallite edge oxidation. The more rapid decrease in the FWHM of G2 compared to that of D1 reflects the faster oxidation rate of the amorphous regions versus the crystallite edges under physical activation conditions. Lastly, in contrast to G2 and D1, D2 displays a distinct peak, showing a continuous FWHM increase with activation time. As shown in Figure 4b, AK-AC exhibits an increased d002 as the crystallite edge with weak bond energy oxidizes. Thus, as shown in Figure 6b, AK-AC exhibits an increasingly disordered graphite lattice due to the oxidation reactions of the crystallite edge with weak bond energy, resulting in an increased D2 peak FWHM with activation time.

3.4. Field-Emission Scanning Electron Microscopy Analysis

FE-SEM is an effective technique for examining the surface morphology of materials. Figure 6 presents the SEM images to compare the AK-AC at various activation times.
As shown in Figure 6, the as-received sample initially displayed a characteristic herbaceous plant structure with a layered bark formation [33,34]. After that, the morphology of the AK-AC changed to a rod shape, and the void number and size increased as the activation time increased. The XRD analysis in Section 3.2 demonstrated the structural transformation of kenaf from typical cellulose crystallinity to an isotropic carbon material after stabilization. Therefore, the kenaf likely underwent a morphological change from a typical herbaceous plant form before stabilization to a rod-like form after stabilization, corresponding to its crystallite changes. Moreover, the voids formed on the AK-AC surface increased in number and size after 40 min. Figure 4a shows that crystallite edge oxidation in the AK-AC was initiated after 40 min. After this point, the progressive oxidation of the crystallite edges appears to have caused an increase in both the quantity and dimensions of the surface voids in the AK-AC.
Consequently, the ammonium phosphate stabilization process induced transformations in the crystallite structure and morphology of the kenaf, followed by the formation of surface voids during activation as the oxidation reactions proceeded in the crosslinked crystallites with weak bond energy.

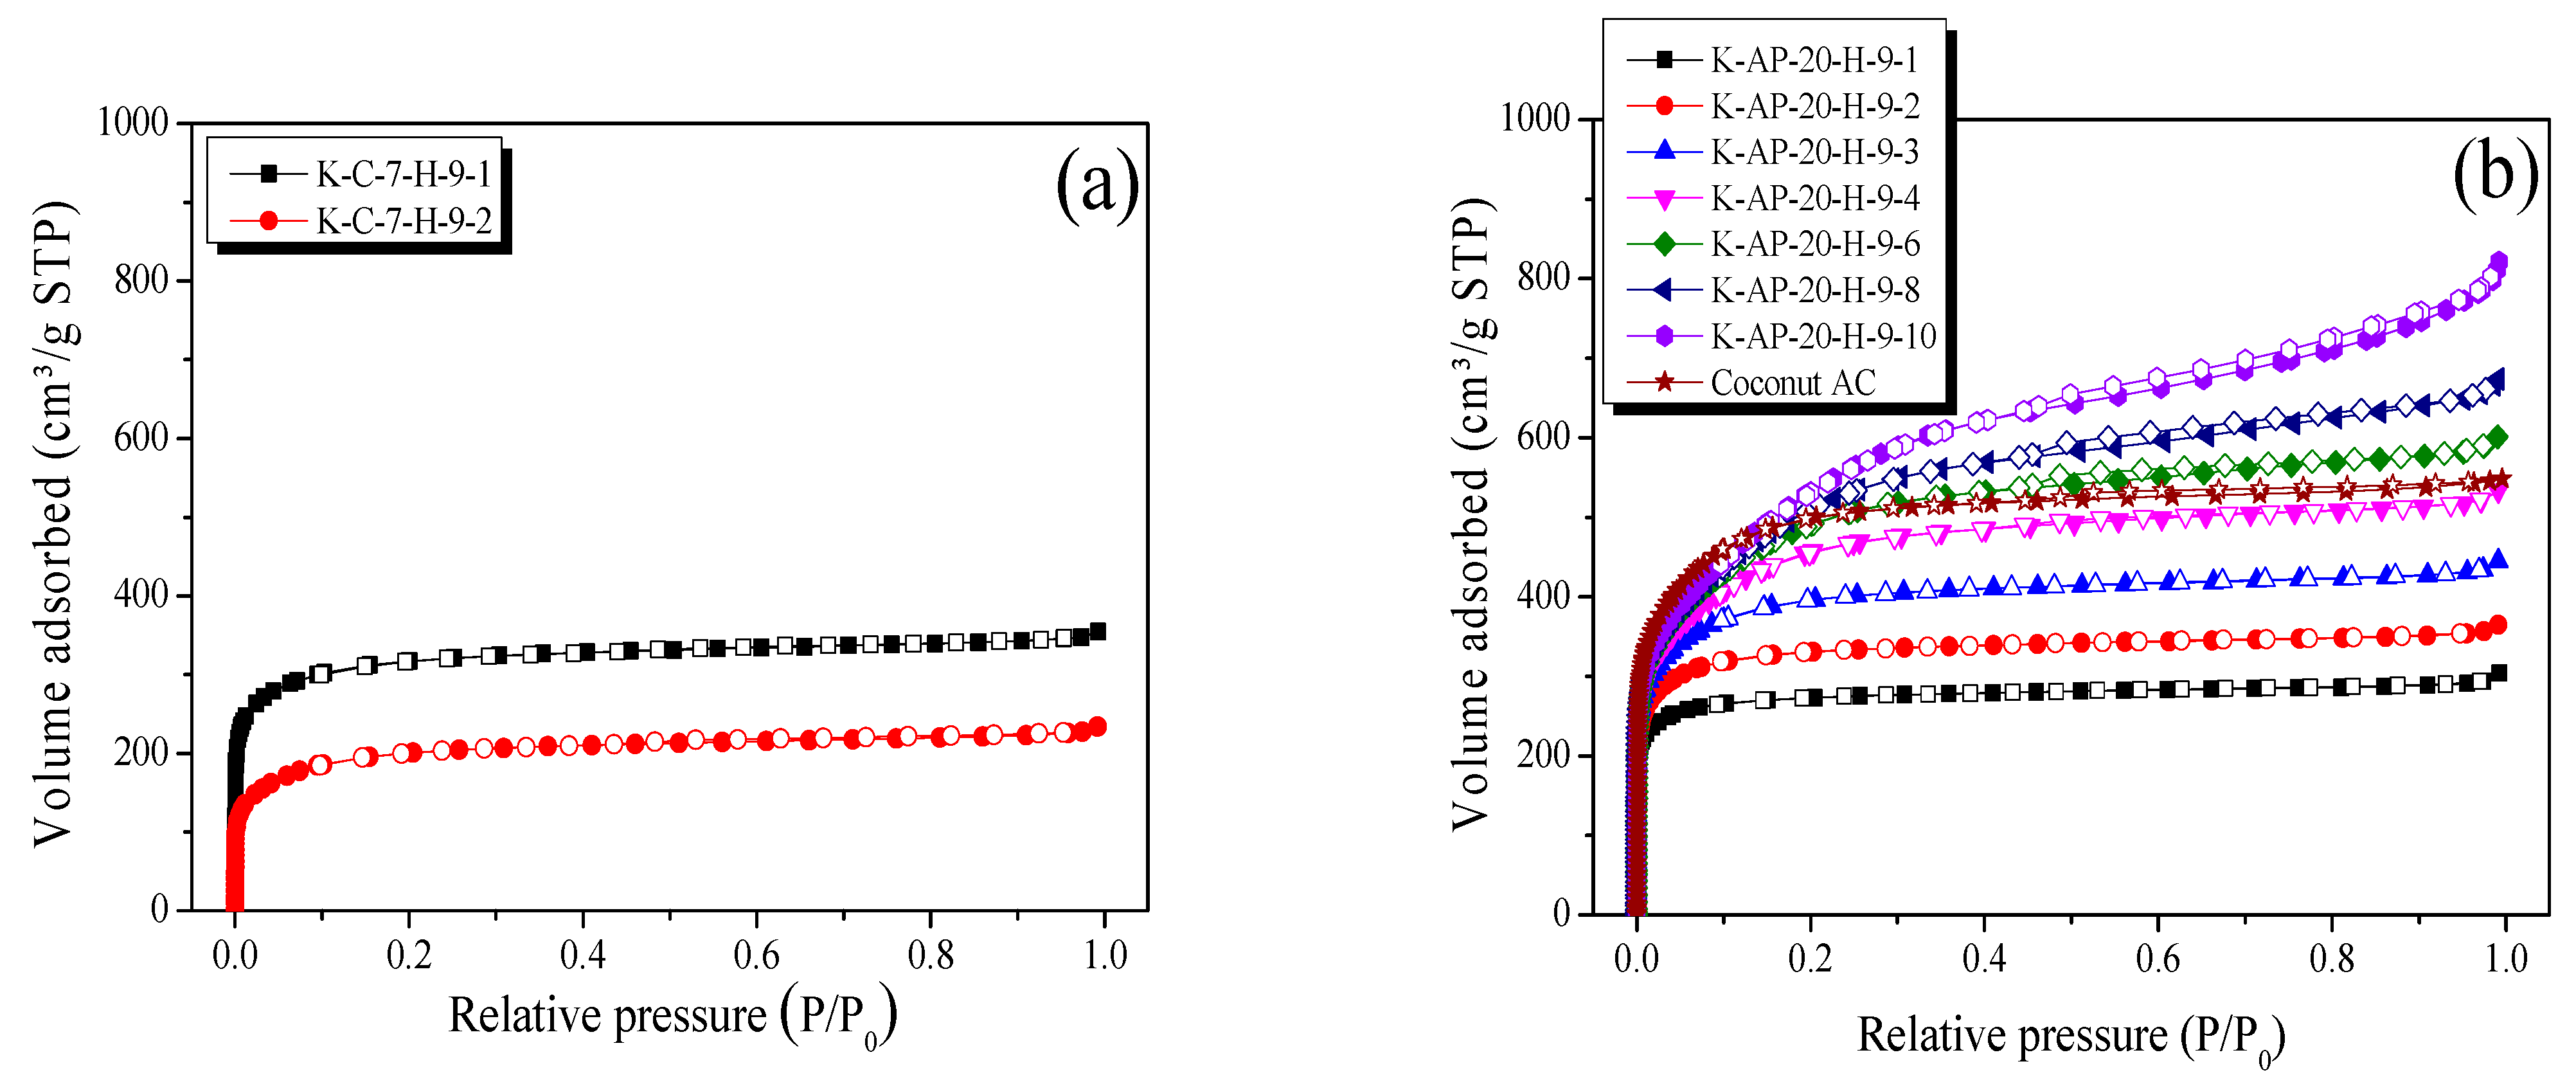
3.5. N2/77K Isotherm Adsorption–Desorption Analysis

An N2/77K isotherm adsorption–desorption analysis is a highly useful analytical method for evaluating the pore characteristics of AC. This study employed N2/77K isotherm adsorption–desorption curves to examine the changes in the pore characteristics of the AK-AC across the activation period. According to the IUPAC standards, these curves can be categorized into eight distinct types, with each curve pattern allowing for the analysis of the AC pore characteristics [35].
Figure 7 illustrates the N2/77K isotherm adsorption–desorption behavior of both the CK-AC and AK-AC in relation to the activation time. Figure 7a reveals that the CK-AC consistently exhibited Type I (a) behavior, as defined by the International Union of Pure and Applied Chemistry (IUPAC) standards, independent of the activation period. In particular, the nitrogen adsorption amount of the CK-AC decreased as the activation time increased. Type I (a) adsorption–desorption curves manifest when mono-layer adsorption takes place through strong Van der Waals force interactions between the pore wall of an AC and an adsorbate (N2), mostly signifying ACs with microporous characteristics. In other words, the specific surface area and pores characteristic of CK-AC did not develop despite an extended activation time, and the CK-AC is considered to have a microporous structure. In contrast, the AK-AC demonstrated three distinct N2/77K isotherm adsorption–desorption patterns across the different activation periods. Initially, the AK-AC exhibited IUPAC Type I (a) characteristics during the first 30 min, transitioned to Type I (b) behavior up through 60 min, and ultimately exhibited Type IV characteristics beyond 60 min. IUPAC Type I (b) patterns indicate that ACs possess a wider range of pore diameters than Type I (a), encompassing both micropores and narrow mesopores [35]. IUPAC Type IV patterns can be observed in ACs with well-developed mesoporous structures [35]. These observations indicate that the AK-AC differed from the CK-AC and underwent progressive mesopore development, with the pore characteristics transitioning from microporous to micro-mesoporous to mesoporous as the activation time increased. The N2/77K isotherm adsorption–desorption analysis of the Coconut AC revealed IUPAC Type I (b) patterns. Therefore, the Coconut AC is considered to have micropores and narrow mesopores.
The hysteresis phenomenon in N2/77K isotherm adsorption-desorption curves encompasses six distinct types under the IUPAC classification, with the pore morphology of each AC being differentiated based on the hysteresis loop shape [35]. Hysteresis is known to occur due to capillary condensation at pressures below saturation pressure after single- or multi-layer adsorption by mesopore walls [35]. Figure 7a reveals that the CK-AC exhibited minimal hysteresis with regard to the activation duration. In a previous study on the crystallite changes in kenaf during chemical stabilization, crystallite transformation from a cellulose crystallite to an isotropic carbon material crystallite structure was demonstrated. The CK-AC developed wedge-shaped pores in its cellulose structure without structural transformation, and the absence of capillary condensation in these pores explains the lack of hysteresis in its adsorption–desorption curves [35]. In contrast, as shown in Figure 7b, the AK-AC exhibited IUPAC H4-type hysteresis from 40 min, with a progressively increasing hysteresis area over longer activation periods. H4-type hysteresis is typically observed in ACs with slit-shaped pore characteristics [35]. Moreover, Figure 4a shows crystallite edge oxidation after 40 min. Thus, although the AK-AC initially formed wedge-shaped pores due to the amorphous oxidation of the surface during early activation, as the activation time increased, the oxidation reaction of the crystallite proceeded from the exterior to the interior, and the oxidation of the crystallite edges progressed, leading to its transformation into a slit-shaped pore structure. Therefore, K-AP-20-H-9-10, with the longest activation time, is considered to have the largest hysteresis. In addition, the Coconut AC was observed to have IUPAC H4-type hysteresis, as shown in Figure 7b. Therefore, this indicates that the Coconut AC concurrently developed micropores and narrow mesopores with slit-shaped pore characteristics.
Table 2 presents the evolution of the textural properties of the CK-AC and AK-AC across the activation period. Since ACs produced by the physical activation method have a pore development mechanism that is activated through the oxidation reactions of the crystallite structure (amorphous or crystallite edge) via an activating agent (H2O), the crystallite and pore characteristics are closely correlated [15,18]. In addition, previous research has confirmed that pore development behavior in ACs by the physical activation method proceeds through micropore development from amorphous oxidation and mesopore development from crystallite edge oxidation [15]. Therefore, in this study, the textural properties of the AK-AC were analyzed based on the previous analysis of crystallite structure changes as a function of the activation time. According to Table 2, both materials exhibited declining activation yields, 34.7% to 4.3% for the CK-AC and 27.7% to 3.0% for the AK-AC, with an extended activation time and through ongoing crystallite structure oxidation. The CK-AC exhibited a decrease in the specific surface area and mesopore volume, from 1200 to 760 m2/g and 0.08 to 0.07 cm3/g, respectively. Note that the pore characteristics of K-C-H-9-3 could not be analyzed due to the complete oxidation of the carbon crystallite that left only ash residue. Conversely, compared to the CK-AC, the AK-AC demonstrated superior pore characteristics, achieving specific surface area and mesopore volume increases, from 1080 to 1940 m2/g and 0.05 to 0.63 cm3/g, respectively. In particular, K-AP-20-H-9-6, K-AP-20-H-9-8, and K-AP-20-H-9-10 surpassed the commercial Coconut AC in both specific surface area and mesopore ratio. As evidenced by Figure 3a, the kenaf underwent a structural transformation from cellulose to an isotropic carbon material during stabilization. Previous research has reported that biomass-derived AC produced without a stabilization process underwent activation reactions primarily at the crystallite edges, resulting in no micropore development, even with an increased activation time [36]. Therefore, in this study, since the CK-AC was produced through a physical activation process without any particular stabilization, the activation reactions occurred primarily at the crystallite edges, resulting in no development of a specific surface area, despite the increased activation time. In contrast to the CK-AC, the AK-AC underwent crystallite decomposition, dehydration, and crosslinking reactions through a chemical stabilization process, leading to crystallite establishment. Although derived from the same precursor as the CK-AC, the AK-AC developed distinct pore characteristics due to different chemical stabilization processes. Therefore, the pore development behavior of the AK-AC was divided into two stages based on the crystallite structure oxidation reactions. First, the initial activation reaction (initial 30 min) showed oxidation predominantly in the amorphous regions (Figure 4a). Subsequently, during the later activation reaction (after 40 min), the AK-AC exhibited oxidation reactions predominantly at the crystallite edges (Figure 4a). Therefore, the AK-AC underwent amorphous oxidation in the first 30 min of the activation period, resulting in a significant increase in the micropore volume, from 0.42 to 0.58 cm3/g. In addition, after 40 min, the AK-AC exhibited a greater increase in mesopore volume (0.24 to 0.63 cm3/g) compared to its micropore volume (0.58 to 0.63 cm3/g), due to the crystallite edge oxidation reactions.
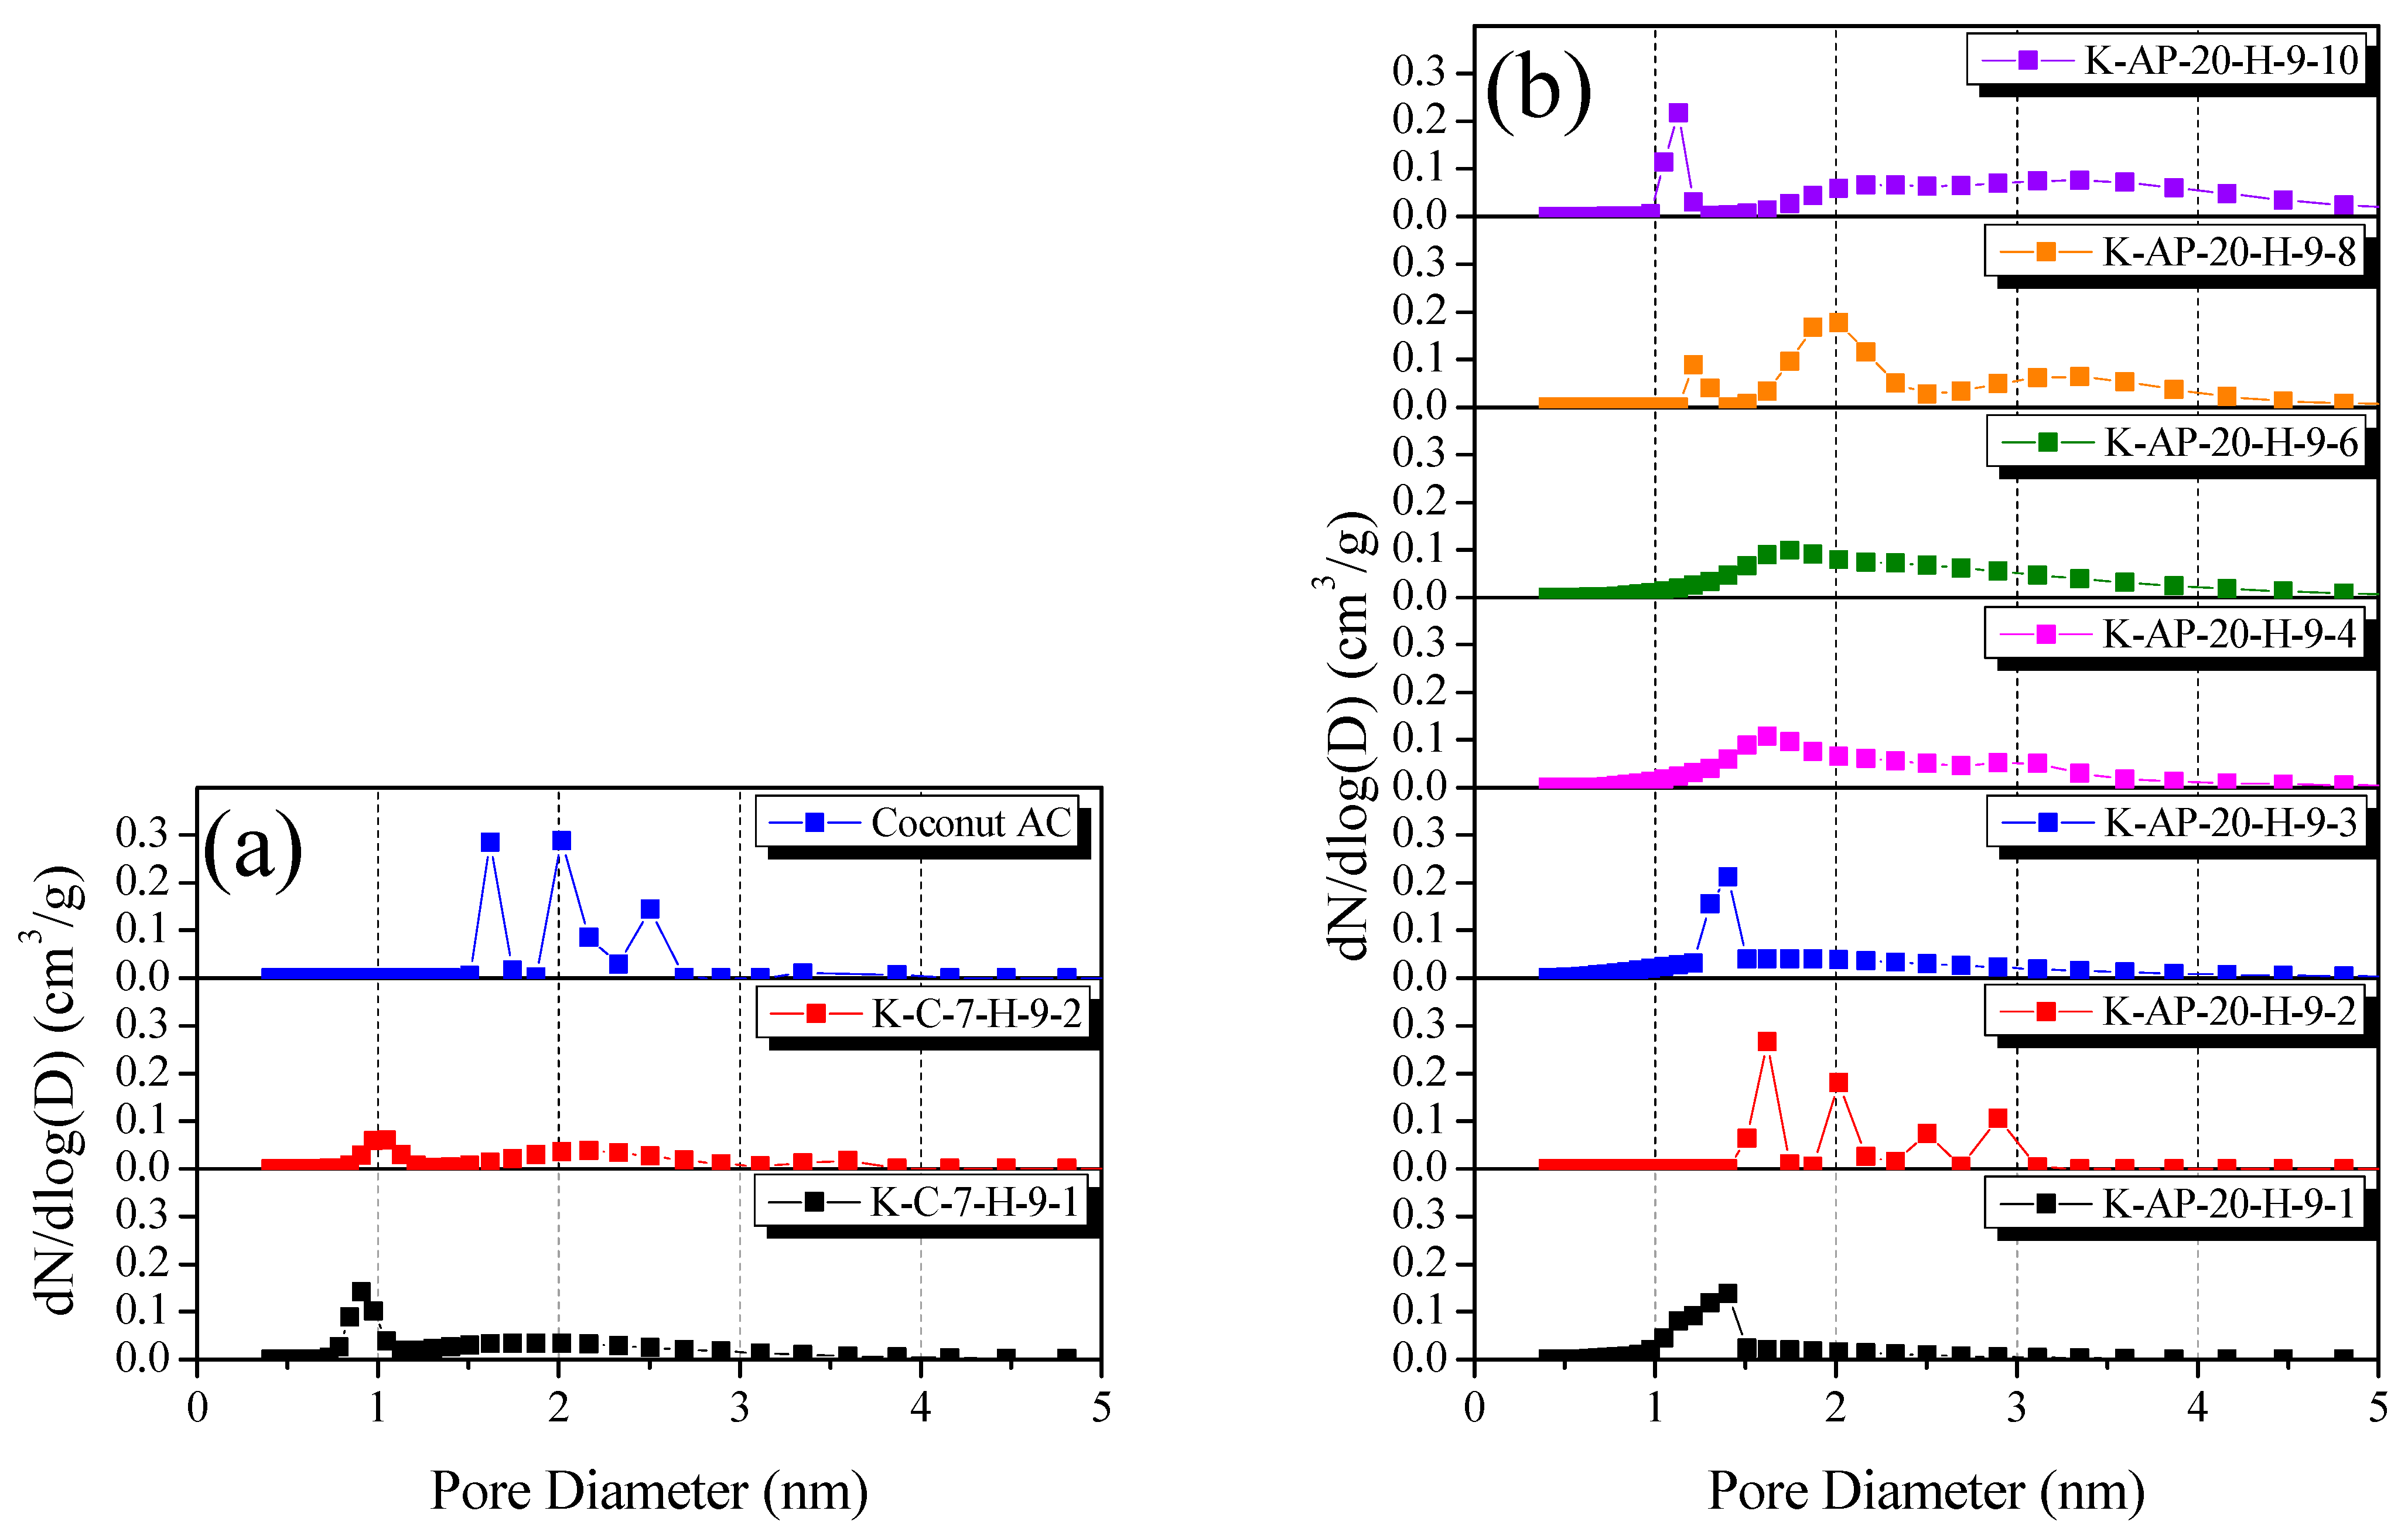
The NLDFT method provides the most effective approach for analyzing AC PSD. Figure 8 illustrates the PSD curves for the CK-AC and AK-AC as a function of the activation time. The PSD curves exhibit distinct patterns corresponding to the changes in the texture properties. Figure 8a reveals that all the CK-AC samples developed both micropores (less than 2 nm in diameter) and mesopores (less than 3 nm in diameter). The physical activation method generates pore development through two distinct mechanisms: pore deepening (maintaining pore diameter) and pore drilling (expanding pore diameter) [37]. As previously noted, Table 2 reveals that the crystallite of the CK-AC, derived from cellulose, underwent oxidation primarily at the crystallite edges, limiting the specific surface area development. Consequently, since the CK-AC developed pores through pore drilling due to the oxidation reaction of the crystallite edges, we determined that not only micropores but also mesopores developed for all activation times.
The AK-AC demonstrated distinct PSD curve evolution patterns. The initial activation phase (up to 30 min) produced sharp PSD curves characterized by micropores less than 2 nm in diameter. The subsequent activation phase (beyond 40 min) revealed the development of both micropores (less than 2 nm in diameter) and mesopores (exceeding 2 nm in diameter), with the PSD curves showing a significantly broader distribution than those of K-AP-20-H-9-1, K-AP-20-H-9-2, and K-AP-20-H-9-3. As evidenced by Figure 4a, after 40 min of activation time, the crystallite oxidation reaction of the AK-AC was dominant at the crystallite edge. This indicates that although during early activation micropores developed through amorphous oxidation-induced pore deepening, from 40 min, mesopore development occurred through pore drilling by the crystallite edge oxidation reactions, resulting in broadened PSD curves. Figure 8b reveals, from its PSD curves, that the Coconut AC developed micropores ranging from 1.5 to 2 nm and mesopores from 2 to 2.5 nm. According to Table 2, although the Coconut AC achieved a comparable specific surface area (1820 m2/g) to that of K-AP-20-H-9-6, it exhibited a lower mesopore volume ratio. Furthermore, although both materials utilized biomass precursors, the AK-AC underwent chemical stabilization processing, distinguishing it from the Coconut AC. Thus, the crystallite structure differences between the AK-AC (chemically stabilized kenaf) and Coconut AC (coconut shell) precursors caused the Coconut AC to exhibit a different PSD than that of K-AP-20-H-9-6, despite having similar specific surface areas. Consequently, the utilization of diammonium hydrogen phosphate is considered highly effective for the chemical stabilization process to develop specific surface area and mesopore volume in ACs.

3.6. Butane Breakthrough Analysis

The breakthrough curve technique is commonly utilized to evaluate the harmful gas adsorption characteristics of porous carbon. In this study, breakthrough curves were employed to evaluate the butane adsorption characteristics of the AC. The breakthrough point of the breakthrough curve was set at C/C0 = 0.1.
Figure 9a illustrates the adsorption and desorption behavior of butane (99.999%) for both the AK-AC and Coconut AC. Figure 9b provides a magnified view of the breakthrough points on the breakthrough curves. The complete breakthrough curve results are summarized in Table 3.
The analysis of Figure 9 and Table 3 reveals an increasing trend in the breakthrough points and butane adsorption capacity in the following order: K-AP-20-H-9-1 (2.66 min, 0.31 g/g) < K-AP-20-H-9-2 (3.58 min, 0.42 g/g) < K-AP-H-20-9-3 (3.80 min, 0.45 g/g) < Coconut AC (4.38 min, 0.52 g/g) < K-AP-20-H-9-4 (4.77 min, 0.56 g/g) < K-AP-20-H-9-6 (5.52 min, 0.65 g/g) < K-AP-20-H-9-8 (6.43 min, 0.76 g/g) < K-AP-20-H-9-10 (6.68 min, 0.79 g/g). For the AK-AC, both the breakthrough point and capacity increase with longer activation times. Conversely, although Table 2 shows that the Coconut AC has a specific surface area (1820 m2/g) similar to that of K-AP-20-H-9-6 (1800 m2/g), it exhibited a lower breakthrough point and capacitance values. In other words, it is concluded that the butane adsorption characteristics of the AC were significantly affected by the pore characteristics rather than the specific surface area.
In previous studies, it has been confirmed that the gas adsorption characteristics of porous carbon are affected by the pore diameter rather than the specific surface area [38,39,40,41,42]. In other words, even if the specific surface area of porous carbon increases, it is difficult to improve its gas adsorption characteristics, but the gas adsorption characteristics of porous carbon improve as the pore volume of the pore diameter that can be involved with the adsorbed gas increases [38,39,40,41,42]. Additionally, our previous research demonstrated that the butane adsorption characteristics of AC are predominantly influenced by the development of mesopores with diameters between 2.8 and 3.8 nm, rather than by the specific surface area [16]. Figure 8 shows that as the activation time increases, the PSD curves of the AK-AC show the progressive development of both the micropores and mesopores. Notably, after 40 min, the AK-AC exhibits a significant development of mesopores, with diameters ranging from 2 to 4 nm. In contrast, the Coconut AC only shows the development of micropores and mesopores with diameters less than 3 nm. As a result, despite having a similar specific surface area to that of K-AP-20-H-9-6, the Coconut AC exhibits a lower breakthrough point and capacitance values, which can be attributed to its underdeveloped PSD in the 2.8–3.8 nm diameter pore range.
In Figure 9, the butane desorption amount of the AK-AC increased with an increased activation time. Previous research has established that the butane desorption characteristics of AC improve with an increasing mesopore volume [16]. Table 2 indicates that the mesopore volume ratio of the AK-AC increased from 10.6% to 50.0% according to the activation time. That is, the butane desorption characteristics of the AK-AC improved due to an increase in the mesopore volume. In particular, K-AP-20-H-9-10 was observed to have a similar butane desorption rate as the Coconut AC due to its having the highest mesopore volume ratio, despite having the highest butane adsorption capacity.
The previous breakthrough curve experiments revealed that the butane adsorption capacity of AC is primarily influenced by the PSD rather than by the specific surface area. Therefore, the correlation coefficient between the butane adsorption capacity and PSD was analyzed. First, in Figure 8, the PSD curves of each activated carbon were divided into 0.5 nm increments over a pore diameter range of 0.0–5.0 nm. The sum of the pore volumes of each activated carbon over the range of pore diameters was then calculated and plotted with the butane adsorption capacity of each activated carbon (X-axis: pore volume according to pore diameter, Y-axis: butane adsorption capacity). Finally, the correlation between the pore volume and butane adsorption capacity as a function of the pore diameter for each calculated activated carbon is shown in Figure 10 [16]. The activated carbons (AK-AC and Coconut AC) demonstrate that the strongest correlation between the PSD and butane adsorption capacity occurs in a pore diameter range of 3.0–4.0 nm, with a correlation coefficient of 0.87. This indicates that the butane adsorption capacity is most significantly influenced by the development of mesopores within this specific diameter range. These findings align with those of the breakthrough curve results, as well as with previous research [16].
In conclusion, the chemical stabilization process employing diammonium hydrogen phosphate successfully established an optimal crystallite in kenaf through decomposition and crosslinking reactions. Thus, kenaf was manufactured into porous carbon for butane adsorption. Notably, the fabricated AC demonstrated superior butane adsorption characteristics, achieving up to a 52% higher butane adsorption capacity than the Coconut AC. Therefore, the results suggest that AK-AC can potentially be utilized in automotive canisters rather than AC manufactured through chemical activation methods in the future.

4. Conclusions

In this study, AK-AC was developed for automobile canister applications through a combination of chemical stabilization and physical activation methods. The crystallite of kenaf was established through chemical stabilization using diammonium hydrogen phosphate, with K-AP-20 selected as the optimal stabilization conditions for canister AC due to its superior total yield (34.9%).
The specific surface area and total pore volume of the AK-AC increased with activation time, from 1080 to 1940 m2/g and 0.47 to 1.26 cm3/g, respectively. Notably, the mesopore volume ratio of the AK-AC increased substantially, from 10.6% to 50.0%, with an extended activation time, indicating a transition from predominantly microporous to mesoporous characteristics.
The butane adsorption capacity of the AK-AC improved from 0.31 to 0.79 g/g with an increasing activation time, with K-AP-20-H-9-10 demonstrating an approximately 50% higher butane adsorption capacity compared to the Coconut AC. Consistent with previous research, this study confirmed that butane adsorption characteristics are primarily influenced by the development of mesopores in the 3.0–4.0 nm pore diameter range, rather than by the specific surface area. In conclusion, an AC was successfully manufactured with superior butane adsorption characteristics through a cost-effective and industrially viable physical activation method. The results demonstrate that this AC has the potential to replace AC manufactured through a chemical activation method for automobile canister applications.

Author Contributions

Conceptualization, H.-M.L. and B.-J.K.; methodology, H.-M.L. and J.-H.K.; software, D.-S.J. and J.-H.K.; validation, D.-S.J., J.-H.K. and H.-M.L.; formal analysis, D.-S.J. and H.-M.L.; investigation, D.-S.J. and J.-H.K.; resources, D.-S.J. and H.-M.L.; data curation, D.-S.J. and J.-H.K.; writing—original draft preparation, D.-S.J. and J.-H.K.; writing—review and editing, D.-S.J., J.-H.K. and H.-M.L.; visualization, D.-S.J.; supervision, H.-M.L. and B.-J.K.; project administration, H.-M.L. and B.-J.K.; funding acquisition, H.-M.L., D.-S.J. and J.-H.K. contributed equally to this work. All authors have read and agreed to the published version of the manuscript.

Funding

This work was supported by the Technology Innovation Program (20013038, Development of nonignition pitch-based porous material technology for high adsorption of evaporative emissions), funded by the Ministry of Trade, Industry and Energy (MOTIE, Republic of Korea); Technology Innovation Program 20016789 (Development of manufacturing and application technology of carbon molecular sieve for high-purity gas separation module); and Regional Innovation Strategy (RIS) through the National Research Foundation of Korea (NRF), funded by the Ministry of Education (MOE) (2023RIS-008).

Institutional Review Board Statement

Not applicable.

Informed Consent Statement

Not applicable.

Data Availability Statement

The data presented in this study are available upon request from the corresponding author.

Conflicts of Interest

The authors declare no conflicts of interest.

References

  1. Kinnon, M.M.; Zhu, S.; Carreras-sospedra, M.; Soukup, J.V.; Dabdub, D.; Samuelsen, G.S.; Brouwer, J. Considering future regional air quality impacts of the transportation sector. Energy Policy 2019, 124, 63–80. [Google Scholar] [CrossRef]
  2. Hanif, I.; Faraz Raza, S.M.; Gago-de-Santos, P.; Abbas, Q. Fossil fuels, foreign direct investment, and economic growth have triggered CO2 emissions in emerging Asian economies: Some empirical evidence. Energy 2019, 171, 493–501. [Google Scholar] [CrossRef]
  3. Atabani, A.E.; Badruddin, I.A.; Mekhilef, S.; Silitonga, A.S. A review on global fuel economy standards, labels and technologies in the transportation sector. Renew. Sustain. Energy Rev. 2011, 15, 4586–4610. [Google Scholar] [CrossRef]
  4. Wang, G.; Cheng, S.; Lang, J.; Li, S.; Tian, L. On-board measurements of gaseous pollutant emission characteristics under real driving conditions from light-duty diesel vehicles in Chinese cities. J. Environ. Sci. 2016, 46, 28–37. [Google Scholar] [CrossRef] [PubMed]
  5. Kim, M.S.; Kim, J.H.; Park, H.S.; Sun, Y.S.; Kim, H.S.; Choi, K.H.; Yi, J. Emission inventory of VOCs from mobile sources in a metropolitan region. Korean J. Chem. Eng. 2006, 23, 919–924. [Google Scholar] [CrossRef]
  6. Guan, B.; Zhan, R.; Lin, H.; Huang, Z. Review of the state-of-the-art of exhaust particulate filter technology in internal combustion engines. J. Environ. Manag. 2015, 154, 225–258. [Google Scholar] [CrossRef] [PubMed]
  7. Bindra, M.; Vashist, D. Particulate Matter and NOx Reduction Techniques for Internal Combustion Engine: A Review. J. Inst. Eng. 2020, 101, 1073–1082. [Google Scholar] [CrossRef]
  8. Yamada, H. Contribution of evaporative emissions from gasoline vehicles toward total VOC emissions in Japan. Sci. Total Environ. 2013, 449, 143–149. [Google Scholar] [CrossRef] [PubMed]
  9. Li, J.; Ge, Y.; Wang, X.; Zhang, M. Evaporative emission characteristics of high-mileage gasoline vehicles. Environ. Pollut. 2022, 303, 119127. [Google Scholar] [CrossRef] [PubMed]
  10. Romagnuolo, L.; Yang, R.; Frosina, E.; Rizzoni, G.; Andreozzi, A.; Senatore, A. Physical modeling of evaporative emission control system in gasoline fueled automobiles: A review. Renew. Sustain. Energy Rev. 2019, 116, 109462. [Google Scholar] [CrossRef]
  11. Reddy, S. Understanding and Designing Automotive Evaporative Emission Control Systems. In 2012 International Powertrains, Fuels & Lubricants Meeting; SAE International: Warrendale, PA, USA, 2012. [Google Scholar]
  12. Itakura, H.; Kato, N.; Kohama, T.; Hyoudou, Y.; Murai, T. Studies on Carbon Canisters to Satisfy LEVII EVAP Regulations. J. Fuels Lubr. 2000, 109, 639–647. [Google Scholar]
  13. California Air Resources Board. Available online: https://ww2.arb.ca.gov/ (accessed on 15 November 2012).
  14. Lee, H.M.; Chung, D.C.; Jung, S.C.; An, K.H.; Park, S.J.; Kim, B.J. A study on pore development mechanism of activated carbons from polymeric precursor: Effects of carbonization temperature and nano crystallite formation. Chem. Eng. J. 2019, 337, 120836. [Google Scholar] [CrossRef]
  15. Lee, B.H.; Lee, H.M.; Chung, D.C.; Kim, B.J. Effect of Mesopore Development on Butane Working Capacity of Biomass-Derived Activated Carbon for Automobile Canister. Nanomaterials 2021, 11, 673. [Google Scholar] [CrossRef]
  16. Anaya, A.J.R.; Molina, A.; Garcia, P.; Colorado, A.A.R.; Salano, A.L.; Lecea, C.S.M.D. Phosphoric acid activation of recalcitrant biomass originated in ethanol production from banana plants. Biomass Bioenergy 2011, 35, 1196–1204. [Google Scholar] [CrossRef]
  17. Baek, J.; Lee, H.M.; Roh, J.S.; Lee, H.S.; Kang, H.S.; Kim, B.J. Studies on preparation and applications of polymeric precursor-based activated hard carbons: I. Activation mechanism and microstructure analyses. Microporous Mesoporous Mater. 2016, 219, 258–264. [Google Scholar] [CrossRef]
  18. Li, W.; Yang, K.; Peng, J.; Zhang, L.; Guo, S.; Xoa, H. Effects of carbonization temperatures on characteristics of porosity in coconut shell chars and activated carbons derived from carbonized coconut shell chars. Ind. Crops Prod. 2008, 28, 190–198. [Google Scholar] [CrossRef]
  19. Bang, J.H.; Lee, B.H.; Choi, Y.C.; Lee, H.M.; Kim, B.J. A Study on Superior Mesoporous Activated Carbons for Ultra Power Density Supercapacitor from Biomass Precursors. Mol. Sci. 2022, 23, 8537. [Google Scholar] [CrossRef] [PubMed]
  20. Saba, N.; Jawaid, M.; Hakeem, K.R.; Paridah, M.T.; Khalina, A.; Alothman, O.Y. Potential of bioenergy production from industrial kenaf (Hibiscus cannabinus L.) based on Malaysian perspective. Renew. Sustain. Energy Rev. 2015, 42, 446–459. [Google Scholar] [CrossRef]
  21. Biscoe, J.; Warren, B.E. An X-Ray Study of Carbon Black. J. Appl. Phys. 1942, 13, 364–371. [Google Scholar] [CrossRef]
  22. Shimodaira, N.; Masui, A. Raman spectroscopic investigations of activated carbon materials. J. Appl. Phys. 2002, 92, 902–909. [Google Scholar] [CrossRef]
  23. Brauneur, S.; Emmett, P.H.; Teller, E. Adsorption of Gases in Multimolecular Layer. J. Am. Chem. Soc. 1938, 60, 309–319. [Google Scholar] [CrossRef]
  24. Dubinin, M.M.; Zaverina, E.D.; Radushkevich, L.V. Sorption and Structure of Active Carbons I. Adsorption of Organic Vapors. Zhurnal Fiz. Khimii 1947, 21, 1351–1362. [Google Scholar]
  25. Hoang, A.T.; Ong, H.C.; Rizwanul Fattah, I.M.; Chong, C.T.; Cheng, C.K.; Sakthivel, R.; Ok, Y.S. Progress on the lignocellulosic biomass pyrolysis for biofuel production toward environmental sustainability. Fuel Process. Technol. 2021, 223, 106997. [Google Scholar] [CrossRef]
  26. Gao, P.; Liu, Z.H.; Xue, G.; Han, B.; Zhou, M.H. Preparation and characterization of activated carbon produced from rice straw by (NH4)2HPO4 activation. Bioresour. Technol. 2011, 102, 3645–3648. [Google Scholar] [CrossRef]
  27. Tsurko, E.N.; Neueder, R.; Barthel, J.; Apelblat, A. Conductivity of Phosphoric Acid, Sodium, Potassium, and Ammonium Phosphates in Dilute Aqueous Solutions from 278.15 K to 308.15 K. J. Solut. Chem. 1999, 28, 973–999. [Google Scholar] [CrossRef]
  28. Noguchi, Y.; Homma, I.; Matsubara, Y. Complete nanofibrillation of cellulose prepared by phosphorylation. Cellulose 2017, 24, 1295–1305. [Google Scholar] [CrossRef]
  29. Rol, F.; Sillard, C.; Bardet, M.; Yarava, J.R.; Emsley, L.; Gablim, C.; Leonard, D.; Belgacem, N.; Bras, J. Cellulose phosphorylation comparison and analysis of phosphorate position on cellulose fibers. Carbohydr. Polym. 2020, 229, 115294. [Google Scholar] [CrossRef] [PubMed]
  30. Jagtoyen, M.; Derbyshire, F. Activated carbons from yellow poplar and white oak by H3PO4 activation. Carbon 1998, 36, 1085–1097. [Google Scholar] [CrossRef]
  31. Jeong, J.S.; Kim, B.J. Preparation of Cellulose-Based Activated Carbon Fibers with Improved Yield and Their Methylene Chloride Adsorption Evaluation. Molecules 2023, 28, 6997. [Google Scholar] [CrossRef] [PubMed]
  32. Kim, J.H.; Kim, Y.J.; Kang, S.C.; Lee, H.M.; Kim, B.J. Preparation and Characterization of Asphalt Pitch-Derived Activated Carbons with Enhanced Electrochemical Performance as EDLC Electrode. Materials 2023, 13, 802. [Google Scholar] [CrossRef]
  33. Zainuddin, S.Y.Z.; Ahmad, I.; Kargarzadeh, H.; Abdullah, I.; Dufresne, A. Potential of using multiscale kenaf fibers as reinforcing filler in cassava starch-kenaf biocomposites. Carbohydr. Polym. 2013, 92, 2299–2305. [Google Scholar] [CrossRef] [PubMed]
  34. Ozturk, I.; Irmak, S.; Hesenov, A.; Erbatur, O. Hydrolysis of kenaf (Hibiscus cannabinus L.) stems by catalytical thermal treatment in subcritical water. Biomass Bioenergy 2010, 34, 1578–1585. [Google Scholar] [CrossRef]
  35. Thommes, M.; Kaneko, K.; Neimark, A.V.; Olivier, J.P.; Rodriguez-Reinoso, F.; Rouquerol, J.; Sing, K.S.W. Physisorption of gases, with special reference to the evaluation of surface area and pore size distribution (IUPAC Technical Report). Pure Appl. Chem. 2015, 87, 1051–1069. [Google Scholar] [CrossRef]
  36. Kim, J.H.; Lee, H.M.; Jung, S.C.; Chung, D.C.; Kim, B.J. Bamboo-Based Mesoporous Activated Carbon for High-Power-Density Electric Double-Layer Capacitors. Nanomaterials 2021, 11, 2750. [Google Scholar] [CrossRef] [PubMed]
  37. Kim, J.H.; Jung, S.C.; Lee, H.M.; Kim, B.J. Comparison of Pore Structures of Cellulose-Based Activated Carbon Fibers and Their Applications for Electrode Materials. Int. J. Mol. Sci. 2022, 23, 3680. [Google Scholar] [CrossRef]
  38. Thommes, M.; Morlay, C.; Ahmad, R.; Joly, J.P. Assessing surface chemistry and pore structure of active carbons by a combination of physisorption (H2O, Ar, N2, CO2), XPS and TPD-MS. Adsorption 2011, 17, 653–661. [Google Scholar] [CrossRef]
  39. Liu, Y.; Wilcox, J. Molecular simulation of CO2 adsorption in micro- and mesoporous carbons with surface heterogeneity. Int. J. Coal Geol. 2012, 104, 83–95. [Google Scholar] [CrossRef]
  40. Billemont, P.; Coasne, B.; Weireld, G.D. Adsorption of Carbon Dioxide, Methane, and Their Mixtures in Porous Carbons: Effect of Surface Chemistry, Water Content, and Pore Disorder. Langmuir 2013, 29, 3328–3338. [Google Scholar] [CrossRef] [PubMed]
  41. Gotzias, A.; Charalambopoulou, G.; Steriotis, T. On the orientation of N2 and CO2 molecules adsorbed in slit pore models with oxidised graphitic surface. Mol. Simul. 2015, 42, 186–195. [Google Scholar] [CrossRef]
  42. Karakas, S.Y.; Aygun, A.; Gunes, M.; Tahtasakal, E. Physical and chemical characteristics of polymer-based spherical activated carbon and its ability to adsorb organics. Carbon 2004, 42, 477–4784. [Google Scholar] [CrossRef]
Figure 1. Schematic of butane adsorption simulation equipment.
Technologies 13 00089 g001
Figure 2. (a) TGA and (b) DTG curves of the stabilized kenaf samples under N2 atmosphere.
Technologies 13 00089 g002
Figure 3. XRD patterns derived as a function of various steam activation conditions: (a) stabilized kenaf and (b) AK-AC.
Technologies 13 00089 g003
Figure 4. Structural characteristics of the AK-AC as a function of various steam activation conditions: (a) structure parameters and (b) interplanar distance.
Technologies 13 00089 g004
Figure 5. (a) Raman spectra of AK-AC as a function of various activation conditions. (b) Band parameters derived from raw spectra decompositions.
Technologies 13 00089 g005
Figure 6. FE-SEM images for (a) as-received sample, (b) K-AP-20-H-9-1, (c) K-AP-20-H-9-2, (d) K-AP-20-H-9-3, (e) K-AP-20-H-9-4, (f) K-AP-20-H-9-6, (g) K-AP-20-H-9-8, and (h) K-AP-20-H-9-10.
Technologies 13 00089 g006
Figure 7. N2/77K isotherm adsorption/desorption curves of the AK-AC as a function of various activation conditions: (a) CK-AC and (b) AK-AC.
Technologies 13 00089 g007
Figure 8. PSD as a function of various steam activation conditions by the NLDFT method: (a) CK-AC and (b) AK-AC.
Technologies 13 00089 g008
Figure 9. Breakthrough curves of the AK-AC as a function of various activation conditions: (a) breakthrough curve and (b) breakthrough point.
Technologies 13 00089 g009
Figure 10. Correlation between the butane capacity and pore volume of the AK-AC.
Technologies 13 00089 g010
Table 1. Yield values of kenaf according to stabilization conditions.
SampleStabilization Yield
(%)
Carbonization Yield a (%)Total Yield
(%)
As received-17.617.6
K-AP-1093.325.924.1
K-AP-1584.536.030.4
K-AP-2067.251.934.9
K-AP-2553.055.929.6
K-AP-3043.156.324.2
a Carbonization Yield: yield at temperature of 800 °C; W e i g h t   o f   r e d u c t e d   s a m p l e W e i g h t   o f   s a m p l e   i n p u t × 100 .
Table 2. Textural properties of the AK-AC as a function of various activation conditions.
Sample NameSBET a
(m2/g)
VTotal b
(cm3/g)
VMicro c
(cm3/g)
VMeso d
(cm3/g)
RMeso e
(%)
Activation Yield f
(%)
K-C-7-H-9-112000.550.470.0814.534.7
K-C-7-H-9-27600.360.290.0722.213.7
K-C-7-H-9-3-----4.3
K-AP-20-H-9-110800.470.420.0510.627.7
K-AP-20-H-9-213000.560.500.0610.724.7
K-AP-20-H-9-314900.690.580.1115.918.7
K-AP-20-H-9-416800.820.580.2429.314.0
K-AP-20-H-9-618000.930.590.3436.610.0
K-AP-20-H-9-818601.040.600.4442.37.0
K-AP-20-H-9-1019401.260.630.6350.03.0
Coconut AC18200.850.660.1922.4-
a SBET: specific surface area; BET method p v p 0 p = 1 v m C + C 1 v m C P p 0 . b VTotal: total pore volume; amount adsorbed, P/P0 = 0.99. c VMicro: micropore volume; DR method ln(Vads) = ln(VDR) − R g a s T E D R β × [ I n p 0 p ] 2 . d VMeso: mesopore volume; VTotal−VMicro. e RMeso: mesopore volume ratio; V M e s o V T o t a l × 100 . f Activation yield; W e i g h t   o f   r e d u c t e d   s a m p l e W e i g h t   o f   s a m p l e   i n p u t × 100 .
Table 3. Adsorption properties of the AK-AC.
Sample NameBreakthrough Time
(min)
Adsorption Capacity
(g/g)
K-AP-20-H-9-12.660.31
K-AP-20-H-9-23.580.42
K-AP-20-H-9-33.800.45
K-AP-20-H-9-44.770.56
K-AP-20-H-9-65.520.65
K-AP-20-H-9-86.430.76
K-AP-20-H-9-106.680.79
Coconut AC4.380.52
Disclaimer/Publisher’s Note: The statements, opinions and data contained in all publications are solely those of the individual author(s) and contributor(s) and not of MDPI and/or the editor(s). MDPI and/or the editor(s) disclaim responsibility for any injury to people or property resulting from any ideas, methods, instructions or products referred to in the content.

