Abstract
This study utilizes waste Albizia lebbeck wood from a sawmill to prepare activated carbon adsorbents and explores their potential application in adsorption cooling systems with a novel hydrofluoroolefin (HFO) refrigerant characterized by a low global warming potential. Activated carbon was synthesized through a simple and green steam activation method, and the optimal carbon shows a specific surface area of 946.8 m2/g and a pore volume of 0.843 cm3/g. The adsorption isotherms of HFO-1234ze(E) (Trans-1,3,3,3-tetrafluoropropene) on the activated carbon were examined at 30, 40, and 50 °C up to 400 kPa using a customized constant-volume variable-pressure system, and significant adsorption of 1.041 kg kg−1 was achieved at 30 °C and 400 kPa. The experimental data were fitted using both the Dubinin–Astakhov and Tóth models, and both models provided excellent fit results. The D–A adsorption model simulated the net adsorption capacity at possible operating temperatures. The isosteric of adsorption was determined using the Clausius–Clapeyron and modified Dubinin–Astakhov equations. In addition, the specific cooling effect and coefficient of performance were also studied.
1. Introduction
Thermally driven adsorption cooling systems offer a sustainable solution to global energy concerns because they can utilize low-grade thermal sources, such as solar energy or waste heat from industrial processes, to operate [1]. This significantly lowers electricity usage and contributes to energy conservation. Nevertheless, their widespread adoption was hindered due to their bulky designs, elevated costs, and comparatively modest cooling efficiencies. To surmount these obstacles, our focus should be on creating economical adsorbents that boast enhanced adsorption capabilities, which could improve both the economic and performance metrics of these eco-friendly cooling systems. Over recent years, a range of materials, including zeolites [2], silica gel [3], activated carbon [4,5], and metal–organic framework materials [6], have been extensively explored as adsorbents for adsorption cooling systems; among these, activated carbon (AC) stands out as an auspicious material in the field of adsorption cooling systems, attracting considerable interest due to its inherently hydrophobic properties, tunable pore structure, robust thermal stability, and straightforward production process. These attributes make it an attractive candidate for the development of advanced adsorbents that can enhance the efficiency and effectiveness of thermally driven refrigeration technologies [7].
Coal was initially the primary raw material for producing activated carbon [8]. However, the finite availability of coal reserves and the escalating costs associated with its extraction have curtailed its viability as the preferred precursor for activated carbon production. In contrast, waste biomass resources have risen to prominence as favorable precursors for activated carbon thanks to their widespread availability and the relatively low economic value of repurposing them. Consequently, recent scientific endeavors have increasingly focused on the conversion of diverse waste biomass materials into high-quality activated carbon [9,10,11,12,13]. Albizia lebbeck is a common tree in tropical and subtropical regions. Studies have shown that the seed pods of Albizia lebbeck are an excellent precursor material for activated carbon [14]; on the other hand, the wood of Albizia lebbeck is a wonderful furniture and building material. Therefore, lumber mills produce a large amount of waste, such as sawmill Albizia lebbeck wood, yearly. However, there is no report on preparing activated carbons from Albizia lebbeck wood for adsorbent applications. Therefore, we explore the possibility of using this biomass material, which has a substantial annual output and a low reuse value, as an activated carbon precursor.
The synthesis of activated carbon (AC) from waste biomass materials typically involves two key steps: carbonization and activation. The activation step can be further categorized into physical and chemical activation. Chemical activation yields a remarkably high specific surface area and a well-developed porous structure. However, it is essential to acknowledge that chemical activation requires significant chemical usage, posing risks of wastewater generation and potential secondary pollution. The procedures involved in chemical activation are also quite complex and typically demand higher costs due to the necessity of corrosion-resistant equipment for its maintenance. In contrast, physical activation might not reach the high specific surface areas produced by chemical methods, but it is recognized for its simplicity and environmental friendliness. The most commonly used activating agents in physical activation are CO2 and steam, with CO2 activation being less reactive and necessitating higher temperatures than steam activation for effective results [15]. Consequently, the need for a higher energy input escalates. Hence, employing steam as an activating agent for physical activation is a compelling approach to fabricating cost-efficient activated carbon.
Refrigerants, including water, methanol, ethanol, and CO2, have been extensively studied in adsorption cooling systems [16,17,18,19]. However, these refrigerants exhibit reduced compressibility, thus leading to an increase in the system’s volume. Recently, researchers have been more interested in exploring the use of high-pressure commercial refrigerants, such as CFCs, HCFCs, and HFCs, known for their high compression ratios, in the realm of adsorption cooling. Yet, due to the substantial ozone depletion potential (ODP) and global warming potential (GWP) associated with these refrigerants, countries are systematically reducing their use until their eventual discontinuation [20]. HFO-1234ze(E) (Trans-1,3,3,3-tetrafluoropropene) is an advanced synthetic refrigerant that stands out due to its non-ozone-depleting nature and minimal impact on global warming potential (GWP), with a GWP below 10. Extensive data detailing the thermophysical attributes of HFO-1234ze(E) have been made public, covering critical pressure, vapor pressure, and isobaric specific heat capacity [21,22,23], which have been found to be comparable to those of HFC-134a [20]. Very recently, Ye et al. [24] researched the adsorption uptake of HFO-1234ze(E) on a commercially available activated carbon Maxsorb III, and the uptake was as high as 1.73 kg/kg. While commercial activated carbon demonstrates a high refrigerant adsorption capacity, its high price renders it impractical for large-scale deployment in adsorption refrigeration systems.
Hence, there is a pressing need to develop low-cost activated carbon adsorbent materials with a high adsorption performance for breakthrough systems. In this study, waste saw-milled Albizia lebbeck wood served as a precursor, and an environmentally friendly steam activation method was employed to produce activated carbon adsorbents with large pore volumes. Additionally, the potential application of this material, paired with HFO, in adsorption cooling systems was explored.
2. Experimental Methods
2.1. Raw Materials and Chemicals
Waste Albizia lebbeck saw-milled wood from wood mills is used as raw material for producing activated carbon. It can be washed, dried, crushed, and sieved to produce a precursor sample. Deionized water is a source of steam during the steam activation process. Honeywell International Inc. provided the HFO-1234ze(E) utilized in this research, and the characteristics of HFO-1234ze(E) can be found in Table 1.

Table 1.
Characteristics of HFO-1234ze(E).
2.2. Activated Carbon Production Process
Producing activated carbon requires three processes: pretreatment, carbonization, and activation. The original milled wood is still large and dirty, unsuitable for direct use in experiments. Therefore, the original material was crushed and washed to obtain a powder suitable for the experiment, which was then placed in a drying oven at 120 °C for 5 h to eliminate moisture. After that, 10 g of treated waste sawmilled wood was put into a vertical furnace for carbonization under a nitrogen atmosphere at 600 °C for one hour, applying a temperature gradient of 5 °C per minute with an ongoing nitrogen gas flow of 100 mL/min. Following carbonization, the resulting biochar was activated using steam. A 0.5 g carbonized sample was placed in a quartz holder at the center of a high-temperature borosilicate glass heating tube and subjected to heat with a temperature ramp rate of 5 °C per minute; the sample was heated in the presence of a continuous flow of inert nitrogen (200 mL/min) until reaching the specified activation temperature. Then, the flow path of nitrogen was altered, redirecting it from directly entering the tube to being fed into a steam generator. Propelled by nitrogen, steam was efficiently introduced into the tube, ensuring a constant nitrogen flow rate of 200 mL/min throughout the activation process. Once the activation was completed, the quartz tube naturally cooled to room temperature, and the quartz boat containing the activated carbon was cautiously removed. The two most important parameters affecting activated carbon’s adsorption performance are specific surface area and pore volume. This study uses steam activation time and temperature as experimental variables to obtain activated carbon with optimal surface area and pore volume. The produced activated carbon was denoted as WSW–AXXX–XX, signifying the specific activation temperature and duration. For instance, WSW–A700–20 signifies an activation temperature set at 700 °C and an activation duration lasting 20 min.
2.3. Characterization of Raw Materials and Activated Carbons
The yield of activated carbons is calculated from Equation (1) as follows:
Temperature gravimetric analysis (TGA) and differential scanning calorimetry (DSC) were utilized to characterize WSW-ACs. The raw waste sawmill wood underwent heating from 25 °C to 800 °C at a pace of 10 °C/min under a nitrogen (N2) atmosphere. TGA and DSC plots were produced using a TG/DTA7300 thermogravimetric analyzer from Hitachi.
A 3FLEX surface analyzer manufactured by Micromeritics Instruments, Japan was employed for assessing the N2 adsorption isotherm at 77 K. For accuracy, the activated carbons underwent a pretreatment stage involving heating to 120 °C for 2 h to eliminate any adsorbates. The evaluation of the N2 adsorption data facilitated the computation of the BET (Brunauer–Emmett–Teller) surface area. Furthermore, the nonlocal density functional theory was employed to compute the distribution of pore sizes and the overall pore volume.
2.4. HFO-1234ze(E) Adsorption Isotherms’ Measurement
A constant-volume variable-pressure (CVVP) system was used in an experiment to evaluate the activated carbon’s ability to adsorb HFO-1234ze(E). Figure 1 shows the schematic of the CVVP system. As the schematic shows, the charging and adsorption cells are the two primary parts of the system; both cells have pressure (P1, P2) and temperature sensors (T1, T2) on board. The pressure sensors utilized are FP101A units from Yokogawa Electric Corporation, which have a resolution of 0.125 kPa and a measurement range of 0–500 kPa. OMEGA Engineering, Inc. provided the temperature sensors T1 and T2, which have a resolution of 0.01 °C.
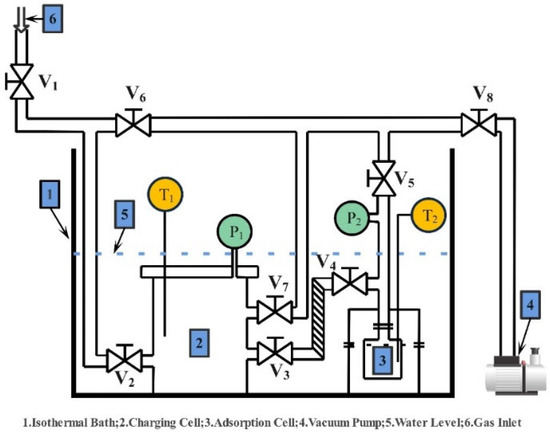
Figure 1.
Schematic diagram of the constant-volume variable-pressure apparatus.
The experiment’s complete protocol is as follows:
- Load the adsorption cell with approximately 1.0 g of the synthetic activated carbon sample;
- Vacuum the entire setup at 85 °C for more than 8 h to guarantee that no gas is adsorbed onto the sample within the system;
- Upon completion of the vacuuming process, seal all valves and allow the system to idle for 24 h to conduct a leak test;
- Upon a successful leak test, proceed with the adsorption experiment in the following manner:
- Maintain the heater and water circulator operation for an extended period to achieve a constant temperature for adsorption;
- Open the inlet valves (V1 and V2) to fill the charging unit and pressurize the cell to the desired pressure (e.g., beginning at around 20 kPa at Tads = 30 °C). Then, close the valves;
- Once pressure and temperature stabilize, note the values of pressure sensor P1 and temperature sensor T1. Input these values into the REFPROP database to compute the density of HFO-1234ze(E) denoted as (1, n), which will be utilized later for calculating the adsorption quantity;
- Open the valves (V3 and V4) between the charging and adsorption cells to let the gas flow into the adsorption unit. Wait until pressure and temperature stabilize, indicating the completion of adsorption. Record the values of pressure sensor P2 and temperature sensor T2. Input these values into the REFPROP database to obtain the density of HFO-1234ze(E) denoted as (2, n);
- Refill the charging unit with HFO-1234ze(E) gas until the subsequent target pressure is attained;
- Repeat steps (b) through (e) until the target pressure reaches the final pressure (which, in this study, is set at 500 kPa).
The calculation method of adsorption amount of HFO-1234ze(E) onto ACs is based on Formula (1) as follows:
, , and in the formula are the volume of the charging cell, tube, and adsorption cell; their volume was measured before the experiment and is presented in Table 2.

Table 2.
Parameters of charging cell, tube, and adsorption cell.
3. Results and Discussion
3.1. Characterization
3.1.1. Thermal Stability Analysis
The carbonization temperature during the carbon preparation process greatly influences the pore development in the activated carbon. Selecting an optimal carbonization temperature is crucial for creating activated carbon with a substantial concentration of micropores and achieving a high production yield [25]. The TGA/DTA characteristic method was employed to determine the suitable carbonization temperature. Figure 2 displays the outcomes of the TGA-DTG analysis involving a heating range from 35 °C to 800 °C. Our observations of the TGA curve indicated three primary mechanisms contributing to weight loss. The initial weight reduction within the temperature span of 35 and 250 °C is attributed to the dissipation of certain volatile organic compounds and molecularly bound water. The subsequent mass reduction, between 250 °C and 600 °C, is associated with the thermal breakdown of lignin, cellulose, and hemicellulose. The minimal mass reduction was observed from 600 to 800 °C, signifying that these decomposition processes are near completion. Consequently, the carbonization temperature for this study was chosen as 600 °C. Simultaneously, to ensure the complete volatilization of volatile substances, a carbonization time of 1 h was selected.
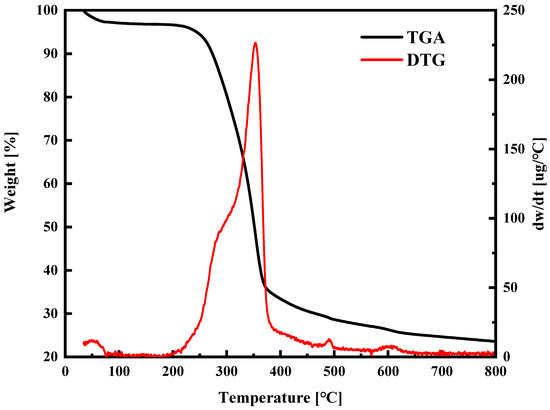
Figure 2.
TG–DTA analysis of raw waste sawmill wood in N2 atmosphere.
3.1.2. Nitrogen Adsorption Characterization
In addition to carbonization temperature, both activation duration and activation temperature significantly impact the characteristics of activated carbon [15]. This study focuses on the activation temperature and duration time as experimental variables to optimize the activation process. Nitrogen adsorption experiments were conducted to analyze surface area, pore volume, and size distribution. Nitrogen adsorption isotherms are provided concerning the activation temperature and duration, respectively, as shown in Figure 3 and Figure 4. Figure 3 illustrates a significant enhancement in the isothermal adsorption curve following steam activation compared to that of the samples that underwent carbonization only. The isotherm of the carbonized-only samples falls under Type I, dominated by micropore adsorption. In contrast, the isotherms of the activated samples are a blend of Type I and Type IV, indicating the development of micropores during activation, as evidenced by the rapid increase in all three curves at low relative pressures (less than 0.1 MPa), which surpasses that of the carbonized-only samples. However, all three isotherms exhibit an H4-type hysteresis loop associated with multilayer adsorption and capillary condensation in mesopores, suggesting the generation of some mesopores during activation. As the adsorption pressure increases, the curve at a 650 °C activation temperature slightly surpasses that at 700 °C as the relative pressure approaches 1.0 MPa. At this point, the 700 °C isotherm shows a greater level of adsorption, indicating that during the 30 min activation period at 700 °C, some micropores transitioned into mesopores compared to the conditions at 650 °C.
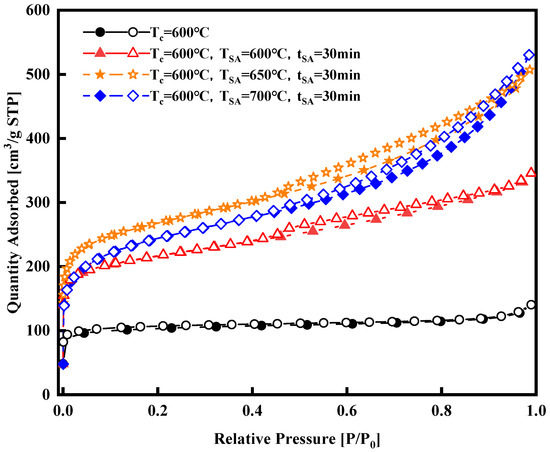
Figure 3.
Nitrogen adsorption isotherms of the synthesized activated carbons at various activation temperatures with constant activation duration.
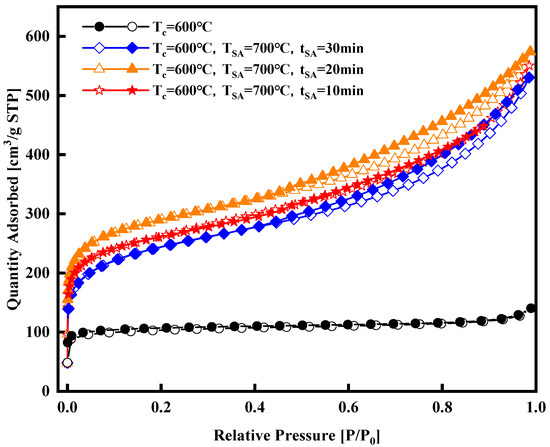
Figure 4.
Nitrogen adsorption isotherms of the synthesized activated carbons at various activation durations with constant activation temperature.
The nitrogen adsorption isotherm curves in Figure 4 were obtained at a constant activation temperature of 700 °C, with activation durations of 10, 20, and 30 min, respectively. These curves, a mix of Type I and Type IV, exhibit similar trends and levels. Notably, the isotherm curve with a 20 min activation time is slightly higher than those with 10 and 30 min activation times, suggesting potential pore damage at 700 °C with a 30 min activation time. Figure 5, Figure 6, Figure 7 and Figure 8 present pore size distribution and cumulative pore volume diagrams concerning activation temperature and time changes. In both pore size distribution figures, most of the pore diameters for all of the samples are less than 2 nm, indicating a richness in micropores, with some mesopores also present. Table 3 lists the yield, surface area, total pore volume (Vtotal), micropore volume (Vmicro), and mesopore volume (Vmeso). Notably, WSW–A700–20 exhibits the highest BET-specific surface area of 946.8 m2/g and a total pore volume of 0.843 cm3/g, yielding 27.6%. Consequently, an activation temperature of 700 °C and an activation duration of 20 min are the optimal parameters for preparing activated carbon. Thus, WSW–A700–20 was selected as the adsorbent for subsequent adsorption experiments.
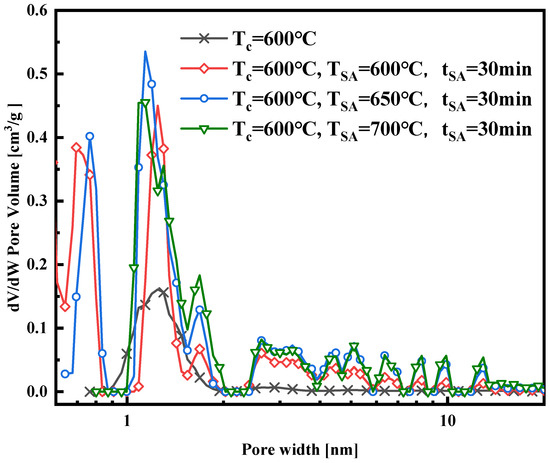
Figure 5.
Pore size distribution of the samples synthesized with different activated temperatures.
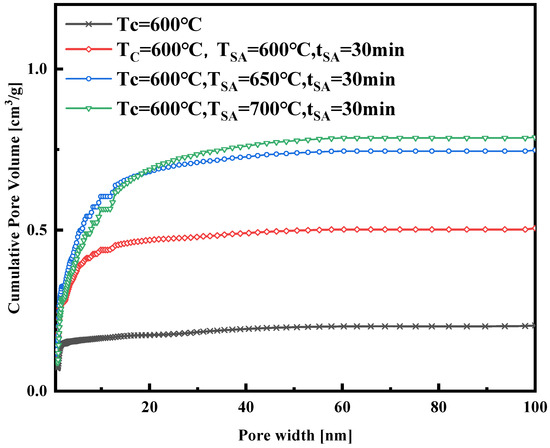
Figure 6.
The cumulative pore volume of the samples synthesized with different activated temperatures.
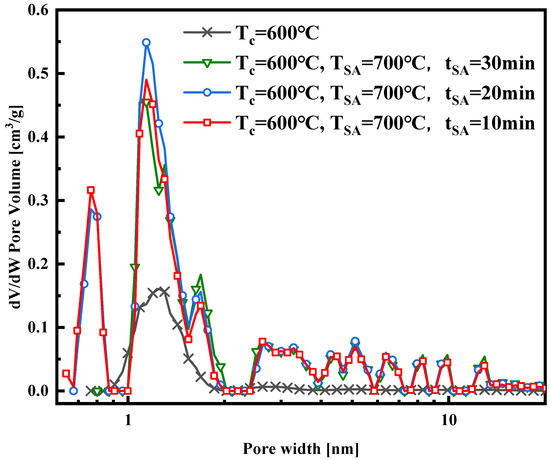
Figure 7.
Pore size distribution of the samples synthesized with different activated durations.
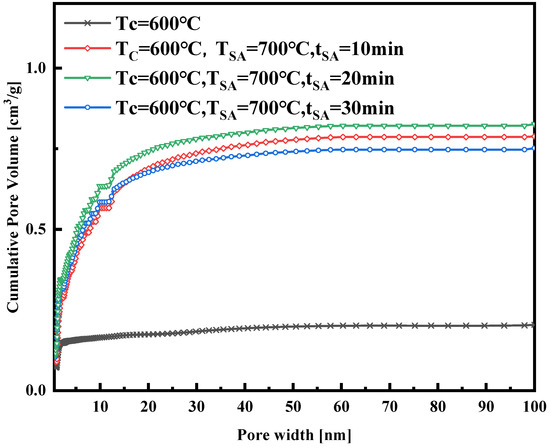
Figure 8.
The cumulative pore volume of the samples synthesized with different activated durations.

Table 3.
Yield and porous property data of the synthesized activated carbon samples.
3.2. Adsorption Isotherms
The adsorption isotherms of WSW–A700–20/HFO-1234ze(E) were meticulously investigated using a constant-volume variable-pressure (CVVP) system under three distinct constant-temperature conditions: 30 °C, 40 °C, and 50 °C. Figure 9 delineates the adsorption profile of HFO-1234ze(E) on WSW–A700–20, spanning a pressure range from 0 to 400 kPa. As the adsorption pressure escalates, a direct and proportional increase in adsorption uptake is observed, culminating in a peak adsorption capacity of 1.041 kg/kg at 30 °C and 400 kPa. Two adsorption models are employed meticulously to fit the experimentally obtained isothermal adsorption data. The Tóth model is one of the empirical models that exhibits a strong performance in estimating adsorption uptake within high-pressure areas, while the Dubinin–Astakhov (D–A) model has had widespread application in the adsorption of gases on adsorbents based on carbon [26]. This study modeled the adsorption isotherm of the HFO-1234ze(E) and WSW–A700–20 working pair using the D–A and Tóth equations. Equations (3) and (4) denote the D–A and Tóth models, respectively.
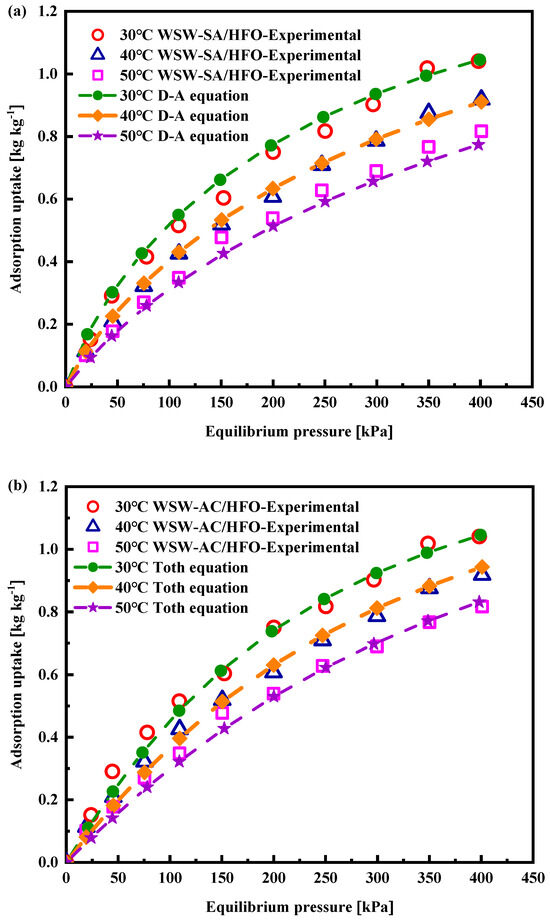
Figure 9.
WSW–A700–20/HFO-123ze(E) working pair experimental adsorption isotherms fitted with (a) D–A model and (b) Tóth model.
To precisely fit the experimental data with the models, we introduced the root mean square deviation (RMSD) as a metric to quantify the discrepancy between the experimental data and the adsorption models. Subsequently, we utilized Excel Solver to meticulously optimize the parameters of the investigated adsorption equations, aiming for a high degree of congruence with the experimental data. Figure 9a,b present the results of fitting the measured data using the D–A and Tóth models. Both figures clearly demonstrate the close alignment between the measured data and the predicted adsorption quantities by these models. Table 4 details the parameter values obtained from the optimized adsorption equations and provides the root mean square deviation values, facilitating a comparison between the observed and anticipated adsorption outcomes. The findings indicate that the RMSD value for the D–A model is 2.67%, while the Tóth model exhibits a value of 2.14%. After obtaining the best-fit data through the root mean square deviation (RMSD) method, we employed the coefficient of determination, R², to assess the congruence between the experimental and fitted data. The formula for calculating R2, as shown in Equation (6), has been meticulously detailed in Table 4.

Table 4.
Adsorption parameters of the assorted WSW–A700–20 ACs/HFO-1234ze(E) pairs.
To predict the adsorption isotherms at different temperatures, it is essential to consider the influence of temperature on the adsorption potential. Figure 10a,b depict the relationships between fractional uptake and adsorption potential, as well as adsorption uptake and relative pressure, respectively. Notably, under the temperature conditions of 30 °C, 40 °C, and 50 °C, the experimental data points in these graphs almost converge onto a common characteristic curve. This observation suggests that fluctuations in temperature have a negligible impact on the adsorption potential, thereby providing a solid basis for extrapolating the isotherm profile to other temperatures using the D–A or Tóth models [19,27].
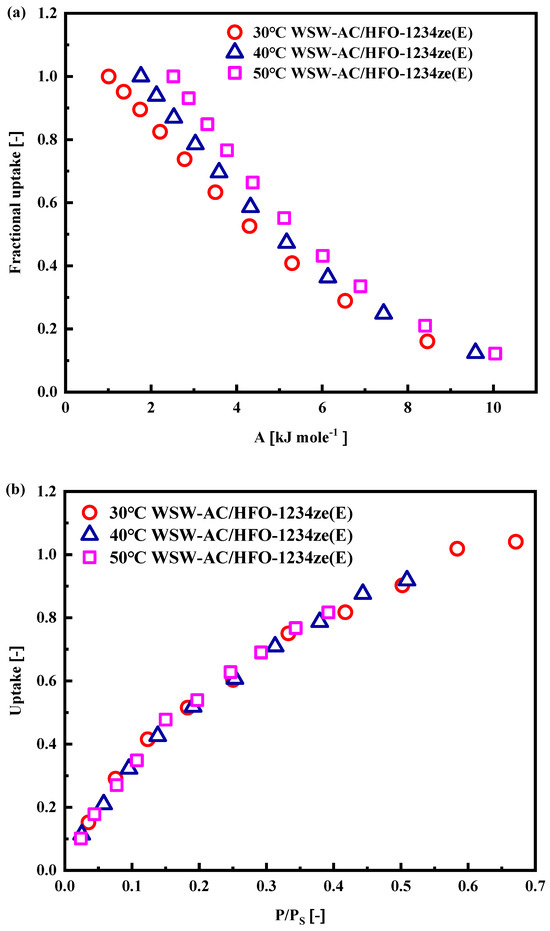
Figure 10.
Plots of the WSW–A700–20/HFO-1234ze(E) pair (a) fractional uptake against adsorption potential and (b) adsorption uptake against relative pressure.
The D–A model and the Tóth model both demonstrate effective fitting results. Yet, due to significant burn-off occurring during the activation process in activated carbon adsorbents, there is an increase in adsorbent heterogeneity. As a result, the D–A model is better suited for forecasting the adsorption isotherms of activated carbons at different temperatures [28]. Figure 11 represents the net uptake during the adsorption cooling cycle with the WSW–A700–20/HFO-1234ze(E) pairs. The operating temperatures for the evaporator, adsorption, and desorption bed are 10 °C, 30 °C, and 85 °C. The effective uptake, calculated using Equation (5), amounts to 0.3768 kg kg−1.
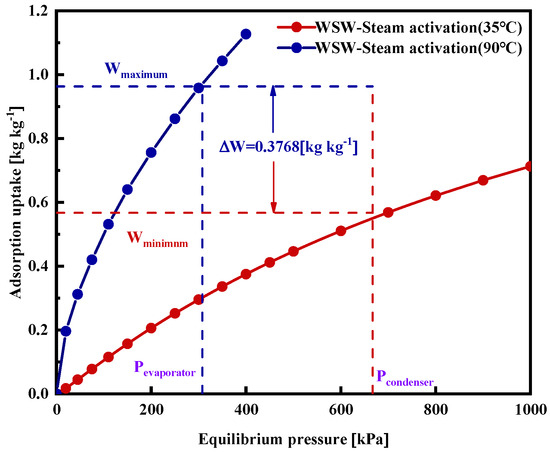
Figure 11.
WSW–A700–20/HFO-1234ze(E) pair’s net uptake at 35 °C adsorption and 90 °C regeneration temperatures.
4. Thermodynamic Performances
4.1. Isosteric Heat of HFO-1234ze(E) Adsorption
Energy is generated when an adsorbate molecule leaves the bulk phase and sticks to an adsorbent’s restricted surface. At the same time, a constant pressure and temperature are maintained, known as the isosteric heat of adsorption (Qst) [29]. It characterizes the intensity of the molecular-level interaction between the molecules of the adsorbate or refrigerant and the adsorbent particles. It also impacts how much the adsorbent’s temperature changes during the adsorption and desorption processes. The temperature changes as a result of the adsorbent absorbing part of the heat emitted during the adsorption process, which lowers the adsorption rate [25], so the isosteric heat of adsorption stands out as a vital thermodynamic parameter when developing and designing adsorption heat pumps and adsorption cooling systems. Rahman et al. [30] introduced the adapted D–A isotherm model into the Clausius–Clapeyron (C-C) equation, resulting in the modified Qst equation denoted as Equations (6) and (7):
in Equation (6) denotes the surface coverage, and the equation to calculate the surface coverage is listed in Equation (7). Figure 12 shows the relationship between the surface coverage of the WSW–A700–20/HFO-1234ze(E) working fluid combination at different adsorption temperatures and the isosteric heat of adsorption. Observing the graph, because of the decrease in the specific enthalpy of evaporation in the region below the critical temperature, it is clear that the isosteric heat of adsorption decreases as the temperature rises. Furthermore, at various temperatures, the isosteric heat of adsorption decreases as the adsorbate loading increases. This trend is elucidated by referencing the pore size distribution diagrams found in Figure 5 and Figure 7. These diagrams highlight the prevalence of predominantly micropores in the synthesized activated carbon, each varying in size. During the initial adsorption phase, HFO-1234ze(E) quickly adheres to sites with elevated energy levels. As the adsorption process continues, molecules begin to adhere to sites with diminishing energy levels. Initially, HFO-1234ze(E) molecules infiltrate the narrow pores of WSW–A700–20, resulting in relatively strong interactions between them, hence producing higher isosteric heat values at lower loadings. However, once the smaller pores become fully saturated, HFO-1234ze(E) molecules gradually occupy the larger pores, gradually weakening the isosteric heat of adsorption [4].
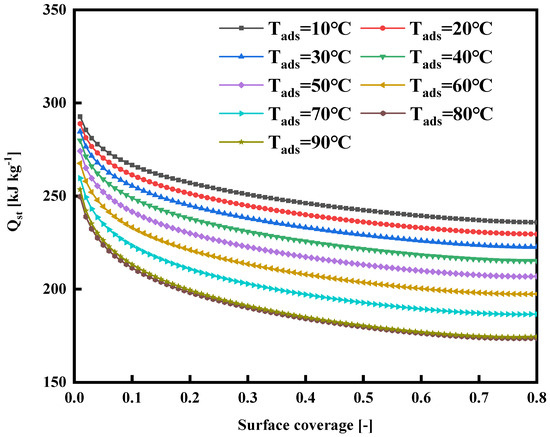
Figure 12.
Isosteric heat of adsorption of WSW–A700–20/HFO-1234ze(E) working pair.
4.2. SCE and COP
In the present study, the thermodynamic cycle of an adsorption cooling system employing the WSW–A700–20/HFO-1234ze(E) working pair is simulated within a pressure–temperature–uptake concentration diagram, as depicted in Figure 13. The orange line delineates the saturation curve of HFO-1234ze(E), while the gray curve encapsulates the pressure–temperature relationship across varying uptake concentrations. The pink line signifies the adsorption isotherm corresponding to adsorption concentrations of 0.8878 kg/kg and 0.5110 kg/kg; these two adsorption concentration uptakes are determined in Figure 9. The system’s operational parameters are defined by the evaporator pressure set at 308 kPa and the condenser pressure at 667 kPa. Consequently, the adsorption temperature (T1), preheating temperature (T2), desorption temperature (T3), and precooling temperature (T4) are determined through rigorous calculations. These pivotal temperatures will serve as the foundation for the subsequent computation of the system’s specific cooling effect (SCE) and coefficient of performance (COP), critical metrics for evaluating the system’s efficiency and performance.
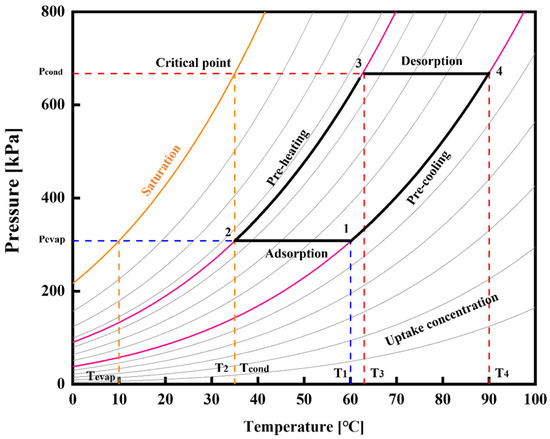
Figure 13.
Pressure–temperature–uptake diagram of WSW–A700–20/HFO-1234ze(E) based adsorption cooling cycle.
The specific cooling effect (SCE) and the coefficient of performance (COP) are identified as the most pivotal performance indicators of the adsorption cooling systems. A simulation and calculation of the SCE and COP were conducted for the adsorption cooling cycle utilizing the WSW–A700–20/HFO-1234ze(E) working pair. The SCE was calculated using Equation (8). Figure 14 illustrates the trend of SCE in terms of desorption temperatures at three distinct evaporator temperatures (10 °C, 15 °C, and 20 °C). It is discernible from the graph that there is a roughly proportional relationship between the SCE and the desorption temperature. This phenomenon can be attributed to the enhancement of the net adsorption uptake as the desorption temperature elevates. Furthermore, it is observed that the SCE increases with a decrease in evaporator temperature. This increment can be ascribed to an increased maximum adsorption capacity resulting from lower evaporator temperatures, amplifying the SCE value.
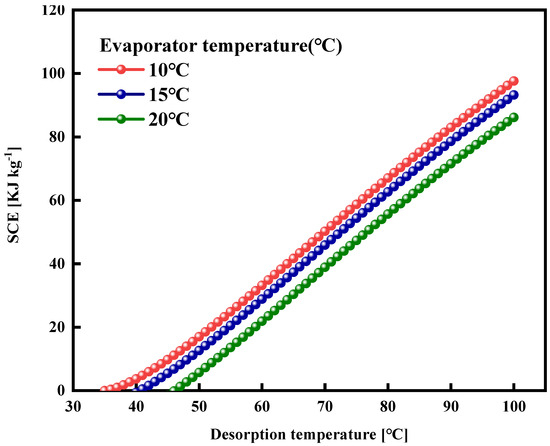
Figure 14.
Specific cooling effect (SCE) of WSW–A700–20/HFO-1234ze(E) working pair at different evaporator temperatures as a function of desorption temperature.
The coefficient of performance (COP) for the adsorption cooling systems utilizing the WSW–A700–20/HFO-1234ze(E) working pair is calculated using Equations (9)–(12). Equation (11) captures the latent heat requirement during adsorption, and Qst employs the average isosteric heat of adsorption at 30 °C computed in the preceding section. Equation (12) addresses the necessity of sensible heat during both the preheating and desorption phases. The first term of Equation (12) outlines the heat uptake by the adsorbent from temperature T2 to T4. At the same time, the subsequent two parts represent the heat intake by the refrigerant during preheating and desorption, respectively. Given the minimal variation in temperature ranges for the specific heat capacity of the HFO-1234ze(E) refrigerant in this study, average values within these temperature ranges were utilized for our computation. The specific heat capacity for the refrigerant obtained from the REFPROP database is 0.98375 kJ/kgK. The specific heat capacity of the WSW–A700–20 activated carbon adsorbent is derived through DSC measurements. The value between T2 and T4 is shown in Figure 15.
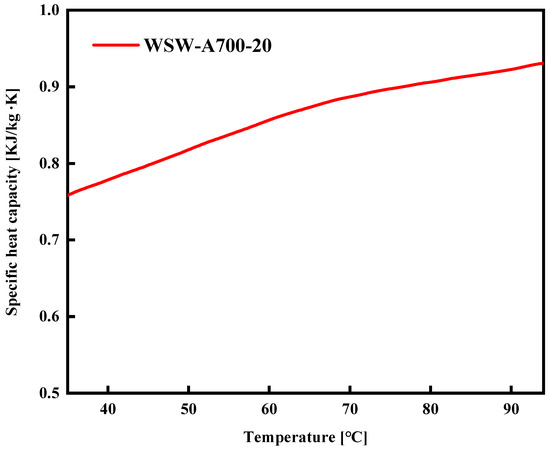
Figure 15.
Specific heat capacity of WSW–A700–20 from room temperature to possible desorption temperature.
Figure 16 illustrates the coefficient of performance (COP) of the adsorption cooling systems employing the WSW–A700–20/HFO-1234ze(E) working pair, which varies with the desorption temperature. The red, blue, and green lines correspond to the COP variations at evaporator temperatures set at 10 °C, 15 °C, and 20 °C, respectively. The figure shows that with an increase in desorption temperature and a decrease in evaporator temperature, there is a notable initial rise in the system’s coefficient of performance (COP), which then tends toward a plateau. At an evaporator temperature of 10 °C and a condenser temperature of 35 °C, the system’s COP achieves a value of 0.355. Table 5 presents the selected operational conditions alongside the calculated specific coefficients of performance (COP) and specific cooling effect (SCE) value. In our preceding research [23], we explored the adsorption properties of HFO-1234ze(E) on the commercially available activated carbon of type Maxsorb III, and a COP of approximately 0.4 was estimated for such a working pair in the adsorption cooling system with a lower evaporator temperature of 5 °C. This further affirms the potential of the activated carbon developed in this study for its application as an adsorbent material in adsorption cooling systems.
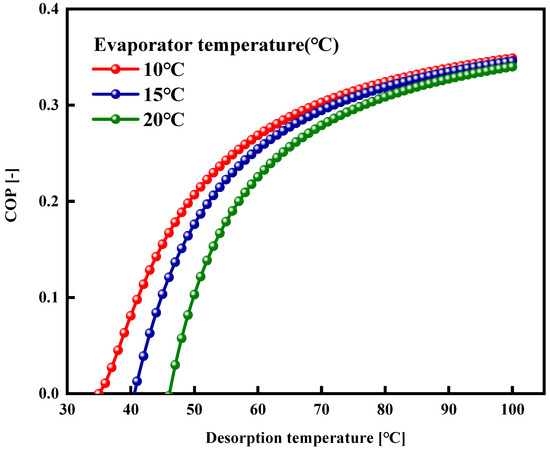
Figure 16.
Desorption temperature effect on COP of WSW–A700–20/HFO-1234ze(E) working pair at different evaporator temperatures.

Table 5.
WSW–A700–20/HFO-1234ze(E) working pair performance indicators.
5. Conclusions
This study utilized waste Albizia lebbeck wood from sawmills as a precursor to synthesize microporous activated carbon using an environmentally friendly steam activation technique. Under an activation temperature of 700 °C, the WSW–A700–20 activated carbon achieved an impressive specific surface area of 946.8 m2/g and a pore volume of 0.83 cm3/g within just 20 min. The adsorption isotherms of HFO-1234ze(E) on WSW–A700–20 were investigated using a constant-volume variable-pressure system at temperatures of 30 °C, 40 °C, and 50 °C within a pressure range of 0 to 400 kPa. Notably, the maximum adsorption capacity of the WSW–A700–20/HFO-1234ze(E) pair reached an astonishing 1.041 kg/kg. The experimental data were fittingly modeled using the Dubinin–Astakhov (D–A) and Tóth models, exhibiting an excellent correlation with the experimental results. Additionally, this work determined the effective adsorption amount during the processes of evaporation, adsorption, and desorption to be 0.3768 kg/kg. Subsequently, the isosteric heat of adsorption for the adsorption isotherms was calculated using the Clausius–Clapeyron equation and a modified D–A equation, yielding a range between 173 and 292 kJ/kg. Ultimately, through simulation calculations, the specific cooling effect (SCE) and the coefficient of performance (COP) of the adsorption refrigeration cycle using the WSW–A700–20/HFO-1234ze(E) working pair were obtained, with the simulation results indicating that the system’s COP could reach 0.355 under selected operating conditions. The experimental findings of this study demonstrate the significant application potential of using waste biomass-derived activated carbon and HFO-1234ze(E) as a working pair in adsorption cooling systems, providing valuable data and insights for advancing adsorption heat pump/cooling systems based on activated carbon prepared from waste sawmill wood and utilizing HFO-1234ze(E) as the refrigerant.
Author Contributions
Conceptualization, methodology, software, validation, formal analysis, investigation, resources, data curation, writing—original draft preparation, H.B. and M.A.I.; writing—review and editing, M.A.I. and B.B.S.; visualization, supervision, project administration, B.B.S. All authors have read and agreed to the published version of the manuscript.
Funding
This research received no external funding.
Institutional Review Board Statement
Not applicable.
Informed Consent Statement
Not applicable.
Data Availability Statement
The data presented in this study are available upon request from the corresponding author because of a contract with a joint research destination.
Conflicts of Interest
The authors declare no conflict of interest.
Nomenclature
| adsorption potential ) | |
| adsorption characteristic energy ) | |
| equilibrium constant | |
| molar mass ) | |
| adsorption uptake ) | |
| 0 | saturated adsorption uptake ) |
| liquid enthalpy of HFO-1234ze(E) ) | |
| saturated vapor enthalpy of HFO-1234ze(E) ) | |
| evaporator enthalpy of HFO-1234ze(E) vaporization ) | |
| structural heterogeneity parameter ) | |
| equilibrium pressure ) | |
| saturated pressure | |
| isosteric heat of adsorption ) | |
| heterogeneity factor ) | |
| temperature ) | |
| universal gas constant ) | |
| Abbreviation | |
| ads | Adsorption |
| des | Desorption |
| evap | Evaporator |
| cond | Condenser |
| Acronyms | |
| COP | Co-efficient of performance |
| GWP | Global warming potential |
| ODP | Ozone depletion potential |
| SCE | Specific cooling effect |
References
- Muttakin, M.; Pal, A.; Rupa, M.J.; Ito, K.; Saha, B.B. A critical overview of adsorption kinetics for cooling and refrigeration systems. Adv. Colloid Interface Sci. 2021, 294, 102468. [Google Scholar] [CrossRef] [PubMed]
- Rocky, K.A.; Pal, A.; Rupam, T.H.; Nasruddin; Saha, B.B. Zeolite-graphene composite adsorbents for next generation adsorption heat pumps. Microporous Mesoporous Mater. 2021, 313, 110839. [Google Scholar] [CrossRef]
- Pan, Q.; Peng, J.; Wang, H.; Sun, H.; Wang, R. Experimental investigation of an adsorption air-conditioner using silica gel-water working pair. Sol. Energy 2019, 185, 64–71. [Google Scholar] [CrossRef]
- Saha, B.B.; Habib, K.; El-Sharkawy, I.I.; Koyama, S. Adsorption characteristics and heat of adsorption measurements of R-134a on activated carbon. Int. J. Refrig. 2009, 32, 1563–1569. [Google Scholar] [CrossRef]
- Askalany, A.A.; Saha, B.B.; Ismail, I.M. Adsorption isotherms and kinetics of HFC410A onto activated carbons. Appl. Therm. Eng. 2014, 72, 237–243. [Google Scholar] [CrossRef]
- Zheng, J.; Barpaga, D.; Gutiérrez, O.Y.; Browning, N.D.; Mehdi, B.L.; Farha, O.K.; Lercher, J.A.; McGrail, B.P.; Motkuri, R.K. Exceptional Fluorocarbon Uptake with Mesoporous Metal–Organic Frameworks for Adsorption-Based Cooling Systems. ACS Appl. Energy Mater. 2018, 1, 5853–5858. [Google Scholar] [CrossRef]
- Pal, A.; Shahrom, M.S.R.; Moniruzzaman, M.; Wilfred, C.D.; Mitra, S.; Thu, K.; Saha, B.B. Ionic liquid as a new binder for activated carbon based consolidated composite adsorbents. Chem. Eng. J. 2017, 326, 980–986. [Google Scholar] [CrossRef]
- Pal, A.; Thu, K.; Mitra, S.; El-Sharkawy, I.I.; Saha, B.B.; Kil, H.-S.; Yoon, S.-H.; Miyawaki, J. Study on biomass derived activated carbons for adsorptive heat pump application. Int. J. Heat Mass Transf. 2017, 110, 7–19. [Google Scholar] [CrossRef]
- Sun, Y.; Shi, X.-L.; Yang, Y.-L.; Suo, G.; Zhang, L.; Lu, S.; Chen, Z.-G. Biomass-Derived Carbon for High-Performance Batteries: From Structure to Properties. Adv. Funct. Mater. 2022, 32, 2201584. [Google Scholar] [CrossRef]
- Pal, A.; Uddin, K.; Saha, B.B.; Thu, K.; Kil, H.-S.; Yoon, S.-H.; Miyawaki, J. A benchmark for CO2 uptake onto newly synthesized biomass-derived activated carbons. Appl. Energy 2020, 264, 114720. [Google Scholar] [CrossRef]
- Muruganantham, R.; Wang, F.-M.; Yuwono, R.A.; Sabugaa, M.; Liu, W.-R. Biomass Feedstock of Waste Mango-Peel-Derived Porous Hard Carbon for Sustainable High-Performance Lithium-Ion Energy Storage Devices. Energy Fuels 2021, 35, 10878–10889. [Google Scholar] [CrossRef]
- Wang, J.; Nie, P.; Ding, B.; Dong, S.; Hao, X.; Dou, H.; Zhang, X. Biomass derived carbon for energy storage devices. J. Mater. Chem. A 2017, 5, 2411–2428. [Google Scholar] [CrossRef]
- Wang, C.; Wang, X.; Wang, H.; Zhang, L.; Wang, Y.; Dong, C.-L.; Huang, Y.-C.; Guo, P.; Cai, R.; Haigh, S.J.; et al. Low-coordinated Co-N3 sites induce peroxymonosulfate activation for norfloxacin degradation via high-valent cobalt-oxo species and electron transfer. J. Hazard. Mater. 2023, 455, 131622. [Google Scholar] [CrossRef]
- Ahmed, M.J.; Theydan, S.K. Optimization of microwave preparation conditions for activated carbon from Albizia lebbeck seed pods for methylene blue dye adsorption. J. Anal. Appl. Pyrolysis 2014, 105, 199–208. [Google Scholar] [CrossRef]
- Fu, K.; Yue, Q.; Gao, B.; Sun, Y.; Zhu, L. Preparation, characterization and application of lignin-based activated carbon from black liquor lignin by steam activation. Chem. Eng. J. 2013, 228, 1074–1082. [Google Scholar] [CrossRef]
- Jahan, I.; Rupam, T.H.; Palash, M.; Rocky, K.A.; Saha, B.B. Energy efficient green synthesized MOF-801 for adsorption cooling applications. J. Mol. Liq. 2022, 345, 117760. [Google Scholar] [CrossRef]
- Li, W.; Xia, X.; Cao, M.; Li, S. Structure–property relationship of metal–organic frameworks for alcohol-based adsorption-driven heat pumps via high-throughput computational screening. J. Mater. Chem. A 2019, 7, 7470–7479. [Google Scholar] [CrossRef]
- Thu, K.; Takeda, N.; Miyazaki, T.; Saha, B.B.; Koyama, S.; Maruyama, T.; Maeda, S.; Kawamata, T. Experimental investigation on the performance of an adsorption system using Maxsorb III + ethanol pair. Int. J. Refrig. 2019, 105, 148–157. [Google Scholar] [CrossRef]
- Jribi, S.; Saha, B.B.; Koyama, S.; Chakraborty, A.; Ng, K.C. Study on activated carbon/HFO-1234ze(E) based adsorption cooling cycle. Appl. Therm. Eng. 2013, 50, 1570–1575. [Google Scholar] [CrossRef]
- Higashi, Y.; Tanaka, K.; Ichikawa, T. Critical Parameters and Saturated Densities in the Critical Region for trans-1,3,3,3-Tetrafluoropropene (HFO-1234ze(E)). J. Chem. Eng. Data 2010, 55, 1594–1597. [Google Scholar] [CrossRef]
- An, B.; Yang, F.; Duan, Y.; Yang, Z. Measurements and New Vapor Pressure Correlation for HFO-1234ze(E). J. Chem. Eng. Data 2017, 62, 328–332. [Google Scholar] [CrossRef]
- Tanaka, K.; Takahashi, G.; Higashi, Y. Measurements of the Isobaric Specific Heat Capacities for trans -1,3,3,3-Tetrafluoropropene (HFO-1234ze(E)) in the Liquid Phase. J. Chem. Eng. Data 2010, 55, 2267–2270. [Google Scholar] [CrossRef]
- Ye, L.; Islam, M.A.; Rupam, T.H.; Jahan, I.; Saha, B.B. Study on the adsorption characteristics of Maxsorb III/HFO-1234ze(E) pair for adsorption refrigeration applications. Int. J. Refrig. 2023, 146, 248–260. [Google Scholar] [CrossRef]
- Daud, W.M.A.W.; Ali, W.S.W.; Sulaiman, M.Z. The effects of carbonization temperature on pore development in palm-shell-based activated carbon. Carbon 2000, 38, 1925–1932. [Google Scholar] [CrossRef]
- Al-Ghouti, M.A.; Da’ana, D.A. Guidelines for the use and interpretation of adsorption isotherm models: A review. J. Hazard. Mater. 2020, 393, 122383. [Google Scholar] [CrossRef] [PubMed]
- Pal, A.; Uddin, K.; Thu, K.; Saha, B.B. Activated carbon and graphene nanoplatelets based novel composite for performance enhancement of adsorption cooling cycle. Energy Convers. Manag. 2019, 180, 134–148. [Google Scholar] [CrossRef]
- Rocky, K.A.; Pal, A.; Moniruzzaman, M.; Saha, B.B. Adsorption characteristics and thermodynamic property fields of polymerized ionic liquid and polyvinyl alcohol based composite/CO2 pairs. J. Mol. Liq. 2019, 294, 111555. [Google Scholar] [CrossRef]
- Shen, D.; Bülow, M.; Siperstein, F.; Engelhard, M.; Myers, A.L. Comparison of Experimental Techniques for Measuring Isosteric Heat of Adsorption. Adsorption 2000, 6, 275–286. [Google Scholar] [CrossRef]
- Saha, B.B.; Koyama, S.; Kashiwagi, T.; Akisawa, A.; Ng, K.C.; Chua, H.T. Waste heat driven dual-mode, multi-stage, multi-bed regenerative adsorption system. Int. J. Refrig. 2003, 26, 749–757. [Google Scholar] [CrossRef]
- Rahman, K.A.; Chakraborty, A.; Saha, B.B.; Ng, K.C. On thermodynamics of methane+carbonaceous materials adsorption. Int. J. Heat Mass Transf. 2012, 55, 565–573. [Google Scholar] [CrossRef]
Disclaimer/Publisher’s Note: The statements, opinions and data contained in all publications are solely those of the individual author(s) and contributor(s) and not of MDPI and/or the editor(s). MDPI and/or the editor(s) disclaim responsibility for any injury to people or property resulting from any ideas, methods, instructions or products referred to in the content. |
© 2024 by the authors. Licensee MDPI, Basel, Switzerland. This article is an open access article distributed under the terms and conditions of the Creative Commons Attribution (CC BY) license (https://creativecommons.org/licenses/by/4.0/).