Abstract
In this paper, the prototype of a gas detector based on the electrical response of MgSb2O6 oxide at 400 °C and with a concentration of 560 ppm was designed, simulated, and fabricated. This design considers a PIC18F4550 microcontroller and a response time of 3 s for the sensor. It is worth noting that the response system can be reduced in concordance with the mathematical model of the sensor’s electrical response. The proposed device is capable of detecting one to three gases: O2, C3H8, and CO2. The configuration is achieved through three switches. In programming the prototype, factors such as the gas sensor signals, device configuration, corrective gas signals, and indicator signals were carefully considered. The characteristic of the gas detector is an operational temperature of 400 °C, which is ideal for industrial processing. This can be configured to detect a single gas or all three of them . Each gas type has its corresponding corrective signal and an indicator-led diode. The operation concentration is 560 ppm, the device is scalable, and its programming can be extended to cover industrial networks.
1. Introduction
Nowadays, gas emissions have become a global concern due to the harmful effects of noxious gases on the respiratory systems of living organisms [1], leading to lung diseases and even fatalities. To mitigate health and environmental risks, governments have implemented contingency plans and industries have developed protective systems for their processes. Industrial protection systems are conformed by a gas sensor and signal adaptation electronic circuit. The gas sensors are utilized to monitor atmospheres where toxic gases may be present, such as propane , methane , butane , oxygen , and carbon dioxide among others [2,3]. In the fabrication of semiconductive binary oxides [4,5], ternary perovskite oxides [6], spinel oxides [7], and trirutile semiconductive oxides have been employed. Particularly, trirutile semiconductive oxides, such as ZnSb2O6, MnSb2O6, and Ni Sb2O6 [8,9,10,11,12,13,14,15], are very attractive materials, given their performance concerning catalytic activity, thermic stability, good capacity, and efficiency in toxic environments, such as those where CO, CO2, C3H8, and GLP gases are prevalent [16]. Based on the results reported in the literature, these gas detection properties are due to the different particle morphologies and variable sizes that can reach up to 100 nm [17]. In [18], the author mentions reducing the particle size (to nanometric scale), and the adsorption and desorption of oxygen species on the compound’s surface substantially increase due to the temperature, causing an incrementation in the sensibility and dynamic response [17]. With the improvement in these parameters for the detection of gases deploying trirutile materials, the design and construction of new toxic gas-detecting devices operating at high temperatures and concentrations are favored [19], making it possible to develop efficient industrial protection systems.
On the other hand, for gas sensors, the adaptation of their electrical signals is typically achieved through programmable devices [20] and analog electronics [19]. In the design of digital protection systems, it is important to take into consideration the signal adaptation between the sensor and the microcontroller, the electric response of the sensor, the resolution of the analog-to-digital convertor in the analogic input port of the microcontroller, the machine time, the bit architecture, the oscillator frequency, and the connectivity to other devices [21]. Meanwhile, in the design of analog protection systems, the electric response of the sensor, the analog circuit type, the electronic components’ response times, and the cascade connection of the circuits are taken into consideration [22]. Digital protection systems have the advantage of connectivity with other equipment, and their design can be modified through programming. Nonetheless, analog devices have limited design applications, and they have the disadvantage of having no connectivity with other devices. Taking this into consideration, the development of programmable protection systems is desirable, given their connectivity with emerging technologies.
In industrial processes where combustion is essential, both the temperature and gas concentrations are often extremely high, necessitating protection systems capable of operating under harsh conditions and delivering rapid response times [23,24]. These requirements must be carefully considered during the design, simulation, and construction of the prototype. The system primarily comprises a gas sensor and a signal adaptation electronic subsystem [25,26]. Given that the sensor is typically installed near the combustion process while the electronic device can be positioned further away, the sensor must withstand high temperatures and gas concentrations. In contrast, the electronic device operates at room temperature but must maintain a response time synchronized with the sensor’s performance. Additionally, the sensor must exhibit high immunity to noise to prevent false positives.
This study designed, simulated, and constructed a gas detection device. For its design and adaptation, the electrical response of MgSb2O6, the microcontroller characteristics, and the circuit are taken into consideration. For the simulation, the design results are considered, and lastly, for the construction, the results obtained in the design and simulation are taken into consideration. The device was fabricated with commercially available material. Therefore, its construction and repair are accessible and uncomplicated. The device operated at 400 °C, with a concentration of 560 ppm along with a response time of 3 s; it can be configured to detect a single gas, two gasses, or three gasses For the microcontroller application, the system input signals (sensor signals and configuration interrupters) and the output signals (correction and indication signals) are taken into account. Thus, the device is scalable and extendable to cover industrial networks.
2. Methodology and Experiments
2.1. Synthesis
Powders of MgSb2O6 oxide were prepared employing a wet chemistry method assisted by microwave radiation. For this synthesis, 2.80 g of SbCl3 (Sigma-Aldrich, Guadalajara, Mexico, 99%), 1.45 g of Mg(NO3)2·6H2O (Sigma-Aldrich, Guadalajara, Mexico, 99%), and 2 mL of ethylenediamine (C2H8N2, Sigma-Aldrich, 99%) were considered, and as dispersion medium to dissolve the reactants, ethylic alcohol (C2H5OH, CTR, 99.5%) was employed. As a first step, each reactant was individually dissolved in 5 mL of ethyl alcohol, except for antimony trichloride (SbCl3), which was dissolved in 10 mL instead. The solutions were mixed, and the obtained blend of this colloidal dispersion was left under rigorous agitation for 24 h at 320 rpm (30 °C). Afterward, the solvent was evaporated from resulting solution (ethylic alcohol) by applying microwave radiation generated by a domestic General Electric microwave oven model ST0912C01352 at a potency of 70 W (by phases of 60 s). The precursor material obtained was dried at 200 °C for 8 h and then calcinated at 700 °C for 5 h. For the heat treatment applied to the material, a Novatech brand muffle with programmable control was employed.
2.2. Physical Characterization
For the crystalline phase analysis of MgSb2O6 oxide calcinated at 700 °C, a Panalytical Empyream diffractometer was employed. In this case, during the experiments, a Cuα radiation with 1.5406 Å wavelength (λ) was applied along with a continuous sweep (2θ) of 10 to 70° at a 0.026 step with a rate of 1 s/step. The microstructural characteristics, such as particle size and component morphology, were measured with a means of field-emission scanning electron microscopy (FE-SEM) using a Tescan MIRA 3 LMU system with an acceleration voltage of 10 kV in high vacuum.
2.3. Gas Measurement Tests
Thick films were prepared by considering 0.4 g of MgSb2O6 powder generated by the synthesis process and calcinated at 700 °C. These powders were dispersed and deposited via drip method within the interior of a circular ceramic ring placed over a ceramic base containing four ceramic mini columns in which electrodes with platinum thread of high purity (0.006 mm diameter) were installed to have contact with the thick film (0.5 mm thick by 2 mm in diameter). The films were placed within a quartz tube installed in a tubular Lindberg/blue oven with programable temperature control. The flow control of gases argon‒O2, air‒C3H8, and air‒CO2 was developed with Brooks Instruments mass regulator types GF100CXXC-SH452.6L (2600 cm3/min) and GF100CXXC‒SH40010C (10 cm3/min). The electrical resistance changes of the test gas films were measured with a multimeter (Agilent 4263B, Guadalajara, Mexico). The system where these experiments were performed was controlled with LabView 8.6 (National Instruments, Austin, TX, USA). Figure 1 illustrates the system employed to electrically characterize the gas sensor.
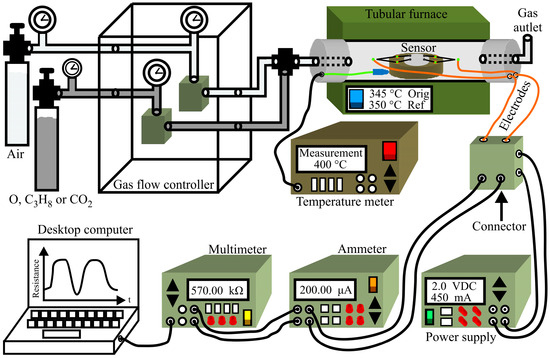
Figure 1.
Schematic diagram of the measurement system employed to test the flux dynamics of argon‒O2, air‒CO2, and air‒C3H8 at 300 and 350 °C.
3. Results
3.1. XRD Analysis
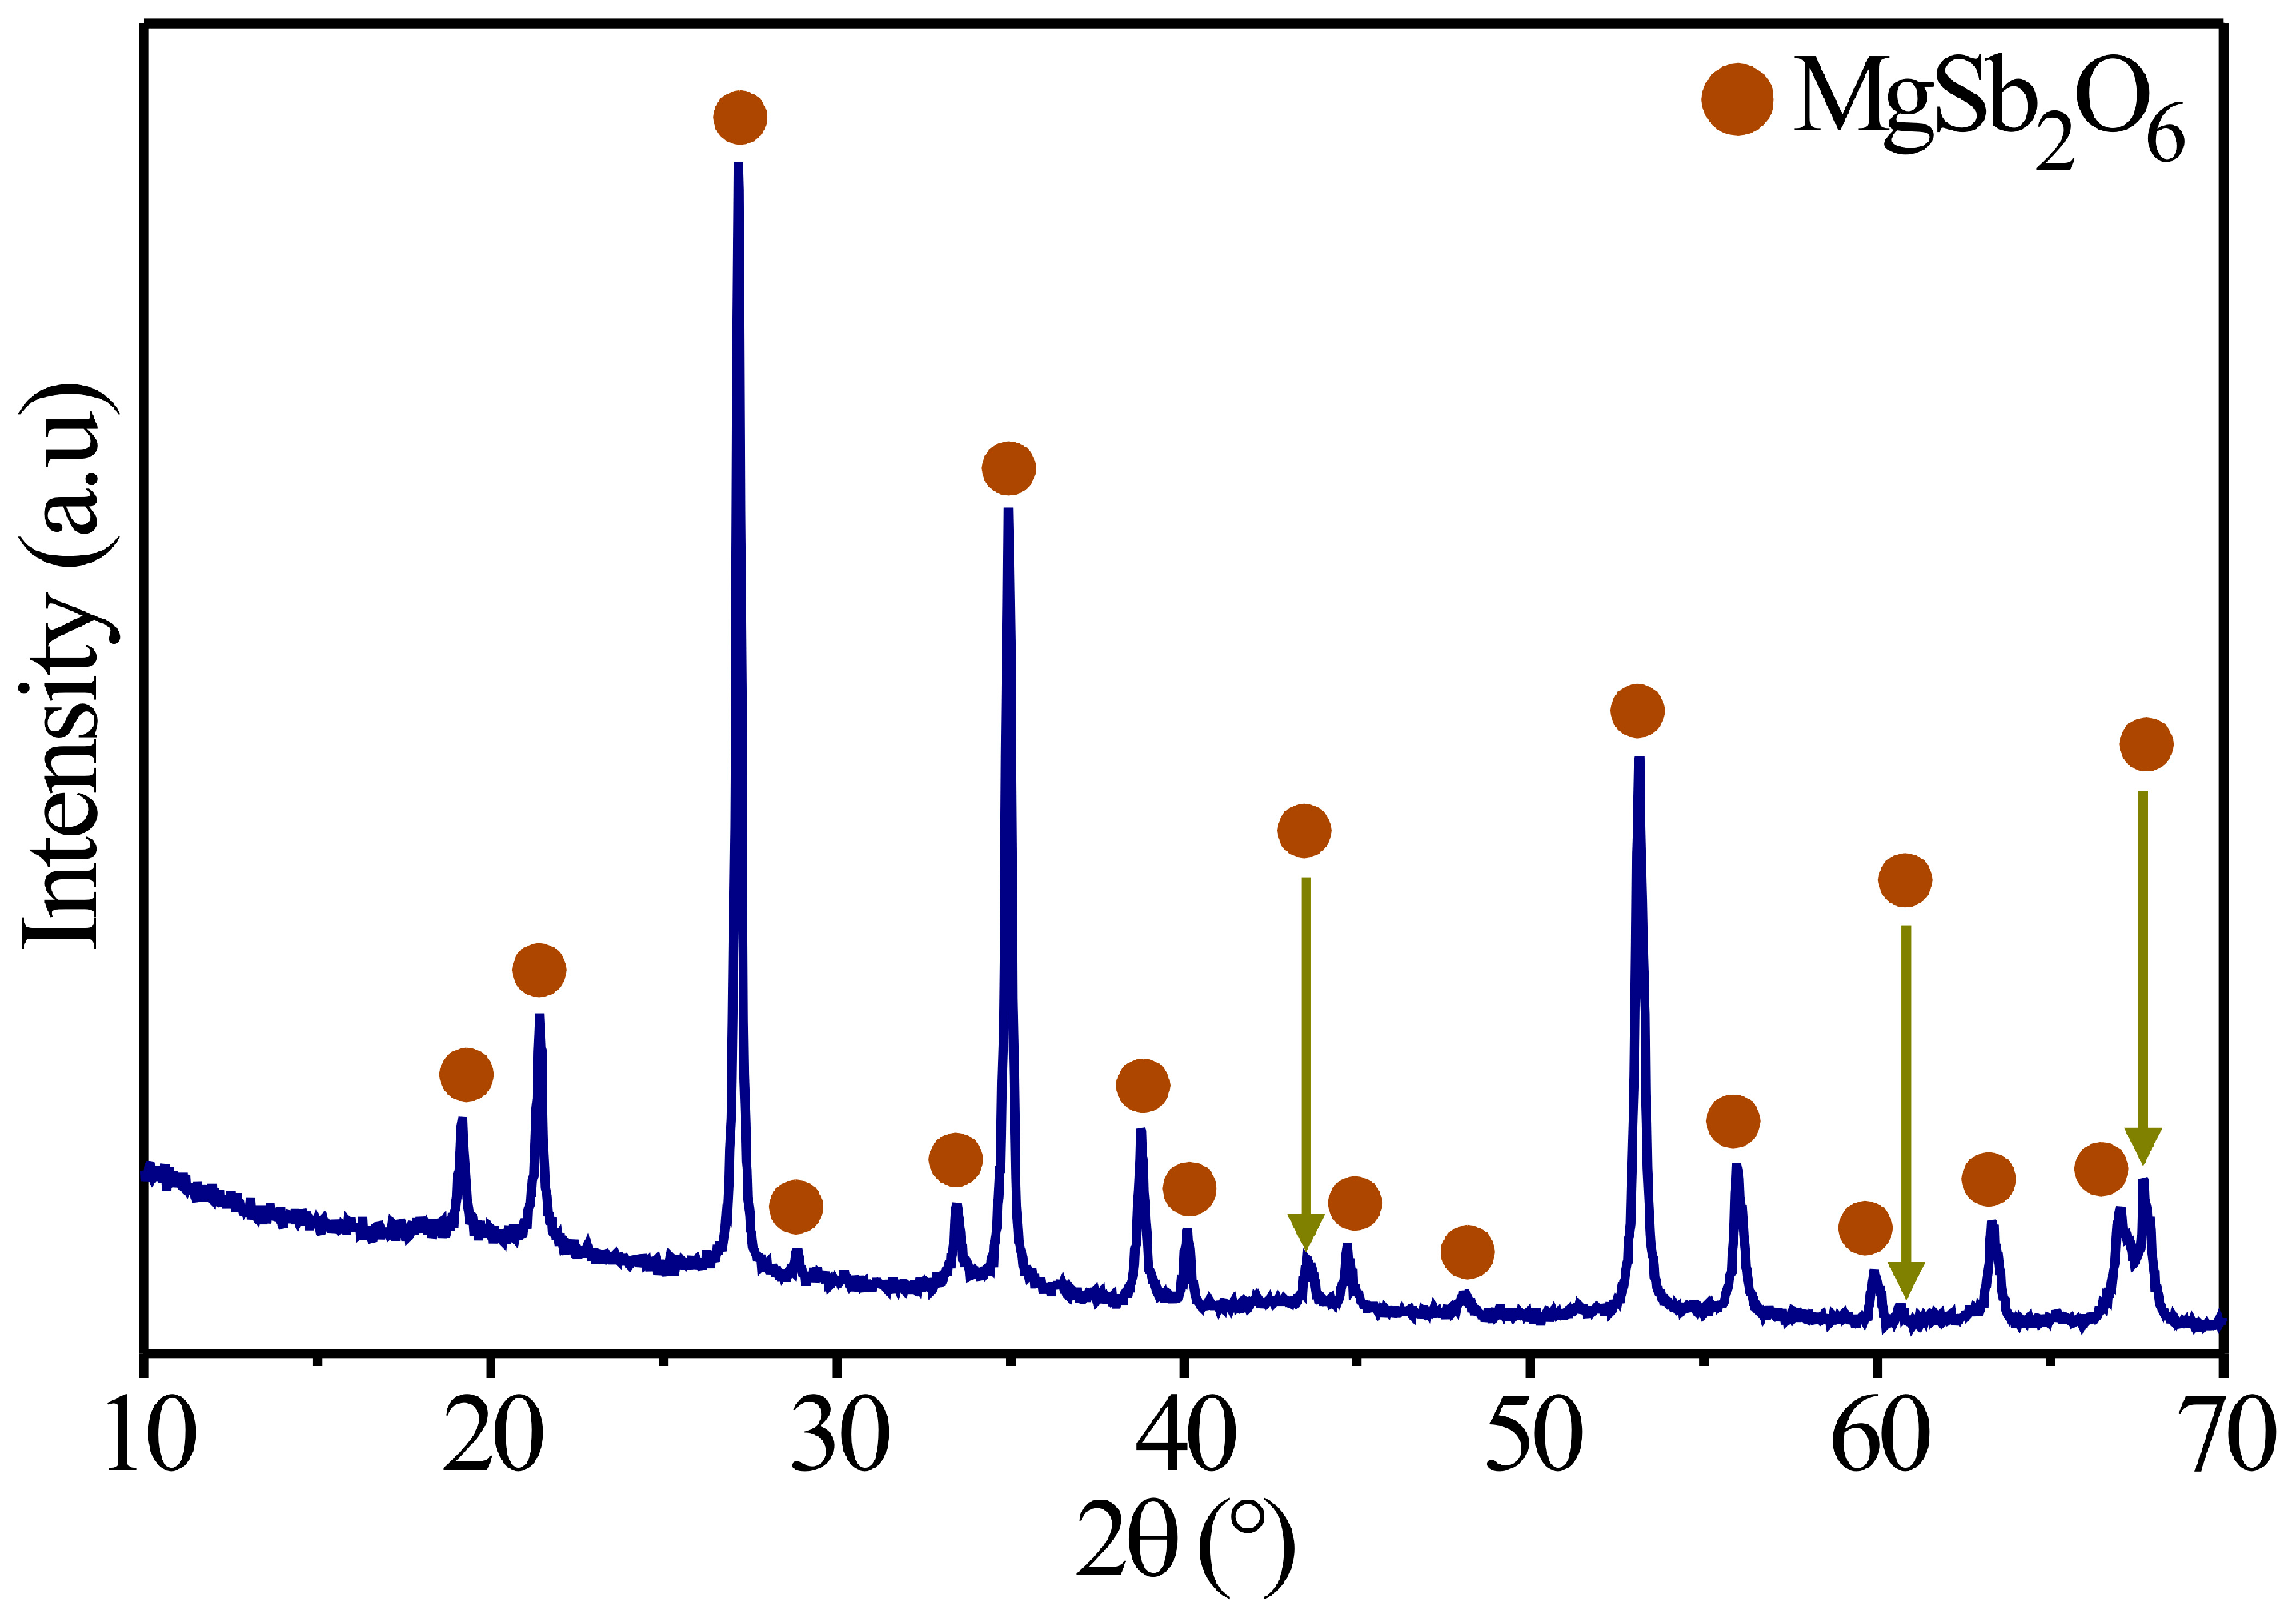
Several authors have reported employing different synthesis methods to obtain inorganic oxides with a trirutile structure. For example, Mizoguchi and Woodward prepared a series of trirutile oxides, such as ZnSb2O6, SrSb2O6, BaSb2O6, and CdSb2O6, by following the solid-state reaction method, acquiring the structural phase at high temperatures [27]. Likewise, Larcher et al. synthetized materials such as ASb2O6 (A: Ni, Cu, and Co), deploying the same preparation (ceramic method) and obtaining the trirutile phase at 800 °C [28]. Meanwhile, Michel et al. obtained CoSb2O6 oxide via the solution–polymerization method at 700 °C [29]; more recently, in [30], the oxide is synthetized by employing a wet chemistry process, obtaining the crystalline phase at 700 °C. With this in mind, the magnesium antimoniate (MgSb2O6) was synthesized in this study following the colloidal method assisted by microwave radiation. The synthesis results are displayed in Figure 2, where the diffractogram obtained at 700 °C is presented. In this X-ray diffraction pattern, the presence of peaks corresponding to the crystalline phase of MgSb2O6 (700 °C) is verified. These were identified with PDF file No. 88-1725. According to this comparison against the database, MgSb2O6 oxides belong to the family of materials with a trirutile crystalline structure and adopt a tetragonal structure with a spatial group of P42/mnm [30,31,32]. Likewise, an indexation was made from the compound and then compared to the database file (PDF No. 88-1725). It was found that the parameters of the crystalline mesh of MgSb2O6 are a = 4.64 Å and c = 9.25 Å, respectively. These results (Figure 2) are consistent with those reported in the literature for the MgSb2O6 oxide [30,31,33] or similar trirutile crystalline structures (CoSb2O6, NiSb2O6, BaSb2O6, and ZnSb2O6, among others) as those cited beforehand [28,29].
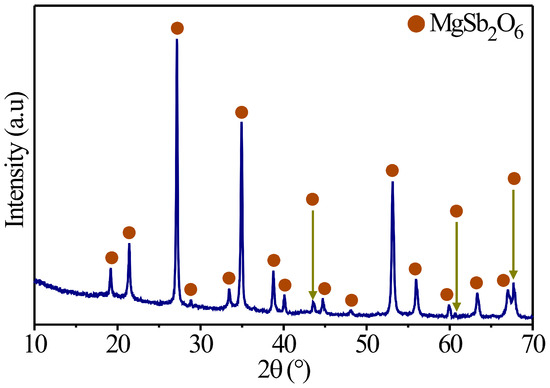
Figure 2.
X-ray diffraction patterns of the MgSb2O6 trirutile oxide calcinated at 700 °C in air.
On the other hand, taking into consideration the peaks of the X-ray diffraction pattern calcinated at 700 °C (Figure 2), the crystal size was estimated by applying Scherrer’s equation [34]: , where λ is the radiation’s wavelength (Cu = 1.5406 Å), β is the peak’s width measured at half of the maximum intensity, and θ is Bragg’s angle. To perform this calculation, all the peaks of the diffractogram at 700 °C were considered, obtaining a crystal size of approximately ~34.4 nm.
3.2. SEM Analysis
In Figure 3, three typical images illustrating the surface of MgSb2O6 synthetized using the colloidal method and calcinated at 700 °C are presented. To perform an analysis of the compound microstructure, it was necessary to employ different magnifications. In respect to Figure 3a (14.7 kx), the surface of MgSb2O6 is presented in a general manner, and the growth of different types of morphologies can be appreciated. According to this image, there is the presence of microsheets of 1 to 2 μm and irregular microparticles (similar to boulders) with a size of 3 to 4 μm, along with the growth of microrods of different sizes. The microrods seem to grow over microbuses of greater size dispersedly, oriented to different directions. These characteristics can be appreciated in Figure 3b, corresponding to the magnification of 54.8 kx. Additionally, these microrods are developed over particles of greater size, which are found in the surroundings of this morphology. It was not possible to analyze the surface of the microbase where the microrods are growing due to the low magnification employed to study this type of particles on the part of the surface (Figure 3b). Observing other areas of the oxide’s (MgSb2O6) surface, in Figure 3c, with a 58.8 k magnification, it could be proved that a majority of the compound is constituted by a grand variety of irregular particles and microrods of different sizes and diameters. Most of the microrods and the conglomeration of small particles (with no apparent form) seem to originate in a point in common due to the effect of the temperature and the ethylenediamine applied during the synthesis. The diameter of the microrods was estimated to be ~0.1 μm, while the size of the morphologies was calculated between the range of 0.08 to 0.24 μm, with a mean value of ~0.147 μm and a standard deviation of ~±0.036 μm (Figure 3d), approximately.
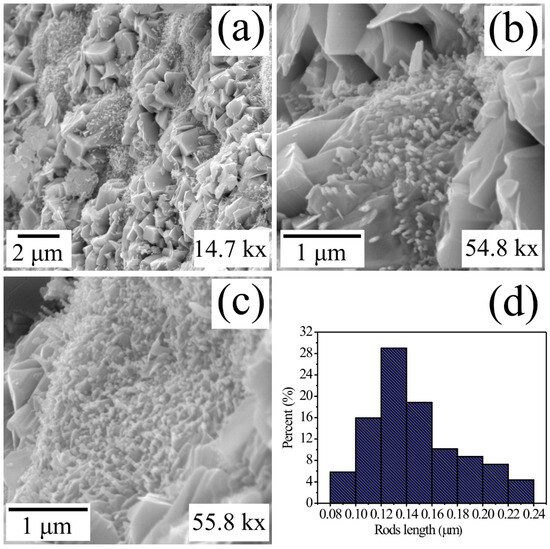
Figure 3.
Typical SEM images of the MgSb2O6 oxide microstructure calcinated at 700 °C analyzed at magnifications of (a) 14.7 kx, (b) 55.8 kx, (c) 54.8 kx, and (d) microrod size distribution histogram.
The growth and development of this type of microstructure (Figure 3) is attributed to the chemical reaction that takes place between solid materials and the concentration of ethylenediamine on the muffle caused by the calcination temperature (700 °C). Furthermore, it was observed during the experimentation that the residence time of the material at 700 °C (5 h in this scenario) favored the chemical reaction between the precursor reagents, reacting strongly over the muffle and causing the formation of the microstructure presented in Figure 3. In concordance with the literature, the wet chemistry processes and the application of ethylenediamine play a very important role in the particle size, along with nucleation and growth of different morphologies [33,34]. For example, Matijevic et al. studied the colloidal dispersions of inorganic materials while preparing them using the colloidal method [35]. They reported different sizes and particle morphologies originated by the growth process of the stable kernels in colloidal systems. Likewise, in [30,36,37] wet chemistry processes are applied in presence of ethylenediamine with the purpose of modifying the morphology and particle sizes. These authors report the growth of long particles (microcolumns, microrods, and nanorods) in compounds such as CoSb2O6 and MgSb2O6 for application as gas sensors [30,33,36]. According to these authors, the existence of microrods and microcolumns favors trirutile oxides, such as the one studied in this paper (MgSb2O6), to become great candidates to be employed as gas sensors. In our case, we applied ethylenediamine during the synthesis with the purpose of obtaining morphologies, such as the ones presented in Figure 3, to research their capacity and efficiency to sense atmospheres of O2, CO2, and C3H8.
3.3. Gas Sensing Property Analysis
With the purpose of evaluating the dynamic proportion of MgSb2O6 oxide used as a function of time for its potential application as a gas sensor, the measurements were performed over the surface of a thick film (~0.3 μm thickness and 0.5 μm diameter) in O2, C3H8, and CO2 environments at a constant temperature of 400 °C while applying a direct current (DC) signal of 1 V. The experiments were carried out individually with the objective of studying the dynamic response for each of the test gases.
The processes used to perform the gas (O2, CO2, and C3H8) detection experiments are explained as follows. First, for the measurement in atmospheres, the measurement chamber is supplied with argon streams (560 ppm) for 5 min over the thick films with the intention of stabilizing the surface. Afterward, without retiring the argon stream, the system is injected with 560 ppm of O2 for 5 min, registering any immediate changes in the electric resistance as a function of time. Lastly, the O2 is retired from the measurement system, observing the thick films’ return to their initial electric resistance values with argon stabilization. This process was repeated to observe the reproducibility of the dynamic response and determine the reversibility of the process.
In the case of the detection experiments for C3H8 and CO2, the same methodology previously described for O2 was employed. Nonetheless, the for atmosphere detection of C3H8 and CO2, the thick films were stabilized with extra dry air flows (1500 cm3/min, 21% O2 + 79% N2) for 5 min. Then, afterward, the chamber was injected separately with streams of C3H8 (560 ppm) and CO2 (13,500 ppm) for 5 min, respectively. As in the case with the oxygen (O2) experiments, after stabilizing the thick film surfaces in extra dry air, the moment the streams of C3H8 and CO2 are introduced, an immediate change in the electric response is registered in these environments. When the streams of these test gases (C3H8 and CO2) are retired from the measurement system, the thick films return to the electric resistance values they had when the surface was stabilized with extra dry air, obtaining reversibility in the process of these gases. The experimental results are presented in Figure 4, where the electric resistance variations as a function of time can be verified with the aforementioned experimental parameters.
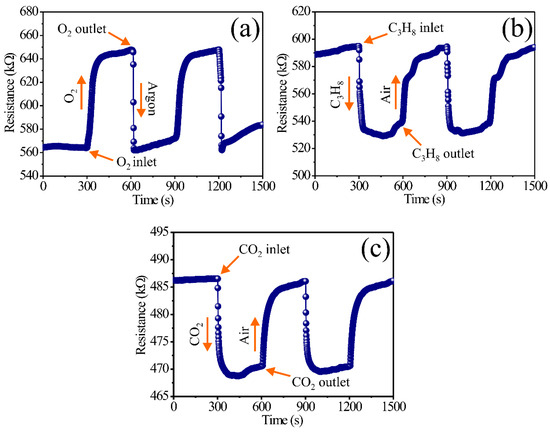
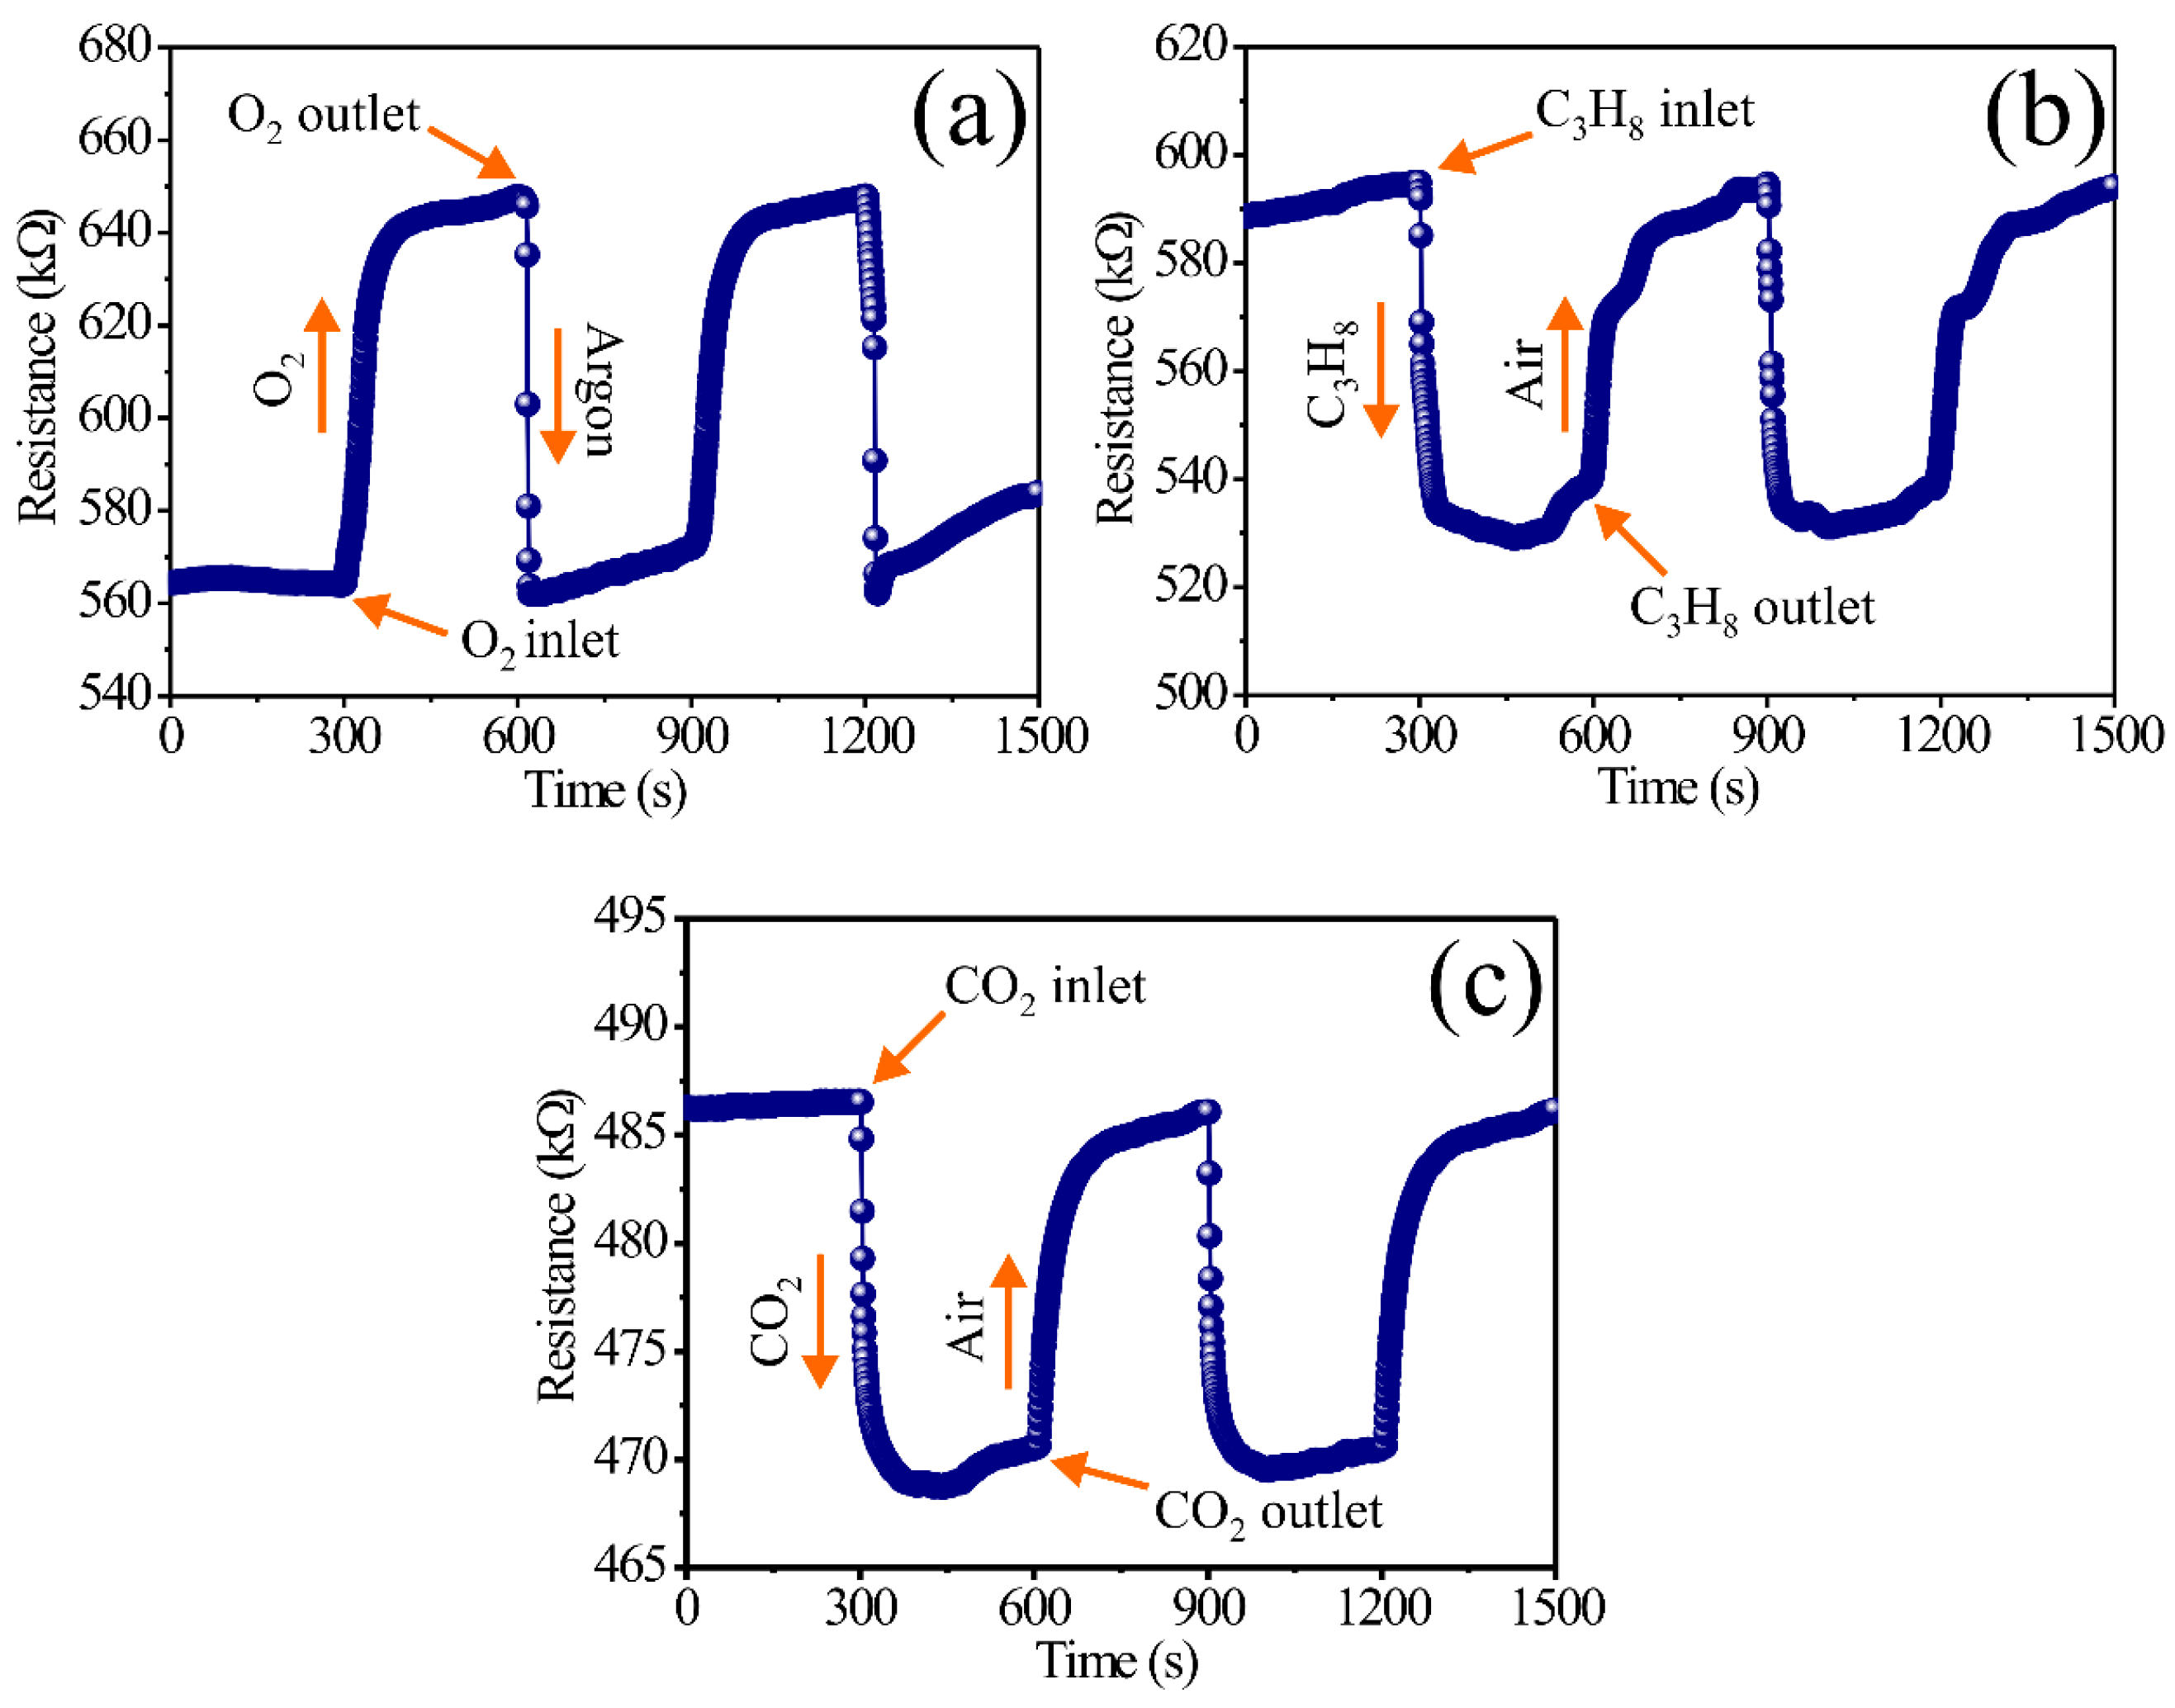
Figure 4.
Dynamic response of the thick films of MgSb2O6 at 400 °C in environments of (a) argon–O2, (b) air–C3H8, and (c) air–CO2.
By analyzing the results in Figure 4a, the reaction of the thick film surfaces to the concentration of O2 is evidenced, obtaining an increment in the electric resistance due to the effect of the operation temperature (400 °C). The great dynamic response in this environment is associated with the effect of the temperature and due to its representation of the adsorption and desorption of oxygen [38] on the film surfaces. Furthermore, the oxygen adsorption on the oxide surface causes interactions between the surface and the conductive band of the compound [39,40]. For a semiconductor type n such as MgSb2O6 [30,32,33], where the electric resistance is incremented in the presence of O2, the adsorption of oxygen species () presents a diminishing of the electric conductivity (or an incrementing in the electric resistance) of the sensor (Figure 4a). These electric resistance increments were estimated between the ranges of 647.8 and 568.0 kΩ, with a mean value of 79.7 kΩ. The response and recovery times for this test gas were estimated according to those reported in [41], where the response is considered with 90% of the gas (O2) and only 10% argon. In this case, the response time was estimated to be 87.6 s, while the recovery time was calculated to be 16.1 s.
A possible mechanism to explain the dynamic response found in Figure 4a is amply studied in [42]. According to these authors, the electric resistance changes depend on the temperature and the oxygen species found during the experiments. In particular, when the measurements are performed in temperatures higher than 150 °C (400 °C in this case), the oxygen species present the ionic shapes of and [34,38,41,42]. These oxygen species are highly reactive in comparison to others found when measurements are performed in temperatures under 150 °C () [30,34]. The reaction of these highly reactive ionic oxygen shapes promotes an increment in the displacement of the material load charges (electrons) [33,42]; as a consequence, the dynamic response of the thick films of MgSb2O6 (see Figure 4a) is substantially enhanced. These results are consistent with those reported in [30,33,34,43], where semiconductive type n oxides are researched for their application as oxygen sensors.
In the case of the dynamic response presented in Figure 4b, by interacting with the molecules of C3H8 on the surface of the thick films, this gas reacts with the oxygen () present during the experiments due to the operation temperature (400 °C). The test gas and the oxygen chemisorbed on the surface of the thick films of MgSb2O6 present a large chemical reaction, inducing the oxidation of C3H8, along with major mobility of the oxide load charges (electrons) [44], thus provoking a diminishment in the electric resistance (or an increment in the conductivity) of the material. According to the literature, the dynamic response of a material under C3H8 environments such as the one studied in this paper depend greatly on the operation temperature that makes the oxygen species ( and ) react [33,34,38], which are remarkably reactive at high temperatures (400 °C in this study). The chemical reaction between C3H8 and the highly reactive species causes an elevated amount of energy that favors the formation of CO2 molecules and H2O vapor, along with an electron liberation on the semiconductor [30,45]. This mechanism (C3H8 + 10O2− → 3CO2 + 4H2O + e− [30,46]) presented during the on air–C3H8 experiments produces a decrement in the electric response in this atmosphere.
The electric resistance value changes obtained in these experiments were calculated between the range of 593.6 and 530.1 kΩ, with a mean value of 63.4 kΩ. As in the case of the oxygen measurements, the response times were calculated considering 90% of the response on C3H8 and 10% on air. For the dynamic response of this gas (C3H8), the response time was estimated at 23.5, along with a recovery time of 196.9 s. This behavior of a dynamic response, such as the others previously described in Figure 4b, is commonly reported in the literature for materials such as the one (MgSb2O6) researched in this study or other similar compounds (CoSb2O6, ZnSb2O6) [36,40]. For example, the authors of [30,33] report an acceptable dynamic response and high sensibility for MgSb2O6 oxide, applying concentrations of propane at different voltage signals under 400 °C. According to this author, the application of an operation temperature (400 °C) and the employment of direct current signals during the measurements show that the semiconductor trirutile oxides display good sensibility, stabilization, and efficiency in detecting propane environment, such as it occurred in our experiment (see Figure 4b).
In respect to the results in Figure 4c, the dynamic response of the thick films of MgSb2O6 in CO2 environments is presented. As in the case of C3H8, the material’s electric resistance decreases during the reaction of the CO2 molecules with the oxygen species at 400 °C. The great electrical responses registered in the CO2 atmospheres are primordially associated with the good gas diffusion on the films that react chemically with the oxygen species () due to the temperature applied during the experiment. This reaction originated by the temperature produces oxidation with the CO2 () [47] and an increment in thermic energy, which causes a high movement speed on the electrons present at the semiconductor’s surface [48]. Additionally, our research attributes the great dynamic response obtained in CO2 to a very thin carbonate layer forming mechanism present on the thick film surfaces that originates from the reaction of oxygen species () against the test gas [49,50]. The presence of these carbonated layers (that can be monodentate and bidentate) affects the material resistance and the dynamic response as a function of time. It has been experimentally observed that when the flow of CO2 to the measurement chamber is stopped, these carbonated layers are removed when extra dry air flow is introduced to stabilize the thick film surfaces, returning to the electric resistance values found when the surface was stabilized beforehand.
The electric resistance changes obtained in CO2 environments were estimated according to the curves illustrated in Figure 4c. Conforming to these graphics, the changes in electric resistance were estimated in the ranges of 486.3–470.5 kΩ, with a mean value of 15.7 kΩ. The response times were found to be 17.5 s, while the recovery time was 121.2 s. These response and recovery times were calculated by taking into consideration 90% of the electrical resistance change in CO2 and 10% of the value when the material was exposed to air [41]. The obtained results in CO2 atmospheres (Figure 4c) are consistent with those of other semiconductive oxides that have been studied as CO2 sensors [17,18,40,49,50,51].
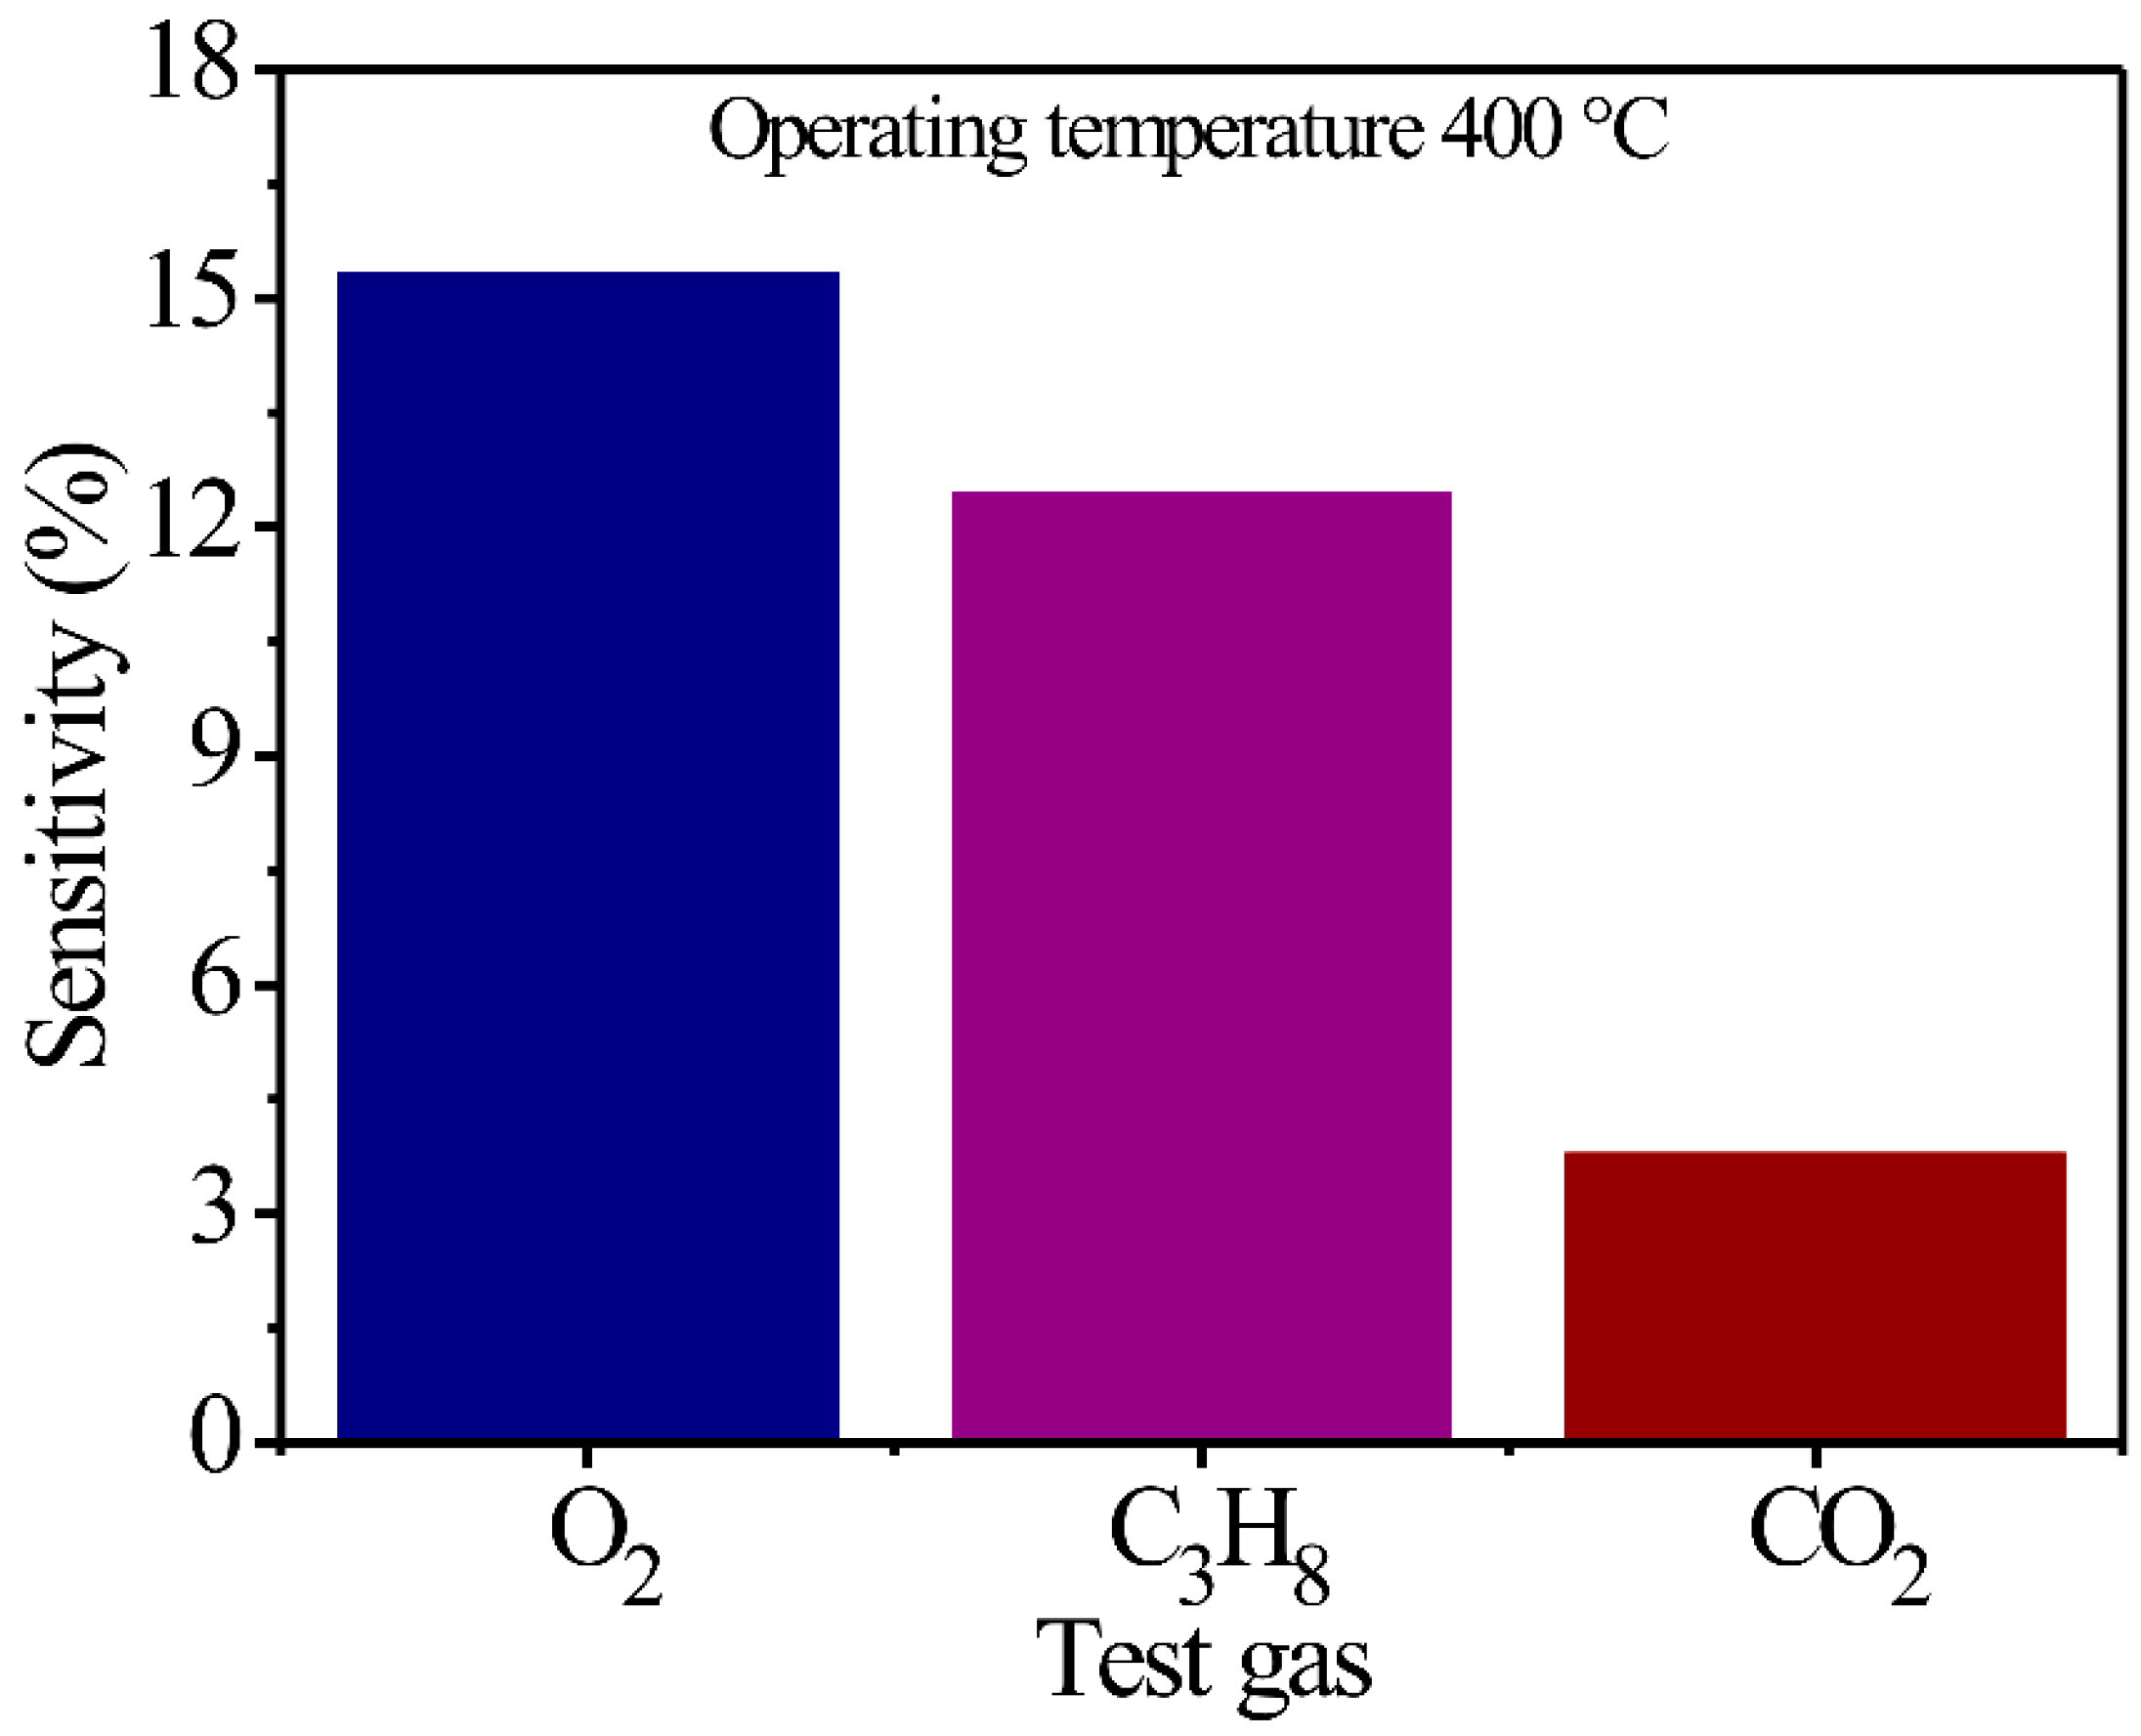
On the other hand, an important parameter for the application of a semiconductor as a potential gas sensor is the selectivity of different types of atmospheres. In Figure 5, a sensibility percentage graphic is presented as a function of O2, C3H8, and CO2 gases and MgSb2O6 thick films. As expected, the thick films display greater sensibility to O2 (15.28%) and C3H8 (12.4%) when compared to CO2 (3.75%) environments that present a lower sensibility percentage. Nonetheless, through several repetitions, it was registered that the compounds maintain better selectivity in O2 environments when compared to C3H8 and CO2 flows. The greater selectivity registered to O2 is attributed to the better diffusion of the oxygen molecules () through the thick film surfaces that this gas presented when the experiments were performed; this favors better chemisorption by the operation temperatures [52,53]. This reaction causes a high energy concentration, which improves the adsorption and desorption processes of oxygen () achieved by the material. Likewise, as an effect of the temperature, greater gas oxidation is presented, contributing to a greater displacement of the load chargers in the sensor’s surface, and with it, a greater selectivity of O2 in comparison to C3H8 and CO2 atmospheres. Although the thick films display a preference for C3H8 detection when compared to CO2, the oxidation of C3H8 is not enough to reach the high sensibility and selectivity that the thick films presented in O2 environments. The literature reports that the partial oxidation of C3H8 molecules caused by temperatures provokes a decrement in the adsorption and desorption capacity of oxygen species () on the material’s surface during the experiments [53,54], contributing to lesser selectivity in gases such as O2 and greater selectivity in gases like CO2. This description can be corroborated by the results presented in Figure 5.

Figure 5.
Selectivity graphics obtained from the thick films of MgSb2O6 at 400 °C in environments of O2, C3H8, and CO2.
Particularly, the excellent dynamic response displayed by MgSb2O6 oxide at 400 °C in the O2, C3H8, and CO2 environments is due to the effect of the temperature employed during the experiments and the microstructural characteristics the compound is constituted by after being calcinated at 700 °C. The particle size (0.147 μm in this study), along with the morphology (microrods), were important factors in obtaining good dynamic response results with this compound. According to the literature, when the fine particle size is reduced, the catalytic sites, along with the superficial area of MgSb2O6, increase [18,54], benefiting the adsorption and desorption of the chemisorbed oxygen and the diffusion of the test gases [17,51,54] across the surface of the thick films of the compound. All of this contributed to obtaining the excellent results illustrated in Figure 4 and Figure 5, respectively.
Moreover, by performing a comparison between the results found in Figure 4 and Figure 5 with other semiconductive oxides studied as potential gas sensors, our study obtained better sensibility, thermic stability, and dynamic responses for O2, C3H8, and CO2. For example, [54] synthetizes manganese antimoniate (MnSb2O6) for potential application as a gas sensor. According to this author, the construction of pellets made using a powder of the compound was reported to obtain a maximum sensibility magnitude of ~0.439 in 550 ppm concentrations of C3H8 at 300 °C.
Likewise, in [55], the semiconductor oxide SnO2 was researched as a potential propane sensor to vary the density of the films. According to this paper, the maximum sensibility magnitudes were ~0.1 for the film with a density of 50 nm. Meanwhile, the films with a density of 100 nm registered a sensibility magnitude of ~0.35. On the contrary, in [40], thick films were prepared to research their dynamic responses in O2 and CO2 environments. In this study, changes in the electric resistance at 400 °C and a possible noise (instability) obtained in the gas detection experiments were reported. Likewise, the authors of [30,33] prepared thick films of MgSb2O6 oxide to detect propane atmospheres at 400 °C. According to the results reported by these authors, the dynamic response of MgSb2O6 was enhanced, and different direct current (DC) signals were applied during the experiments. In our study, greater sensibility and better thermic stability were found in comparison to the reports made in the previously cited references. Furthermore, the dynamic response presented in Figure 4 and Figure 5 is consistent with that found in [30,33,40]. Henceforth, the excellent results presented in this paper indicate that MgSb2O6 can be employed as a gas sensor in O2, C3H8, and CO2 environments.
3.4. Sensor Resistance
Based on Figure 4, the material responds electrically different for each gas, and its performance can be estimated by a first-order system, which the following equation illustrates [56]:
Equation (1a) corresponds to the electrical behavior of the sensor when exposed to air; meanwhile, Equation (1b) corresponds to the electrical behavior when exposed to a given gas: , , or . In the previous expressions, is the sensor’s resistance due to the presence of air; is the initial resistance, is the gain; is the activation voltage; is the characteristic time; is the sensor electrical response when exposed to each gas , , or ; and is the exposition time. For greater time values, the term is approximately ; therefore, Equation (1) takes the following form:
where its derivate was solved. Given the interest is the detection of propane , oxygen , and carbon dioxide gases, Equation (2b) is as follows expressed for each gas:
is the resistive behavior of the sensor based in the oxide when exposed to , is the resistive performance when exposed to , and is the resistive behavior when the sensor is exposed to .
In Figure 4a, employing the electrical response of the sensor within a period of time between 300 and 900 s and an activation voltage of , the , parameters have the values of and . Based on Figure 4b, and were measured when the sensor resistance was between 600 and 1200 s and . Lastly, in Figure 4c, the and values were determined when the sensor resistance was measured between an interval of 600 to 1200 s and . Substituting the parameters in Equation (3) and resolving at 3 s, the sensor resistance will be as follows:
These resulting values are employed in the development of the gas-detecting device.
3.5. Sensor Signal Adaptation and Resolution
In gas detection devices, the resolution plays a critical role, as it defines the minimum detectable variation. To avoid relying on statistical analysis, which is often required due to the random nature of noise, our study focuses on the sensor characteristics, the signal adaptation circuit, and the parameters of the analog-to-digital converter (ADC) integrated into the microcontroller. Figure 6 presents the electronic diagram of the signal adaptation circuit, which interfaces the sensors with the microcontroller.
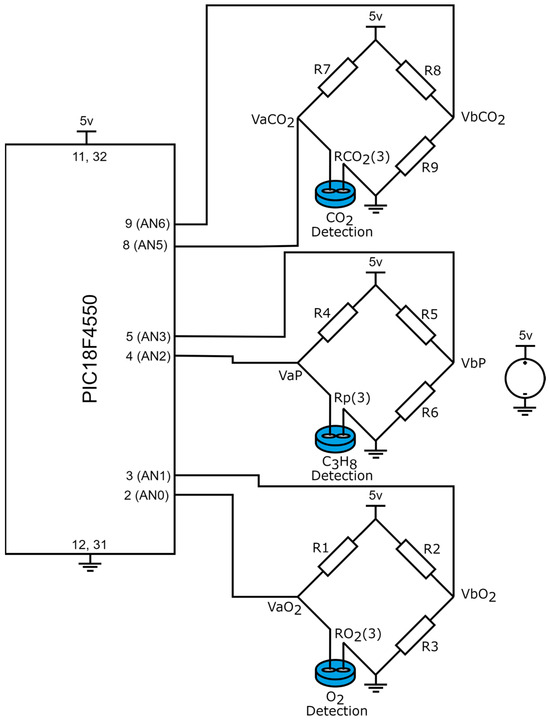
Figure 6.
Wheatstone bridges employed for the signal adaptation between the sensors and the microcontroller.
Based on Figure 6, the signal adaptation between the sensors and the microcontroller is achieved through Wheatstone bridges. When no gas is detected in the monitored environment, the bridges remain balanced, resulting in a potential difference of zero across all Wheatstone bridges.
where are the output voltages of the Wheatstone bridge applied in the detection of , and the input signals for the PIC18F4550 microcontroller (analog inputs AN0 and AN1 from port A); , are the output voltages of the Wheatstone bridge employed in the detection of and are the output signals in port A of the PIC18F4550 microcontroller (analog inputs AN2 and AN3); are the output voltages of the Wheatstone bridge applied in the detection of and are the input signals of port E of the PIC18F4550, analog inputs AN5 and AN6. In this case, equalities , , are satisfied. However, when the sensor detects the presence of gas in the environment, its resistance decreases, causing an imbalance in the Wheatstone bridge. Consequently, the output voltages are calculated as follows:
given is the resistance variation of the sensor when the presence of is detected, is the resistance variation when propane gas is detected, and is the resistance variation when is detected by the sensor.
On the other hand, the analog to digital converter transforms an analog voltage value into a binary state, which is proportional in concordance to a voltage range and a number of bits. Therefore, given the analog voltage range of the PIC18F4550 is within the interval of 0 to 5 volts and its analog to digital converter (ADC) is of bits, then the minimum voltage measurable by the microcontroller is
Combining Equations (6) and (7), we can obtain
Taking the right side of the equalities, it is reached that
Developing Equation (9), it is obtained that
As observed, the Wheatstone bridge is initially balanced, the conditions , and are satisfied, and if these conditions are taken in consideration in (10), the equation takes the following shape:
Clearly, the resolution is a function of the number of bits of the microcontroller and the gas sensor resistance. Given the PIC18F4550 microcontroller has ADCs of bits, the resolution is
where the minus sign is interpreted as a decrement in the sensor gas resistance. Substituting the values of Equation (4) in (12), the minimum measurable resistance is
, , and are the device resolutions in terms of resistance, and their values correspond to the minimum measurable resistance for the gas sensor.
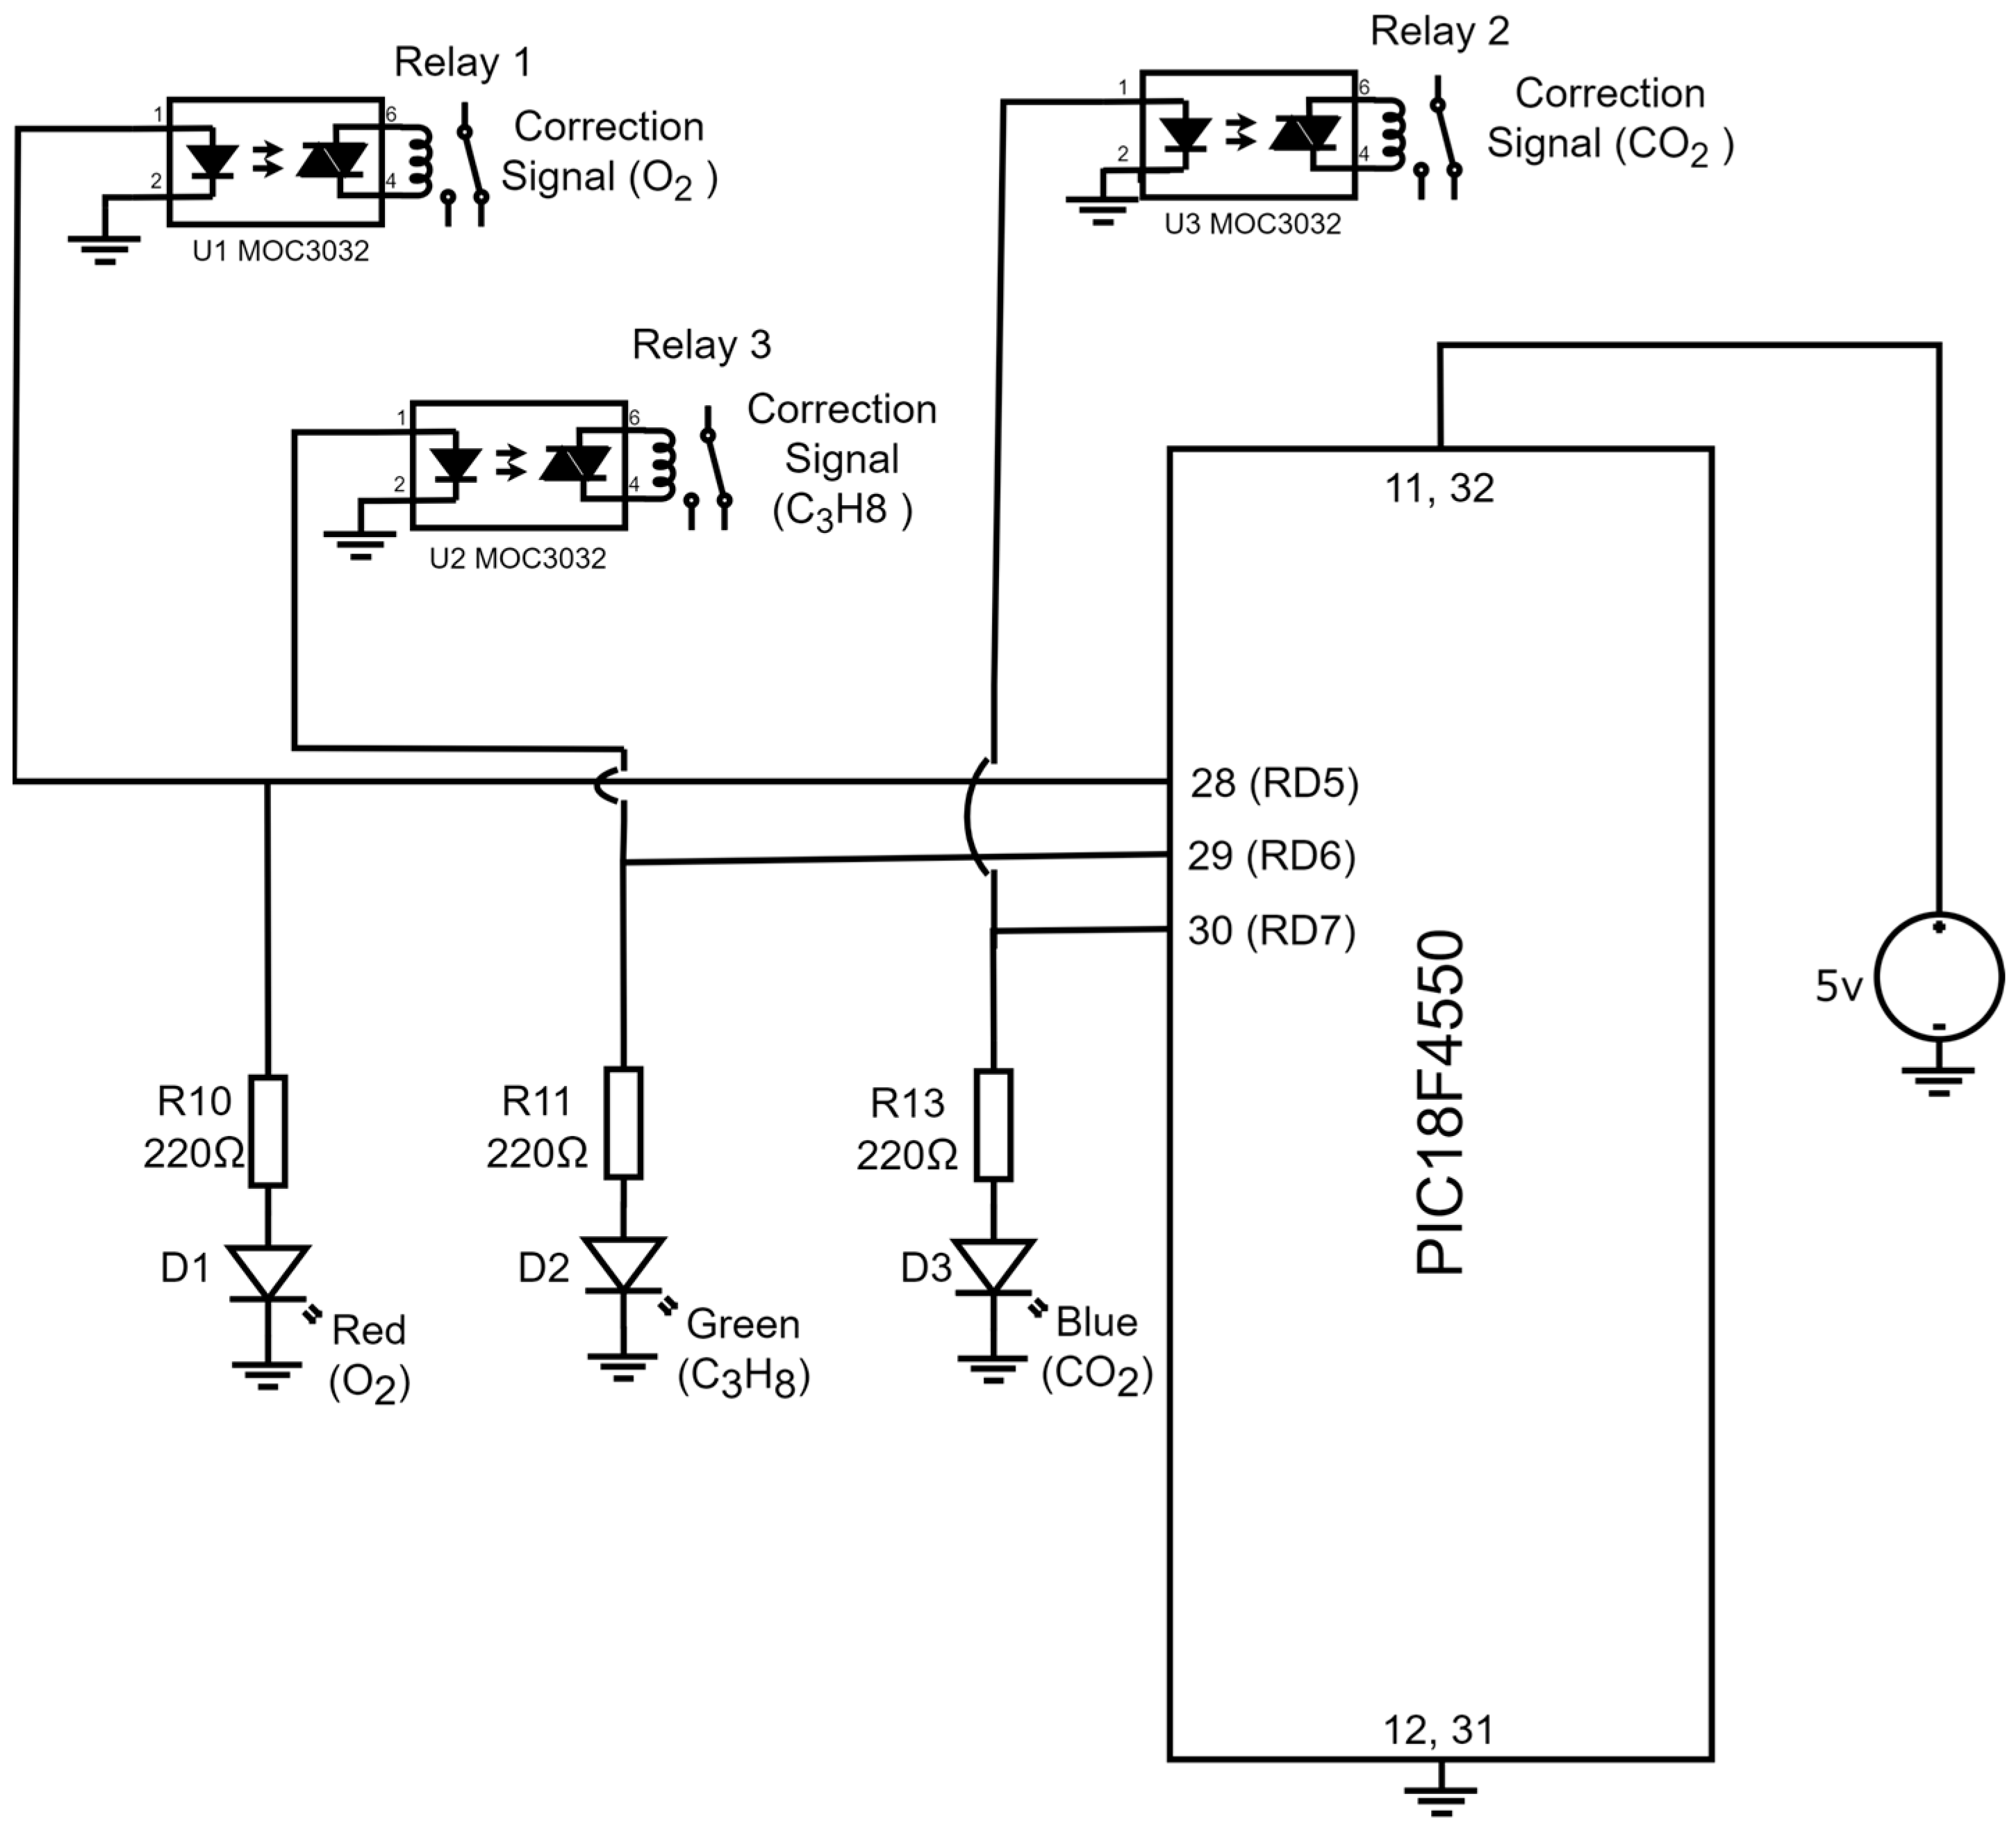
3.6. Output Signals: Correction and Indicators
If a device is capable of detecting the presence of toxic gases in the environment, it is desirable for said device to generate a correction signal that can be deployed to close a solenoid valve that, in turn, eradicates the sources of the toxic gas in the process. Furthermore, it is also desirable to place diodes indicating the device detected the presence of toxic gases within the environment. Figure 7 illustrates the electronic diagram for the corrective signals and the indicator lights.
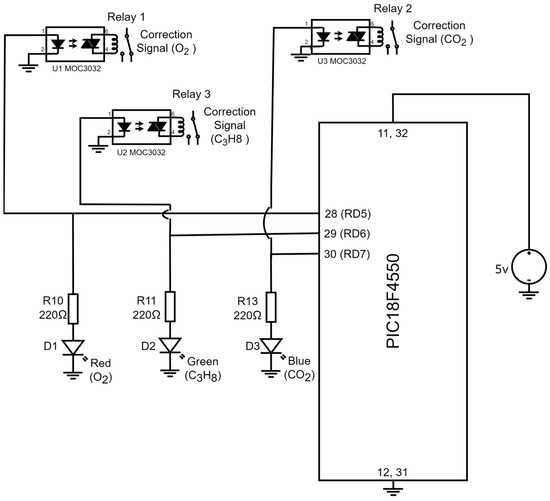
Figure 7.
Electronic diagram employing the corrective activation signals and the indicator lights (diodes).
The output signals of the PIC18F4550 microcontroller are in port D and are named RD5, RD6, and RD7. When the device detects the presence of , the digital output signal RD5 is activated and has a logical equivalent to 5V, which energizes a led diode (terminals 1 and 2) of U1 MOC3022, and with the emitted light from the led diode, a triac (terminals 4 and 6) of U1 MOC3022 is activated. The triac terminals are connected to a relay coil (R1) that has contacts employed to generate a correction signal for . Additionally, the digital signal initiates a circuit confirmed by a resistance R10 = 220 and a red led diode (D1) with a function to indicate that the device detected the presence of . On the other hand, if the device detects , the microcontroller activates a logic (5 V) in the digital output RD6. With the 5 Volts, a led diode (terminals 1 and 2) of U2 MOC3022 is energized, and its light triggers a triac (terminals 4 and 6) of U2 MOC3022. In this case, the triac terminals are connected to a relay coil (R2) anew and its contacts are deployed to generate the corrective signal for . Furthermore, the remaining voltage in terminal RD6 initiates a serial circuit confirmed by an R11 = 220 and a green led diode (D2). The light of the D2 diode indicates that the presence of was detected in the environment. Lastly, in the case the device detects the presence of , port D of the PIC18F4550 microcontroller assigns a logic (5V) to terminal RD7; the 5V activate a blue indicator led diode (D3) connected serially with R12 = 220 Ω resistance. It is worth noting that the function of this diode is to indicate that the device detected the presence of . Additionally, the voltage in terminal RD7 activates a led diode in the third U3 MOC3022 (terminals 1 and 2), which has emitted light that triggers a triac from the very same U3 MOC3022 (terminals 4 and 5); the triac terminals are connected to a relay coil (R3), and its contacts are employed to produce a corrective signal for . Table 1 displays the states of the corrective signals and the indicator lights based in the gas detection conditions for , , and .

Table 1.
Corrective signal activation and indicator diodes based in gas detection conditions.
3.7. System Configuration
The gas device is capable of detecting the presence of one, two, or three gases simultaneously. Its operation is based on the configurations of three switches, , , and , which generated the digital input signals of the PIC18F4550 microcontroller in port B, RB5, RB6, and RB7. Figure 8 showcases the connection of the switches and the microcontroller.
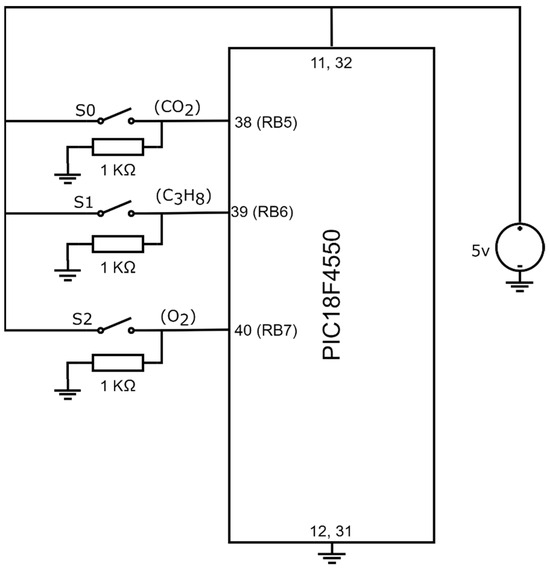
Figure 8.
Connection between switches , , and with PIC18F4550.
Observing Figure 8, the system configuration employs three switches, and their states define the system configuration, as indicated in Table 2.
Table 2.
Switch configuration used to specify the gases detected by the device.
As denoted in Table 1, the device will detect the number of gases according to the states of the switches, opened or closed:
: the device is habilitated to detect .
: the device is habilitated to detect .
and : the device is habilitated to detect and .
: the device is habilitated to detect .
and : the device is habilitated to detect and .
and : the device is habilitated to detect and .
and and : the device is habilitated to detect , , and .
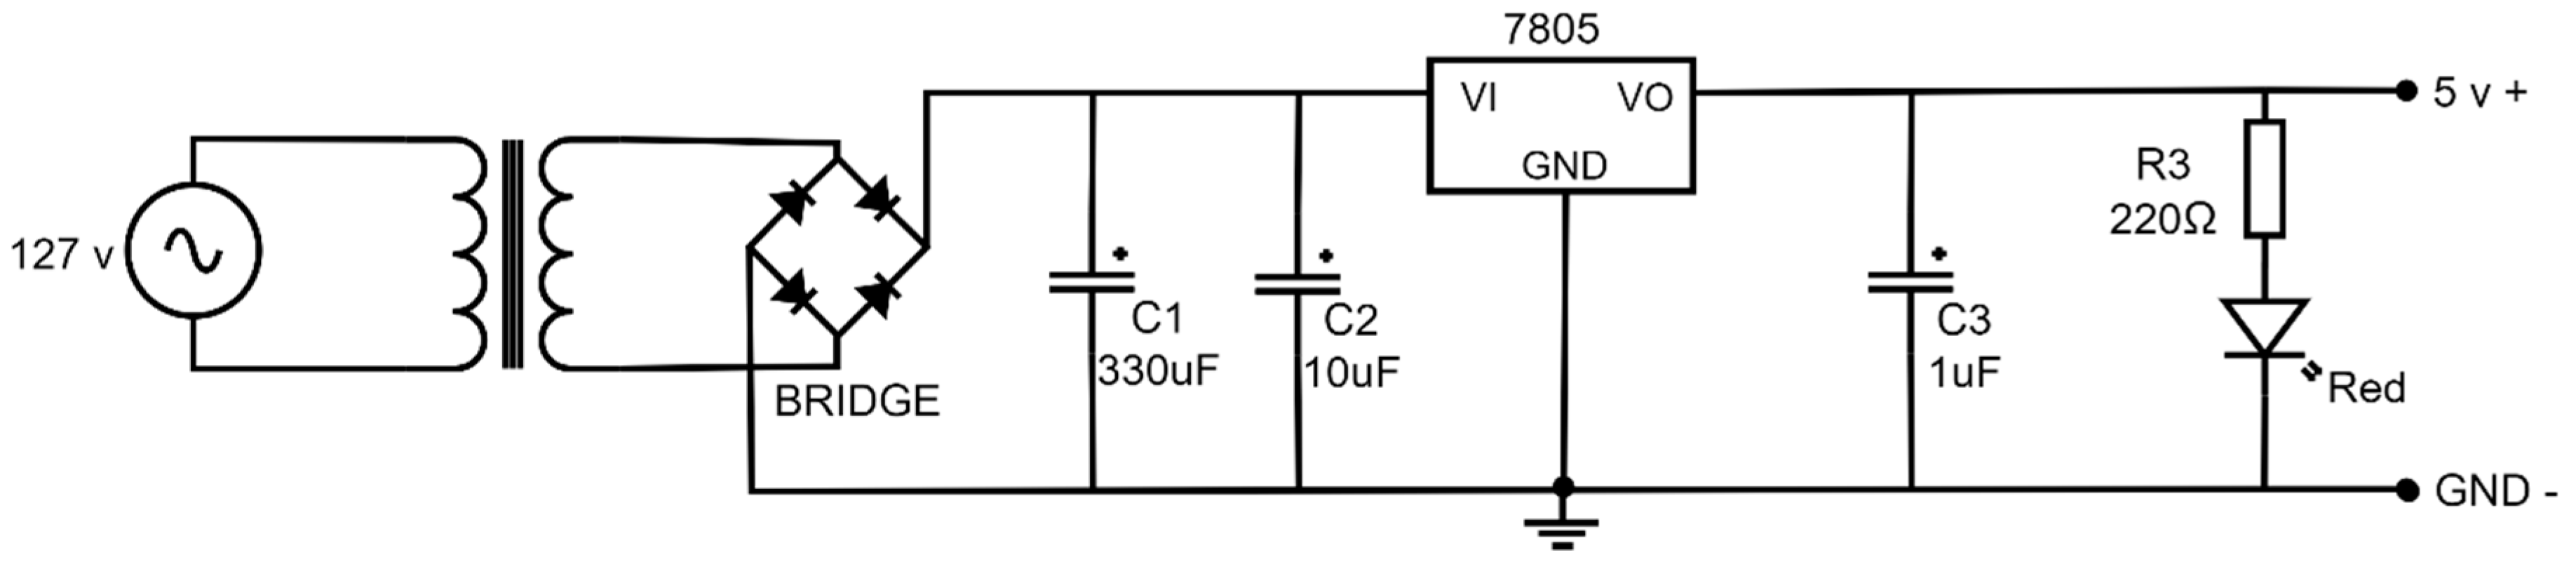
3.8. Power Source
Figure 9 presents an electronic diagram of the power source with a voltage of 5 Volts. It consists of a socket, a voltage step-down transformer of 127 Volts to 9 Volts, a diode bridge conformed by four rectifying diodes of 1N4007, a 330 μF (C1 = 330 μF) capacitor, a 10 μF (C2 = 10 μF) capacitor and a 1 μF (C3 = 1 μF) capacitor, a 220 Ω (R3 = 220 Ω) resistance, a light emission diode (led), and an LM7805 voltage regulator. The output current of the power source is sufficient to support the device power without heating the transformer or other electronic devices.

Figure 9.
Electric diagram of the power source 127 v AC to 5 v DC.
In the power source, the primary winding of the transformer is connected to the 127-volt supply line through a socket, while the secondary winding provides an output voltage of 9 volts. The secondary is connected to a diode bridge, which rectifies the alternating current (AC) signal to produce a direct current (DC) signal containing only the positive half-cycles. The rectified signal is then passed through parallel capacitors C1 and C2 for filtering. Finally, the output signal is regulated using an LM7805 regulator. The regulator’s output passes through capacitor C3, followed by a 220 Ω resistor in series with an LED, which lights up to indicate the energized state, yielding a stable output voltage of 5 volts.
3.9. Programming Considerations
The detection system is implemented in a microcontroller, with its programming based on the states of switches S0, S1, and S2; the gas detection status of the sensors; and the microcontroller’s output signals. The gas detection system considers six analog input variables and three digital output variables, as detailed in Table 3. Column 1 presents the number of possible cases, Columns 2–4 correspond to the digital input variables, Columns 5–7 represent the digital output variables, and Column 8 specifies the gas or gases detected according to the switch configurations and gas detection states.
Table 3.
Corrective signal activation based in the gas detection conditions when the device has been configured to detect , , and .
Based in the operation principle and Table 3, the conditions and must be met for the device to detect the presence of ; the conditions and must be satisfied for the device to detect , and, to conclude, the conditions and must be fulfilled for the device to detect . With the aforementioned in consideration, the following pseudocode can be implemented in the microcontroller programming. The pseudocode is shown below:
Input variables ←
Case 1: & &
Output← The device is configured not to detect any gas.
Case 2: & & &
Output← , y ; the device only detects .
Case 3: & & &
Output← , y ; the device only detects .
Case 4: & & & &
Output← , y ; the device only detects and .
Case 5: & & &
Output← , y ; the device only detects .
Case 6: & & & &
Output← , y ; the device only detects and .
Case 7: & & & &
Output← , y ; the device only detects and .
Case 8: & & & & &
Output← , y ; the device detects , , and .
Note: the symbol & is a logic operator representing “and”.
The pseudocode was designed while taking in consideration the eight cases for gas detection, where the switch conditions and inequalities play important roles.
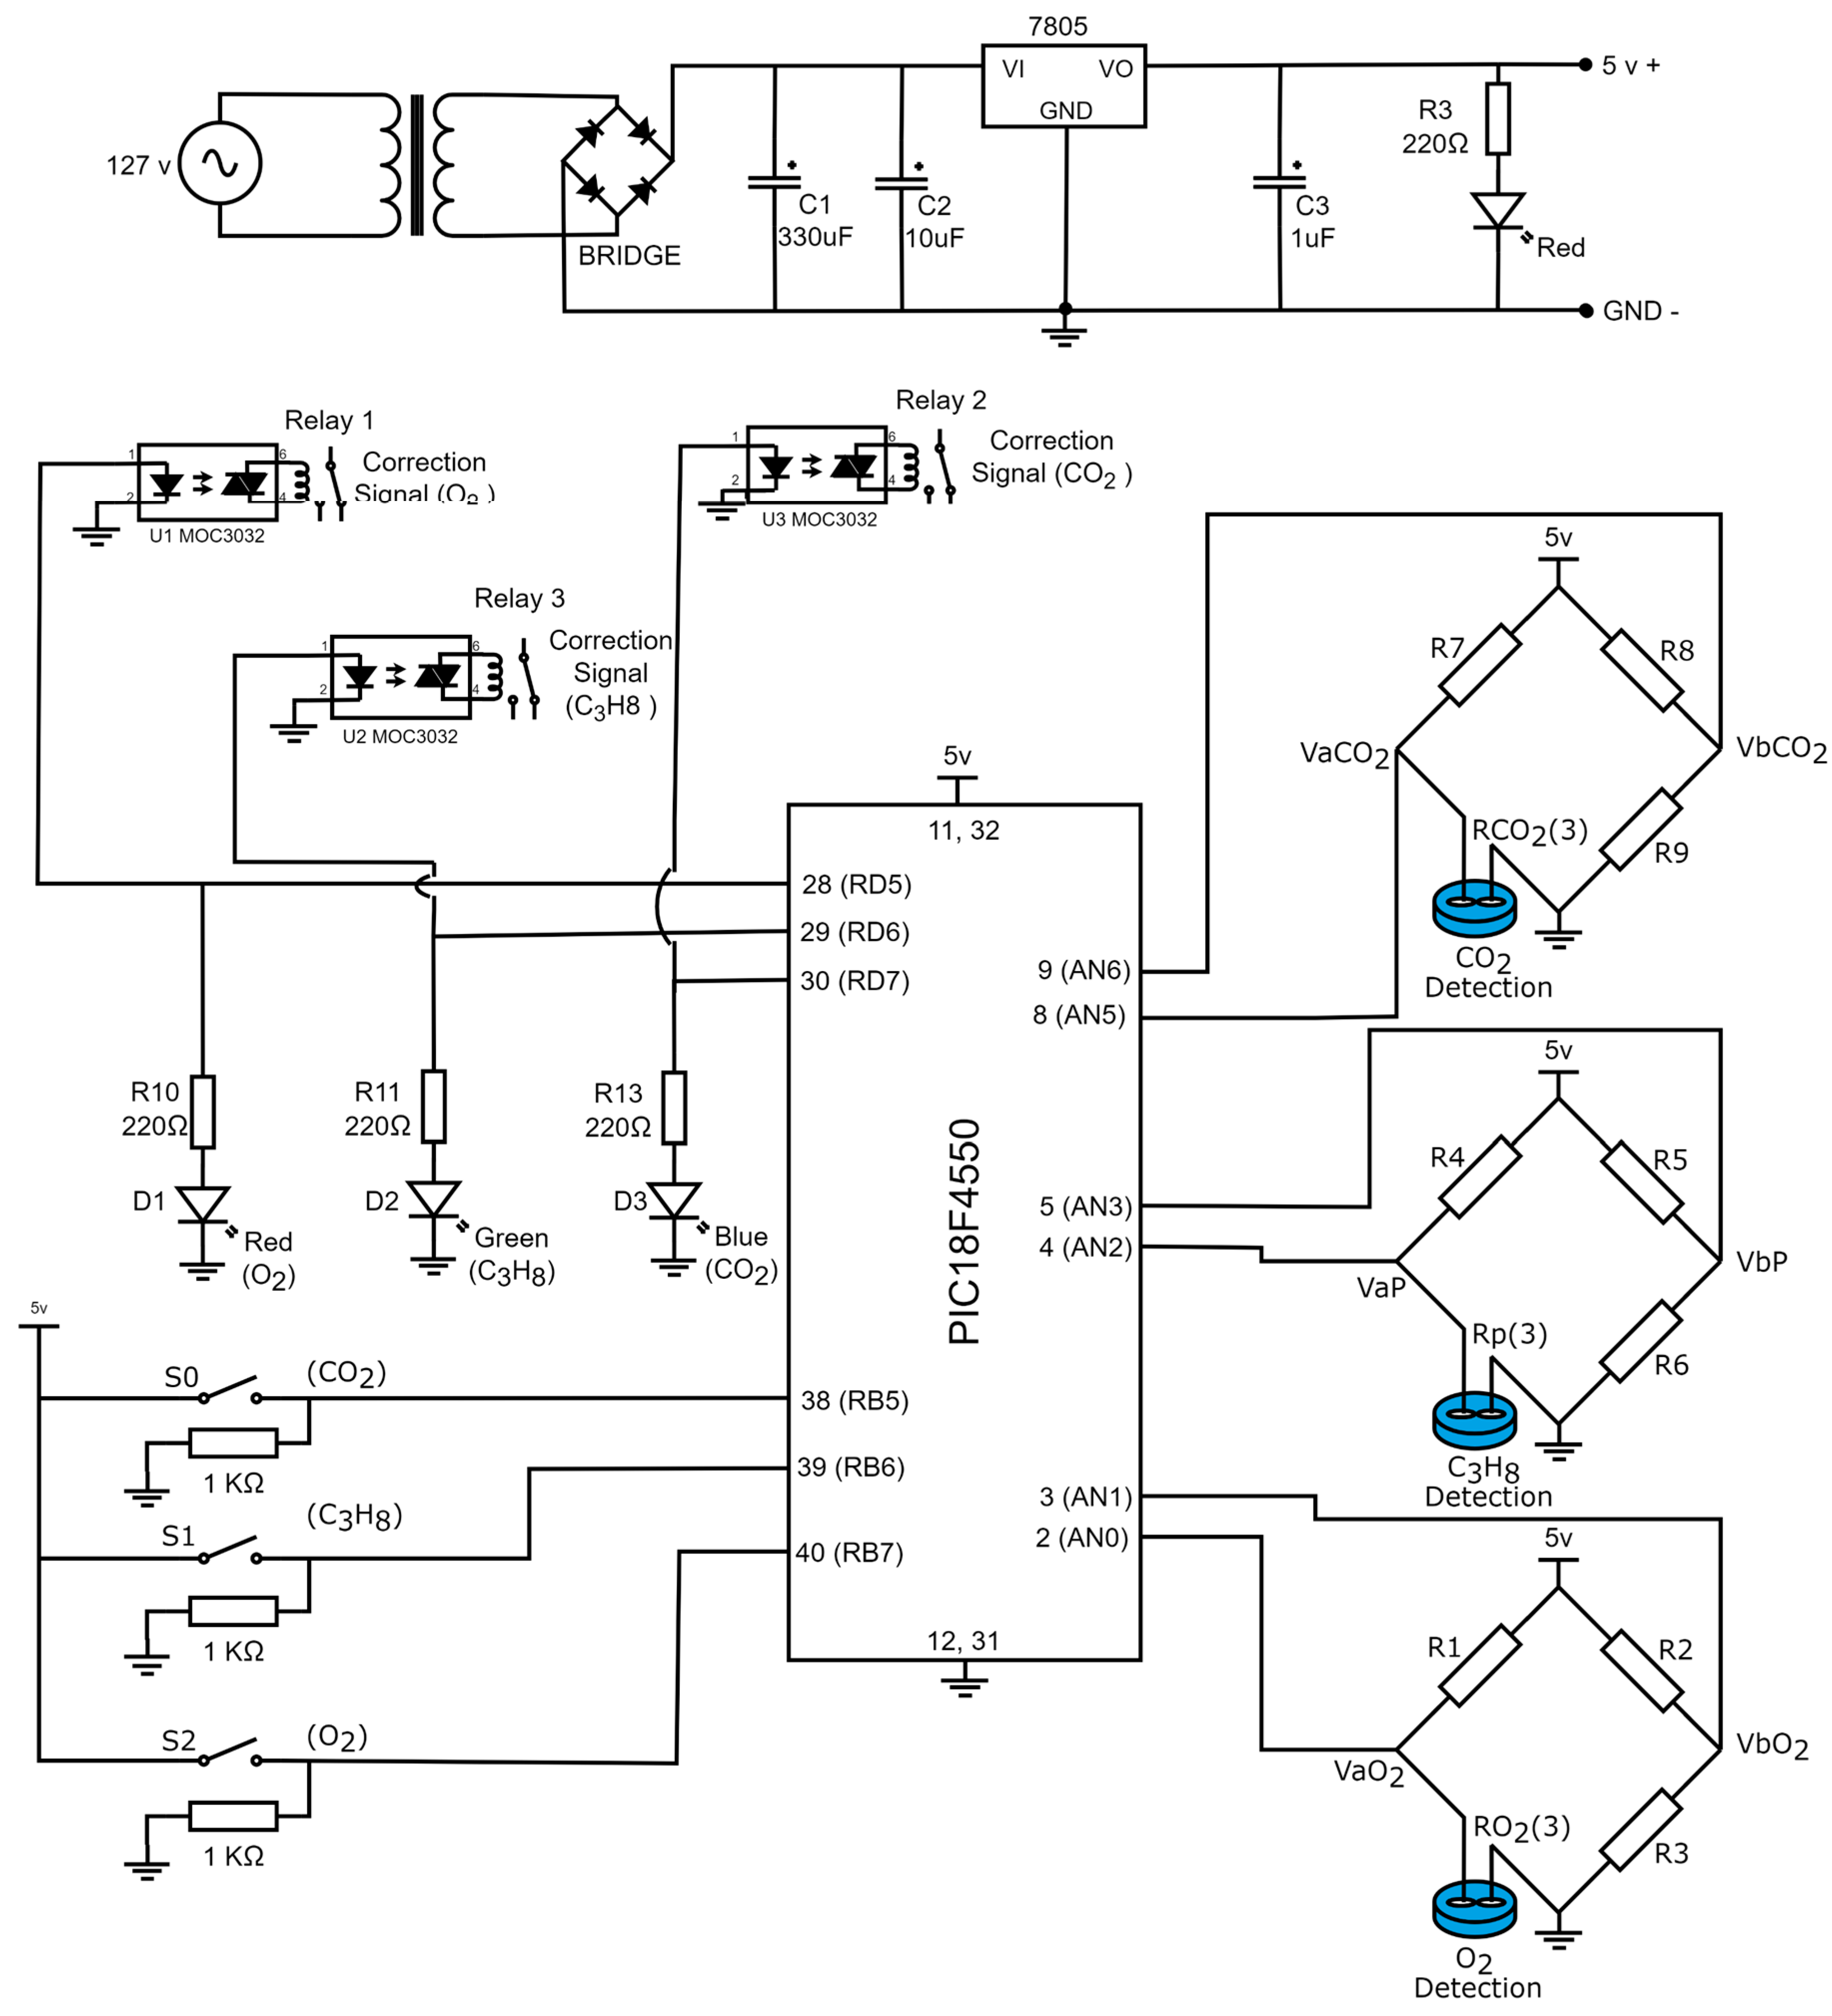
3.10. Electronic Diagram
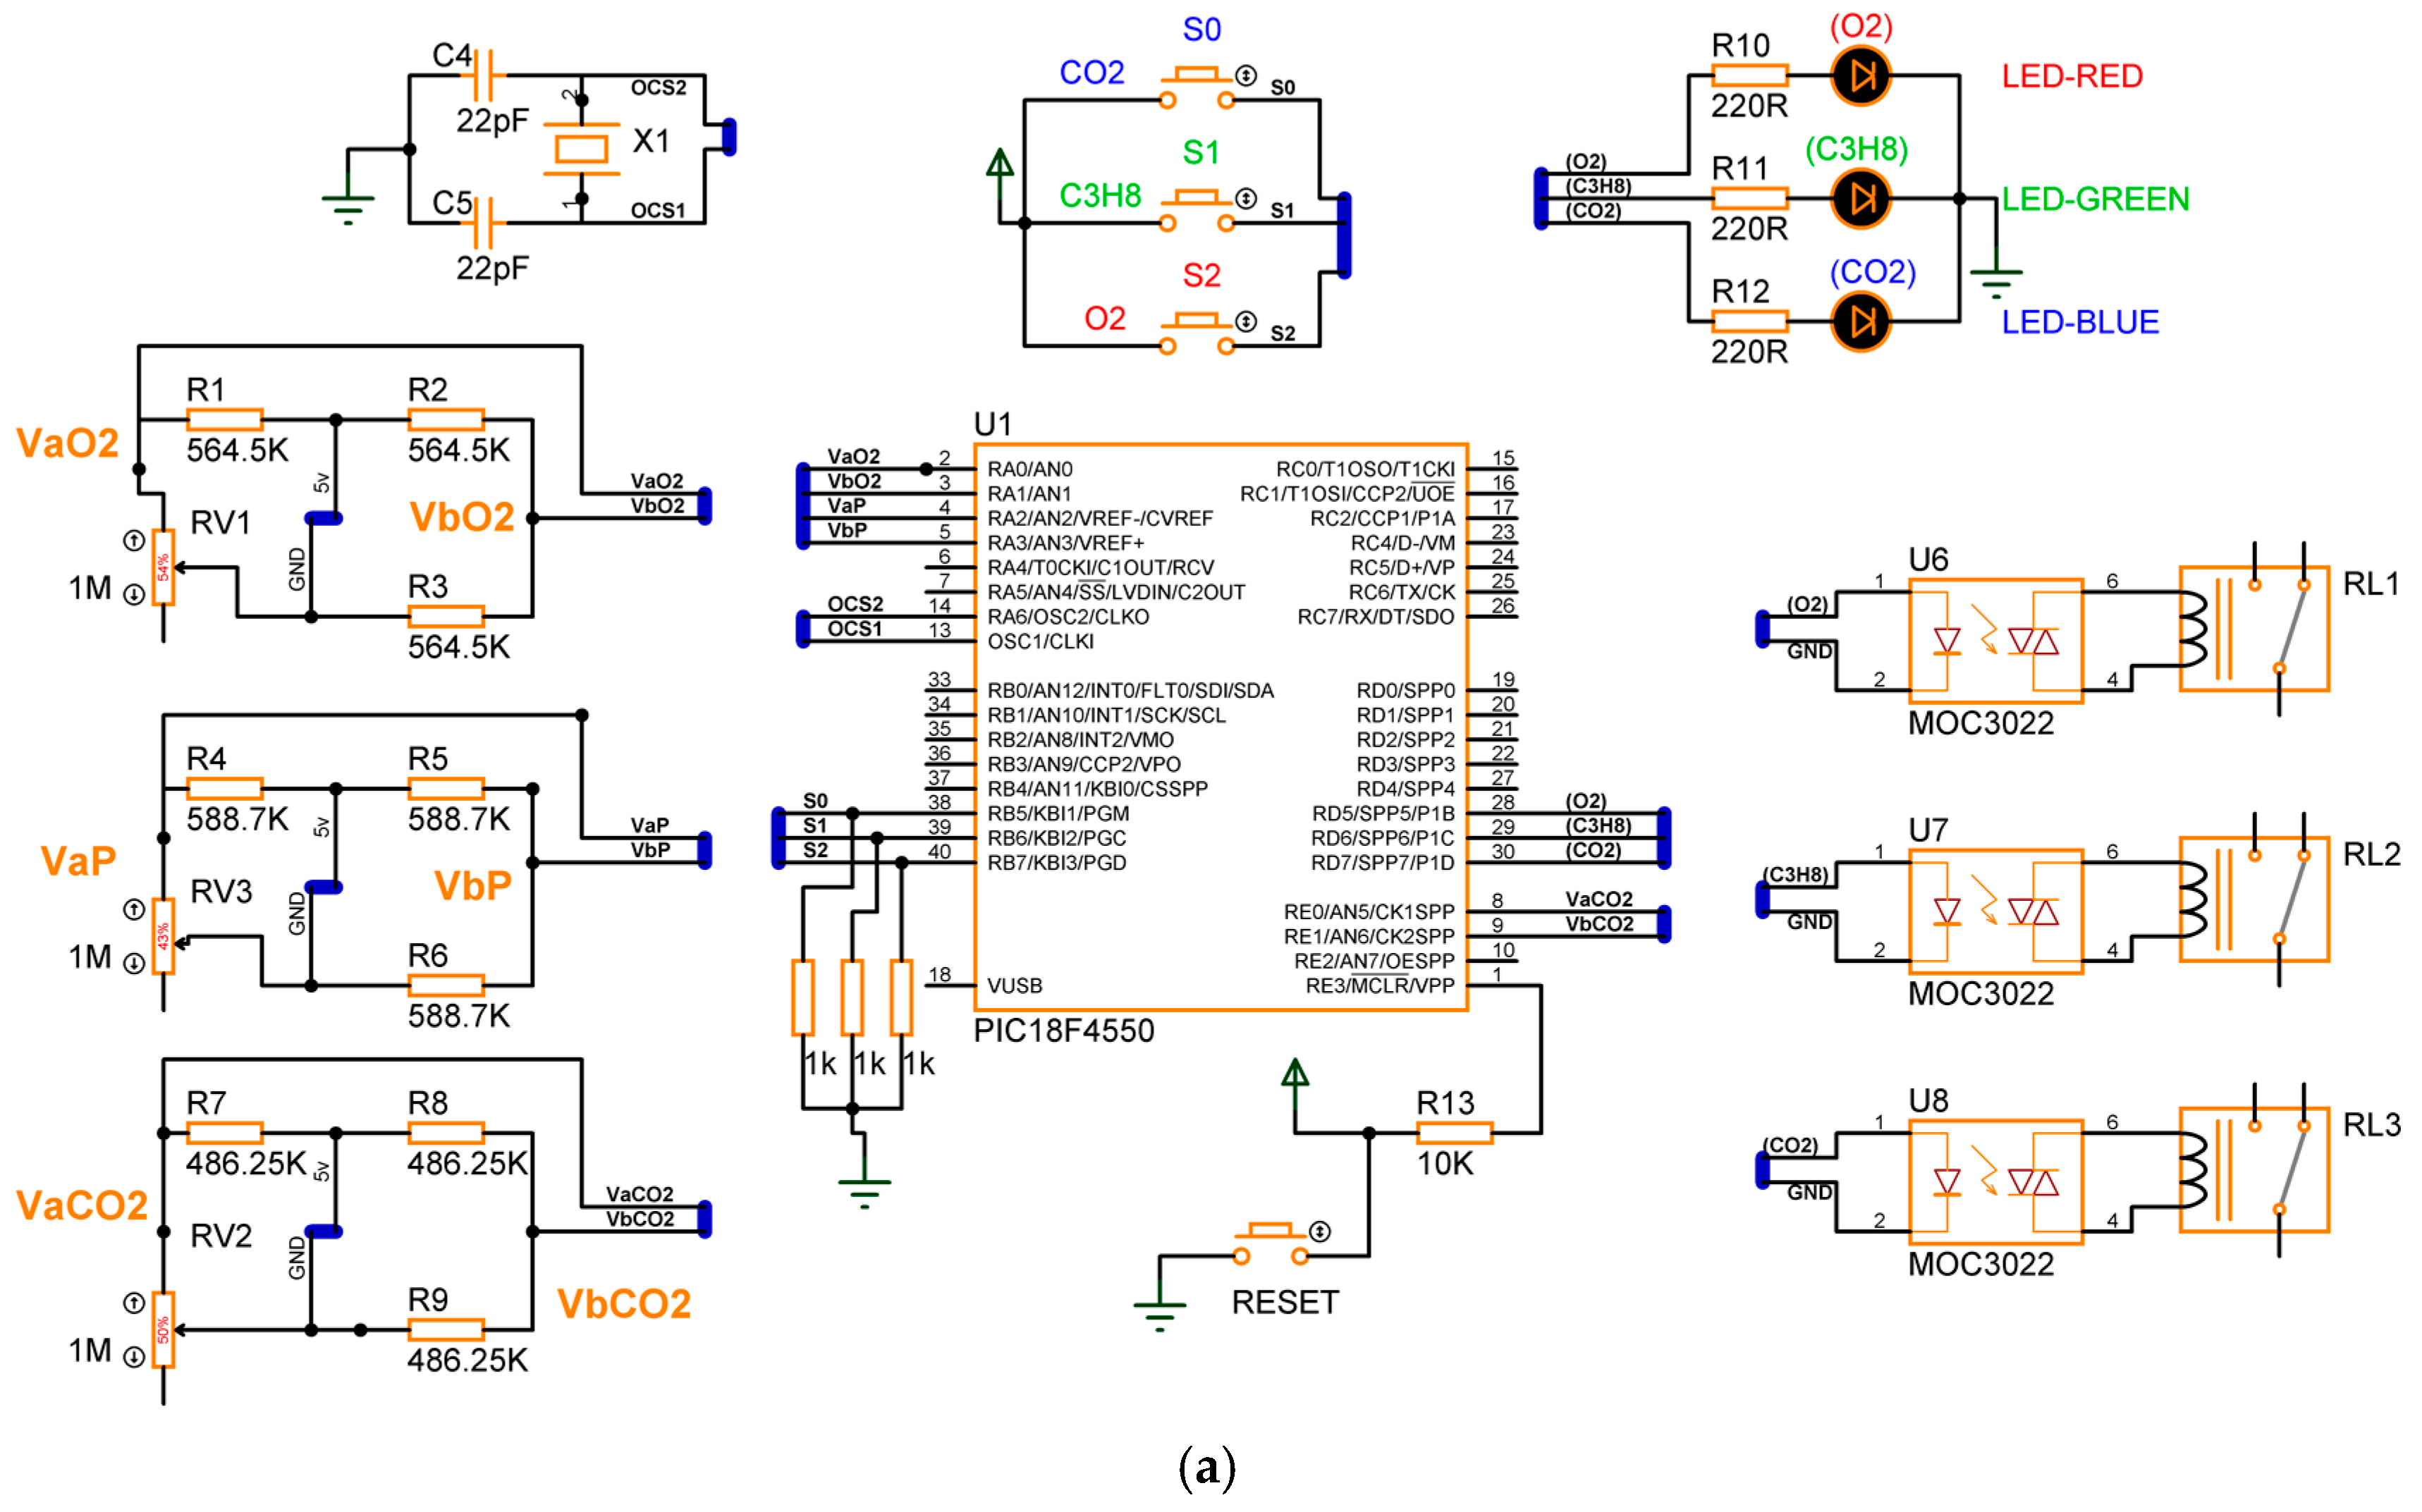
Figure 10 presents the electronic diagram of the gas detection device. Based on the steps described in the previous sections, the prototype consists of five phases: signal adaptation for the gas sensor, corrective signals and indicators for gas detection, operational configuration, power supply for voltage regulation, and microcontroller programming. The complete list of materials required for assembly is provided in Table 4.
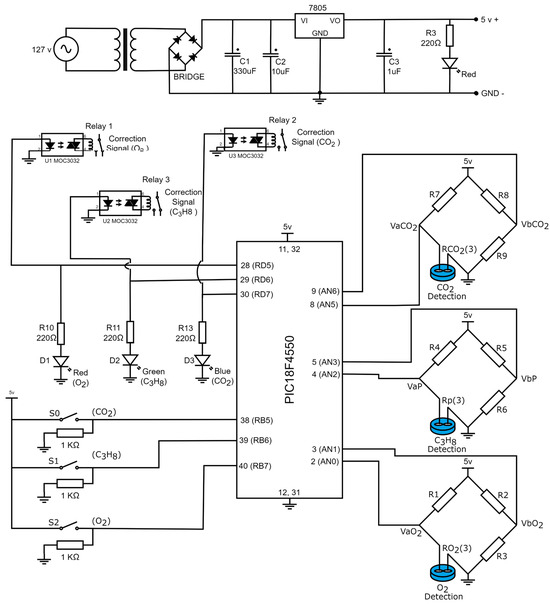
Figure 10.
Electronic diagrams of the gas detection system.
Table 4.
Necessary materials for the construction of the gas detector.
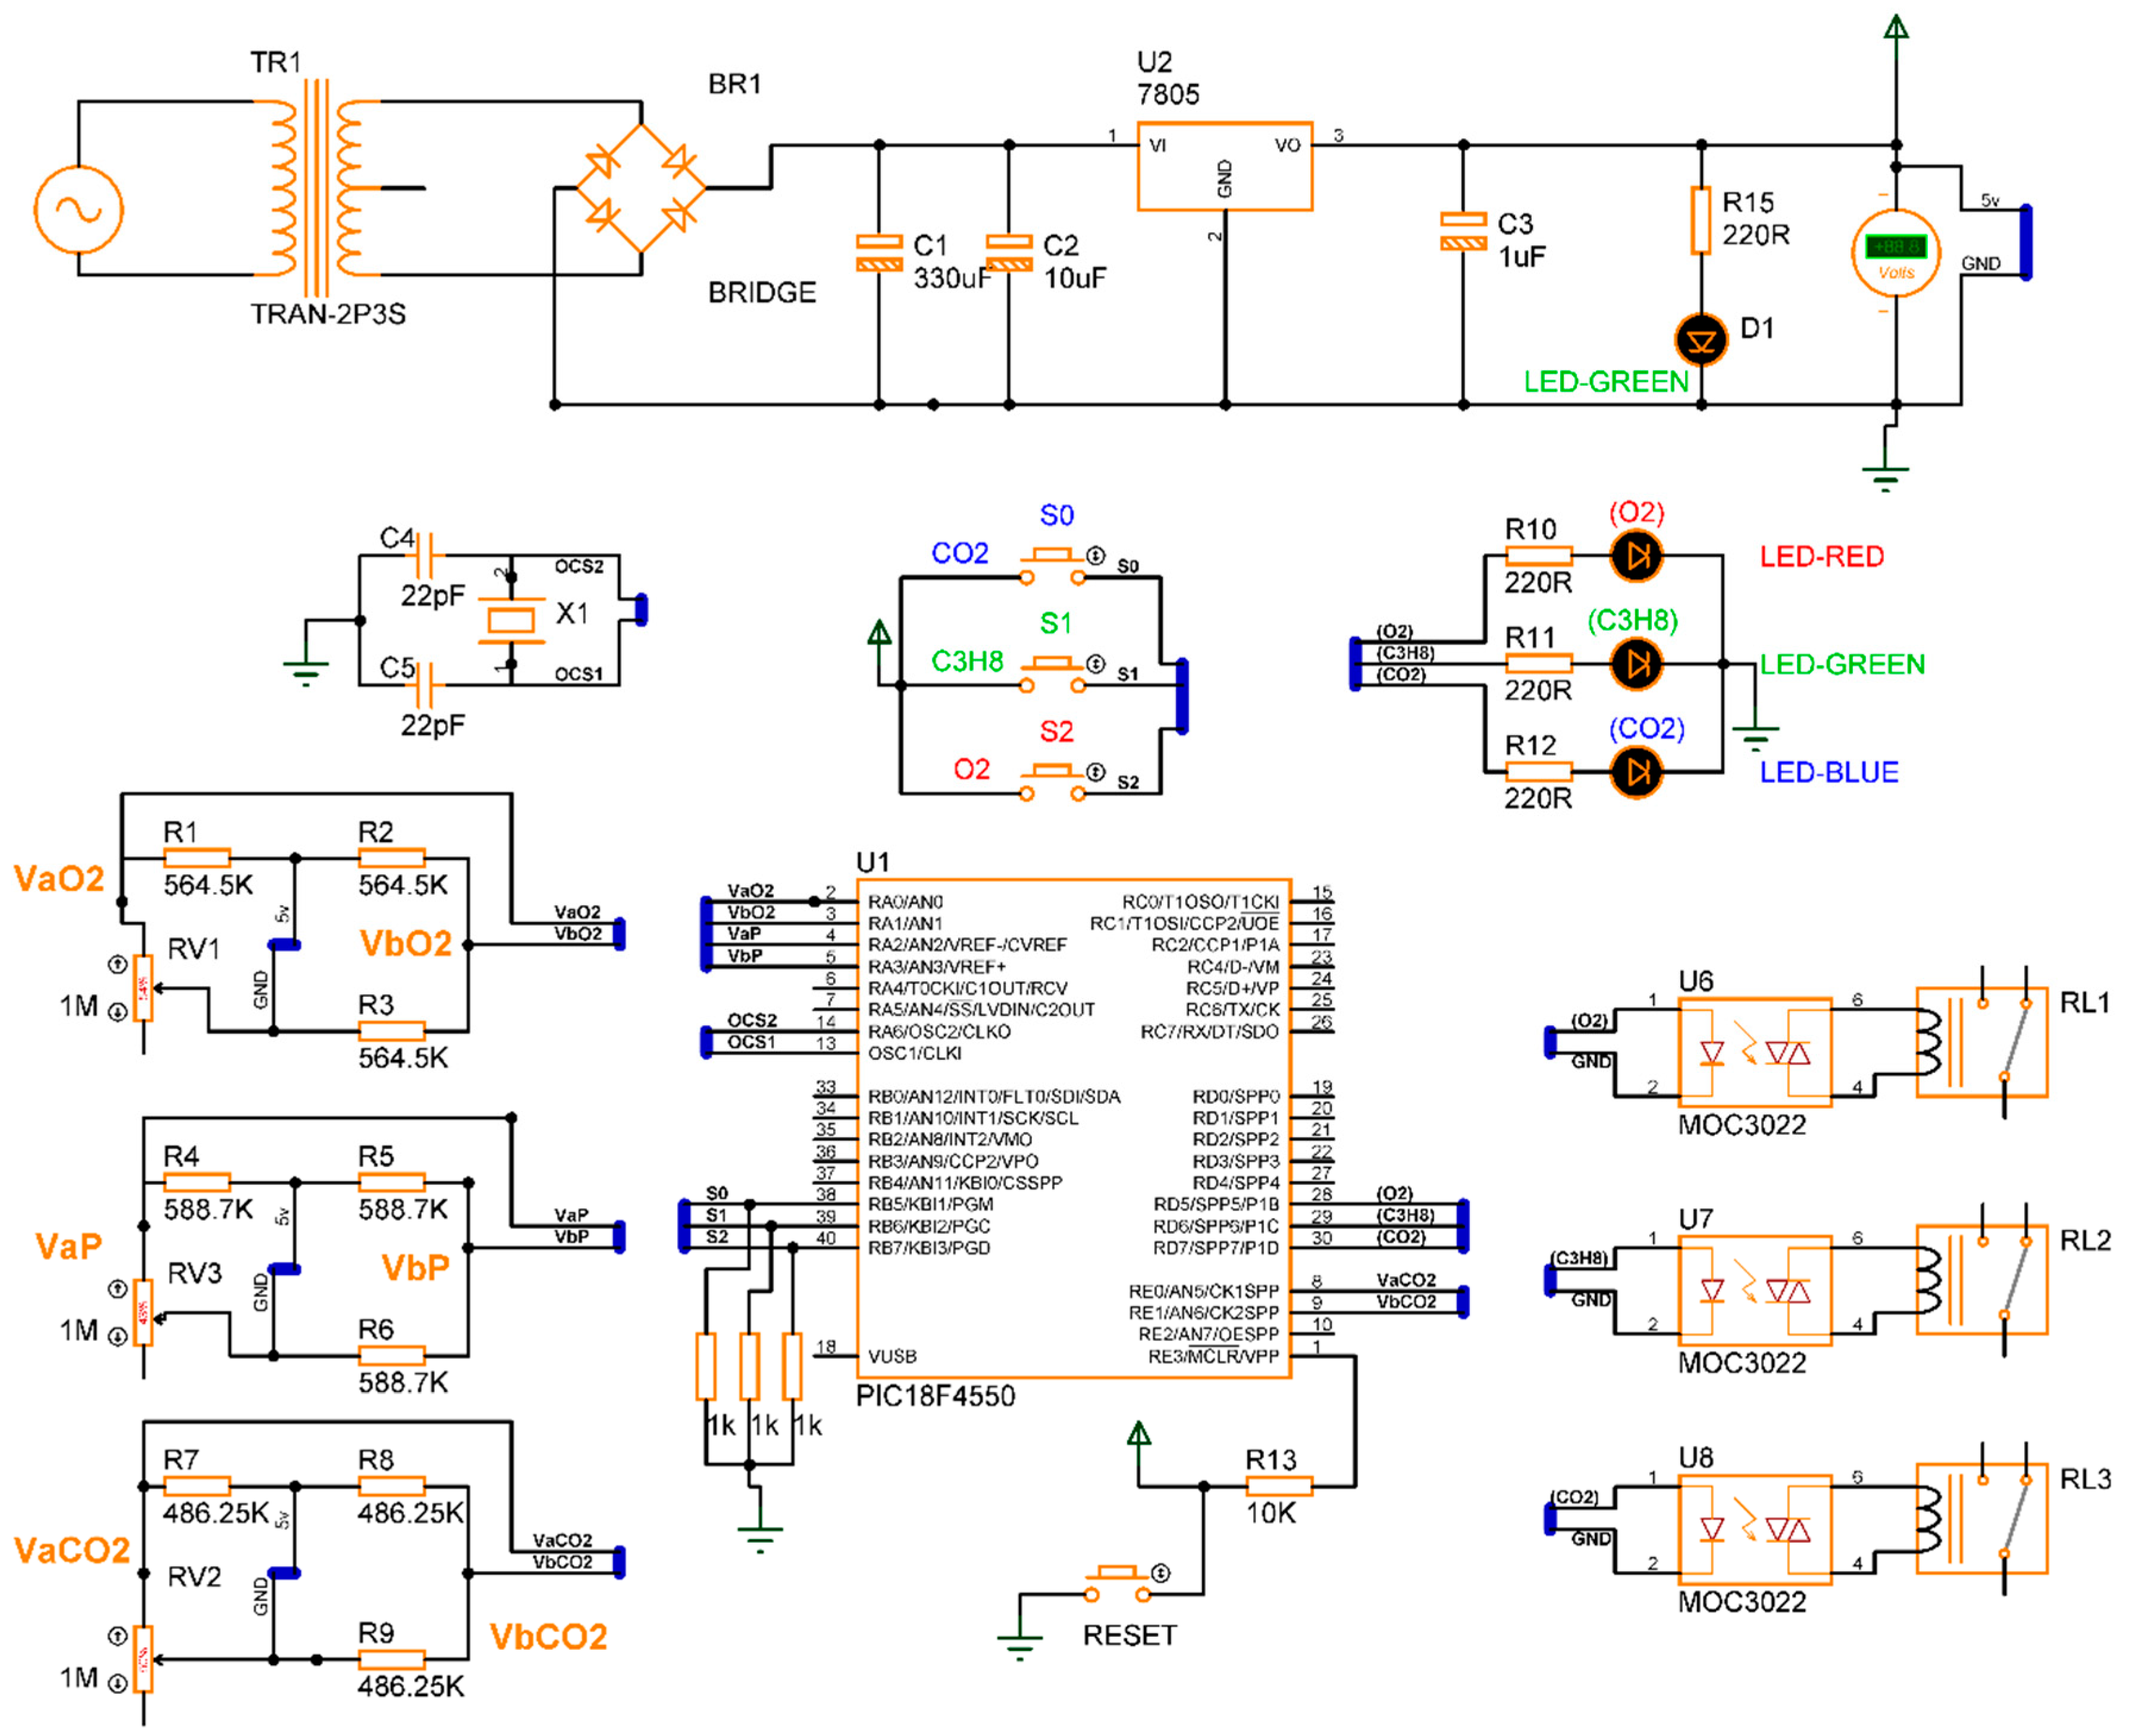
3.11. Simulation
The design of the gas detection system based on the electrical response of MgSb2O6 (Section 2), proposed in its complete electronic diagram (Section 3.1), was concluded. The simulation of the device was performed using specialized software, Proteus, version 8. In the simulation, every sensor is a variable resistance whose value was reduced, simulating the detection of gas presence in the environment. The eight switch states , along with the conditions , were taken into consideration for the microcontroller programming, obtaining the activation of the corrective signals and energization of the diodes as outputs. Figure 11 presents the electronic diagram built in Proteus, and Figure 12 illustrates the simulation of four cases of gas detection.
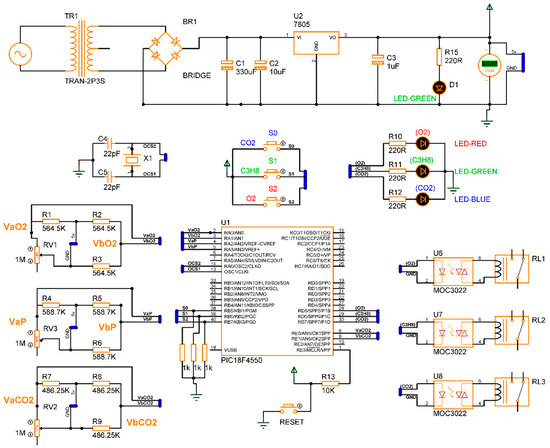
Figure 11.
Diagram built in Proteus for gas detector simulation.
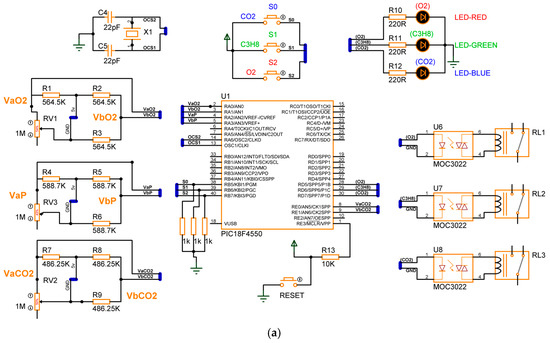
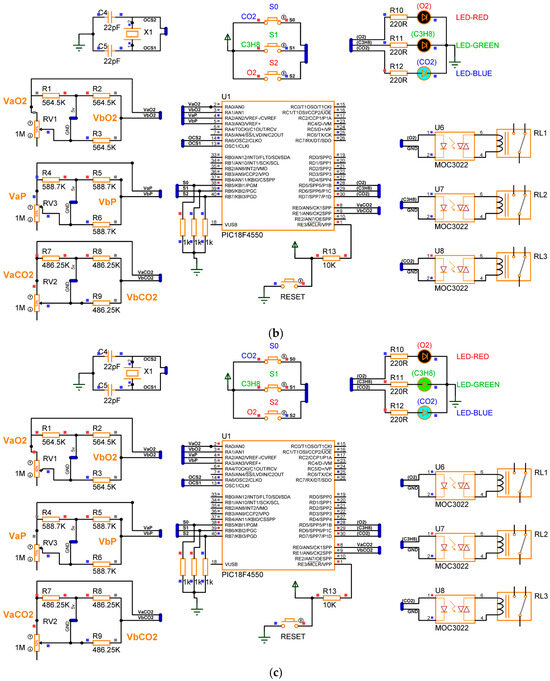
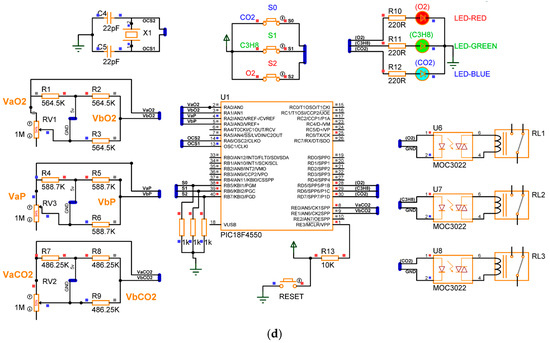
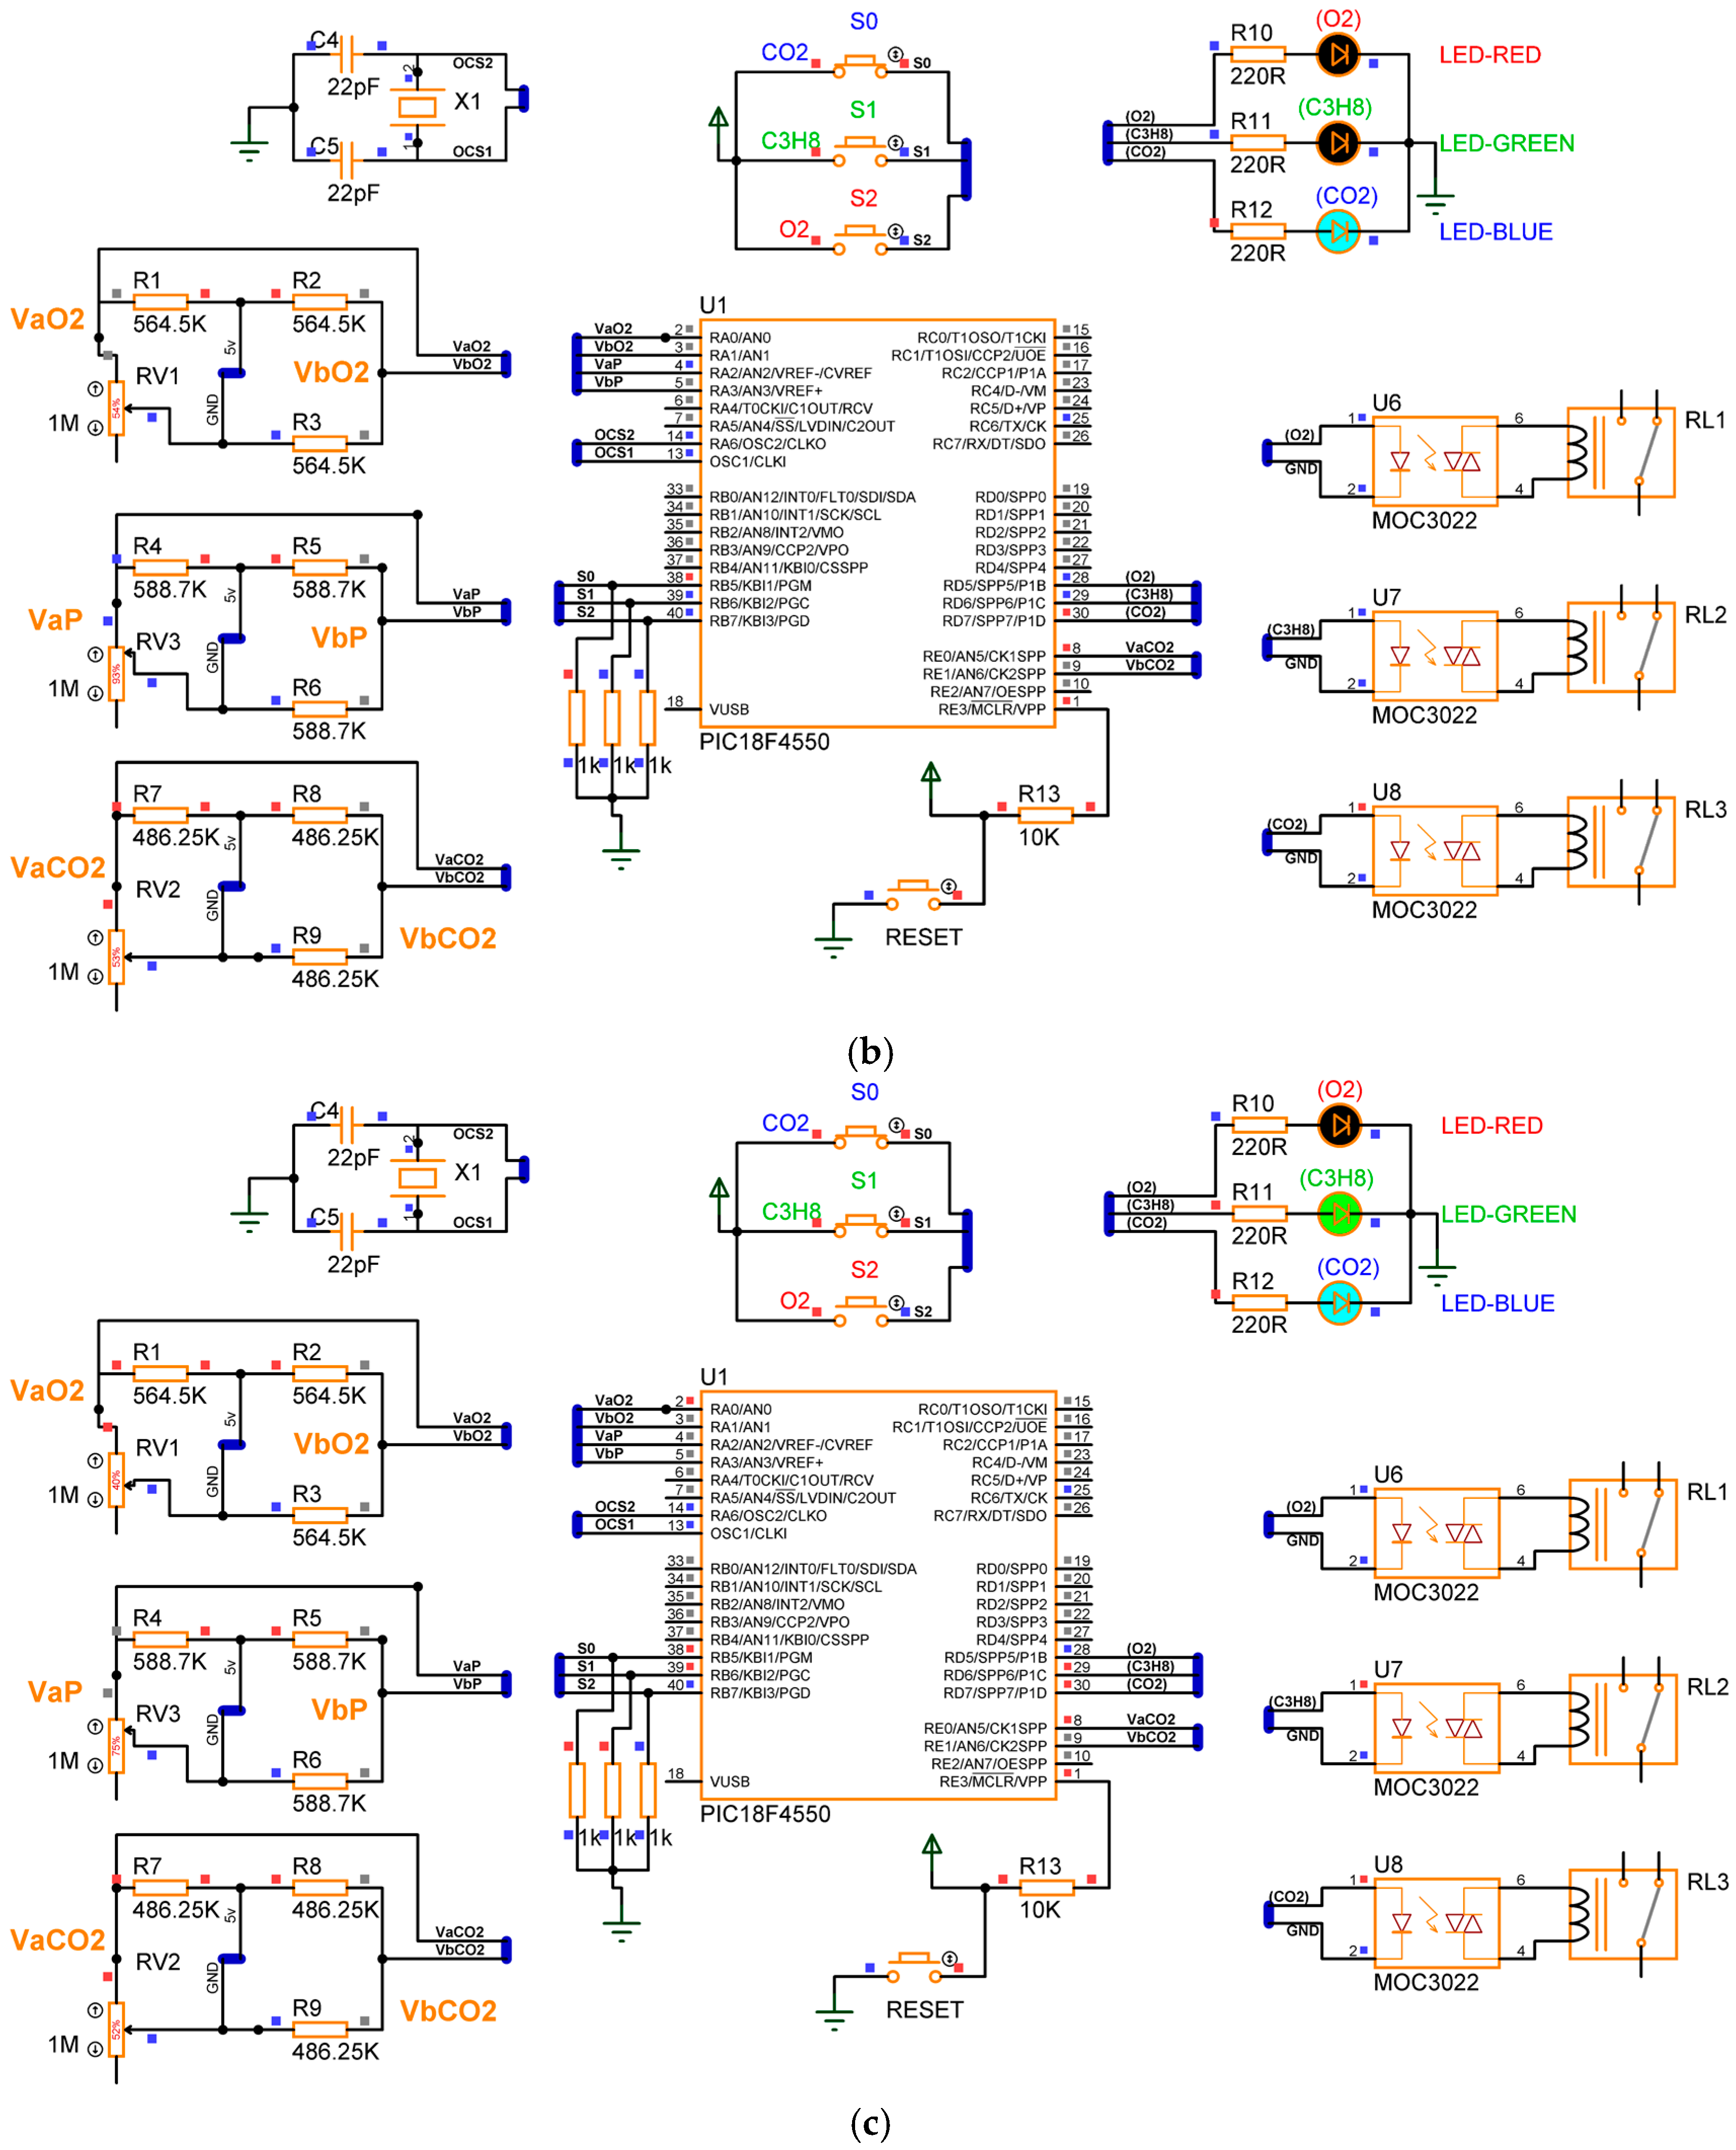
Figure 12.
Simulation results: (a) device is disabled for gas detection; (b) device is enabled to detect ; (c) device is enabled to detect ; (d) device is enabled to detect .
In Figure 12a, the detecting device is disabled for gas detection, and the diodes are in an off state. In Case 1, the prototype does not detect the presence of gas due to switches bearing a deactivated state or logic of zero . In Figure 12b, Case 2 is presented, where the gas detector only detects the presence of , and consequently, the blue LED diode is energized. The prototype can only detect because the switches have the logic states . Figure 12c illustrates Case 4, where the device is habilitated to detect the presence of in the environment, and consequently, the blue and green diodes have an on state. Therefore, the logic states are . For the last case, Figure 12d presents Case 8, where the prototype can detect the presence of all three gases ; in this case, the three diodes (red, green, and blue) are energized. Henceforth, the switches have the logic states . Comparing the results of Figure 11 with those of Table 1, Table 2 and Table 3, the simulation results are in concordance with the design considerations; henceforth, the gas detector based on the electrical response of MgSb2O6 oxide can be assembled, expecting excellent performance.
3.12. Assembling the Device
Based on the design and simulation results, both design and simulation concorded. Therefore, it is viable to proceed in the build of our gas-detecting prototype. As displayed in Figure 13, the device was assembled in a plastic cabinet of 18 cm × 6.5 cm × 11 cm in which all components for the system operation are integrated. In Figure 13a, the contents of the plastic cabinet can be observed along with the power source, the relay board, and optocouplers. Figure 13b displays the PIC18F4550 board containing the embedded system for the operation of the gas detector. Figure 13c presents the switches for gas detection control along with the indicator LEDs for indicating gas presence. In Figure 13d, the connections of input terminals for the three sensors are shown; Figure 13e illustrates the outputs for the relays employed for the external control of gas emissions.
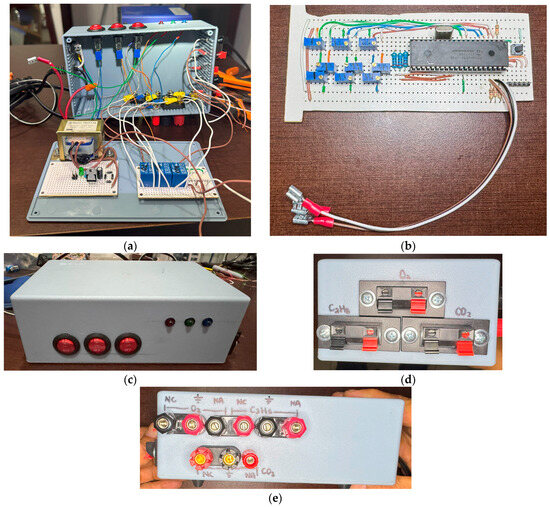
Figure 13.
Gas detector prototype: (a) plastic cabinet with the components and internal connections of the prototype; (b) PIC18F4550 board with the embedded systems; (c) switches and LEDs for gas detection; (d) inputs for gas-detecting sensors for ; (e) outputs for external control of gas emissions.
4. Discussion
In this study, a gas detector prototype was designed, simulated, and assembled. The gas sensor was developed by employing MgSb2O6 oxide. The sensor was characterized through dynamic electrical tests at a temperature of 400 °C and a gas concentration of 560 ppm, applying three gases: , , and . For each gas, a behavioral graphic of Resistance vs. Time was obtained and, based on their performance, a mathematical model was obtained. Employing the mathematical model, the device response time was defined, obtaining a resistance value that was applied in the electronic design. In the design, we considered the resolution, system protection by relays, microcontroller protection through optocouplers, sensor terminal connections, terminal connection for the corrective signals, and three switches for system configuration. In the simulation, the electronic layout and microcontroller programming were taken into consideration. The eight cases were analyzed. Once the design and simulation results were obtained, we proceeded with the assembling of the gas detector prototype. The following points can be highlighted:
- The gas detector operates in high concentrations (560 ppm) and high temperatures (400 °C). This detector is ideal for industrial applications.
- The detector can be configured to detect one, two, or three gases: , , and . The configuration is performed through switch buttons.
- The detector is protected against electrical dischargers through relays, while the PIC18F4550 microcontroller is electrically protected by optocouplers.
- The response time is 3 s, but this time can be modified through the electrical response of the sensor.
- Due to it being an electronic programmable system, the detector can be escalated for the Internet of Things or adapted to industrial networks.
- The detector possesses corrective signals for each detected gas. Additionally, it lights indicator diodes when the device detects the presence of gas in the monitoring environment.
- The prototype is low-cost, easy to repair, easy to maneuvere, and its size can be optimized by employing electronic components of smaller sizes.
- The sensors must be placed in different points of detection.
Comparing our gas detector with others reported in the literature, our detector is capable of being configured to detect up to three gases, while those reported in [57,58,59] can only detect one gas. Our system is scalable to more detection points given it was assembled with programmable electronic components, while those reported in [19,60] cannot be escalated since they were built with analog electronics. The operating temperature is higher than that in [7,14], making ours an ideal system for processes performed under high temperatures. Our future work is focused on the following directives: (a) deploy the device to the Internet of Things; (b) develop quasi-distributed systems for gas detection; (c) perform a noise analysis on the system; (d) optimize the gas detector size in the base for the electronic components.
5. Conclusions
In the combustion processes, temperatures often exceed 300 °C due to the reaction between oxygen and combustible gases, necessitating protection systems for industrial plants operating at similar or higher temperatures. This paper presents the design, simulation, and assembly of a novel gas detection device. The prototype is capable of detecting one, two, or three different gases, , depending on the configuration proposed by the final user. The electronic design is based on the electrical response of a sensor developed with MgSb2O6 oxide and microcontroller characteristics. For the simulation, the design results were analyzed, while for the assembly, both the design and simulation results were considered. The characteristics of the gas detector include operating temperatures of 400 °C. Being ideal for industrial processes, it can be configured to detect up to three gases . A corrective signal and an indicator LED light are employed for each type of gas, the operation concentration is 560 ppm, the device is scalable, and its programming can be extended to connections in industrial networks.
The gas detector developed in this study is capable of operating at high temperatures and handling high gas concentrations, making it ideal for industries that require combustion processes.
Author Contributions
J.T.G.B. and H.G.B. proposed the method; J.T.G.B., H.G.B., A.G.B. and E.H.P. made the gas sensor and characterization; A.G.B. and J.C.E.G. developed the analysis; M.J.R., M.E.S.M. and J.C.E.G. developed the simulations; J.C.E.G. and A.B.F.J. fabricated the device. All authors wrote the article. All authors have read and agreed to the published version of the manuscript.
Funding
This research received no external funding.
Institutional Review Board Statement
Not applicable.
Informed Consent Statement
Not applicable.
Data Availability Statement
The data related to the results that support our conclusions are available upon request to the authors via e-mail. We will be pleased to respond.
Acknowledgments
The authors thank Mexico’s Secretary of Science, Humanities, Technology and Innovation (SECIHTI) and Guadalajara University for the support granted. This investigation was carried out following the line research “Nanostructured Semiconductors Oxides” of the academic group UDG-CA-895, “Nano-structured Semiconductors” of C.U.C.E.I., Guadalajara University.
Conflicts of Interest
The authors declare no conflicts of interest.
References
- Prokopiuk, A.; Wojtas, J. Accelerating the Diagnosis of Pandemic Infection Based on Rapid Sampling Algorithm for Fast-Response Breath Gas Analyzers. Sensors 2024, 24, 6164. [Google Scholar] [CrossRef] [PubMed]
- Bergmann, S.; Li, B.; Pilot, E.; Chen, R.; Wang, B.; Yang, J. Effect modification of the short-term effects of air pollution on morbidity by season: A systematic review and meta-analysis. Sci. Total Environ. 2020, 716, 136985. [Google Scholar] [CrossRef] [PubMed]
- Manisalidis, I.; Stavropoulou, E.; Stavropoulos, A.; Bezirtzoglou, E. Environmental and Health Impacts of Air Pollution: A Review. Front. Public Health 2020, 8, 14. [Google Scholar] [CrossRef] [PubMed]
- Meng, F.J.; Xin, R.F.; Li, S.X. Metal Oxide Heterostructures for Improving Gas Sensing Properties: A Review. Materials 2023, 16, 263. [Google Scholar] [CrossRef]
- Li, G.; Zhu, X.; Liu, J.; Li, S.; Liu, X. Metal Oxide Semiconductor Gas Sensors for Lung Cancer Diagnosis. Chemosensors 2023, 11, 251. [Google Scholar] [CrossRef]
- Casanova-Chafer, J.; Garcia-Aboal, R.; Atienzar, P.; Bittencourt, C.; Llobet, E. Perovskite@Graphene Nanohybrids for Breath Analysis: A Proof-of-Concept. Chemosensors 2021, 9, 215. [Google Scholar] [CrossRef]
- Azmoodeh, Z.; Moghaddam, H.M.; Nasirian, S. Hydrogen gas sensing feature of polypyrrole nanofibers assisted by spinel ZnMn2O4 microspheres in dynamic conditions. Int. J. Hydrogen Energy 2022, 47, 29971–29984. [Google Scholar] [CrossRef]
- Singh, S.; Singh, A.; Singh, A.; Tandon, P. A stable and highly sensitive room-temperature liquefied petroleum gas sensor based on nanocubes/cuboids of zinc antimonate. RSC Adv. 2020, 10, 20349–20357. [Google Scholar] [CrossRef] [PubMed]
- Singh, A.; Singh, A.; Singh, S.; Tandon, P. Nickel antimony oxide (NiSb2O6): A fascinating nanostructured material for gas sensing application. Chem. Phys. Lett. 2016, 646, 41–46. [Google Scholar] [CrossRef]
- Zhang, L.; Li, F.; Yang, Y.; Li, D.; Yu, H.; Dong, X. Polyoxometalates/Metal-organic frameworks-derived ZnO/ZnWO4 nanoparticles for highly sensitive selective ppb-level NO2 detection. Chem. Eng. J. 2024, 499, 156604. [Google Scholar] [CrossRef]
- Li, P.; Yang, Y.; Li, F.; Pei, W.; Li, D.; Yu, H.; Dong, X.; Wang, D. Effect of Polyoxometalates electron acceptor decoration on NO2 sensing behavior of ZnS microspheres toward rapid and ultrahigh response. Sens. Actuators B Chem. 2025, 425, 137111. [Google Scholar] [CrossRef]
- Zhang, L.; Wang, T.; Yang, Y.; Wei, M.; Li, F.; Yu, H.; Dong, X. In situ synthesis of polyoxometalate-derved MoS2/phosphomolybdic acid composites for highly sensitive NO2 detection. J. Alloys Compd. 2024, 977, 173430. [Google Scholar] [CrossRef]
- Zhang, L.; Tian, J.; Wang, Y.; Wang, T.; Wei, M.; Li, F.; Li, Y.; Yang, Y.; Yu, H.; Dong, X. Polyoxometelates electron acceptor-intercalated In2O3@SnO2 nanofibers for chemiresistive ethanol gas sensors. Sens. Actuators B Chem. 2024, 410, 135728. [Google Scholar] [CrossRef]
- Zhang, M.; Yang, Y.; Li, D.; Yu, H.; Dong, X.; Wang, T. First Polyoxometalate-modified SnS2 composite nanostructurate gas sensor toward enhanced sensitivity and high selectivity NO2 detection. Sens. Actuators B Chem. 2024, 409, 135641. [Google Scholar] [CrossRef]
- Song, P.; Wang, T. Application of polyoxometelates in chemiresistive gas sensors: A. Review. ACS Sens. 2022, 7, 3634–3643. [Google Scholar] [CrossRef]
- Matvei, A.; Maxim, T.; Asachenko, A.; Beltiukov, A.; Amelichev, V.; Sagitova, A.; Maksimov, S.; Smirnov, A.; Rumyantseva, M.; Krivetskiy, V. Electrical and Gas Sensor Properties of Nb(V) Doped Nanocrystalline β-Ga2O3. Materials 2022, 15, 8916. [Google Scholar] [CrossRef] [PubMed]
- Singh, S.; Singh, A.; Singh, A.; Rathore, S.; Yadav, B.C.; Tandon, P. Nanostructured cobalt antimonate: A fast responsive and highly stable sensing material for liquefied petroleum gas detection at room temperature. RSC Adv. 2020, 10, 33770–33781. [Google Scholar] [CrossRef] [PubMed]
- Ramírez-Ortega, J.A.; Guillén-Bonilla, H.; Guillén-Bonilla, A.; Rodríguez-Betancourtt, V.M.; Sánchez-Martínez, A.; Guillén-Bonilla, J.T.; Gildo-Ortiz, L.; Huízar-Padilla, E.; Reyes-Gómez, J. Synthesis of the oxide NiSb2O6 and its electrical characterization in toxic atmospheres for its application as a gas sensor. J. Mater. Sci. Mater. Electron. 2022, 33, 18268–18283. [Google Scholar] [CrossRef]
- Ramírez-Ortega, J.A.; Guillén-Bonilla, J.T.; Guillén-Bonilla, A.; Rodríguez-Betancourtt, V.M.; Gildo-Ortiz, L.; Blanco-Alonso, O.; Soto-García, V.M.; Jiménez-Rodríguez, M.; Guillén-Bonilla, H. Preparation of Powders Containing Sb, Ni, and O for the Design of a Novel CO and C3H8 Sensor. Appl. Sci. 2021, 11, 9536. [Google Scholar] [CrossRef]
- Guillen Bonilla, J.T.; Guillen Bonilla, A.; Casillas Zamora, A.; Guillen Bonilla, H. Zinc aluminate (ZnAl2O4) applied in the development of a propane gas sensor and in the design of a digital gas detector. J. Mater. Sci. Mater. Electron. 2023, 34, 967. [Google Scholar] [CrossRef]
- Quintana Barcia, P.J.; García, J. Signal conditioning I: Adaptation and protection stages. In Encyclopedia of Electrical and Electronic Power Engineering; Elsevier: Oxford, UK, 2023; pp. 46–56. [Google Scholar] [CrossRef]
- Dobkin, B.; Hamburger, J. Analog Circuit Desing; Elsevier Science: Amsterdam, The Netherlands, 2014; Volume 3. [Google Scholar]
- Li, Z.; Brackmann, C.; Bood, J.; Richter, M.; Bengtsson, P.E.; Kohse Hoinghaus, K. Laser diagnostics in combustion and beyond dedicated to Prof. Marcus Alden on his 70th birthday. Combust. Flame 2024, 263, 113403. [Google Scholar] [CrossRef]
- Moroshkina, A.; Sereshchenko, E.; Mislavskii, V.; Gubernov, V.; Minaev, S. Study of chemiluminescence f methane-air, flame stabilized on flat porous burner. Combust. Flame 2024, 270, 113755. [Google Scholar] [CrossRef]
- Proakis, J.G.; Manolakis, D.G. Digital Signal Processing, Principles, Algorithms and Applications, 4th ed.; Prentice-Hall International: Hoboken, NJ, USA, 2017. [Google Scholar]
- Stergiopoulos, S. Advances Signal Processing, 2nd ed.; CRC Press: Boca Raton, FL, USA, 2017. [Google Scholar] [CrossRef]
- Hiroshi, M.; Woodward, P.M. Electronic Structure Studies of Main Group Oxides Possessing Edge-Sharing Octahedra: Implications for the Design of Transparent Conducting Oxides. Chem. Mater. 2004, 16, 5233–5248. [Google Scholar]
- Larcher, D.; Prakash, A.S.; Laffont, L.; Womes, M.; Jumas, J.C.; Olivier-Fourcade, J.; Hedge, M.S.; Tarascon, J.M. Reactivity of antimony oxides and MSb2O6 (M=Cu, Ni, Co), Ttrirutile-type phases with metallic lithium. J. Electrochem. Soc. 2006, 153, A1778–A1787. [Google Scholar] [CrossRef]
- Michel, C.R.; Martínez, A.H.; Jiménez, S. Gas sensing response of nanostructured trirutile-type CoSb2O6 synthesized by solution-polymerization method. Sens. Actuators B Chem. 2008, 132, 45–51. [Google Scholar] [CrossRef]
- Juárez-Amador, L.I.; Guillén-Bonilla, H.; Guillén-Bonilla, A.; Guillén-Bonilla, J.T.; Morales-Bautista, J.; Casillas-Zamora, A.; Rodríguez-Betancourtt, V.-M.; Olvera-Amador, M.d.l.L. Photocatalytic and sensing properties in propane atmospheres of MgSb2O6 nanoparticles synthesized by a chemical method. J. Mater. Sci. Mater. Electron. 2024, 35, 1857. [Google Scholar] [CrossRef]
- Nikulin, A.Y.; Zvereva, E.A.; Nalbandyan, V.B.; Shukaev, I.L.; Kurbakov, A.I.; Kuchugura, M.D.; Raganyan, G.V.; Popov, Y.V.; Ivanchenko, V.D.; Vasiliev, A.N. Preparation and characterization of metastable trigonal layered MSb2O6 phases (M = Co, Ni, Cu, Zn, and Mg) and considerations on FeSb2O6. Dalton Trans. 2017, 46, 6059–6068. [Google Scholar] [CrossRef] [PubMed]
- Arunkumar, N.; Saraschandra, N. Facile synthesis of N-MgSb2O6 trirutile antimonate and its enhanced photocatalytic performance. Int. J. Environ. Anal. Chem. 2022, 102, 7938–7952. [Google Scholar]
- Guillén-Bonilla, H.; Guillén-Bonilla, J.T.; Rodríguez-Betancourtt, V.M.; Ramírez-Ortega, J.A.; Morán Lázaro, J.P.; Guillén-Bonilla, A. Synthesis and Sensing Response of Magnesium Antimoniate Oxide (MgSb2O6) in the Presence of Propane Atmospheres at Different Operating Voltages. Sensors 2024, 24, 2147. [Google Scholar] [CrossRef]
- Gildo-Ortiz, L.; Rodríguez-Betancourtt, V.-M.; Ramírez Ortega, J.A.; Blanco-Alonso, O. An Alternative Approach for the Synthesis of Zinc Aluminate Nanoparticles for CO and Propane Sensing Applications. Chemosensors 2023, 11, 105. [Google Scholar] [CrossRef]
- Matijevic, E. Uniform inorganic colloid dispersions. achievements and challenges. Langmuir 1994, 10, 8–16. [Google Scholar] [CrossRef]
- Michel, C.R.; Martínez-Preciado, A.H.; Morán-Lázaro, J.P. Effect of the frequency on the gas sensing response of CoSb2O6 prepared by a colloidal method. Sens. Actuators B Chem. 2009, 140, 149–154. [Google Scholar] [CrossRef]
- Gorbunov, V.V.; Shidlovskii, A.A.; Shmagin, L.F. Combustion of transition-metal ethylenediamine nitrates. Combust. Explos. Shock. 1983, 19, 172–173. [Google Scholar] [CrossRef]
- Tereshkov, M.; Dontsova, T.; Saruhan, B.; Krüger, S. Metal Oxide-Based Sensors for Ecological Monitoring: Progress and Perspectives. Chemosensors 2024, 12, 42. [Google Scholar] [CrossRef]
- Nadargi, D.Y.; Umar, A.; Nadargi, J.D.; Lokare, S.A.; Akbar, S.; Mulla, I.S.; Suryavanshi, S.S.; Bhandari, N.L.; Chaskar, M.G. Gas sensors and factors influencing sensing mechanism with a special focus on MOS sensors. J. Mater. Sci. 2023, 58, 559–582. [Google Scholar] [CrossRef]
- Michel, C.R.; Lopez Contreras, N.L.; Lopez-Alvarez, M.A.; Martinez-Preciado, A.H. Gas selectivity of nanostructured ZnSb2O6 synthesized by a colloidal method. Sens. Actuators B Chem. 2012, 171–172, 686–690. [Google Scholar] [CrossRef]
- Arshak, K.; Moore, E.; Lyons, G.M.; Harris, J.; Clifford, S. A review of gas sensors employed in electronic nose applications. Sens. Rev. 2004, 24, 181–198. [Google Scholar] [CrossRef]
- Marikutsa, A.; Rumyantseva, M.; Konstantinova, E.A.; Gaskov, A. The Key Role of Active Sites in the Development of Selective Metal Oxide Sensor Materials. Sensors 2021, 21, 2554. [Google Scholar] [CrossRef]
- Engelkamp, B.; Schierbaum, K. Oxygen Sensing of Pt/PEO-TiO2 in Humid Atmospheres at Moderate Temperatures. Sensors 2021, 21, 2558. [Google Scholar] [CrossRef]
- Bharati, K.; Tiwari, P.R.; Singh, R.P.; Singh, A.; Yadav, B.C.; Singh, M.P.; Kumar, S. Synthesis of bismuth-doped praseodymium ortho ferrite nanomaterials for LPG sensing. Appl. Nanosci. 2024, 14, 277–289. [Google Scholar] [CrossRef]
- Aishwarya, K.; Nirmala, R.; Navamathavan, R. Recent advancements in liquefied petroleum gas sensors: A topical review. Sens. Int. 2021, 2, 100091. [Google Scholar] [CrossRef]
- Kumar-Jayaraman, V.; Maldonado-Álvarez, A.; Olvera-Amador, M.L. A simple and cost-effective zinc oxide thin film sensor for propane gas detection. Mater. Lett. 2015, 157, 169–171. [Google Scholar] [CrossRef]
- Meena, D.; Jain, M.; Bhatnagar, M.C. Resistive gas sensors based on nanostructured ternary metal oxide: A review. J. Mater. Sci. 2024, 59, 12177–12218. [Google Scholar] [CrossRef]
- Dey, A. Semiconductor metal oxide gas sensors: A review. Mater. Sci. Eng. B 2018, 229, 206–217. [Google Scholar] [CrossRef]
- Tsuji, H.; Okamura-Yoshida, A.; Shishido, T.; Hattori, H. Dynamic behavior of carbonate species on metal oxide surfaces: Oxygen scrambling between adsorbed carbon dioxide and oxide surface. Langmuir 2003, 19, 8793–8800. [Google Scholar] [CrossRef]
- Chackrabarti, S.; Zargar, R.A.; Mearaj, T.; Hafiz, A.K. CO2 sensing properties of semiconducting copper oxide and spinel ferrite nanocomposite thin film. Appl. Surf. Sci. 2010, 256, 4715–4719. [Google Scholar]
- Chang, S.C. Oxygen chemisorption on tin oxide: Correlation between electrical conductivity and EPR measurements. J. Vac.Sci. Technol. 1979, 17, 366–369. [Google Scholar] [CrossRef]
- Bläser, G.; Rühl, T.; Diehl, C.; Ulrich, M.; Kohl, D. Nanostructured semiconductor gas sensors to overcome sensitivity limitations due to percolation effects. Phys. A: Stat. Mech. Its Appl. 1999, 266, 218–223. [Google Scholar] [CrossRef]
- Degler, D. Trends and Advances in the Characterization of Gas Sensing Materials Based on Semiconducting Oxides. Sensors 2018, 18, 3544. [Google Scholar] [CrossRef]
- Guillén-Bonilla, H.; Rodríguez-Betancourtt, V.-M.; Guillen-Bonilla, J.T.; Gildo-Ortiz, L.; Guillen-Bonilla, A.; Casallas-Moreno, Y.L.; Blanco-Alonso, O.; Reyes-Gómez, J. Sensitivity Tests of Pellets Made from Manganese Antimonate Nanoparticles in Carbon Monoxide and Propane Atmospheres. Sensors 2018, 18, 2299. [Google Scholar] [CrossRef] [PubMed]
- Gómez-Pozos, H.; González-Vidal, J.L.; Torres, G.A.; Olvera, M.D.l.L.; Castañeda, L. Physical Characterization and Effect of Effective Surface Area on the Sensing Properties of Tin Dioxide Thin Solid Films in a Propane Atmosphere. Sensors 2014, 14, 403–415. [Google Scholar] [CrossRef]
- Zabczyk, J. Mathematical Control Theory, 2nd ed.; BirkhÖuser: Basel, Switzerland, 2020. [Google Scholar]
- Zvonkova, M.; Adamek, M.; Skowronkova, N.; Dlabaja, S.; Matyas, J.; Jasso, M.; Adamkova, A.; Mlcek, J.; Nikolaos Salek, R.; Buran, M. Compact 3D-Printed Unit for Separation of Simple Gas Mixtures Combined with Chemiresistive Sensors. Sensors 2024, 24, 4391. [Google Scholar] [CrossRef]
- Scheuer, K.G.; DeCorby, R.G. All-Optical, Air-Coupled Ultrasonic Detection of Low-Pressure Gas Leaks and Observation of Jet Tones in the MHz Range. Sensors 2023, 23, 5665. [Google Scholar] [CrossRef] [PubMed]
- Cao, S.; Jiao, Y.; Xiao, G.; Wu, W.; Xie, Z.; Li, J.; Liu, X.; Zhao, E.; Yue, Z. Miniaturized photoelectrochemical sensing system for reusable detection of macromolecules and its applications for unattended environmental monitoring. Sens. Actuators B Chem. 2024, 421, 136515. [Google Scholar] [CrossRef]
- Guillén Bonilla, H.; Guillén Bonilla, J.T.; Rodríguez Betancourtt, V.M.; Jiménez-Rodríguez, M.; Guillén-Bonilla, A.; Huízar-Padilla, E.; Sánchez-Morales, M.E.; Ramirez-Ortega, J.A.; Blanco-Alonso, O. Electrical Response of the Spinel ZnAl2O4 and Its Application in the Detection of Propane Gas. Appl. Sci. 2021, 11, 9488. [Google Scholar] [CrossRef]


Disclaimer/Publisher’s Note: The statements, opinions and data contained in all publications are solely those of the individual author(s) and contributor(s) and not of MDPI and/or the editor(s). MDPI and/or the editor(s) disclaim responsibility for any injury to people or property resulting from any ideas, methods, instructions or products referred to in the content. |
© 2025 by the authors. Licensee MDPI, Basel, Switzerland. This article is an open access article distributed under the terms and conditions of the Creative Commons Attribution (CC BY) license (https://creativecommons.org/licenses/by/4.0/).