Abstract
Air pollution, a major health concern, necessitates innovative solutions such as TiO2-based photocatalytic building materials to combat its harmful effects. This study focuses on developing high-performance TiO2 photocatalysts for NOx removal in building applications, aiming to overcome the limitations of commercial TiO2. These photocatalysts were synthesized via a hydrothermal method, with parameters such as synthesis time and post-treatment investigated to optimize their properties. Hydrothermal synthesis yielded TiO2 nanoparticles with reduced aggregation and a high proportion of elongated particles with exposed {010} facets. This resulted in significantly enhanced photocatalytic activity compared to commercial P25 in methylene blue degradation and NOx depollution. Subsequently, the optimized hydrothermal TiO2 was successfully integrated into a silica sol–gel coating for application on building materials. The coated concrete demonstrated significantly higher NOx removal efficiency and lower NO2 release, achieving a 1.7-fold improvement in overall NOx removal and significantly higher depolluting effectiveness compared to its P25 counterpart. These findings highlight the potential of hydrothermally synthesized TiO2 with controlled morphology for the development of high-performance, environmentally friendly building materials with enhanced air purification capabilities.
1. Introduction
Air pollution, a silent killer, continues to plague urban areas worldwide, contributing to a significant number of premature deaths each year and a general decline in public health. According to updated data [1], in the European Union (EU) in 2022, 5395 Gg of NOx, 6300 Gg of VOCs, and more than 3402 Gg of fine particles (1281 Gg of PM2.5 and 1954 Gg of PM10, corresponding to 181 Gg of soot) were released. This air pollution was directly linked to an excess mortality of 253,000 people for PM2.5 and 52,000 for NOx in the EU in 2021 [2].
Although most countries are currently focusing on limiting pollutant emissions and restricting vehicle traffic to reduce NOx concentrations in the air, these measures alone may not be sufficient. Consequently, innovative approaches for the direct removal of NOx, such as photocatalysis [3], have gained significant attention. TiO2, the most extensively studied photocatalyst, has shown promise but is hindered by limitations including poor visible light activity and low selectivity for complete NOx oxidation. To overcome these challenges, researchers have explored various strategies, such as TiO2 optimization [4,5], modification through doping or heterojunctions [6,7,8], or even the search for new photocatalysts [9,10].
Since urban areas with dense populations and heavy traffic are often characterized by high NOx levels, there has been a growing interest in developing photocatalytic building materials as a practical solution for NOx abatement [11]. Buildings in these areas offer extensive surface areas that can be activated with photocatalytic properties to function as passive air purification systems. By incorporating photocatalysts, such as TiO2, into building materials through coatings [7] or bulk incorporation [12], it is possible to reduce ambient air pollution and improve public health.
Within this framework, our research group has been at the forefront of developing innovative sol–gel treatments for producing durable TiO2-SiO2 photocatalytic coatings on building materials, aiming to address the challenge of air pollution in urban environments [13,14]. To further enhance the performance of these coatings, we have investigated various strategies, including the decoration of TiO2 with AgNPs [15] or AuNPs [16,17] and the doping of TiO2 with nitrogen [18] or copper [19]. Our latest findings suggest that replacing commercial P25 TiO2 with laboratory-prepared TiO2 nanosheets offers a promising approach to improving the decontamination efficiency of these coatings without resorting to complex and costly TiO2 modification techniques [20].
The enhancement in photocatalytic activity observed when using TiO2 nanoparticles with specific shapes arises from the modification of exposed surface facets. The three most common exposed facet types for anatase TiO2 are {101}, {010}, and {001}, with surface energies of 0.43 J m−2, 0.53 J m−2, and 0.90 J m−2, respectively [21], decreasing in order of stability. The {101} surface is the most abundant in the equilibrium form of anatase crystals, along with a small proportion of {001} facets. While {001} facets are generally considered the most active [22], other studies have demonstrated that {010} facets can exhibit higher photocatalytic activity under certain conditions [23].
Similar to our previous study, other authors have also documented improved NOx decontamination properties for TiO2 with exposed {001} facets [5]; however, the role of {010} facets in this context remains relatively unexplored. For this reason, this study aims to develop highly efficient TiO2 photocatalysts with exposed {010} facets for enhanced NOx removal in building materials. Unlike previous studies that focused on a single particle morphology, the photocatalysts developed in this work exhibit a combination of different geometries, potentially enhancing photocatalytic activity. Although the presence of high-energy surfaces might raise concerns about long-term stability, morphological changes typically require high temperatures [24], which are unlikely to occur under normal building conditions.
The synthesized photocatalysts were extensively characterized at the macro-, micro-, and nano-levels to establish correlations between their textural, structural, and surface properties and their observed photocatalytic activity. The most active photocatalyst was then integrated into a silica sol and applied as a coating to concrete substrates. The depolluting effectiveness of these treated building materials was evaluated by assessing their ability to photocatalytically remove NO from the air. The performance of the developed coatings was compared to that of reference coatings prepared using commercial P25 TiO2.
2. Materials and Methods
2.1. Sample Preparation
The synthesis procedure followed to obtain the TiO2 photocatalysts is schematized in Figure S1 in Supplementary Information and is as follows.
First, 340 mL of distilled water was added dropwise to a mixture of 17 mL of titanium isopropoxide (TTIP) and 34 mL of acetic acid cooled in an ice bath and under continuous stirring to allow the formed paste to keep a fluid consistency. Once the addition was over, the mixture was left stirring at room temperature for 1 h and then under ultrasound for 30 min and again with the help of a magnet for 5 h.
Second, the obtained sol was aged at 70 °C for 12 h, and subsequently, it was put in a hydrothermal reactor at 200 °C for 12 h. After further cooling, the resulting solid was separated through partial liquid removal with a syringe and final centrifugation at 15,000 rpm for 10 min.
The obtained particles were washed by cycles (2–3) of redispersion in water plus centrifugation until the solution pH was neutral. Then, they were redispersed in 500 mL of NaOH 0.1 M solution under overnight stirring. After that, the solid was again separated by centrifugation and washed with water until the pH was equal to 7. Finally, it was dried, milled in an agate mortar, and sieved to finally obtain particles with a size smaller than 100 µm.
Up to the sol formation, all the TiO2 samples were obtained in the same way, but after that step, the final preparative (hydrothermal synthesis at different times or calcination) and post-treatment (no treatment, NaOH treatment, or thermal treatment) steps were changed, leading to a set of different products, as summarized in Table 1.

Table 1.
TiO2 samples prepared in this work.
As a reference in this work, a commercial TiO2 Aeroxide P25 from Evonik was used. According to the manufacturer, it had a BET specific surface area of 50 ± 15 m2/g, an 80/20 anatase/rutile ratio, and a primary particle size of 21 nm.
To study the potential of the synthetized TiO2 photocatalysts for application onto building materials, the coating of concrete samples with selected TiO2-containing sols was carried out using the substrate and procedure reported elsewhere [14,17,20]. Briefly, the prepared TiO2 nanoparticles were mixed with ethyl silicate, TES40 WN (Wacker, Munich, Germany), and the amount of TiO2 employed was that which provided a nominal TiO2/SiO2 ratio of 10% in the final xerogel. The resulting sols were applied on 10 × 5 × 1 cm3 pieces of HERPLAC® concrete from Hermesa Stone (Prado Del Rey, Spain) by brushing onto one of the largest faces until the product uptake was 20 mg/cm2, and the obtained samples were left to cure at room conditions for two weeks. This resulted in a final TiO2 loading of 0.77 mg/cm2 on the concrete surface. This dosage was selected based on prior studies that examined the photocatalytic activity of comparable TiO2-SiO2 coatings on this type of concrete [14,19].
2.2. Sample Characterization
The zeta potential and hydrodynamic sizes of the photocatalysts dispersed in water (2 mg/5 mL) were determined by Dynamic Light Scattering (DLS) using a Malvern Zetasizer Nano Z analyser (Worcestershire, UK). The dispersions were sonicated in an ultrasonic bath for 10 min before the measurement.
The photocatalyst UV-vis spectra were obtained using 150 mg of sample pressed in a homemade sample holder that was introduced in a Shimadzu UV-2600 spectrophotometer (Shimadzu Corporation, Kyoto, Japan) incorporating an ISR-2600 integrating sphere. The corresponding bandgap values were calculated from diffuse reflectance spectra by using the Kubelka–Munk function and the Tauc plot [25,26].
ATR-FTIR spectra were recorded in the 4000–600 cm−1 range and at an 8 cm−1 resolution using a Shimadzu IRAffinity-1S spectrophotometer.
N2 physisorption analysis was performed at −196 °C on a Quantachrome Autosorb IQ analyser (Boynton Beach, FL, USA), with 0.3 g of samples previously outgassed at 150 °C under vacuum being employed. The BET surface area (SBET) was determined within the 0.025–0.30 P/P0 range, and the total pore volume was calculated at P/P0 = 0.995. BJH pore size distributions were obtained from the desorption branch of the isotherm.
Powder X-ray diffraction (XRD) characterization was carried out on a Bruker D8 Advance A25 powder diffractometer (Billerica, MA, USA) equipped with a LINXEYE detector (Billerica, MA, USA) operating with Cu Kα radiation. The diffraction patterns of most samples were recorded in the 2θ angle range from 20° to 80°, with scanning steps of 0.02° and a counting time per step of 96 s. Additional diffractograms were obtained for selected samples using a longer step time (396 s) in order to obtain accurate crystallographic information of the samples. The crystallinity of selected samples was more deeply studied by analysing a 1:1 mixture of TiO2 and CaF2, which allows for identifying the real percentage of each phase present in TiO2, taking into account the amorphous fraction from the main peak areas of each phase, employing equations reported by Jensen et al. [27]. The analysis of the obtained results was performed using the FullProf software (Version 8.10-Oct2024, Institute Laue Langevin, Grenoble, France) based on Rietveld refinement [28].
The photocatalyst structure was characterized by electron microscopy using a FEG Nova NanoSEM 450 microscope from FEI (Hillsboro, OR, USA) and a Talos F200X G2 TEM microscope from Thermo Fisher Scientific (Waltham, MA, USA), operating at 5 kV and 200 kV, respectively. The surfaces of the treated concrete were also observed by SEM; the samples were previously metallized using gold.
The changes in concrete colour induced by the application of selected TiO2 coatings were evaluated according to the CIELa*b* colour space using the total colour difference (ΔE*) parameter [29] and a Hunterlab Colorflex colorimeter (Reston, VA, USA).
2.3. Photocatalytic and Depolluting Performance
All tests were performed in duplicate, with the results presented corresponding to the average value and the relative standard deviation between the two measurements being lower than 5%.
Methylene blue (MB) solution decolouration under UV-vis radiation was employed to study the photoactivity of the photocatalysts. A 50 mg sample was placed in a 150 mL reactor vessel, 100 mL of water was added, and the photocatalyst was dispersed for 15 min using ultrasound. Then, 1 mL of 1 mM MB solution was added in order to obtain an MB concentration of nearly 10−5 M, and the mixture was kept in the dark under vigorous stirring for 30 min to ensure complete MB adsorption on TiO2 before the test began. The tests were carried out at room temperature and without pH adjustment of the final solution. The UV–visible spectra of the solution were recorded at progressive irradiation times after filtration through a 0.45 µm syringe filter. The degradation plots were represented using the Abs/Abs0 at 664 nm, and the results were fitted to a first-order rate equation, with the correlation coefficients being higher than 0.99, obtaining the corresponding kinetic rate constants.
The NOx depolluting properties of the samples were studied according to the ISO 22197-1 standard [30] using a protocol similar to that reported in our previous studies [6]. In the case of photocatalysts, they were previously deposited on 10 × 5 × 0.4 cm3 glass plates by evaporation of 10 mL of a water dispersion containing 50 mg of the photocatalyst. Samples containing 50 mg of Ca(OH)2 were also prepared. The coated concrete samples were pre-irradiated with UV radiation overnight and rinsed with distilled water before testing, as indicated in the standard. The samples were placed in a Poly(methyl methacrylate) reactor with a glass window connected to the gas system and a chemiluminescence analyser model 42i from Thermo Scientific for measuring the NO, NO2, and NOx concentrations. The flow rate in the reactor was 3 L/min, and the NO concentration at the reactor inlet was adjusted to 1000 ± 50 ppb. The amounts of NO converted, NO2 generated, and NOx removed were calculated by integration of concentration profiles during the light irradiation periods, as described in the standard, using the following expression:
where nxx is the µmol of gas removed or generated; f is the normalized air flow in L/min (0 °C, 101.3 kPa); toff and ton are the times when the lamp switches off and on, respectively; [NO]in is the supplied NO air concentration in ppm; [NO]out is the NO air concentration at the reactor exit in ppm; and [NO2]out is the NO2 air concentration at the reactor exit in ppm.
The results were expressed as percentages of the total NO amount, and the selectivity of the process to NO2 was also calculated using the following expressions:
In both cases, MB and NO tests, a UV-vis UltraVitalux 300 W lamp from Osram (Munich, Germany) was employed as a light source, and its emission spectrum is presented in Figure S2 in Supplementary Materials. The lamp position was adjusted in order to subject the samples to 10 W/m2 irradiation in the range of 300–400 nm, measured using a PCE-UV34 power meter from PCE Instruments (Meschede, Germany).
3. Results and Discussion
3.1. Particle Aggregation
Hydrodynamic size measurements of the photocatalyst aqueous dispersions were used to determine the aggregation degree of the particles. Figure 1a and Table 2 summarize the main results of this study. The size distribution of P25, centred at 115 nm, corresponds to small-size aggregates formed by a reduced number of particles [31]. In contrast, particles prepared by the hydrothermal method show much smaller sizes, around 55 nm. This suggests that aggregates were composed of fewer particles or composed of smaller individual particles than P25. The advantage of a hydrothermal synthesis versus a conventional sol–gel procedure followed by calcination is clear when looking at the results obtained for the C450 sample, which shows significant aggregation, leading to sizes exceeding a micron. Post-treatment via calcination increases the hydrodynamic size, with this agglomeration effect growing with both time and temperature. On the contrary, post-treatment using NaOH has no effect on the hydrodynamic size.
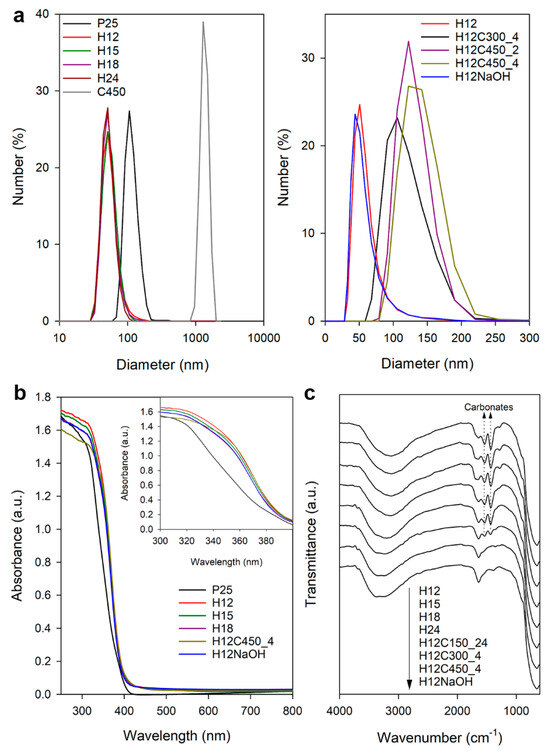
Figure 1.
(a) The DLS size distribution of the studied TiO2 samples dispersed in water. (b) UV–visible spectra of some of the studied photocatalysts, with the inset showing the detail of the 300–400 nm region. (c) FTIR spectra recorded for some of the TiO2 samples prepared in this work.
Table 2.
Characterization results of TiO2 samples studied in this work, including hydrodynamic sizes and zeta potential obtained by DLS; textural properties obtained by N2 physisorption; anatase crystallite sizes derived from the XRD analysis; and average sizes of the particles forming the photocatalyst considering the shortest and longest dimensions and percentages of elongated particles in relation to the total number obtained by SEM.
Regarding the zeta potential (Table 2), P25 exhibits a value characteristic of these particles at pH below their isoelectric point [32]. Samples prepared by the hydrothermal method show higher zeta potential values, indicating a higher surface charge that explains the better dispersion due to the higher repulsion between particles. Calcined samples with higher agglomeration also showed lower zeta potential values. On the other hand, the sample subjected to post-treatment with NaOH showed high but negative zeta potential, contrasting with the classic nature of TiO2. In an aqueous suspension, TiO2 generates acid dispersions as it protonates, acquiring a positive surface charge reflected by positive zeta potential values. Therefore, NaOH treatment must modify the surface of TiO2, altering its acid–base nature.
This modification was confirmed by measuring the pH of particle dispersions. H12 generates a dispersion with pH 4.22, while H12NaOH produces a neutral dispersion with pH 6.9. We studied the change in zeta potential as a function of pH to determine the isoelectric point of these samples (Figure S3 in Supplementary Information), finding values of 6.2 and 5.3, respectively. Although both values fall within the expected range for TiO2 [33], the modification of the particles’ acid–base nature was confirmed. The surface of titania contains two types of hydroxyl groups: those with bridge oxygen, which are acidic, and terminal ones with a basic character [34]. NaOH treatment may alter the balance between these groups, leading to changes in acid–base properties. In addition, the basic medium may produce changes in the surface structure of TiO2 [35].
3.2. UV-Vis and FTIR Spectroscopy
All synthetized samples were white powder, as expected for titania. Figure 1b shows the UV–visible light absorption spectra recorded for a representative set of prepared TiO2 samples along with that of the P25 reference. The synthetized samples exhibit the characteristic UV absorption of titania, starting at the same wavelength as P25, but their absorption in the range of 300–400 nm and the visible range was slightly higher. The bandgap was 3.2 eV for all the samples (Figure S4 in Supplementary Materials), the characteristic value of anatase.
The differences between P25 and hydrothermal titania were more significant when they were dispersed in a liquid. For the same concentration of TiO2, the water dispersions of prepared TiO2 were translucent, whereas the equivalent P25 dispersion was opaque. This lower light scattering can be associated with the smaller size of the TiO2 aggregates formed in aqueous dispersions, as determined by DLS.
Figure 1c shows the infrared spectra recorded for most of the prepared TiO2 samples. In general, they present the characteristic Ti–O stretching band at 646 cm−1 and the O-H vibrations of hydroxyl groups and adsorbed water at 3200 and 1638 cm−1 [36]. Two significant bands were also observed at 1535 and 1443 cm−1, which is consistent with carboxyl/carboxylate groups from the remains of acetic acid used for the synthesis. However, the presence of acetic acid can be discarded considering the lack of C–H bands in the 2800–3000 cm−1 region and the fact that the peaks did not disappear after long drying at 150 °C. For this reason, they were attributed to surface carbonate formation [37] during the hydrothermal process or by a subsequent reaction with air CO2 [38]. In fact, the thermal stability of these bands, requiring calcination at 450 °C for their complete elimination, also agrees with carbonates that require high temperatures for their thermal decomposition. NaOH treatment effectively removed the carbonate signal, suggesting a mechanism involving the exchange of carbonate species with hydroxyl ions. This mechanism could be analogous to fluoride removal from TiO2 surfaces [39], where the hydroxide ion acts as a nucleophile displacing the carbonate group. Proposed reactions for monodentate and bidentate carbonate species are shown below:
3.3. Textural and Structural Characterization
Figure S5 compiles the N2 physisorption isotherms and the corresponding BJH pore size distribution plots obtained for some of the TiO2 samples studied, while Table 2 summarizes the main textural parameters derived from processing the former. As can be observed, all the samples exhibit hysteresis denoting the presence of mesopores [40], although some differences can be noticed concerning their shapes.
P25 has a pseudo-type-II isotherm with H3 hysteresis; this is related to the presence of macropores [40]. This is consistent with the low compactness of the particles that generate great cavities in between. On the contrary, the prepared TiO2 samples (except for the NaOH-treated one) present isotherms more similar to type IV (a) with H2 (a) hysteresis, characteristic of mesoporous materials with ink-bottle-shaped pores [41]. This type of isotherm is typical of materials formed by nanoparticle aggregation, as reported for other hydrothermally prepared TiO2 samples [42,43,44]. H12NaOH differs by showing a more pseudo-type-II-like isotherm with a narrower loop, possibly indicating larger pores in this sample.
Considering that, for nanoparticulate materials, the BET area increases as the particle size decreases [45], the results suggest that the prepared particles are slightly smaller than those of P25. Post-treatments do not seem to significantly impact the surface area, indicating no significant sintering or particle growth.
A closer look at the pore size distributions reveals differences related to the different shapes of the isotherms. P25 shows a wide distribution with a maximum at 48 nm, with a significant contribution from macropores, explaining the H3-type hysteresis and confirming the low particle compactness. In contrast, the prepared TiO2 samples exhibit similar pore size distributions with narrow curves centred at 15 nm. This size could be related to the dimensions of cavities resulting from particle packing. Finally, the NaOH-treated sample presents a wider distribution with a maximum at 23 nm and a tail extending into the macropore range. These differences might explain the changes observed in the shape of the isotherms, being determined by variations in nanoparticle compaction, as BET surface area values do not indicate significant discrepancies in inferred particle sizes.
Figure S6 compiles XRD diagrams for different TiO2 samples. Notably, all synthesized TiO2 samples exclusively exhibit the anatase phase, unlike P25, which shows an 88/12 anatase/rutile ratio, typical for this commercial sample [46]. No evidence of rutile formation was observed, even in the calcined samples, likely due to the relatively low calcination temperatures [47]. All TiO2 samples were quite similar, except for H24, which showed less intense and broader diffraction peaks, indicating a smaller nanoparticle size.
Table 2 presents crystallite size data for the anatase phase obtained from Rietveld analysis. The estimated sizes for anatase (101) and rutile (110) reflections (30.1 nm, not included in Table 2) in P25 align with literature values [48] and manufacturer data. For the prepared TiO2 samples, the anatase (101) peak indicates smaller crystal sizes compared to P25, suggesting similar or smaller nanoparticle sizes. Additionally, increasing the hydrothermal treatment time seems to slightly decrease the crystal size, with the exception of H18. Compared to Collazzo et al.’s work [49], our results show similar size values, but we did not observe a clear increase in crystal size with time as they did. This discrepancy could be attributed to a potential re-dissolution process that occurs in our synthesis with increasing hydrothermal treatment time.
Comparing the anatase peaks of P25 and the prepared samples, the (004) peak is relatively more intense in the latter, suggesting preferential growth along a specific axis, resulting in elongated particles. This is confirmed by the Rietveld analysis results, which show a significant difference between the sizes calculated from (101) and (004) peaks for the prepared TiO2 samples, with the latter being significantly bigger than the former. In relation to calcination, according to (101) reflection, it seems its effect on the crystal size is reduced. But, considering (004) reflection, the size diminishes. Therefore, it is possible that calcination affects the particle shape. For its part, the size changes were less significant for the NaOH treatment.
A detailed Rietveld refinement was performed to determine the lattice parameters of the synthesized TiO2 and the effect of thermal treatment. The obtained lattice parameters for anatase (Table S1 in Supplementary Materials) and rutile (a = 4.59604 Å, c = 2.96029 Å, not included in Table S1) in P25 are consistent with the literature values [50]. Compared to bulk anatase, all samples exhibited an expansion of the “a” parameter and a contraction of the “c” parameter, resulting in a net cell volume expansion. This expansion is attributed to the presence of undercoordinated Ti atoms at the surface of nanocrystalline anatase [51]. H12 showed the highest cell distortion, likely due to its smaller crystal size but also related to the particle shape differences. The shape of the nanoparticles is determined by the type of faces exposed, and some of these higher-energy faces have less coordinated titanium atoms. Calcination led to a decrease in both parameters, with the cell volume approaching that of bulk anatase, suggesting a reduction in cell distortions.
Finally, the crystallinity of P25, H12, and H24 was assessed to determine the crystallization yield of the hydrothermal process and the effect of time (Table S2 in Supplementary Materials). P25 showed the expected level of amorphous content [52]. H12 had a similar amorphous content, while increasing the hydrothermal treatment time seemed to slightly reduce crystallinity. This reduction could be related to the aforementioned re-dissolution process or be related to an underestimated signal of anatase due to its smaller crystallite size.
SEM microscopy (Figure S7 in Supplementary Information) revealed significant differences between the samples prepared by the hydrothermal method and that prepared using the sol–gel process (C450). Hydrothermally synthesized samples consisted of nanoparticles exhibiting a diverse range of particle shapes, with elongated particles being a prominent feature, consistent with XRD results suggesting preferential growth along one axis. In contrast, the C450 sample comprised dense agglomerates of micrometric size, as expected from the DLS results. Figure 2 illustrates representative SEM images of some of the samples investigated at higher magnifications, revealing detailed morphological features. The structures of the hydrothermal titania samples appear to be very similar to each other, the most noticeable difference being the smaller particle size of the sample subjected to a longer hydrothermal treatment time (H24). At this higher magnification, it can be observed that sample C450 is composed of a dense agglomeration of more or less spherical TiO2 nanoparticles whose size is smaller than that of hydrothermal titania.
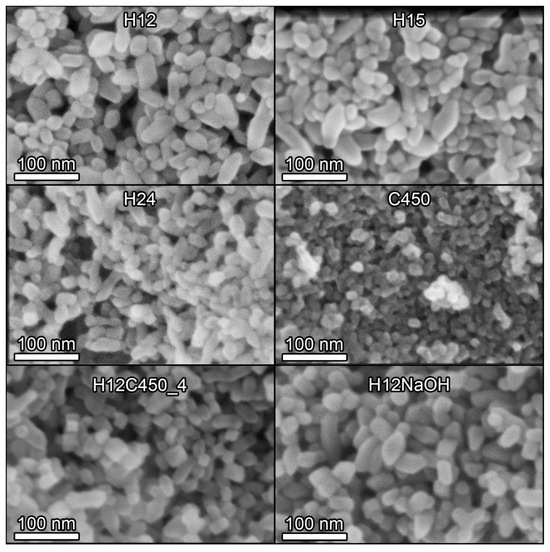
Figure 2.
SEM images of some of the TiO2 samples prepared in this work. All images were acquired at 300 k× magnification with a 5 kV acceleration voltage and a 5 mm working distance using a through-the-lens (TLD) detector in secondary electron imaging mode.
To obtain statistically representative results, several SEM images of each sample were analysed, and the shortest and longest dimensions of the particles were measured separately. This allowed for the determination of the corresponding particle size distributions presented in Figure S8 of the Supplementary Information and the average size values compiled in Table 2. Hydrothermally prepared nanoparticles exhibited a shorter dimension of approximately 20 nm, consistent with XRD estimates, and a significantly longer dimension, resulting in an aspect ratio of approximately 3:1. The size of the shorter dimension decreased with increasing synthesis time, as also suggested by the XRD results. The size of the longest dimension also decreased, but to a lesser extent. Of particular significance is the observation that the fraction of elongated particles varied among the hydrothermal samples, with H12 exhibiting a proportion of one-third, whereas this fraction is reduced to one-fifth in samples H15 and H24.
Regarding the post-treatment, at first glance, the calcined particles seem to be less rounded and sharper, and it is easy to identify different polyhedral shapes. However, this could be due to calcination removing surface contamination, reducing charging effects that distort the observed particle shape during the image acquisition. Furthermore, calcination exerted a more significant impact on the elongated particles, leading to a reduction in both their length and abundance. The proportion of elongated particles diminished from 34% in the H12 sample to 22% in the H12C450_4 sample. This aligns with XRD results suggesting the shortening of particles along the (004) direction (Table 2). Therefore, calcination does not significantly impact the size of the nanoparticles, but it can alter their shape. By contrast, the NaOH treatment had no noticeable effect on particle size or shape.
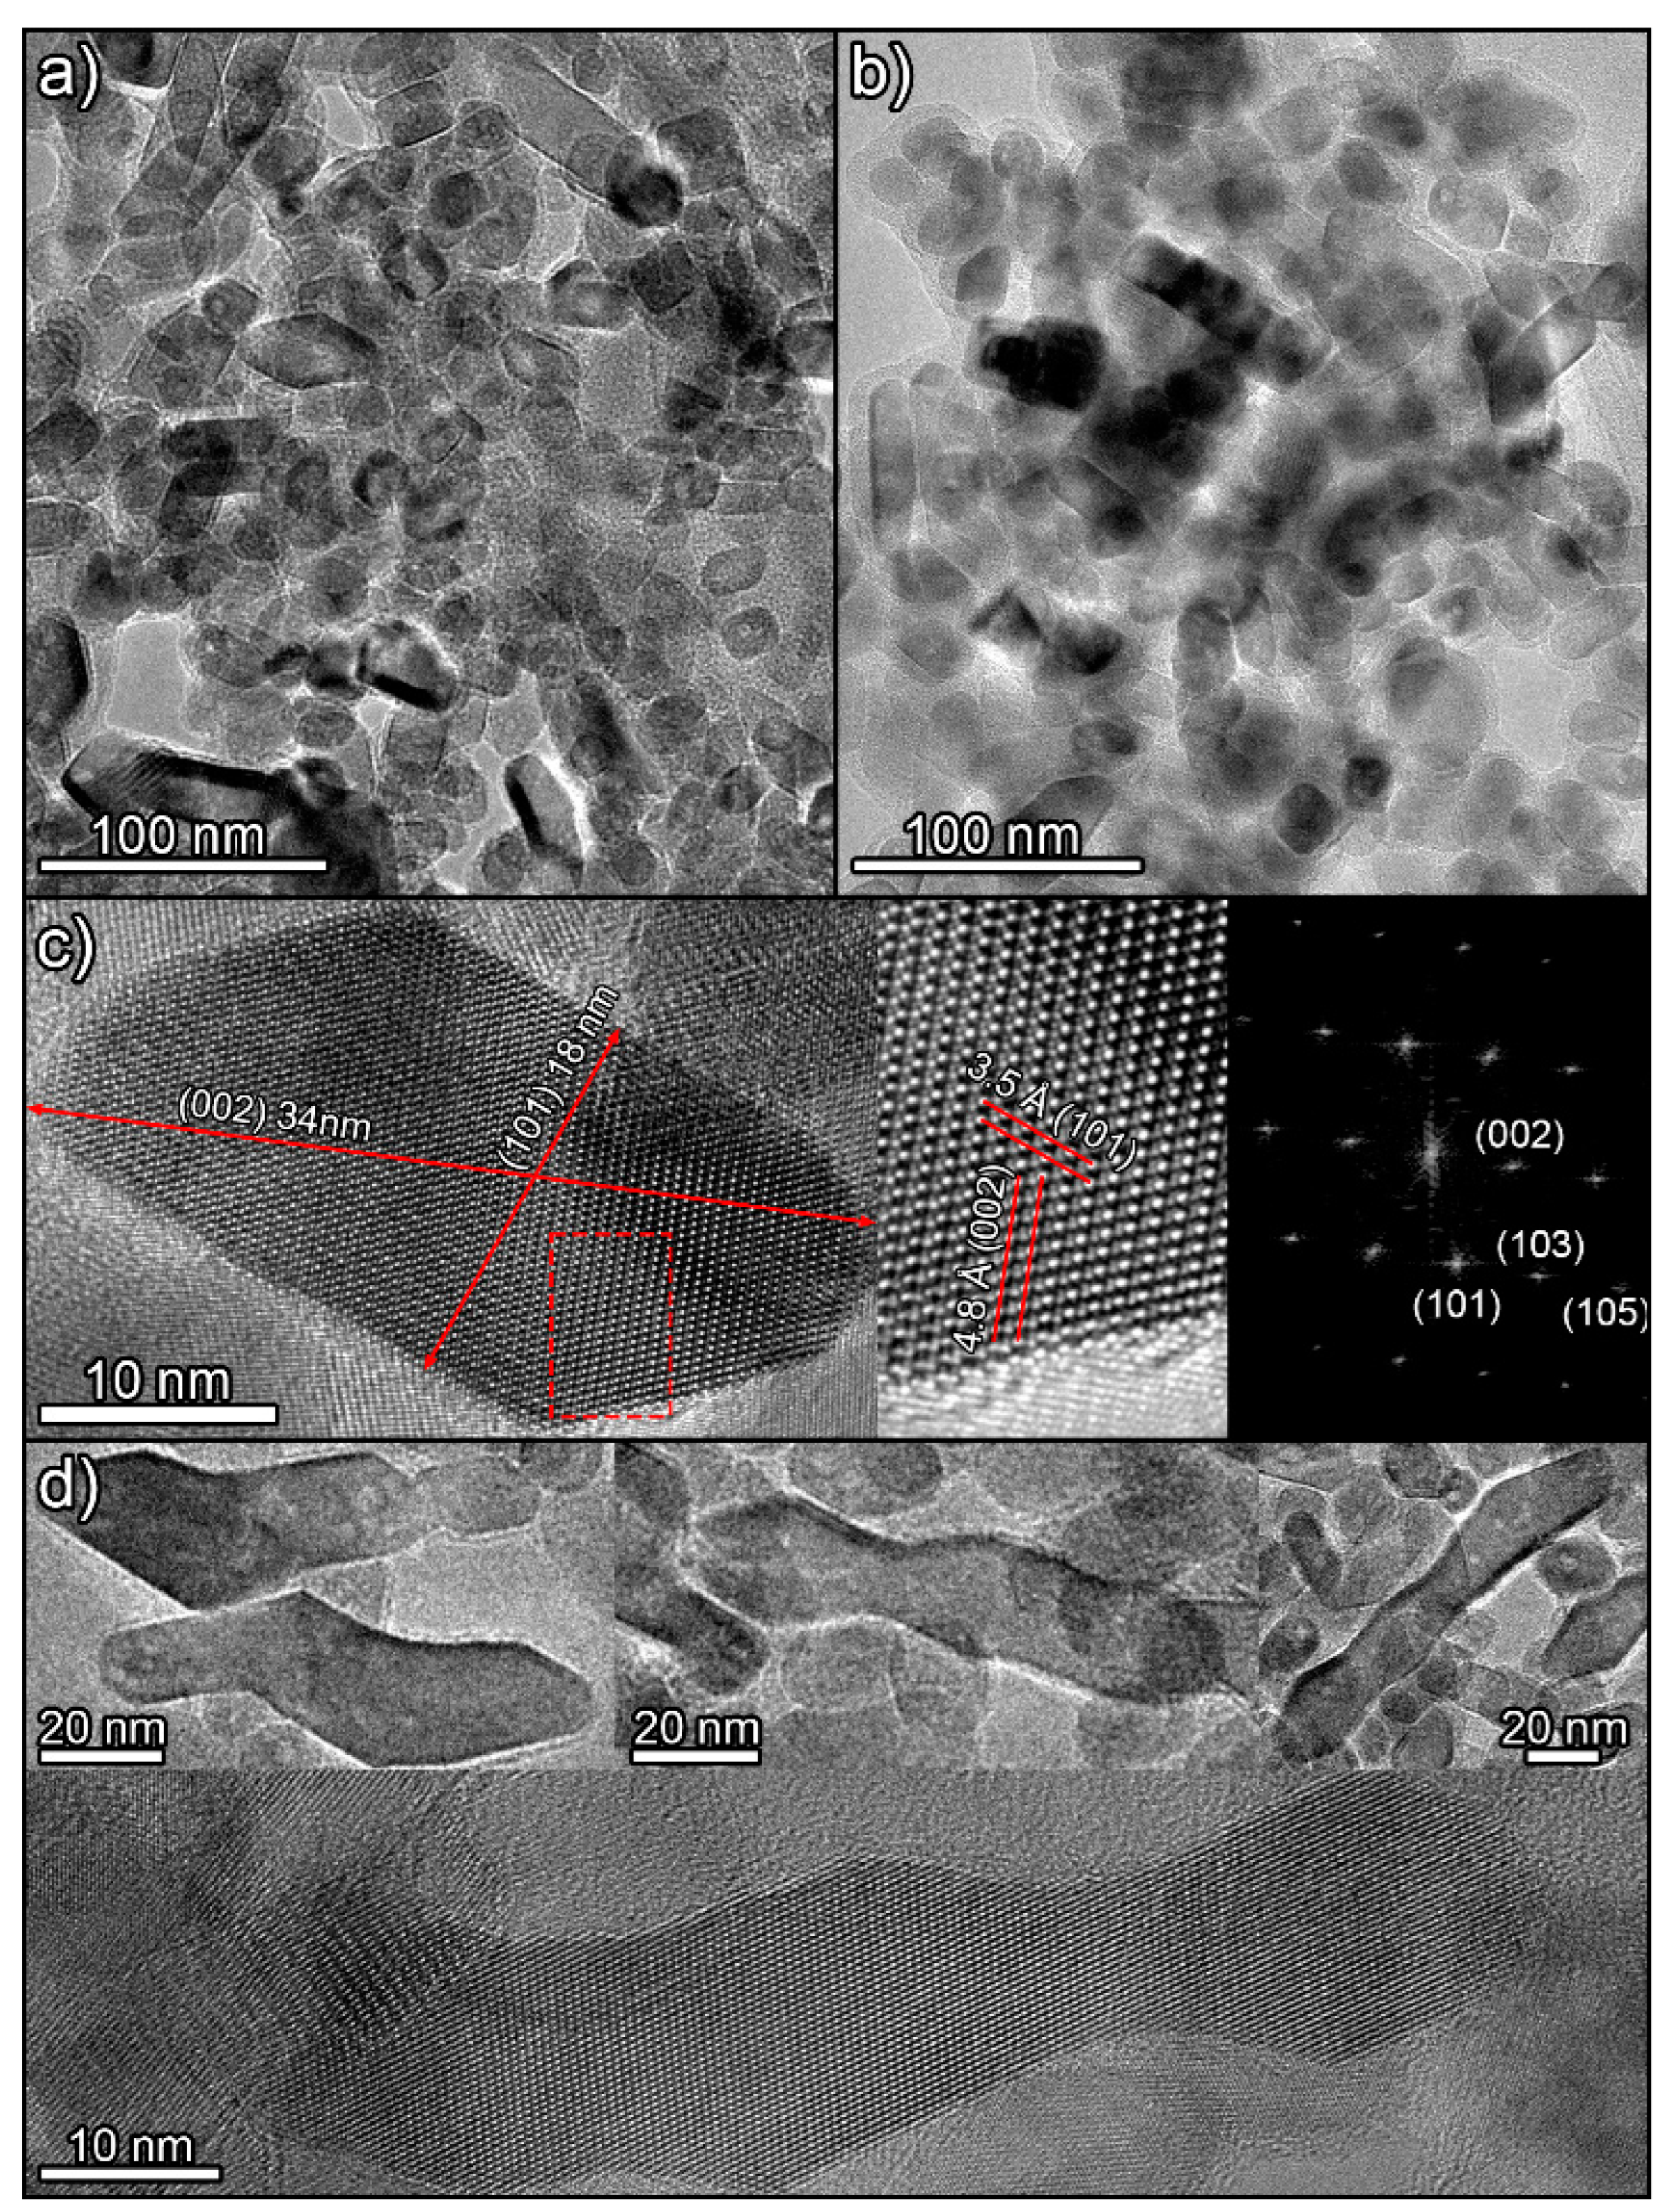
Observation of the samples by TEM confirms the SEM results. The synthetized titania photocatalysts appear to be composed of nanoparticles with a high diversity of geometries. No significant differences between H12 (Figure 3a) and H12NaOH (Figure 3b) were observed. This complex mixture of shapes can be explained by considering different 2D projections of particles with two primary polyhedral shapes (Figure S9 in Supplementary Information). Particles with rhomboid, square, and hexagonal shapes can be related to particles with truncated square bipyramid geometry [53], the most stable form of anatase. More elongated particles can be related to projections of particles with quadrangular prism geometry whose ends terminate in truncated pyramids. This structure originates when the reaction promotes the formation of exposed {010} facets [21]. The presence of these elongated particles aligns with XRD results showing larger particle sizes along the (004) axis (the same direction where particles elongate). This is further demonstrated by measuring the dimensions of an elongated particle along the (101) and (002) crystal plane directions (Figure 3c).

Figure 3.
TEM images of H12 (a) and H12NaOH (b) photocatalysts. (c) HRTEM images of an elongated particle viewed along the [010] zone axis, showing the detailed crystal structure and a digital diffraction pattern from the marked area. (d) Images of different long particles with anomalous shapes.
The decrease in the fraction of elongated particles after calcination observed by SEM could be related to a shape change to reduce the area of exposed high-energy {010} facets. Similarly, the greater aggregation of particles after calcination may be related to partial sintering to reduce the area of these exposed high-energy faces.
Finally, there are other particles much more elongated and with odd geometries, as if formed by the union of two, three, or even four of the above particles (Figure 3d). A detailed examination of these particles reveals that their planes are perfectly oriented along their entire length. This suggests they are not formed by simple aggregation but through an oriented coupling or attachment mechanism [54]. Moreover, the ending facets of these structures are of the {001} type, the highest-energy facet in anatase, favouring the observed fusion to minimize energy.
3.4. Photocatalytic and Depolluting Performance
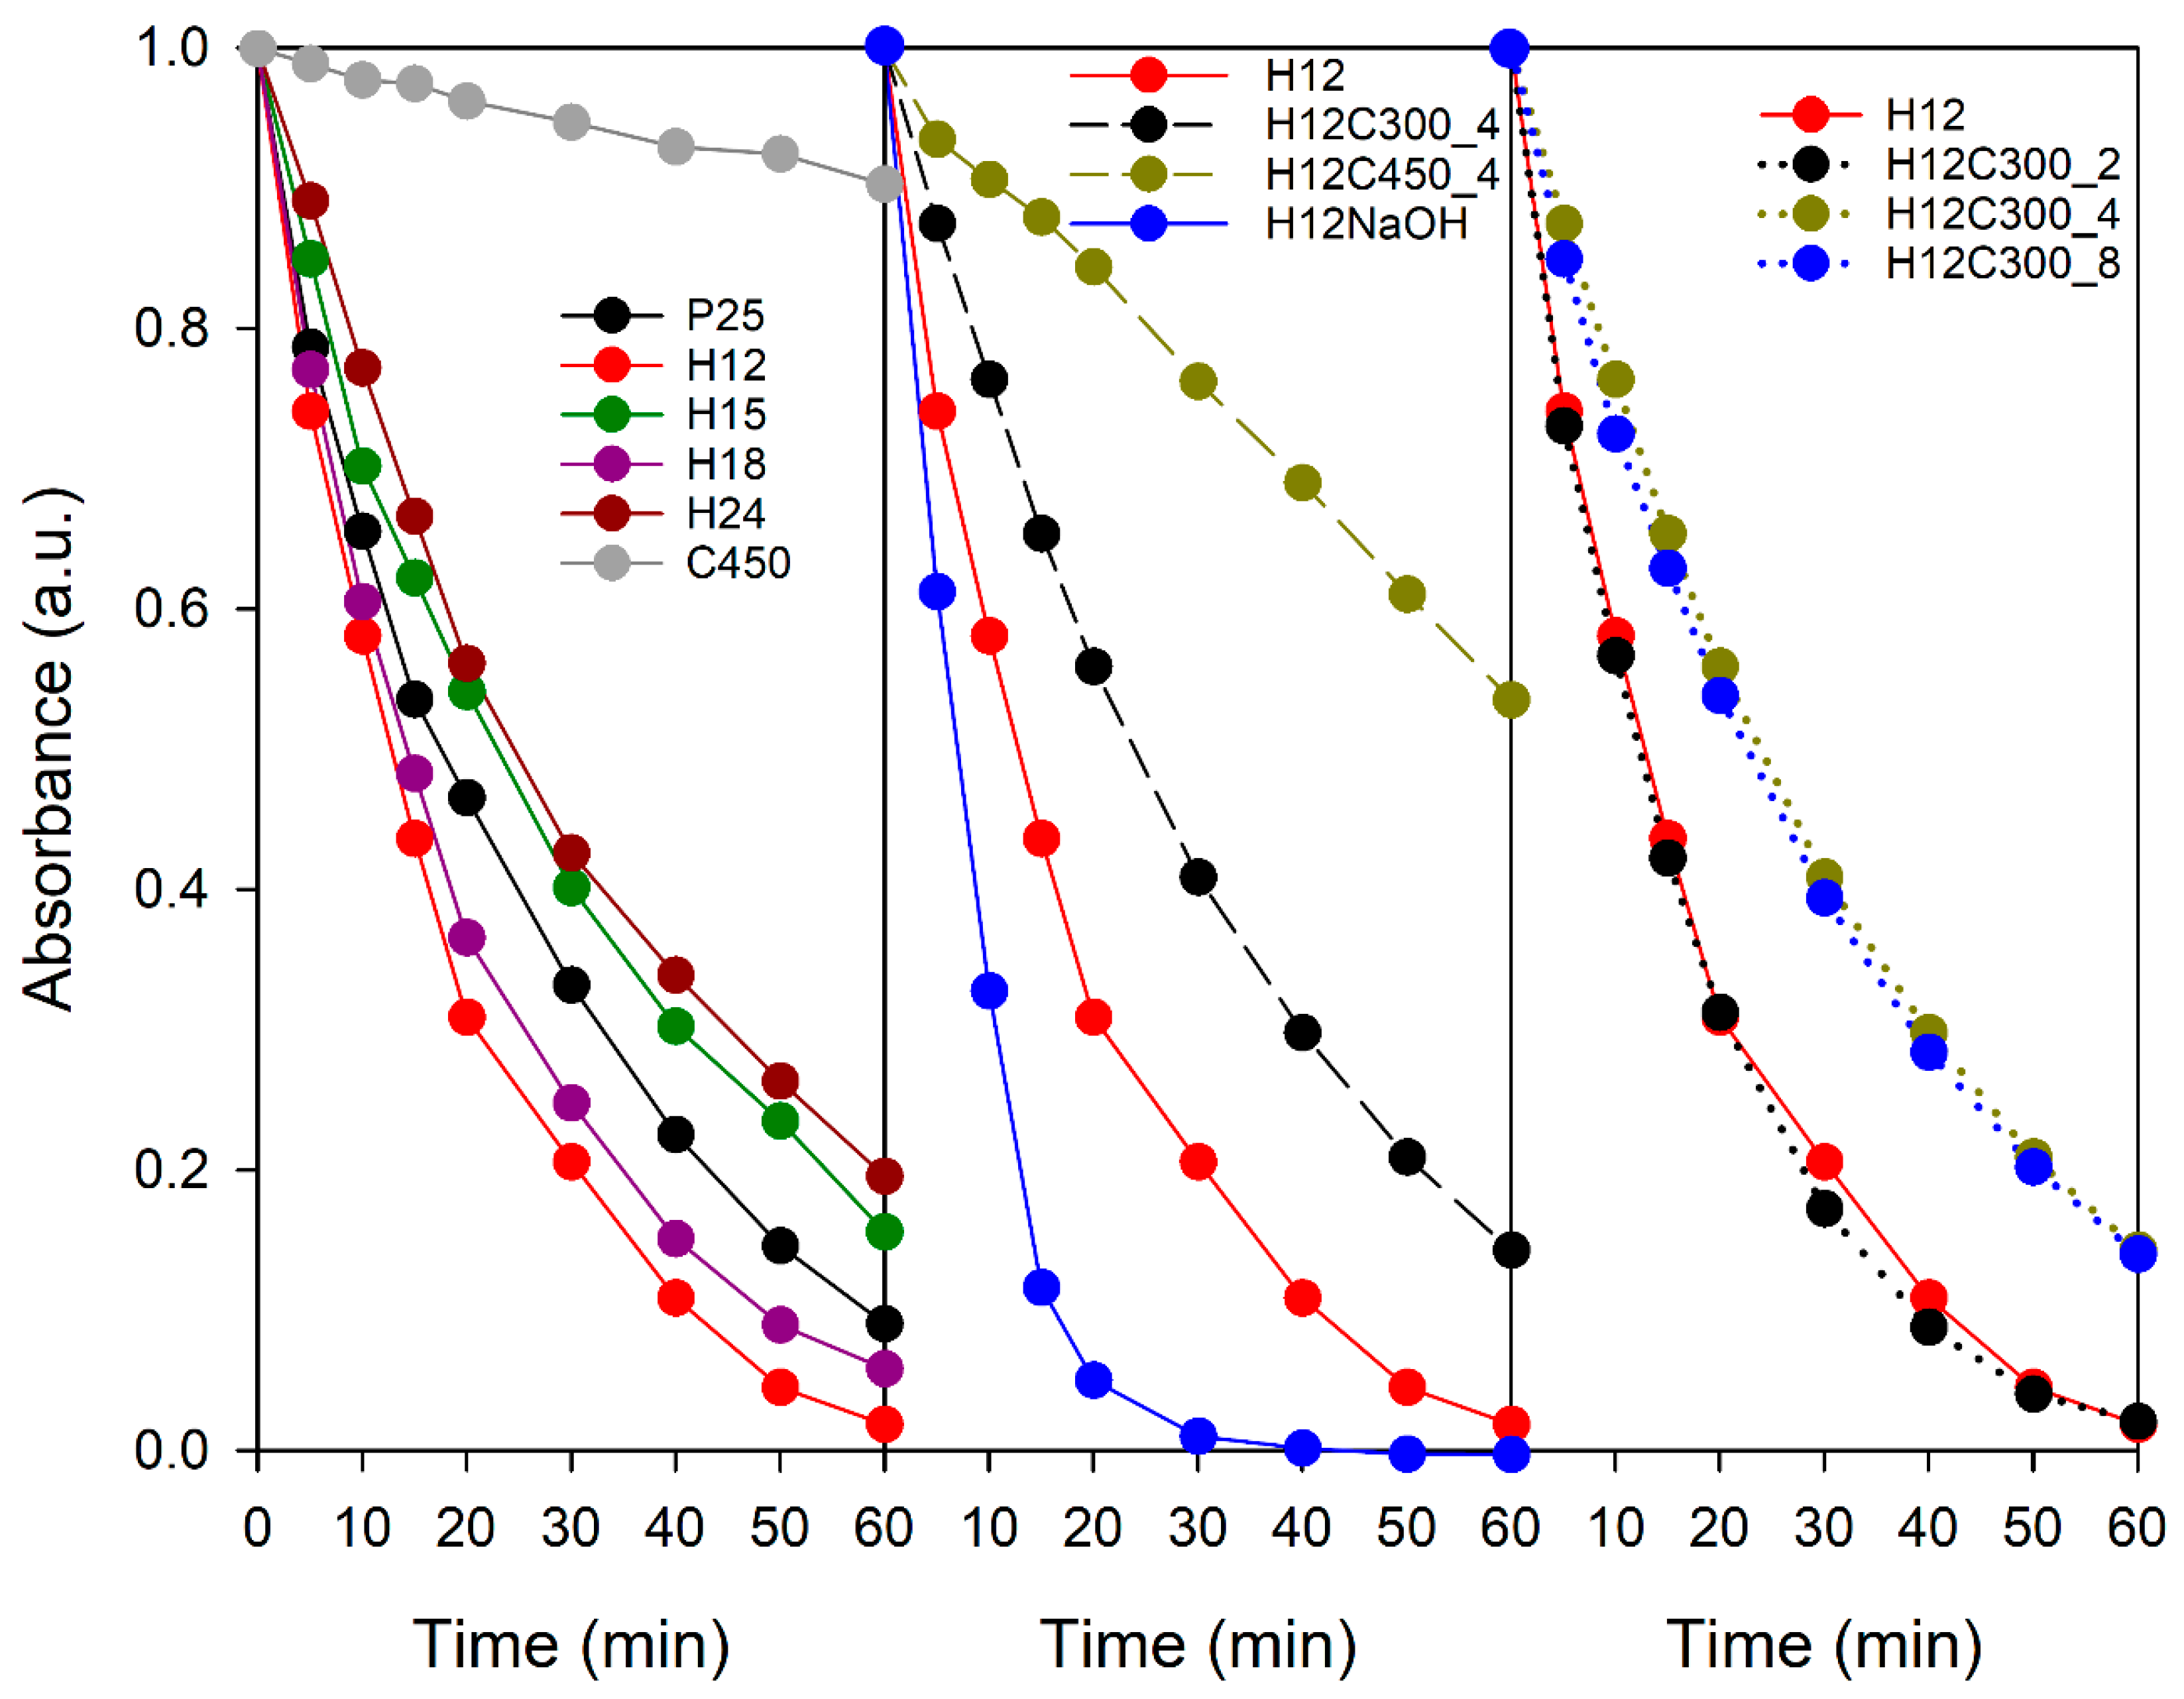
The samples’ photocatalytic activity was initially evaluated by methylene blue photodegradation in aqueous media. Figure 4 presents the degradation curves, and Table S3 in Supplementary Materials lists the corresponding rate constants. The C450 sample exhibited very limited activity, achieving only 10% degradation. This, in turn, diminishes both TiO2-MB contact and light interaction. Large aggregates absorb light only on their outer layer, leaving the interior in darkness, not contributing to the photocatalytic process [55]. For its part, P25 is renowned for its excellent photocatalytic properties due to its characteristics, such as its phase composition, high specific surface area, and the presence of surface hydroxyl groups, achieving a degradation of 90% at the same time.

Figure 4.
Evolution of MB solution absorbance during UV–visible irradiation in the presence of the TiO2 samples studied in this work.
All hydrothermal TiO2 samples showed good photocatalytic activity, highlighting the superiority of this synthesis method over sol–gel. Concerning the effect of the hydrothermal treatment time on activity, the following order was observed: H12 > H18 > H15 > H24. Except for H18, a general decrease in activity with time was noted. While longer synthesis times reduced the particle size, increasing the surface area, H24 exhibited lower crystallinity than H12, which could have a counteracting effect. Differences in activity could also be attributable to structural variations related to particle shape.
TiO2 nanoparticles typically exhibit three main exposed facets: {001}, {101}, and {010}. Bipyramidal particles expose {001} and {101} facets, with {101} dominating the surface area. Elongated particles also expose {010} facets, often constituting the majority of the exposed area. The literature suggests that anatase TiO2 photocatalysts with a high fraction of exposed {001} facets are more active than those with other geometries [22,56,57]. However, each facet possesses unique properties affecting reactivity in specific scenarios. In this way, particles with exposed {010} facets have shown superior photocatalytic performance in certain applications over those containing a higher fraction of {101} or {001} facets [23,58,59,60].
The enhanced activity of {010} facets can be attributed to the synergistic effect of their unique atomic structure and electronic surface properties. Each exposed facet exhibits a distinct atomic arrangement, where titanium and oxygen atoms have specific coordination environments. In bulk anatase, titanium atoms are coordinated to six oxygen atoms (Ti6c sites), but at the surface, this coordination is incomplete, leading to the formation of undercoordinated titanium atoms. Pentacoordinated titanium atoms (Ti5c sites) are particularly abundant, and their unsaturated coordination renders them highly reactive, making them ideal sites for adsorbing and activating reactant molecules. In the case of {010} facets, all titanium atoms are Ti5c sites, while the more stable {101} facet exhibits a 50:50 ratio of Ti5c and Ti6c sites. Consequently, {010} facets possess a higher density of active sites, resulting in significantly enhanced reactivity [61].
These differences in atomic structure also manifest in variations in the electronic properties of each surface. In the case of {010} facets, their electronic band structure exhibits a higher conduction band minimum, facilitating the formation of more reducing electrons that can be transferred to reactants via Ti5c sites [23]. Furthermore, anatase facets exhibit different work function values [62], and the combinations of co-exposed facets can enhance photocatalytic activity by forming surface heterojunctions, which effectively reduce electron–hole recombination phenomena [63,64]. In our case, in addition to intraparticle heterojunctions, contact between particles with different geometries can also create a heterojunction due to the differences in their band structure.
The presence of particles with exposed {010} facets can have a profound influence on photocatalytic activity. The reduced activity observed in samples H15 and H24, relative to H12 and H18, is likely due to the lower abundance of elongated particles, as revealed by SEM analysis. This decrease in elongated particles not only diminishes the concentration of more active {010} facets but also hinders the formation of surface heterojunctions and interparticle heterojunctions between particles with varying geometries. These heterojunctions are often crucial for efficient charge separation and transfer, which are essential for optimal photocatalytic performance.
Thus, samples H12 and H18 possess an optimal combination of morphological and physicochemical characteristics that contribute to their enhanced photocatalytic activity compared to the reference P25. The following factors, as revealed by the experimental data, can account for this superior performance:
- High specific surface area: A small particle size provides a large surface area, crucial for high photocatalytic activity. Hydrothermal titania’s surface area slightly exceeds that of P25.
- Reduced aggregation: Smaller aggregates favour TiO2-MB contact and light absorption.
- Improved light penetration: Greater transparency of hydrothermal TiO2 dispersions allows deeper light penetration in the volume of the MB solution.
- Phase composition: Hydrothermal titania only presents anatase, a more active phase than rutile, which is also present in P25. However, this combination of phases also produces a positive effect, creating a heterojunction that reduces electron–hole pair recombination. So, it is not clear which situation is more favourable.
- Particle geometry: Elongated particles in hydrothermal titania contain more active facets than those in P25. Large particles formed by oriented attachment can also enhance photocatalytic activity [65].
Regarding post-treatment, calcination had a detrimental effect on activity, increasing with temperature. This could be linked to higher particle agglomeration and changes in particle geometry, as discussed earlier. The particles with exposed {010} facets will be more prone to shape changes, aggregation, or sintering when atomic mobility increases at high temperatures to reduce surface energy. On the contrary, the NaOH-treated sample outperforms H12. This improvement is attributed to the change in the acid–base character and, consequently, in the zeta potential. While the rest of the samples showed a pH in the range of 5.0–5.6, H12NaOH presented a pH of 6.5. At this pH value, the particles acquire a negative charge (Figure S3 in Supplementary Materials), allowing greater interaction with the positively charged MB molecules.
The calcination time also influenced activity. While 2 h of treatment at 300 °C had no significant effect, longer durations led to a decrease in activity. Therefore, moderate temperatures and short times can mitigate the negative effects of calcination on photocatalytic activity.
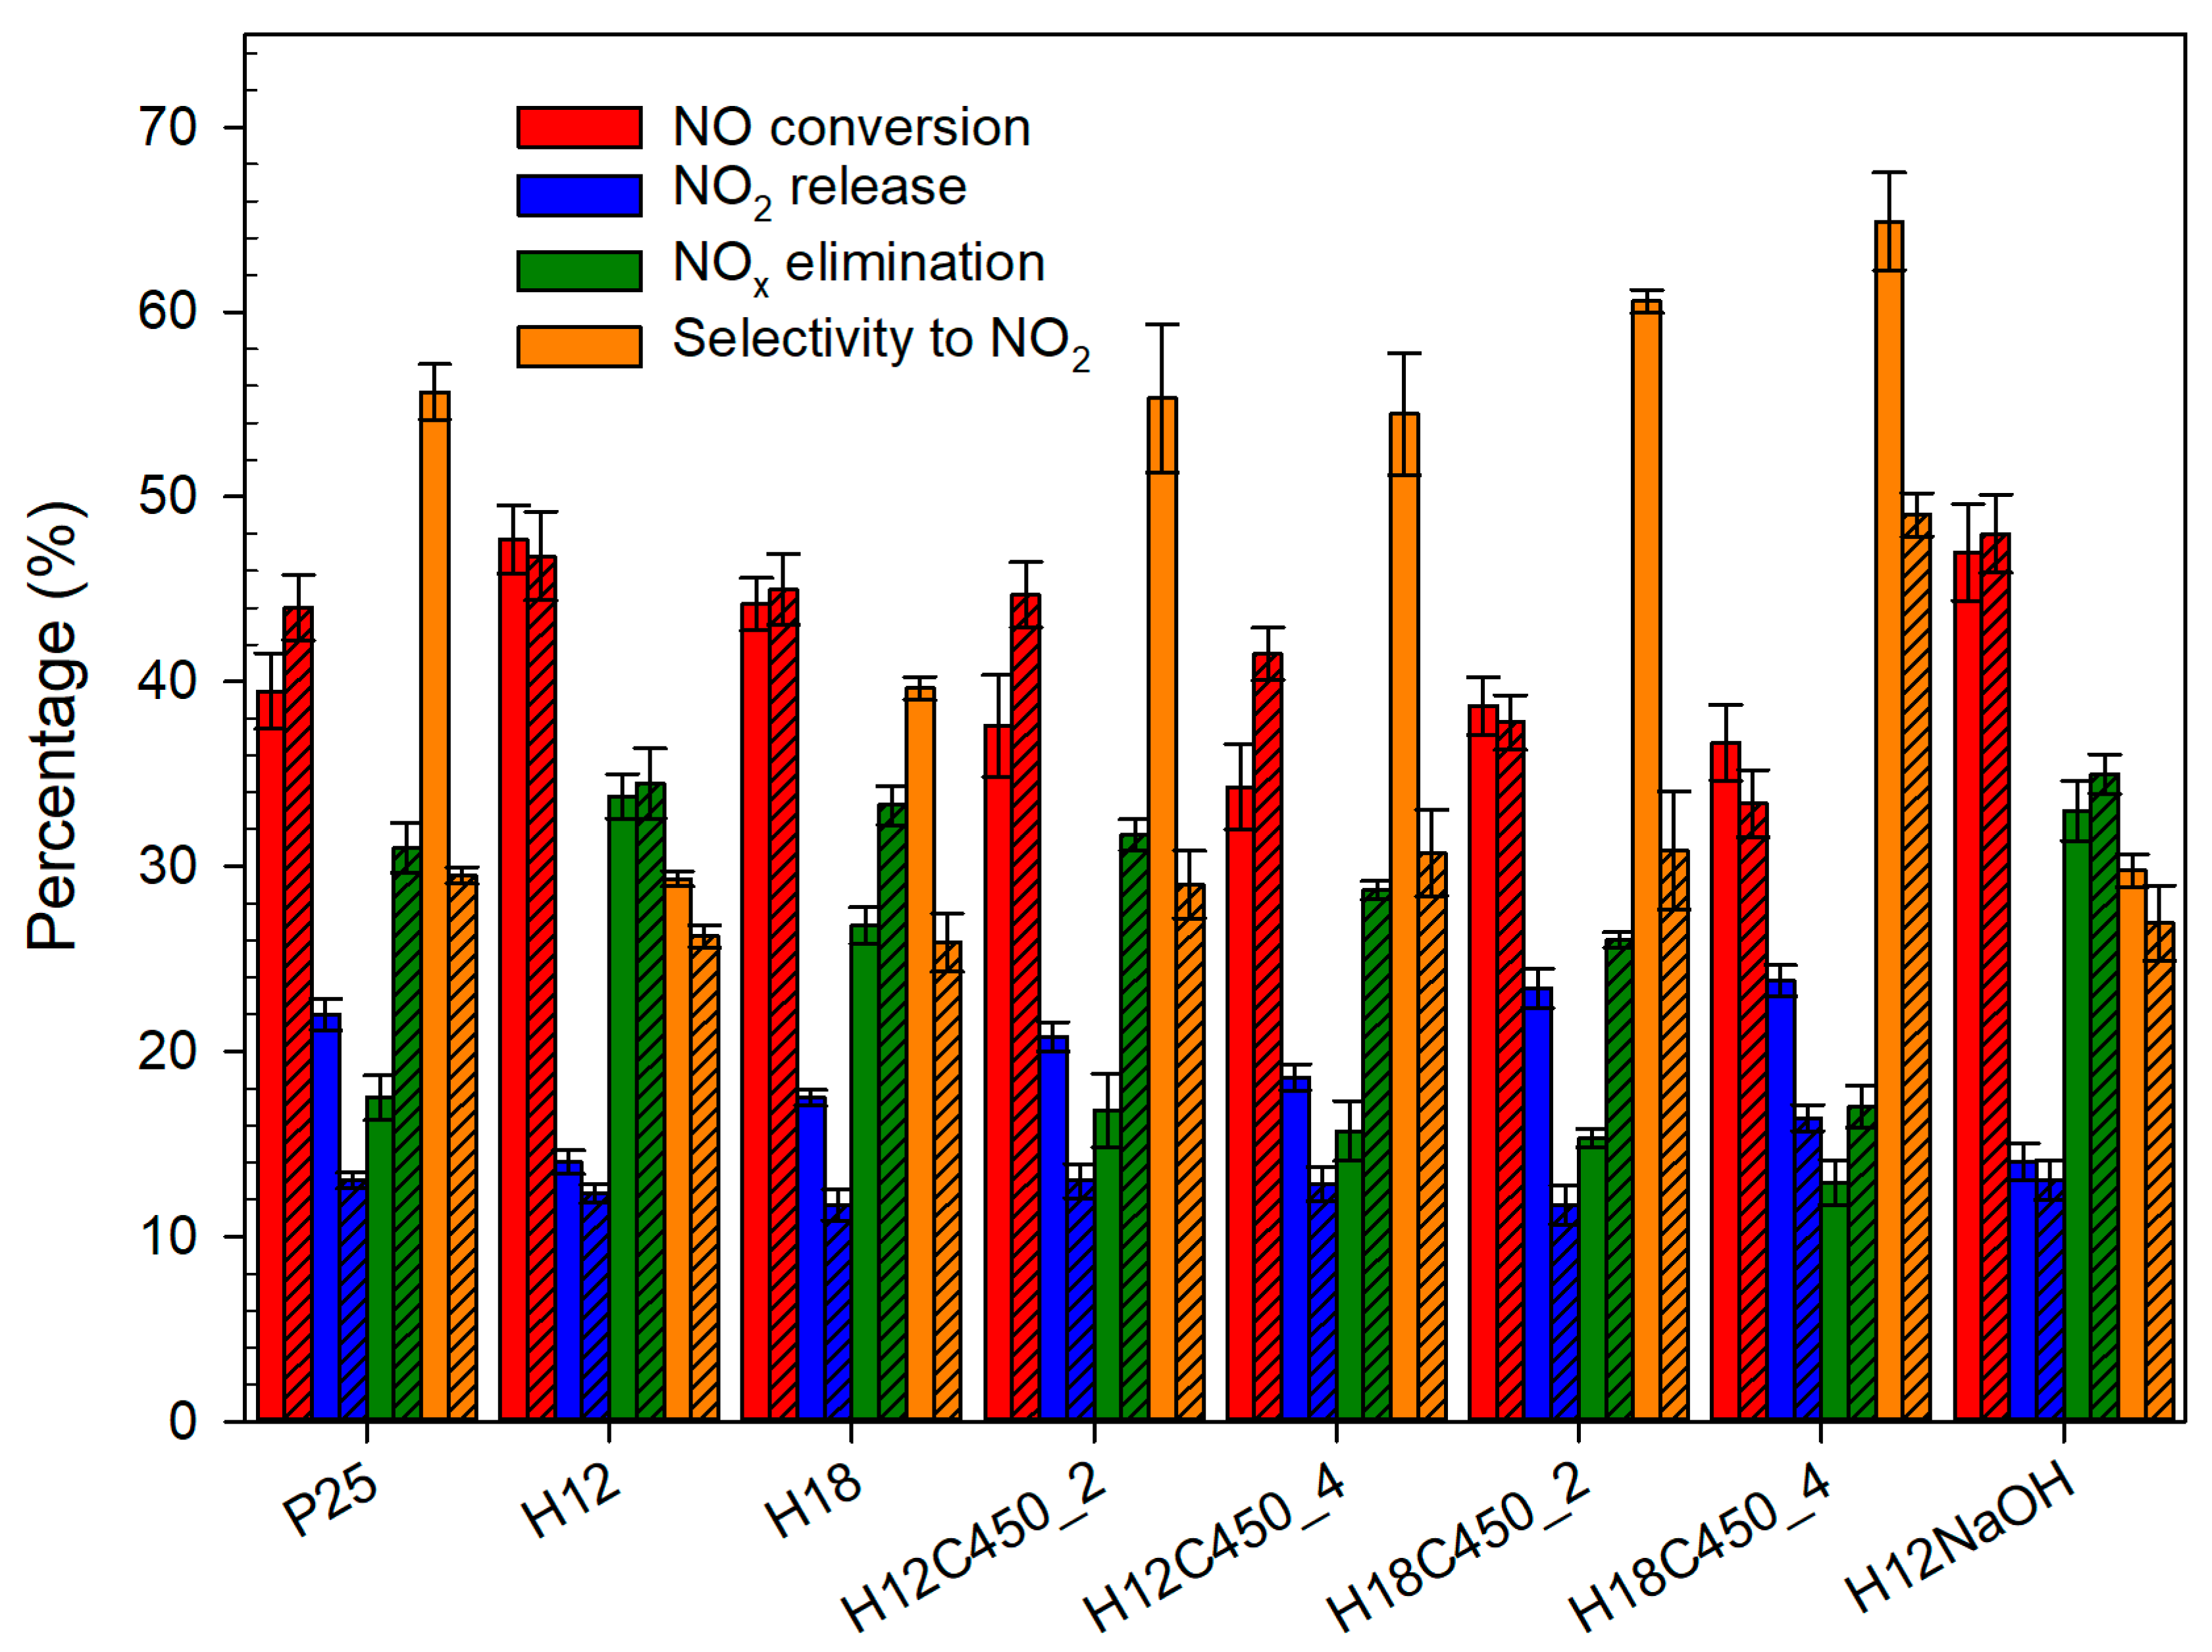
The two samples that performed best in MB photodegradation were selected to evaluate their effectiveness in the photocatalytic removal of NOx from air. The impact of the sample post-treatment on the performance was also considered. To address the potential for inherent TiO2 deactivation [66,67], tests were conducted with both pure TiO2 and TiO2 combined with Ca(OH)2. HNO3, formed as the product of the complete oxidation of NO, can accumulate on the TiO2 surface, promoting the further oxidation of NO to NO2 and limiting the effectiveness of the photocatalyst in the overall elimination of NOx. The presence of an alkali compound such as Ca(OH)2 allows HNO3 to be eliminated in the form of nitrates, minimizing this deactivation effect.
As can be seen in Figure 5, the addition of Ca(OH)2 generally improves the process by reducing NO2 release, increasing the total removal of NOx, and promoting selectivity. In some cases, Ca(OH)2 also enhances NO conversion. Both hydrothermal samples (H12 and H18) outperform P25, presenting higher NOx removal and better selectivities, both with and without Ca(OH)2. This is particularly significant, as NO2 is more toxic than NO, making photocatalysts with high NOx elimination and minimal NO2 release desirable [68]. The differences are small in the presence of Ca(OH)2, but they become more evident in its absence, suggesting that synthetized particles are less prone to deactivation. Comparing H12 and H18, the former shows better results, and it should be highlighted that its behaviour hardly depends on Ca(OH)2 presence.
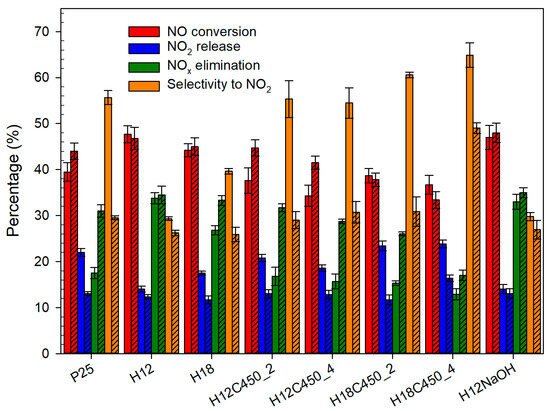
Figure 5.
NO photodegradation tests for the different TiO2 photocatalysts deposited on glass plates, showing NO conversion, NO2 release, NOx elimination, and selectivity towards NO2. Solid and striped bars denote experiments without and with Ca(OH)2, respectively.
In this solid–air system, the effect of photocatalyst particle agglomeration is less important since the photocatalysts are immobilized on a glass plate, forming a solid film of aggregated particles [69]. Considering this and the small differences in specific surface area, the higher activity can be related to the structure of the hydrothermal TiO2, combining bipiramidal and elongated anatase particles, compared to P25, which only contains bipiramidal anatase and rutile particles [70].
In addition to the general photoactivity enhancement promoted by the presence of {010} facets, these surfaces can have a specific role in NO photooxidation. All surface Ti atoms on this facet are pentacoordinated (Ti5c), while on the {101} facet, half are pentacoordinated and the rest hexacoordinated (Ti6c). The adsorption of O2, H2O, NO, and NO2 involved in the process should be more favoured on Ti5c positions than on the higher coordinated Ti6c positions, making the former more active. Additionally, the combination of diverse facets in TiO2 photocatalysts has been shown to enhance the adsorption and reactivity of gases participating in photocatalytic processes [71]. Therefore, the superior depolluting performance and lower NO2 selectivity of hydrothermal titanium compared to P25 may be attributed to the combination of its inherent photocatalytic properties, the higher concentration of active sites on the {010} facets, and the synergistic effect arising from the coexistence of {010} and {101} facets. Due to its surface being dominated by {101} facets, P25 exhibits a lower density of active sites, leading to more rapid deactivation.
Calcination decreased NOx elimination and significantly increased the selectivity, especially without Ca(OH)2. This can be linked to the decrease in the fraction of elongated particles containing {010} facets observed by SEM after calcination (Table 2). In contrast, no activity difference was observed for the sample treated with NaOH, which did not exhibit such marked structural changes, supporting the proposed relationship between photocatalyst selectivity and the existence of {010} facets.
Considering the results obtained, H12 is the photocatalyst that presents the best photocatalytic activity and the greatest NOx depollution potential. Thermal treatments of the photocatalyst are strongly discouraged due to their high impact on activity. If any post-treatment is necessary, alternative processes with mild conditions should be used.
3.5. Application of Hydrothermal Titania for Producing Functional Building Materials with Depolluting Properties
Finally, the potential applicability of hydrothermal titania (H12) for producing photocatalytic coatings on building materials was evaluated. It was integrated with a silica sol–gel treatment, and the results were compared to those of the commercial P25 photocatalyst.
A key difference between the H12 and P25 sols was the dispersion of TiO2. H12 settled faster, and a small fraction of undispersed TiO2 was observed. Whereas H12 dispersed better in water than P25, the opposite occurred in the silica sol. However, the dispersion of H12 was sufficient to obtain a homogeneous product where TiO2 remained suspended for several days, and it could be easily redispersed by simple bottle shaking.
Another difference observed was the appearance of the sols: P25 was opaque, whereas H12 was translucent. This was reflected in the colour change of the treated surfaces. P25 significantly whitened the surface, with a colour change of 4.5 (Figure S10 in Supplementary Information), which is close to the upper tolerable limit of 5 [72]. By contrast, H12 caused a much smaller, almost imperceptible colour change of 1.2. This makes H12 more suitable for applications where preserving the original appearance of the building is important.
Both treatments formed continuous, crack-free coatings that completely covered the original topography of the substrate (Figure 6). H12 exhibited some protuberances corresponding to TiO2 aggregates that were not properly dispersed in the sol. The upper layer of both coatings is formed by a compact film of TiO2 nanoparticles. H12 nanoparticles were smaller and more densely aggregated. X-EDS analysis (Figure S11 in Supplementary Information) confirmed the homogeneous TiO2 dispersion throughout the surface with overall Ti/Si ratios of 0.7 for P25 and 1 for H12. These differences are due to the heterogeneity of the substrate and variations in the coating thickness. The TiO2 surface content is much higher than the nominal TiO2/SiO2 ratio of the product, which is 10%. This confirms that the silica precursor penetrates the pores of the substrate, providing anchoring points that promote the adhesion of the coating.
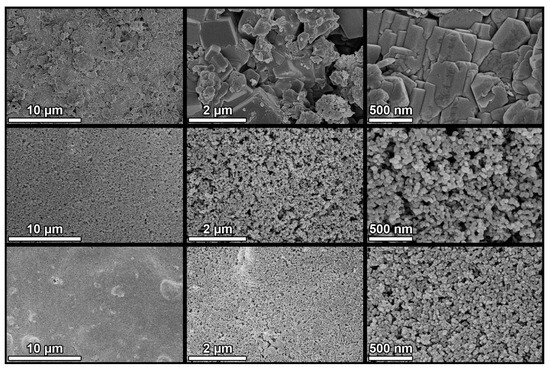
Figure 6.
SEM images of untreated (top), P25 (centre), and H12 (bottom) concrete samples at different magnifications. All images were acquired at a 5 kV acceleration voltage and a 5 mm working distance using a through-the-lens (TLD) detector in secondary electron imaging mode. Images in the same column share the same magnification: 5 k×, 30 k×, and 60 k×, from left to right.
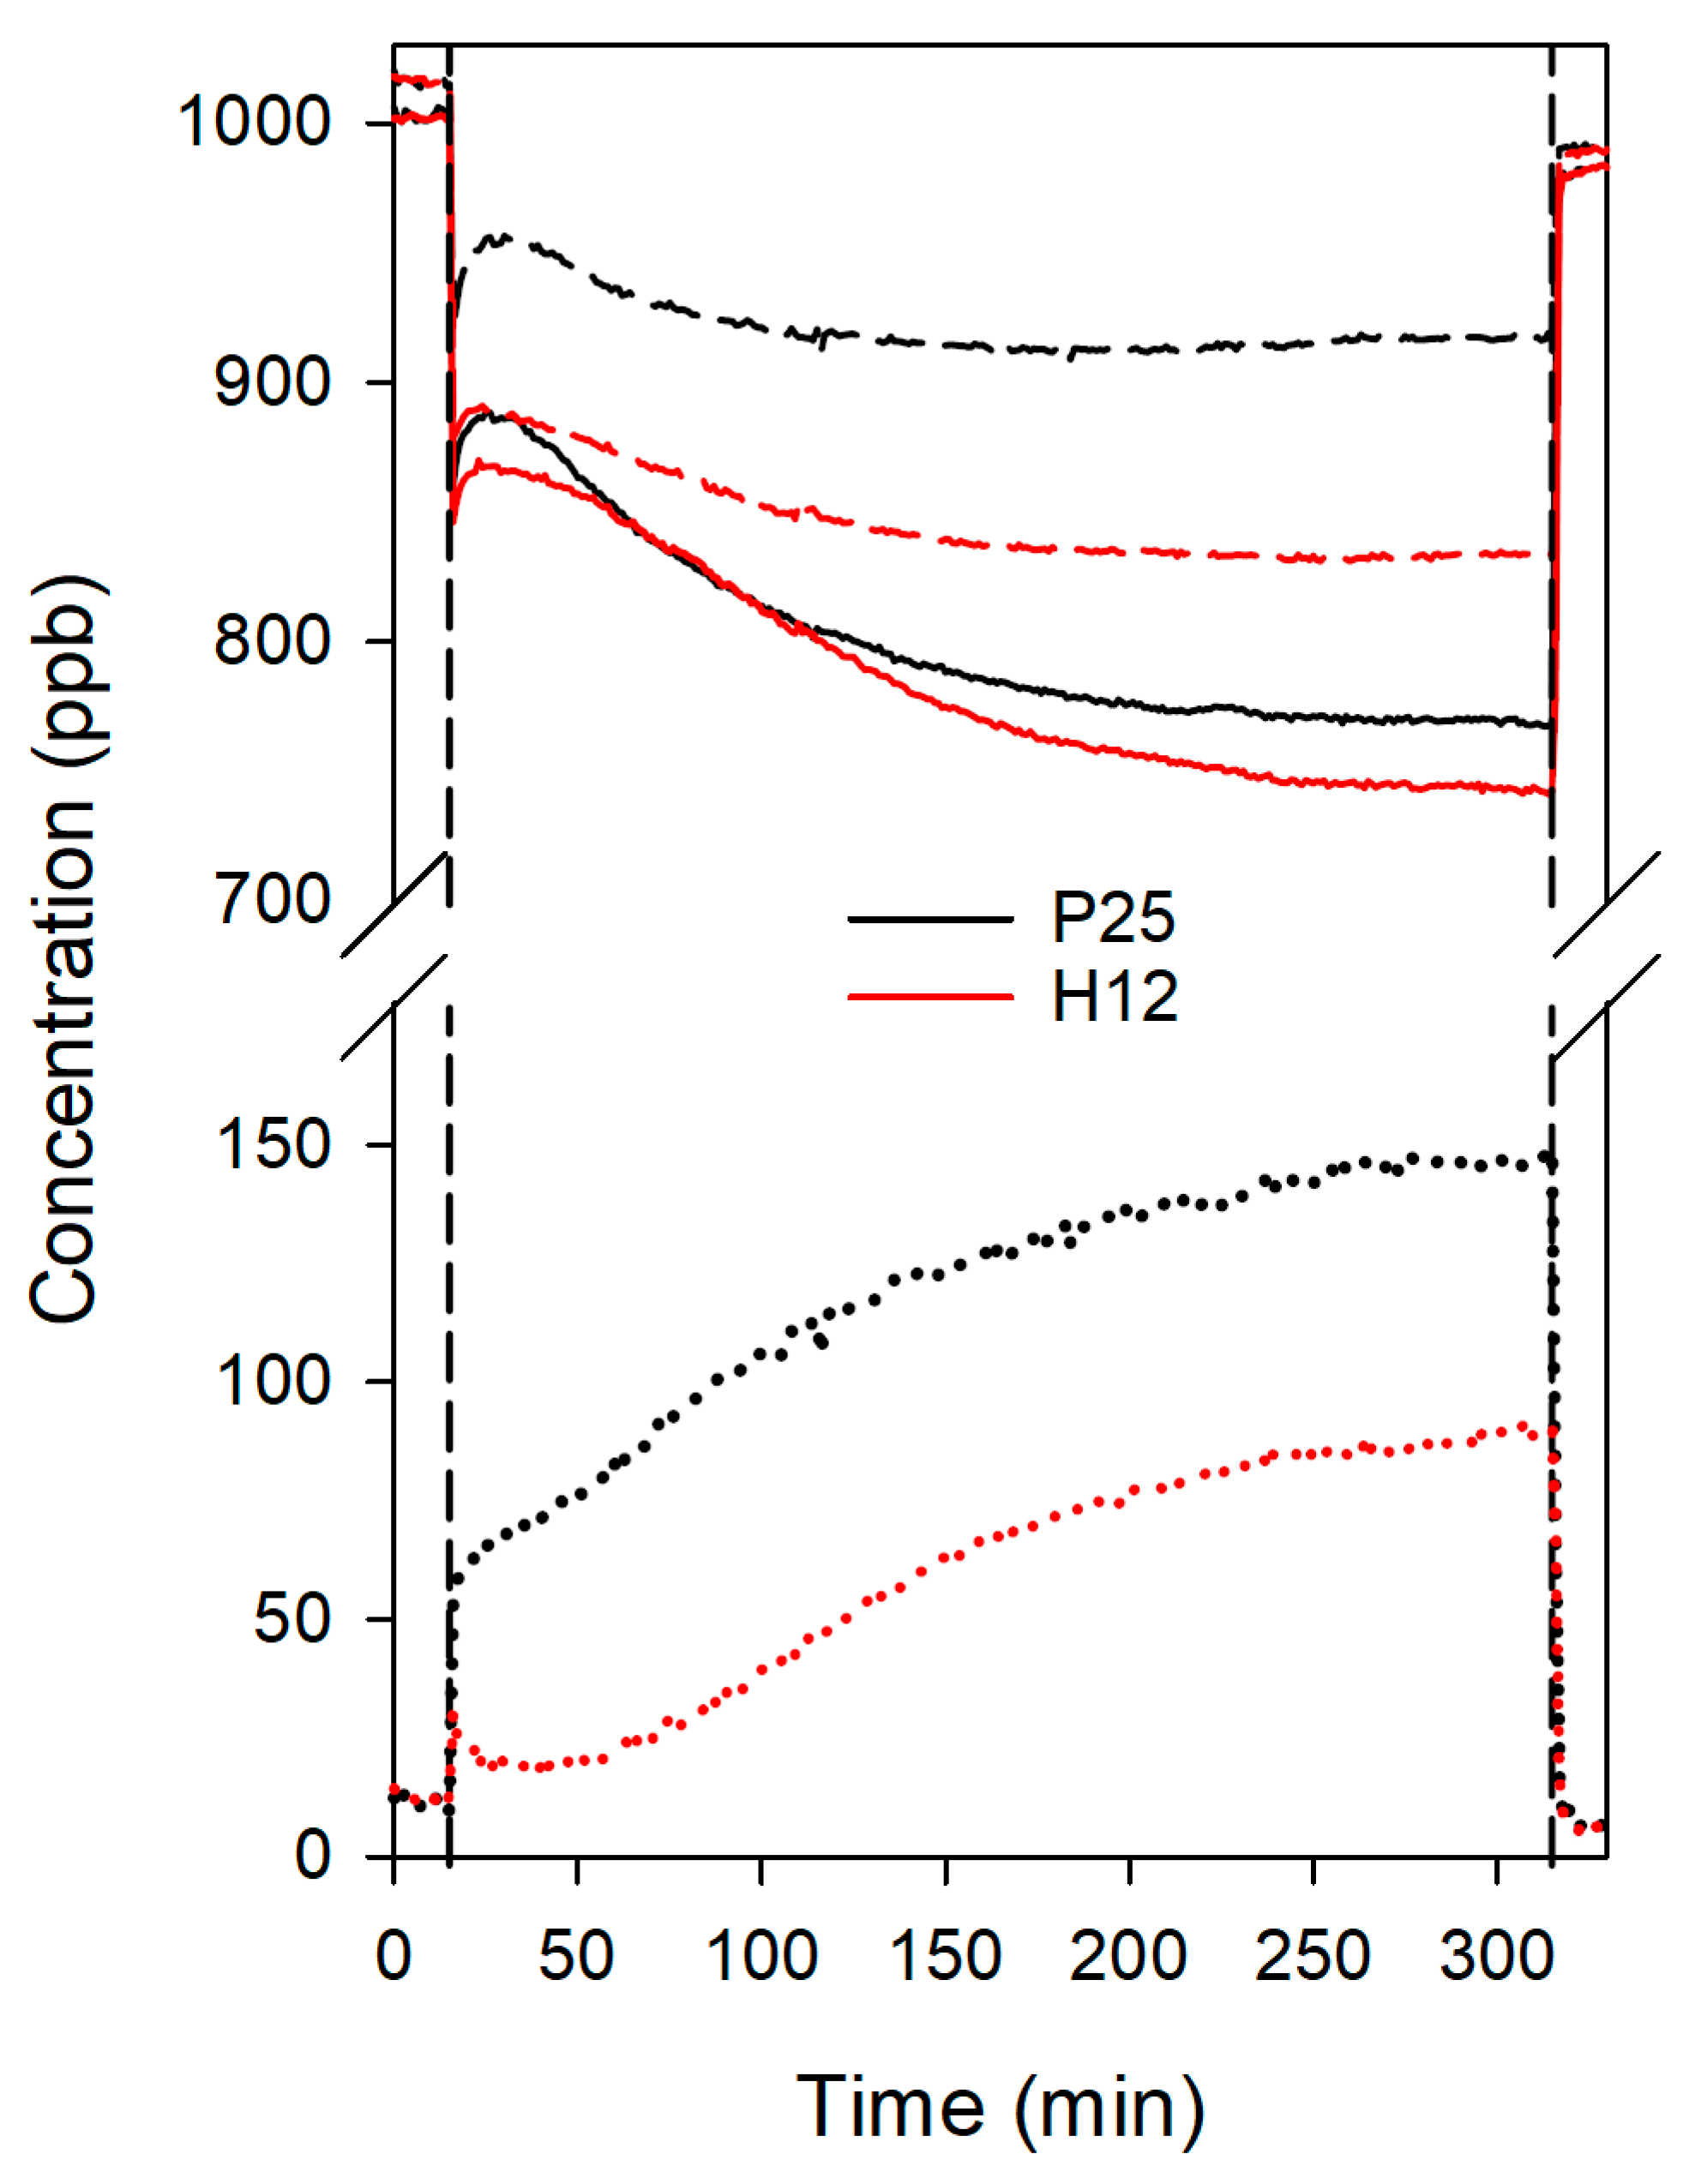
The depolluting properties of the treated materials were investigated in the photoelimination of NO (Figure 7). Both samples exhibited a similar trend, with an initial decrease in NO concentration upon lamp activation, confirming the photocatalytic behaviour of the samples. Following this initial decrease, an initial activity drop occurs, which is common in this type of system, and it is related to the TiO2 deactivation phenomena previously described, specifically due to HNO3 accumulation on the most active photocatalytic centres of the sample. After this initial activity drop, NO concentration kept decreasing continuously throughout the irradiation time. This apparent increase in activity during the test can be attributed to the infrared emission from the light source, which heats the surface of the sample and promotes the reaction of gases at the photocatalytic centres.
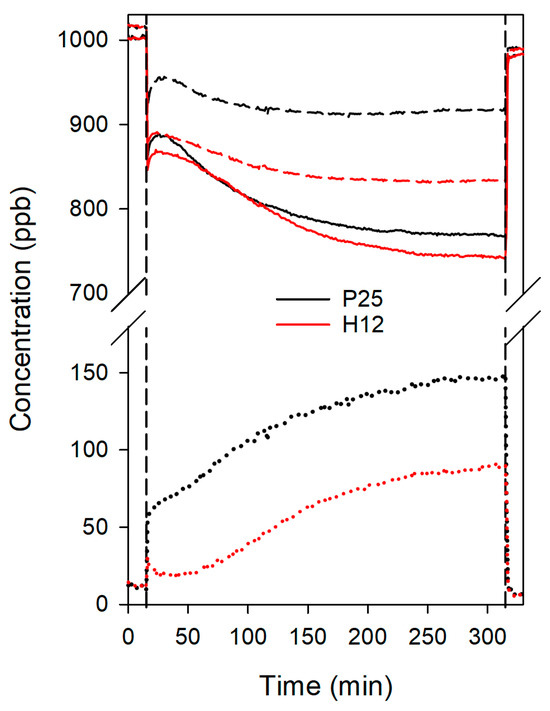
Figure 7.
Evolution of NO (solid lines), NOx (dash lines), and NO2 (dot lines) concentrations during the NO photodegradation tests for the treated concrete samples. Vertical lines correspond to the moments the lamp was turned on and off.
Despite the higher photocatalytic activity of H12, both photocatalysts exhibited similar NO conversion rates in this format, approximately 20% for H12 and 18% for P25. This discrepancy might be attributed to the worse dispersion of H12 compared to P25. However, H12 consistently outperformed P25 in terms of NO2 release. While P25 rapidly reached 50 ppb of NO2 and progressively increased to 150 ppb (a 10% total NO2 release), H12 maintained NO2 concentrations below 30 ppb for the initial 45 min and never exceeded 100 ppb, resulting in a half NO2 release compared to P25. Consequently, H12 demonstrated a 1.7-fold improvement in overall NOx removal (15% vs. 9%).
The selectivity towards NO2 was even more pronounced in H12, exhibiting a selectivity of 25% compared to 53% for P25. Given the higher toxicity of NO2, selectivity towards NO2 is a critical factor for effective depollution. To quantify the overall depolluting performance, we employed the DeNOx index proposed by Bloh et al. [68]. This index considers the higher toxicity of NO2 by assigning it a three-fold weight relative to NO. Higher DeNOx index values indicate superior depollution capability, while negative values signify that the material increases air toxicity. H12 achieved a positive DeNOx index of 5%, indicating its suitability for air purification applications, while P25 yielded a negative value of −10%. This result underscores the superior suitability of hydrothermal titania for producing functional building materials with depolluting properties compared to commercial P25.
When our results were compared to those of Khanyra et al. [19], who evaluated the depolluting potential of Cu-doped P25 on building materials using a similar sol–gel treatment and the same substrate as we did, it was observed that the optimal treatment increased NOx removal by 1.4 times and reduced NO2 release by 18% compared to undoped P25. However, the substitution of P25 with our hydrothermally prepared titania achieved a 1.7-fold increase in NOx removal and a 50% reduction in NO2 release. This demonstrates the superior performance of hydrothermal titania for environmental remediation applications, even surpassing the effectiveness of Cu-doped TiO2 P25. Notably, this performance improvement was achieved without the need for doping TiO2, suggesting the potential for further enhancing its performance through subsequent doping strategies.
4. Conclusions
In this study, we successfully synthesized highly active anatase TiO2 nanoparticles via a hydrothermal method. The optimal hydrothermal TiO2 sample exhibited superior photocatalytic performance compared to commercial P25 TiO2 in both methylene blue degradation and NO photooxidation. The enhanced activity can be attributed to the combination of high specific surface area, reduced aggregation, improved light penetration, phase composition, and particle geometry.
Regarding the last factor, the presence of elongated particles with exposed {010} facets seems to be key in the photocatalytic activity of hydrothermal titania. Calcination of the samples led to a significant decrease in both the fraction of elongated nanoparticles and photocatalytic activity, suggesting a strong correlation between these factors. In contrast, post-treatment with NaOH did not adversely affect the photocatalyst structure or activity.
The role of {010} facets in promoting photocatalytic performance has been attributed to the following:
- Increased active sites: The higher density of undercoordinated Ti5c atoms on {010} facets provides more active sites for adsorbing reactant molecules.
- Favourable band alignment: The higher conduction band minimum of {010} facets facilitates the generation of more reducing electrons, which can effectively participate in redox reactions.
- Enhanced charge separation: Differences in work function between different crystal facets can promote the formation of intra- and interparticle heterojunctions, reducing charge carrier recombination and improving photocatalytic efficiency.
The hydrothermally synthesized TiO2 demonstrated superior performance in air remediation compared to commercial P25 TiO2. It exhibited higher efficiency in NO photooxidation, eliminating more NOx while minimizing the formation of the more harmful NO2. This enhanced performance was retained when the TiO2 was integrated into silica-based coatings applied to concrete surfaces. Furthermore, the hydrothermal TiO2 induced a much smaller colour change in the substrate compared to P25, making it a more suitable candidate for producing functional building materials for air pollution mitigation.
Future research should focus on improving the dispersion of the TiO2 nanoparticles within the silica sol to maximize their photocatalytic potential. Furthermore, exploring strategies such as doping or metal nanoparticle deposition can extend the photocatalytic activity to the visible light region and enhance overall pollutant degradation capabilities.
Supplementary Materials
The following supporting information can be downloaded at https://www.mdpi.com/article/10.3390/technologies13020052/s1: Figure S1: Scheme of TiO2 synthesis procedure. Figure S2: The emission spectrum of the lamp employed in the photoactivity tests. Figure S3: The zeta potential of the H12 and H12NaOH samples as a function of pH. Figure S4: Tauc plots of the UV-vis diffuse reflectance spectra of the photocatalyst employed for bandgap determination. Figure S5: N2 physisorption isotherms and BJH pore size distributions obtained for some of the TiO2 photocatalysts under study. Figure S6: XRD diagrams of some of the TiO2 samples prepared. The diffractogram of commercial P25 is also included as a reference. Figure S7: SEM images of H12 (top) and C450 (bottom) photocatalysts. Figure S8: Particle size distributions of the photocatalysts studied by SEM. Figure S9: Representation of how two different polyhedra can produce the 2D projections observed in the TEM images. Figure S10: Photographs of concrete treated with P25 and H12 samples compared to their untreated counterpart. Figure S11: X-EDS elemental maps of P25 (left) and H12 (right) concrete samples showing Ti (red) and Si (blue) signals. Table S1: Lattice parameters of the bulk anatase reference structure and those obtained from the Rietveld analysis of the XRD data collected on some prepared samples using Fullprof software; Table S2: Percentages of phases in some TiO2 samples from XRD data analysis; Table S3: Rate constants for the MB degradation tests.
Author Contributions
Conceptualization, M.L.; data curation, M.L.; formal analysis, H.V.; funding acquisition, M.J.M.; investigation, M.L., J.L.C., A.C., and G.A.C.; methodology, M.L.; project administration, J.M.G.; resources, M.J.M.; software, G.A.C.; supervision, J.M.G.; validation, H.V.; visualization, J.M.G.; writing—original draft, M.L.; writing—review and editing, H.V. All authors have read and agreed to the published version of the manuscript.
Funding
This research was funded by the Ministry of Science and Innovation of Spain/FEDER Programme of the EU (PID2020-115843RB-I00/AEI/10.13039/501100011033) and the European Union under the 2014-200 ERDF Operational Programme and the Department of Economic Transformation, Industry, Knowledge, and Universities of the Regional Government of Andalusia (FEDER-UCA18-106613). The University Institute of Research on Electron Microscopy and Materials (IMEYMAT), the Central Services of Science and Technology (SC-ICYT) of Cadiz University and the Junta de Andalucía (FQM-110 group) also supported this research. M. Luna acknowledges the Spanish Government for his Margarita Salas grant (2021-067/PN/MS-RECUAL/CD) supported by the European Union-NextGenerationEU.
Institutional Review Board Statement
Not applicable.
Informed Consent Statement
Not applicable.
Data Availability Statement
The raw data supporting the conclusions of this article will be made available by the authors on request.
Conflicts of Interest
The authors declare no conflicts of interest. The funders had no role in the design of the study; in the collection, analyses or interpretation of data; in the writing of the manuscript; or in the decision to publish the results.
References
- European Environment Agency (EEA). European Union Emission Inventory Report 1990–2022—Under the UNECE Convention on Long-Range Transboundary Air Pollution (Air Convention); European Environment Agency (EEA): Copenhagen, Denmark, 2024. [Google Scholar]
- European Environment Agency (EEA). Harm to Human Health from Air Pollution in Europe: Burden of Disease 2023; European Environment Agency (EEA): Copenhagen, Denmark, 2023. [Google Scholar]
- Russell, H.S.; Frederickson, L.B.; Hertel, O.; Ellermann, T.; Jensen, S.S. A Review of Photocatalytic Materials for Urban NOx Remediation. Catalysts 2021, 11, 675. [Google Scholar] [CrossRef]
- Luévano-Hipólito, E.; de la Cruz, A.M. Enhancement of Photocatalytic Properties of TiO2 for NO Photo-Oxidation by Optimized Sol–Gel Synthesis. Res. Chem. Intermed. 2016, 42, 7065–7084. [Google Scholar] [CrossRef]
- Yu, J.C.C.; Nguyen, V.H.; Lasek, J.; Wu, J.C.S. Titania Nanosheet Photocatalysts with Dominantly Exposed (001) Reactive Facets for Photocatalytic NOx Abatement. Appl. Catal. B Environ. 2017, 219, 391–400. [Google Scholar] [CrossRef]
- Luna, M.; Cruceira, Á.; Díaz, A.; Gatica, J.M.; Mosquera, M.J. Influence of Gold Nanoparticles Size for Photocatalytic NO Oxidation in Low Loading Au/TiO2 Catalysts. Environ. Technol. Innov. 2023, 30, 103070. [Google Scholar] [CrossRef]
- Kuppusamy, M.; Kim, S.W.; Lee, K.P.; Jo, Y.J.; Kim, W.J. Development of TiO2–CaCO3 Based Composites as an Affordable Building Material for the Photocatalytic Abatement of Hazardous NOx from the Environment. Nanomaterials 2024, 14, 136. [Google Scholar] [CrossRef]
- Hu, Y.; Song, X.; Jiang, S.; Wei, C. Enhanced Photocatalytic Activity of Pt-Doped TiO2 for NOx Oxidation Both under UV and Visible Light Irradiation: A Synergistic Effect of Lattice Pt4+ and Surface PtO. Chem. Eng. J. 2015, 274, 102–112. [Google Scholar] [CrossRef]
- Kuppusamy, M.; Passi, M.; Sundaram, S.K.; Vadivel, G.; Rathinasamy, M.; Lee, K.P.; Kim, W.J. Synergistic Effect of Li, La Co-Doping on Photocatalytic Activity of BaTiO3 Ferroelectric Material for Effective Degradation of Toxic NOx for Environmental Remediation. J. Environ. Chem. Eng. 2024, 12, 112801. [Google Scholar] [CrossRef]
- Papailias, I.; Todorova, N.; Giannakopoulou, T.; Ioannidis, N.; Boukos, N.; Athanasekou, C.P.; Dimotikali, D.; Trapalis, C. Chemical vs Thermal Exfoliation of G-C3N4 for NOx Removal under Visible Light Irradiation. Appl. Catal. B Environ. 2018, 239, 16–26. [Google Scholar] [CrossRef]
- Singh, L.P.; Dhaka, R.K.; Ali, D.; Tyagi, I.; Sharma, U.; Banavath, S.N. Remediation of Noxious Pollutants Using Nano-Titania-Based Photocatalytic Construction Materials: A Review. Environ. Sci. Pollut. Res. 2021, 28, 34087–34107. [Google Scholar] [CrossRef]
- Zhang, J.; Tan, H.; Deng, X. NOx Removal Ability of Photocatalytic Cement-Based Materials with Porous Structure. J. Clean. Prod. 2022, 377, 134396. [Google Scholar] [CrossRef]
- Pinho, L.; Mosquera, M.J. Photocatalytic Activity of TiO2-SiO2 Nanocomposites Applied to Buildings: Influence of Particle Size and Loading. Appl. Catal. B Environ. 2013, 134–135, 205–221. [Google Scholar] [CrossRef]
- Khannyra, S.; Luna, M.; Gil, M.L.A.; Addou, M.; Mosquera, M.J. Self-Cleaning Durability Assessment of TiO2/SiO2 Photocatalysts Coated Concrete: Effect of Indoor and Outdoor Conditions on the Photocatalytic Activity. Build. Environ. 2022, 211, 108743. [Google Scholar] [CrossRef]
- Pinho, L.; Rojas, M.; Mosquera, M.J. Ag–SiO2–TiO2 Nanocomposite Coatings with Enhanced Photoactivity for Self-Cleaning Application on Building Materials. Appl. Catal. B Environ. 2015, 178, 144–154. [Google Scholar] [CrossRef]
- Luna, M.; Mosquera, M.J.; Vidal, H.; Gatica, J.M. Au-TiO2/SiO2 Photocatalysts for Building Materials: Self-Cleaning and de-Polluting Performance. Build. Environ. 2019, 164, 106347. [Google Scholar] [CrossRef]
- Luna, M.; Gatica, J.M.; Vidal, H.; Mosquera, M.J. Use of Au/N-TiO2/SiO2 Photocatalysts in Building Materials with NO Depolluting Activity. J. Clean. Prod. 2020, 243, 118633. [Google Scholar] [CrossRef]
- Khannyra, S.; Gil, M.L.A.; Addou, M.; Mosquera, M.J. Dye Decomposition and Air De-Pollution Performance of TiO2/SiO2 and N-TiO2/SiO2 Photocatalysts Coated on Portland Cement Mortar Substates. Environ. Sci. Pollut. Res. 2022, 29, 63112–63125. [Google Scholar] [CrossRef] [PubMed]
- Khannyra, S.; Mosquera, M.J.; Addou, M.; Gil, M.L.A. Cu-TiO2/SiO2 Photocatalysts for Concrete-Based Building Materials: Self-Cleaning and Air de-Pollution Performance. Constr. Build. Mater. 2021, 313, 125419. [Google Scholar] [CrossRef]
- Luna, M.; Delgado, J.J.; Romero, I.; Montini, T.; Almoraima Gil, M.L.; Martínez-López, J.; Fornasiero, P.; Mosquera, M.J. Photocatalytic TiO2 Nanosheets-SiO2 Coatings on Concrete and Limestone: An Enhancement of de-Polluting and Self-Cleaning Properties by Nanoparticle Design. Constr. Build. Mater. 2022, 338, 127349. [Google Scholar] [CrossRef]
- Liu, G.; Yang, H.G.; Pan, J.; Yang, Y.Q.; Lu, G.Q.M.; Cheng, H.-M. Titanium Dioxide Crystals with Tailored Facets. Chem. Rev. 2014, 114, 9559–9612. [Google Scholar] [CrossRef] [PubMed]
- Ye, L.; Mao, J.; Liu, J.; Jiang, Z.; Peng, T.; Zan, L. Synthesis of Anatase TiO2 Nanocrystals with {101}, {001} or {010} Single Facets of 90% Level Exposure and Liquid-Phase Photocatalytic Reduction and Oxidation Activity Orders. J. Mater. Chem. A 2013, 1, 10532–10537. [Google Scholar] [CrossRef]
- Pan, J.; Liu, G.; Lu, G.Q.M.; Cheng, H.-M. On the True Photoreactivity Order of {001}, {010}, and {101} Facets of Anatase TiO2 Crystals. Angew. Chemie Int. Ed. 2011, 50, 2133–2137. [Google Scholar] [CrossRef] [PubMed]
- Lv, K.; Xiang, Q.; Yu, J. Effect of Calcination Temperature on Morphology and Photocatalytic Activity of Anatase TiO2 Nanosheets with Exposed {001} Facets. Appl. Catal. B Environ. 2011, 104, 275–281. [Google Scholar] [CrossRef]
- Tandon, S.P.; Gupta, J.P. Measurement of Forbidden Energy Gap of Semiconductors by Diffuse Reflectance Technique. Phys. Status Solidi 1970, 38, 363–367. [Google Scholar] [CrossRef]
- Tauc, J. Optical Properties and Electronic Structure of Amorphous Ge and Si. Mater. Res. Bull. 1968, 3, 37–46. [Google Scholar] [CrossRef]
- Jensen, H.; Joensen, K.D.; Jørgensen, J.-E.; Pedersen, J.S.; Søgaard, E.G. Characterization of Nanosized Partly Crystalline Photocatalysts. J. Nanoparticle Res. 2004, 6, 519–526. [Google Scholar] [CrossRef]
- Rodríguez-Carvajal, J. Recent Advances in Magnetic Structure Determination by Neutron Powder Diffraction. Phys. B Condens. Matter 1993, 192, 55–69. [Google Scholar] [CrossRef]
- EN 15886:2010; Conservation of Cultural Property—Test Methods—Colour Measurement of Surfaces. Ente Nazionale Italiano di Unificazione: Milan, Italy, 2010.
- ISO 22197-1:2016; Fine Ceramics (Advanced Ceramics, Advanced Technical Ceramics)—Test Method for Air Purification Performance of Semiconducting Photocatalytic Materials—Part 1: Removal of Nitric Oxide 2016. International Organization for Standardization: Geneva, Switzerland, 2016.
- Kwon, D.; Lee, S.H.; Kim, J.; Yoon, T.H. Dispersion, Fractionation and Characterization of Sub-100nm P25 TiO2 Nanoparticles in Aqueous Media. Toxicol. Environ. Health Sci. 2010, 2, 78–85. [Google Scholar] [CrossRef]
- Liao, D.L.; Wu, G.S.; Liao, B.Q. Zeta Potential of Shape-Controlled TiO2 Nanoparticles with Surfactants. Colloids Surfaces A Physicochem. Eng. Asp. 2009, 348, 270–275. [Google Scholar] [CrossRef]
- Kosmulski, M. Zeta Potentials in Nonaqueous Media: How to Measure and Control Them. Colloids Surfaces A Physicochem. Eng. Asp. 1999, 159, 277–281. [Google Scholar] [CrossRef]
- Miyazaki, M.; Sugawara, Y.; Li, Y.J. Charge Behavior of Terminal Hydroxyl on Rutile TiO2(110). Langmuir 2021, 37, 10588–10593. [Google Scholar] [CrossRef]
- Yurdakal, S.; Çetinkaya, S.; Augugliaro, V.; Palmisano, G.; Soria, J.; Sanz, J.; Torralvo, M.J.; Livraghi, S.; Giamello, E.; Garlisi, C. Alkaline Treatment as a Means to Boost the Activity of TiO2 in Selective Photocatalytic Processes. Catal. Sci. Technol. 2020, 10, 5000–5012. [Google Scholar] [CrossRef]
- Praveen, P.; Viruthagiri, G.; Mugundan, S.; Shanmugam, N. Structural, Optical and Morphological Analyses of Pristine Titanium Di-Oxide Nanoparticles—Synthesized via Sol-Gel Route. Spectrochim. Acta Part A Mol. Biomol. Spectrosc. 2014, 117, 622–629. [Google Scholar] [CrossRef] [PubMed]
- Mino, L.; Cesano, F.; Scarano, D.; Spoto, G.; Martra, G. Molecules and Heterostructures at TiO2 Surface: The Cases of H2O, CO2, and Organic and Inorganic Sensitizers. Res. Chem. Intermed. 2019, 45, 5801–5829. [Google Scholar] [CrossRef]
- Ayers, M.R.; Hunt, A.J. Titanium Oxide Aerogels Prepared from Titanium Metal and Hydrogen Peroxide. Mater. Lett. 1998, 34, 290–293. [Google Scholar] [CrossRef]
- Pellegrino, F.; Morra, E.; Mino, L.; Martra, G.; Chiesa, M.; Maurino, V. Surface and Bulk Distribution of Fluorides and Ti3+ Species in TiO2 Nanosheets: Implications on Charge Carrier Dynamics and Photocatalysis. J. Phys. Chem. C 2020, 124, 3141–3149. [Google Scholar] [CrossRef]
- Thommes, M.; Kaneko, K.; Neimark, A.V.; Olivier, J.P.; Rodriguez-Reinoso, F.; Rouquerol, J.; Sing, K.S.W. Physisorption of Gases, with Special Reference to the Evaluation of Surface Area and Pore Size Distribution (IUPAC Technical Report). Pure Appl. Chem. 2015, 87, 1051–1069. [Google Scholar] [CrossRef]
- Cychosz, K.A.; Guillet-Nicolas, R.; García-Martínez, J.; Thommes, M. Recent Advances in the Textural Characterization of Hierarchically Structured Nanoporous Materials. Chem. Soc. Rev. 2017, 46, 389–414. [Google Scholar] [CrossRef]
- Fan, Z.; Meng, F.; Gong, J.; Li, H.; Ding, Z.; Ding, B. One-Step Hydrothermal Synthesis of Mesoporous Ce-Doped Anatase TiO2 Nanoparticles with Enhanced Photocatalytic Activity. J. Mater. Sci. Mater. Electron. 2016, 27, 11866–11872. [Google Scholar] [CrossRef]
- Wei, X.; Zhu, G.; Fang, J.; Chen, J. Synthesis, Characterization, and Photocatalysis of Well-Dispersible Phase-Pure Anatase TiO2 Nanoparticles. Int. J. Photoenergy 2013, 2013, 726872. [Google Scholar] [CrossRef]
- Abdel-Monem, Y.K. Efficient Nanophotocatalyt of Hydrothermally Synthesized Anatase TiO2 Nanoparticles from Its Analogue Metal Coordinated Precursor. J. Mater. Sci. Mater. Electron. 2016, 27, 5723–5728. [Google Scholar] [CrossRef]
- Lee, D.-H.; Cho, G.; Lim, H.M.; Kim, D.S.; Kim, C.; Lee, S.-H. Comparisons of Particle Size Measurement Method for Colloidal Silica. J. Ceram. Process. Res. 2013, 14, 274–278. [Google Scholar]
- Balázs, N.; Srankó, D.F.; Dombi, A.; Sipos, P.; Mogyorósi, K. The Effect of Particle Shape on the Activity of Nanocrystalline TiO2 Photocatalysts in Phenol Decomposition. Part 2: The Key Synthesis Parameters Influencing the Particle Shape and Activity. Appl. Catal. B Environ. 2010, 96, 569–576. [Google Scholar] [CrossRef]
- Hanaor, D.A.H.; Sorrell, C.C. Review of the Anatase to Rutile Phase Transformation. J. Mater. Sci. 2011, 46, 855–874. [Google Scholar] [CrossRef]
- Bakardjieva, S.; Šubrt, J.; Štengl, V.; Dianez, M.J.; Sayagues, M.J. Photoactivity of Anatase-Rutile TiO2 Nanocrystalline Mixtures Obtained by Heat Treatment of Homogeneously Precipitated Anatase. Appl. Catal. B Environ. 2005, 58, 193–202. [Google Scholar] [CrossRef]
- Collazzo, G.C.; Jahn, S.L.; Carreño, N.L.V.; Foletto, E.L. Temperature and Reaction Time Effects on the Structural Properties of Titanium Dioxide Nanopowders Obtained via the Hydrothermal Method. Braz. J. Chem. Eng. 2011, 28, 265–272. [Google Scholar] [CrossRef]
- Tobaldi, D.M.; Pullar, R.C.; Seabra, M.P.; Labrincha, J.A. Fully Quantitative X-Ray Characterisation of Evonik Aeroxide TiO2 P25®. Mater. Lett. 2014, 122, 345–347. [Google Scholar] [CrossRef]
- Ahmad, M.I.; Bhattacharya, S.S. Size Effect on the Lattice Parameters of Nanocrystalline Anatase. Appl. Phys. Lett. 2009, 95, 191906. [Google Scholar] [CrossRef]
- Ohtani, B.; Prieto-Mahaney, O.O.; Li, D.; Abe, R. What Is Degussa (Evonic) P25? Crystalline Composition Analysis, Reconstruction from Isolated Pure Particles and Photocatalytic Activity Test. J. Photochem. Photobiol. A Chem. 2010, 216, 179–182. [Google Scholar] [CrossRef]
- Lazzeri, M.; Vittadini, A.; Selloni, A. Structure and Energetics of Stoichiometric TiO2 Anatase Surfaces. Phys. Rev. B—Condens. Matter Mater. Phys. 2001, 63, 1554091–1554099. [Google Scholar] [CrossRef]
- Chen, C.; Wang, J.; Ren, Z.; Qian, G.; Wang, Z. One-Dimension TiO2 Nanostructures: Oriented Attachment and Application in Dye-Sensitized Solar Cell. CrystEngComm 2014, 16, 1681–1686. [Google Scholar] [CrossRef]
- Tolosana-Moranchel, A.; Pecharromán, C.; Faraldos, M.; Bahamonde, A. Strong Effect of Light Scattering by Distribution of TiO2 Particle Aggregates on Photocatalytic Efficiency in Aqueous Suspensions. Chem. Eng. J. 2021, 403, 126186. [Google Scholar] [CrossRef]
- Chen, M.; Ma, J.; Zhang, B.; Wang, F.; Li, Y.; Zhang, C.; He, H. Facet-Dependent Performance of Anatase TiO2 for Photocatalytic Oxidation of Gaseous Ammonia. Appl. Catal. B Environ. 2018, 223, 209–215. [Google Scholar] [CrossRef]
- Zhang, J.; Chen, W.; Xi, J.; Ji, Z. {001} Facets of Anatase TiO2 Show High Photocatalytic Selectivity. Mater. Lett. 2012, 79, 259–262. [Google Scholar] [CrossRef]
- Zhao, J.; Zou, X.X.; Su, J.; Wang, P.P.; Zhou, L.J.; Li, G.D. Synthesis and Photocatalytic Activity of Porous Anatase TiO2 Microspheres Composed of {010}-Faceted Nanobelts. Dalton Trans. 2013, 42, 4365–4368. [Google Scholar] [CrossRef]
- Pan, J.; Wu, X.; Wang, L.; Liu, G.; Lu, G.Q.; Cheng, H.M. Synthesis of Anatase TiO2 Rods with Dominant Reactive {010} Facets for the Photoreduction of CO2 to CH4 and Use in Dye-Sensitized Solar Cells. Chem. Commun. 2011, 47, 8361–8363. [Google Scholar] [CrossRef]
- Xu, H.; Reunchan, P.; Ouyang, S.; Tong, H.; Umezawa, N.; Kako, T.; Ye, J. Anatase TiO2 Single Crystals Exposed with High-Reactive {111} Facets toward Efficient H2 Evolution. Chem. Mater. 2013, 25, 405–411. [Google Scholar] [CrossRef]
- Meng, F.; Lai, Y.; Cheng, Z.; Ding, Y.; Sun, M.; Zhang, S.; Zhong, Q. Distinguishing the Roles of Anatase TiO2 Nanocrystals with {101}, {010} or {001} Facets Catalyzed O3/H2O2 for Low-Temperature NO Oxidation. Mol. Catal. 2023, 549, 113513. [Google Scholar] [CrossRef]
- Mishra, S.B.; Nanda, B.R.K. Facet Dependent Catalytic Activities of Anatase TiO2 for CO2 Adsorption and Conversion. Appl. Surf. Sci. 2020, 531, 147330. [Google Scholar] [CrossRef]
- Liu, Z.; Zheng, Y.; Gao, T.; Zhang, J.; Sun, X.; Zhou, G. Fabrication of Anatase TiO2 Tapered Tetragonal Nanorods with Designed {100}, {001} and {101} Facets for Enhanced Photocatalytic H2 Evolution. Int. J. Hydrogen Energy 2017, 42, 21775–21785. [Google Scholar] [CrossRef]
- Du, Y.E.; Du, Y.E.; Du, Y.E.; Niu, X.; He, J.; Liu, L.; Liu, Y.; Chen, C.; Yang, X.; Feng, Q. Hollow Square RodLike Microtubes Composed of Anatase Nanocuboids with Coexposed {100}, {010}, and {001} Facets for Improved Photocatalytic Performance. ACS Omega 2020, 5, 14147–14156. [Google Scholar] [CrossRef]
- Chen, C.; Wang, Z.Y. Synthesis and Crystal Growth Mechanism of Titanium Dioxide Nanorods. Wuji Cailiao Xuebao/J. Inorg. Mater. 2012, 27, 45–48. [Google Scholar] [CrossRef]
- Luna, M.; Gatica, J.M.; Vidal, H.; Mosquera, M.J. One-Pot Synthesis of Au/N-TiO2 Photocatalysts for Environmental Applications: Enhancement of Dyes and NOx Photodegradation. Powder Technol. 2019, 355, 793–807. [Google Scholar] [CrossRef]
- Ohko, Y.; Nakamura, Y.; Negishi, N.; Matsuzawa, S.; Takeuchi, K. Photocatalytic Oxidation of Nitrogen Monoxide Using TiO2 Thin Films under Continuous UV Light Illumination. J. Photochem. Photobiol. A Chem. 2009, 205, 28–33. [Google Scholar] [CrossRef]
- Bloh, J.Z.; Folli, A.; Macphee, D.E. Photocatalytic NOx Abatement: Why the Selectivity Matters. RSC Adv. 2014, 4, 45726–45734. [Google Scholar] [CrossRef]
- Luna, M.; Gonzalez-Hidalgo, A.; Diaz, A.; Goma, D.; Gatica, J.M.; Mosquera, M.J. Strong Metal-Support Interaction (SMSI) in Au/TiO2 Photocatalysts for Environmental Remediation Applications: Effectiveness Enhancement and Side Effects. J. Environ. Chem. Eng. 2023, 11, 109947. [Google Scholar] [CrossRef]
- Bertolotti, F.; Vivani, A.; Moscheni, D.; Ferri, F.; Cervellino, A.; Masciocchi, N.; Guagliardi, A. Structure, Morphology, and Faceting of TiO2 Photocatalysts by the Debye Scattering Equation Method. The P25 and P90 Cases of Study. Nanomaterials 2020, 10, 743. [Google Scholar] [CrossRef] [PubMed]
- Liu, L.; Jiang, Y.; Zhao, H.; Chen, J.; Cheng, J.; Yang, K.; Li, Y. Engineering Coexposed {001} and {101} Facets in Oxygen-Deficient TiO2 Nanocrystals for Enhanced CO2 Photoreduction under Visible Light. ACS Catal. 2016, 6, 1097–1108. [Google Scholar] [CrossRef]
- Delgado Rodrigues, J.; Grossi, A. Indicators and Ratings for the Compatibility Assessment of Conservation Actions. J. Cult. Herit. 2007, 8, 32–43. [Google Scholar] [CrossRef]


Disclaimer/Publisher’s Note: The statements, opinions and data contained in all publications are solely those of the individual author(s) and contributor(s) and not of MDPI and/or the editor(s). MDPI and/or the editor(s) disclaim responsibility for any injury to people or property resulting from any ideas, methods, instructions or products referred to in the content. |
© 2025 by the authors. Licensee MDPI, Basel, Switzerland. This article is an open access article distributed under the terms and conditions of the Creative Commons Attribution (CC BY) license (https://creativecommons.org/licenses/by/4.0/).