Communication

A New Bundling and Packaging Method Using Nonwoven Polylactide Based on Polymer Shrinkage by Carbon Dioxide

Research Institute for Chemical Process Technology, National Institute of Advanced Industrial Science and Technology, 4-2-1 Nigatake, Miyagino-ku, Sendai 983-8551, Japan
Technologies 2025, 13(2), 49; https://doi.org/10.3390/technologies13020049
Submission received: 24 December 2024 / Revised: 24 January 2025 / Accepted: 27 January 2025 / Published: 28 January 2025
(This article belongs to the Section Innovations in Materials Processing)

Abstract

:
This study proposes the exposure of nonwoven fabrics to carbon dioxide for bundling and packaging purposes. The proposed process, which utilizes the shrinking property of the nonwoven fabric during carbon dioxide exposure, is demonstrated on a polylactic acid (PLA) nonwoven fabric produced by the melt-blown method. Evaluating the shrinkage induced by carbon dioxide in PLA nonwoven fabrics with varying degrees of crystallinity, it was found that increasing the crystallinity decreases both the speed and amount of shrinkage. This process is potentially applicable as a simple, inexpensive, and environmentally friendly approach for packaging food and drug products.

Graphical Abstract

1. Introduction

Developing sustainable societies is a top priority in modern times. Among the key challenges is mitigating climate change [1], in particular, reducing the emissions of carbon dioxide (CO2), a greenhouse gas that contributes to global warming. Effective uses of CO2 that has been captured and separated from the atmosphere are also urgently sought [2,3]. CO2 is used as a food additive and is expected to be applied as a solvent for extraction and synthesis reactions in the food and pharmaceutical industries [4]. High-pressure CO2 is known to dissolve well in certain plastics [5] and is particularly soluble in amorphous polymers [6,7]. Studies have also explored the interaction of CO2 with polymers, focusing on its effects on foaming behavior [8] and impregnation [9]. Consequently, several processes combining polymers and CO2 [10], such as foaming [8], micro-particle synthesis [11], and drug impregnation processing [9], have been proposed. Research has been carried out to create foams using supercritical carbon dioxide blended with polylactic acid for high foam and low shrinkage [12].
The CO2-assisted polymer compression (CAPC) method plasticizes fibrous plastics with CO2 and compresses them into polymer porous bodies [13]. This method controls the porosity and other characteristics through the process conditions [14] and facilitates the encapsulation of drugs during the compression of layered fibrous sheets [15]. The method can potentially process relatively inexpensive nonwoven fabrics, extending its practical applicability. Nonwoven fabrics are mass-produced for household, medical, and agricultural products [16] with extremely low production costs. If the CAPC process could utilize low-cost fibers as raw materials, it could not only derive expensive products such as medicines but also everyday products.
Nonwoven fabrics made of fine fibers with low crystallinity, produced using the melt-blown method, have been identified as particularly well-suited for the CAPC method [17]. To further expand the applicability of this method, polymers with high melt flow rates (MFRs), suitable for melt-blown nonwoven fabric production, were studied. Among these materials, polylactic acid (PLA) polymers exhibited notable shrinkage behavior under non-restrictive conditions. In a CO2 environment, this shrinkage behavior was found to resemble that of heat-shrinkable films commonly used in packaging [18], thereby introducing the concept of a CO2 shrink film. Additionally, the fuzzy surface of the melt-blown nonwoven fabric, which likely generates high friction when layered, was hypothesized to facilitate bundling. This hypothesis was confirmed by demonstrating that the fabric could be effectively bundled by simply wrapping it around an object and exposing it to CO2.
This study introduces an innovative method for bundling and packaging that leverages the shrinkage effect of gaseous CO2. The research examines the shrinkage behavior of raw nonwoven fabrics under CO2 exposure and explores how crystallinity influences both the rate and extent of this shrinkage.

2. Materials and Methods

The raw nonwoven fabric materials were fabricated from two types of PLA as follows: Ingeo Biopolymer 6252D (melt index 70–85 g/10 min (210 °C), ASTM D1238 [19], glass transition temperature 55–60 °C, melting temperature 155–170 °C) from NatureWorks (Plymouth, MN USA); and Luminy L105 (melt-flow index 70 g/10 min (210 °C, 2.16 kg), ISO 1133-A [20], glass transition temperature 60 °C, melting temperature 175 °C) from TotalEnergies Corbion (Gorinchem, The Netherlands). The melt-blown nonwoven fabrics were spun by Nippon Nozzle Co., Ltd. (Kobe, Japan). The nonwoven fabric from TotalEnergies Corbion is gradually crystallized through heat treatment. Therefore, samples of this fabric were heat-treated for 1, 3, or 10 h at 62 °C, as previously reported [17]. All nonwoven fabrics were punched out with a 16.0 mm hand punch, creating circular nonwoven fabric samples with a diameter of 16.0 mm for shrinkage analysis. Hereafter, the nonwoven fabrics procured from NatureWorks and TotalEnergies Corbion will be referred to as NW and TC0, respectively, and the TotalEnergies Corbion fabrics heat-treated at 62 °C for 1, 3, and 10 h are named TC1, TC3, and TC10, respectively. Heat treatment was performed at a temperature slightly above the glass transition temperature to promote gradual crystallization. In a previous study [17], the crystallinity of TC0 increased from 0.02 to 0.17 after heat treatment at 62 °C for 10 h.
For the bundling test, strips of paper cut into long, narrow rectangles were bundled together, wreathed in NW nonwoven fabric, placed in a pressure vessel, and exposed to CO2. For the packaging test, finely chopped paper was wrapped in NW nonwoven fabric, placed in a pressure vessel, and exposed to CO2. In both tests, the gas was vented after 30 s of CO2 exposure and the sample was removed to complete the process.
Figure 1 is a schematic of the equipment used in the shrinkage evaluation test. A piece of nonwoven fabric was placed between polyimide films cut to Φ18 mm and inserted into a cylindrical cylinder with an inner diameter of 20 mm. Valve V1 was closed and V2 was opened, lowering the piston to 10 mm above the bottom. Afterward, valve V2 was closed, V1 was opened for 2 s, and CO2 was introduced from the CO2 cylinder. The experimental temperature was 23 °C, and the pressure of the CO2 introduced through the piping was 6.1 MPa. The time at which V1 was closed after CO2 introduction was defined as the temporal origin. After the specified number of seconds, V2 was opened to release the CO2 into the atmosphere and the sample was removed by raising the piston. Seven samples of each material were processed, with a smooth polyimide film placed between each sample. The piston merely acted as a lid, applying no load to the samples; therefore, all samples could freely shrink without restriction.
To determine the shrinkage area of the nonwoven fabric, a piece of the fabric was placed on a 20 mm by 20 mm black square sheet of paper and covered with a glass plate. After photographing the sample, the area was calculated through image analysis. Specifically, the vertices of the black paper were extracted from the photograph and the image was converted into a square. Subsequently, the contour of the nonwoven fabric was extracted and the number of pixels within the contour was counted and converted into an area. The areas of the seven samples were evaluated for calculating the mean and standard deviation.

3. Results and Discussion

First, the results of bundling the NW nonwoven fabric are presented. Figure 2A shows the paper strips (approximately 1 mm wide) and the nonwoven fabric cut for bundling. Panels B and C of Figure 2 show a typical sample before placement in the container and after CO2 exposure, respectively. CO2 exposure appeared to align and tighten the paper strips. Similarly, Figure 3A shows the paper finely chopped into squares with approximate side lengths of 1 mm and the nonwoven fabric cut for wrapping. Panels B and C of Figure 3 show a typical sample before placement in the container and after CO2 exposure, respectively. The originally wrapped section was thick and appears solid white, but after CO2 exposure, the material shrank and adhered tightly to the contents, revealing the color of its contents. As nonwoven fabrics contain voids between fibers, liquids and gasses can permeate through these voids. This process can be potentially used to wrap coffee or herbs, creating coffee or herbal-tea tablets, respectively. The process requires no heat input and uses nontoxic CO2, so it is safe for food applications and for encapsulating potentially heat-degradable materials.
In a process utilizing shrinkage in a CO2 environment, the extent and duration of the CO2-induced shrinkage must be elucidated. To this end, the NW PLA nonwoven fabric and TC0 PLA nonwoven fabric previously used in the CAPC study were subjected to a shrinking experiment. As heat treatment can alter the crystallinity of TC0, the impact of crystallinity on shrinkage was evaluated on samples with varying degrees of crystallinity.
First, the samples subjected to various heat treatments were punched out with a hand punch and their areas were reported as the averages and standard deviations of seven samples. The areas were determined as 201.0 ± 0.4 mm2 for NW, 201.1 ± 0.4 mm2 for TC0, 201.3 ± 0.7 mm2 for TC1, 202.0 ± 0.5 mm2 for TC3, and 201.9 ± 0.5 mm2 for TC10. The evaluation results of the area of all punched samples are consistent with the calculated area of a circle with a 16.0 mm diameter (201 mm2), confirming that punching with a hand punch and image analysis are appropriate evaluation methods for the present experiment.
Figure 4 shows photographs of the samples before and after CO2 exposure. In these images, the black backing paper was converted into a square and the contours were extracted. Owing to irregularities in the nonwoven fabric, the shrunken fabric was noncircular, so the evaluation was based on the area of the contour-extracted shape. The experimental results are summarized in Table 1. The values in the table represent the average of seven samples, and the errors indicate the standard deviation. While TC3 and TC10 showed minimal shrinkage, the remaining samples exhibited initial shrinkage, which eventually converged to a constant value. Since this behavior resembles an exponential trend, exponential fitting was applied. The data from Table 1 were plotted on a graph and the fitting results are presented in Figure 5. The markers indicate the averages and standard deviations of the seven samples, and the lines are the results of fitting with an exponential function. The results of TC3 and TC10 are not easily fitted to an exponential function and were instead fitted to a straight line, indicating no temporal change. In Figure 5, the vertical axis of the graph represents the area (201 mm2 for the original sample). At time 0, shrinkage was already progressing as the CO2 introduction valve had been opened for two seconds prior. After CO2 exposure, the NW fabric originally measuring 201 mm2 shrunk to 64% (to 128.6 mm2). NW exhibited the highest area shrinkage among the evaluated samples. Converting the shrinkage rate to the square root of the area, the length shrinkage was determined as 80%. The higher shrinkage rate of NW compared to the TC samples was attributed to the higher MFR (indicating higher fluidity) of NW compared to TC. As the heat-treatment duration increased from TC0 to TC10, the samples became less prone to shrinkage. According to a previous study [17], the crystallinities of TC0, TC1, TC3, and TC10 are 0.02, 0.07, 0.15, and 0.17, respectively, suggesting that increasing the crystallinity decreases both the speed and amount of shrinkage. As CO2 presumably dissolves into the amorphous regions of the polymer, the effect of crystallinity on shrinkage is unsurprising.
From the observed decrease in heat shrinkage, the fundamental cause of shrinkage was inferred as strain accumulation during spinning. The nonwoven fabric was produced using the melt-blown method, in which the molten polymer is extruded from a nozzle, stretched by air, and rapidly cooled. The strain accumulated during this process is probably relieved by shrinkage when the polymer is plasticized by CO2 and gains fluidity.
Figure 6 shows the scanning electron microscopy images of several samples. As the samples were not pressed, the indentations formed by the compression of the fibers observed in a previous CAPC study are absent in these images. Even after exposure to CO2 for 60 s, the NW nonwoven fabric resembled its untreated counterpart. The TC samples also presented no obvious changes after exposure to CO2 for 60 s.

4. Conclusions

It was demonstrated that nonwoven fabrics fabricated from PLA using the melt-blown method are suitable binding and packaging materials under CO2 exposure. This process is extremely simple and is as follows: the material only needs to be wreathed or wrapped and exposed to a CO2 environment. The process exploits the shrinkage property of nonwoven fabric during CO2 exposure. Under the same CO2 exposure conditions, a material with lower crystallinity shrank more quickly and more extensively than the same material with a high crystallinity. As the CO2 exposure treatment involves no heat, it is expected to be suitable for binding or enclosing heat-sensitive items. In addition, as the nonwoven fabric is a porous material, it is potentially applicable to drug delivery and other applications requiring the controlled release of enclosed agents in liquid. The proposed method shows potential for encapsulating dry goods such as coffee or herbal teas. However, further investigation is required to assess the structural stability and potential organoleptic effects of PLA-based packaging when in contact with hot liquids.

Funding

This research was supported by JSPS KAKENHI, grant number 22H01379.

Institutional Review Board Statement

Not applicable.

Informed Consent Statement

Not applicable.

Data Availability Statement

All data generated or analyzed during this study are included in this published article.

Conflicts of Interest

The author declares no conflicts of interest.

References

  1. Sachs, J.; Schmidt-Traub, G.; Kroll, C.; Lafortune, G.; Fuller, G.; Woelm, F. Sustainable Development Report 2020: The Sustainable Development Goals and COVID-19 Includes the SDG Index and Dashboards; Cambridge University Press: Cambridge, UK, 2021. [Google Scholar]
  2. Davoodi, S.; Al-Shargabi, M.; Wood, D.A.; Rukavishnikov, V.S.; Minaev, K.M. Review of technological progress in carbon dioxide capture, storage, and utilization. Gas Sci. Eng. 2023, 117, 205070. [Google Scholar] [CrossRef]
  3. Yusuf, M.; Ibrahim, H. A comprehensive review on recent trends in carbon capture, utilization, and storage techniques. J. Env. Chem. Eng. 2023, 11, 111393. [Google Scholar] [CrossRef]
  4. Wang, W.; Rao, L.; Wu, X.; Wang, Y.; Zhao, L.; Liao, X. Supercritical carbon dioxide applications in food processing. Food Eng. Rev. 2021, 13, 570–591. [Google Scholar] [CrossRef]
  5. Li, M.; Huang, X.; Liu, H.; Liu, B.; Wu, Y.; Wang, L. Solubility prediction of supercritical carbon dioxide in 10 polymers using radial basis function artificial neural network based on chaotic self-adaptive particle swarm optimization and K-harmonic means. RSC Adv. 2015, 5, 45520–45527. [Google Scholar] [CrossRef]
  6. Shieh, Y.-T.; Su, J.-H.; Manivannan, G.; Lee, P.H.C.; Sawan, S.P.; Spall, W.D. Interaction of supercritical carbon dioxide with polymers. I. Crystalline polymers. J. Appl. Polym. Sci. 1996, 59, 695–705. [Google Scholar] [CrossRef]
  7. Shieh, Y.-T.; Su, J.-H.; Manivannan, G.; Lee, P.H.C.; Sawan, S.P.; Spall, W.D. Interaction of supercritical carbon dioxide with polymers. II. Amorphous polymers. J. Appl. Polym. Sci. 1996, 59, 707–717. [Google Scholar] [CrossRef]
  8. Sarver, J.A.; Kiran, E. Foaming of polymers with carbon dioxide—The year-in-review–2019. J. Supercrit. Fluids 2021, 173, 105166. [Google Scholar] [CrossRef]
  9. Yu, C.; Wang, Z.; Liu, M.; Li, S. Preparation of drug-loaded composites by supercritical carbon dioxide impregnation. Polym. Sci. Ser. A 2023, 65, 63–71. [Google Scholar] [CrossRef]
  10. Kiran, E. Supercritical fluids and polymers—The year in review—2014. J. Supercrit. Fluids 2016, 110, 126–153. [Google Scholar] [CrossRef]
  11. Bahrami, M.; Ranjbarian, S. Production of micro- and nano-composite particles by supercritical carbon dioxide. J. Supercrit. Fluids 2007, 40, 263–283. [Google Scholar] [CrossRef]
  12. Gu, Z.; Zhao, B.; Zhang, L.; Bao, J. Supercritical carbon dioxide foamed thermoplastic polyester elastomer with poly(lactic acid) blending: Shrinkage reduction and expansion ratio improvement. Colloid Polym. Sci. 2025, 303, 67–80. [Google Scholar] [CrossRef]
  13. Aizawa, T. A new method for producing porous polymer materials using carbon dioxide and a piston. J. Supercrit. Fluids 2018, 133, 38–41. [Google Scholar] [CrossRef]
  14. Aizawa, T. Fabrication of porosity-controlled polyethylene terephthalate porous materials using a CO2-assisted polymer compression method. RSC Adv. 2018, 8, 3061–3068. [Google Scholar] [CrossRef] [PubMed]
  15. Aizawa, T.; Matsuura, S.-I. Fabrication of enzyme-loaded cartridges using CO2-assisted polymer compression. Technologies 2021, 9, 85. [Google Scholar] [CrossRef]
  16. Russell, S.J. Handbook of Nonwovens, 2nd ed.; Woodhead Publishing: Cambridge, UK, 2022. [Google Scholar]
  17. Aizawa, T. Application of CO2-assisted polymer compression to polylactic acid and the relationship between crystallinity and plasticization. Compounds 2021, 1, 75–82. [Google Scholar] [CrossRef]
  18. Kalkan-Sevinc, Z.; Strobel, C.T. Material characterization of heat shrinkable film. J. Test Eval. 2015, 43, 1531–1539. [Google Scholar] [CrossRef]
  19. ASTM International Official Website. Available online: https://astm.org/ (accessed on 20 January 2025).
  20. International Organization for Standardization Official Webcite. Available online: https://iso.org/ (accessed on 20 January 2025).
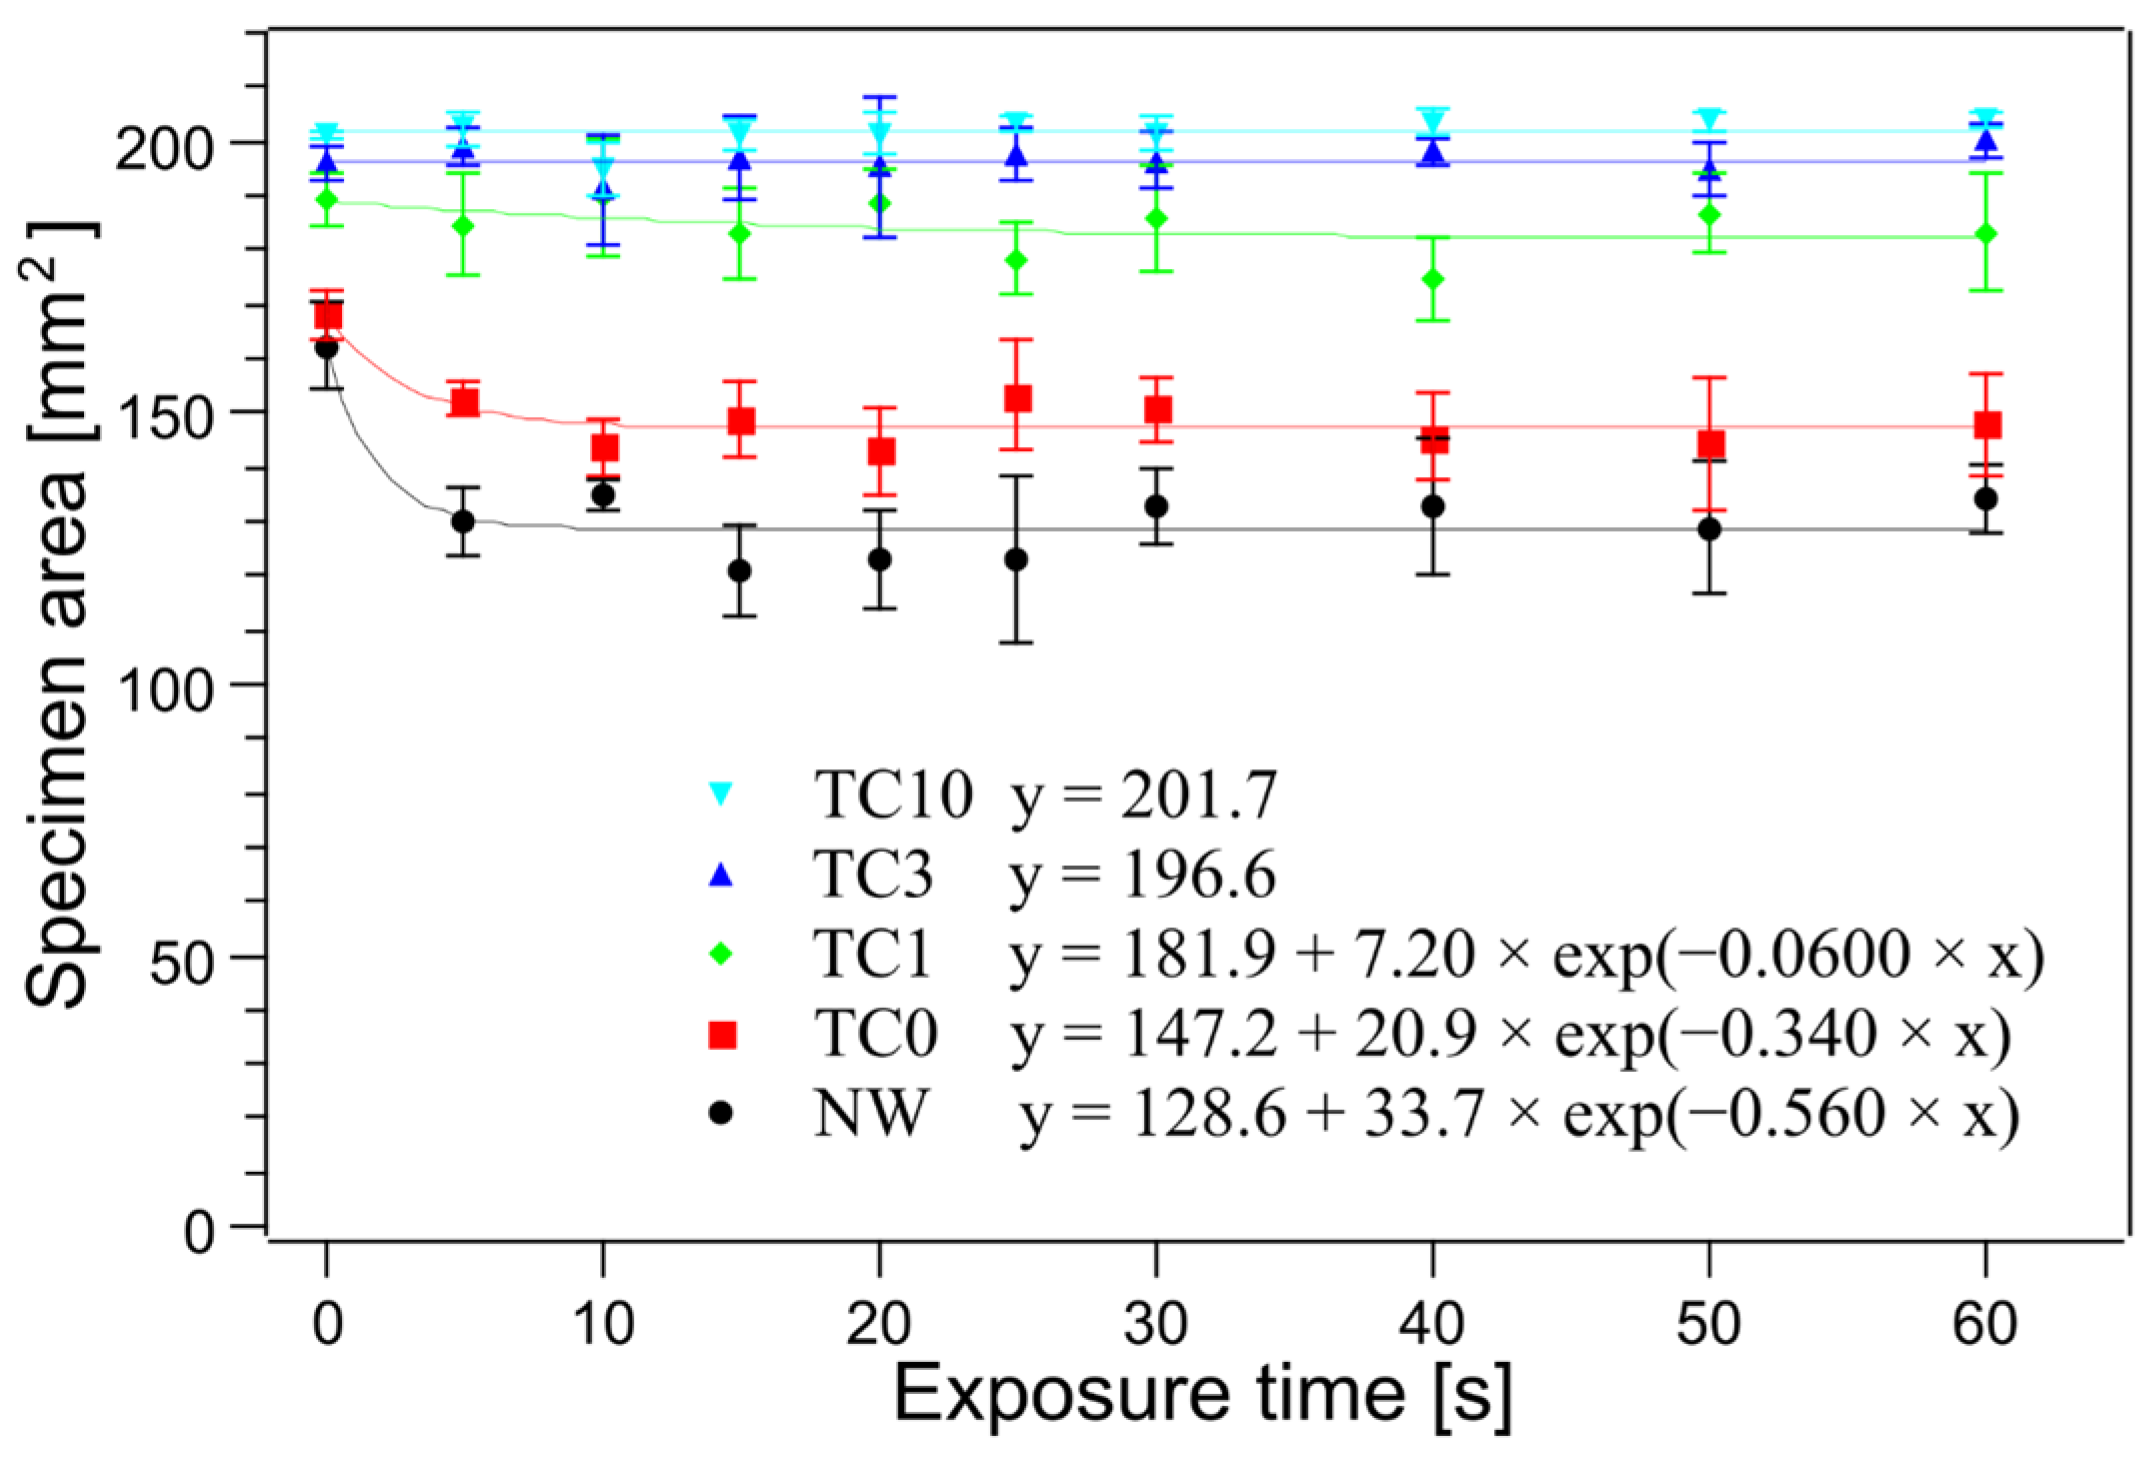
Figure 1. Diagram of the experimental setup for the shrinkage test. V1: CO2-introduction valve; V2: CO2-exhaustion valve. Samples were placed between smooth-surfaced polyimide films and stacked in the vessel.
Technologies 13 00049 g001
Figure 2. Bundling treatment. Results of CO2 exposure on 20 bundles of bar-shaped paper samples (approximate paper width 1 mm): (A) bundle of paper and nonwoven fabric for bundling, (B) the bundled sample wreathed in nonwoven fabric; (C) the sample after treatment.
Technologies 13 00049 g002
Figure 3. Packaging treatment. Results of CO2 exposure on paper squares (approximate side length 1 mm) wrapped in the nonwoven fabric: (A) pile of paper squares and nonwoven fabric for packaging; (B) sample of paper squares wrapped in nonwoven fabric; (C) the sample after treatment.
Technologies 13 00049 g003
Figure 4. Photographs of the samples before and after shrinkage: NatureWorks (NW) nonwoven fabric (A) before CO2 treatment and (B) after 60 s of CO2 treatment; TotalEnergies Corbion (TC) nonwoven fabric without heat treatment (C) before CO2 treatment and (D) after 60 s of CO2 treatment; TC nonwoven fabric heat-treated for 3 h (E) after 60 s of CO2 treatment. The black squares (side length 20 mm) were corrected to squares from an image taken with a digital camera. The areas of the nonwoven fabrics were estimated by counting the number of pixels in the image enclosed by the extracted outlines (highlighted in red around the nonwoven fabrics).
Technologies 13 00049 g004
Figure 5. Results of shrinkage experiments. Markers are the means of 7 samples. Error bars are standard deviations and lines are least-squares fitting results. Fitting results are shown in the figure. NW: NatureWorks nonwoven fabric; TC0: TotalEnergies Corbion nonwoven fabric without additional heat treatment; TC1, TC3, and TC10: TC0 heat treated at 62 °C for 1 h, 3 h, and 10 h, respectively.
Technologies 13 00049 g005
Figure 6. Scanning electron microscope (SEM) images at 3000x of NatureWorks (NW) nonwoven fabric (A) before CO2 treatment and (B) after 60 s of CO2 treatment; SEM images of TotalEnergies Corbion (TC) nonwoven fabric (C) without heat treatment and before CO2 treatment, (D) without heat treatment after 60 s of CO2 treatment, and (E) after 3 h of heat treatment and 60 s of CO2 treatment.
Technologies 13 00049 g006
Table 1. Results of shrinkage experiments. Errors are standard deviations of 7 samples.
Time [s]Area of NW [mm2]Area of TC0 [mm2]Area of TC1 [mm2]Area of TC3 [mm2]Area of TC10 [mm2]
0162.3 ± 8.1168.0 ± 4.6189.2 ± 5.1195.9 ± 2.9201.1 ± 0.7
5130.0 ± 6.1152.5 ± 3.2184.6 ± 9.3199.1 ± 3.8202.4 ± 3.2
10134.8 ± 3.1143.8 ± 5.2189.7 ± 10.7191.0 ± 10.3194.9 ± 5.1
15120.8 ± 8.6148.8 ± 7.0183.2 ± 8.5197.0 ± 7.9201.2 ± 2.9
20123.0 ± 9.4143.2 ± 8.0188.8 ± 6.4195.4 ± 12.9201.4 ± 3.8
25123.0 ± 15.4153.1 ± 10.1178.3 ± 6.8197.8 ± 5.1203.3 ± 1.4
30132.8 ± 6.9150.8 ± 6.0185.7 ± 9.6196.4 ± 5.3201.5 ± 2.9
40132.7 ± 12.4145.5 ± 8.2174.5 ± 7.7198.1 ± 2.6203.5 ± 2.4
50128.8 ± 12.0144.3 ± 12.1186.8 ± 7.6195.0 ± 5.0203.6 ± 1.5
60133.9 ± 6.2148.0 ± 9.3183.3 ± 11.0200.1 ± 3.1204.1 ± 1.5
NW: NatureWorks nonwoven fabric; TC0: TotalEnergies Corbion nonwoven fabric without additional heat treatment; TC1, TC3, and TC10: TC0 heat treated at 62 °C for 1 h, 3 h, and 10 h, respectively.
Disclaimer/Publisher’s Note: The statements, opinions and data contained in all publications are solely those of the individual author(s) and contributor(s) and not of MDPI and/or the editor(s). MDPI and/or the editor(s) disclaim responsibility for any injury to people or property resulting from any ideas, methods, instructions or products referred to in the content.

