Article

A Multi-Platform Electronic Travel Aid Integrating Proxemic Sensing for the Visually Impaired

by
Nathan Naidoo
*,† and
Mehrdad Ghaziasgar
*,†
Department of Computer Science, University of the Western Cape, Bellville 7535, South Africa
*
Authors to whom correspondence should be addressed.
These authors contributed equally to this work.
Technologies 2025, 13(12), 550; https://doi.org/10.3390/technologies13120550
Submission received: 27 October 2025 / Revised: 16 November 2025 / Accepted: 24 November 2025 / Published: 26 November 2025
(This article belongs to the Section Assistive Technologies)

Abstract

Visual impairment (VI) affects over two billion people globally, with prevalence increasing due to preventable conditions. To address mobility and navigation challenges, this study presents a multi-platform, multi-sensor Electronic Travel Aid (ETA) integrating a combination of ultrasonic, LiDAR, and vision-based sensing across head-, torso-, and cane-mounted nodes. Grounded in orientation and mobility (OM) principles, the system delivers context-aware haptic and auditory feedback to enhance perception and independence for users with VI. The ETA employs a hardware–software co-design approach guided by proxemic theory, comprising three autonomous components—Glasses, Belt, and Cane nodes—each optimized for a distinct spatial zone while maintaining overlap for redundancy. Embedded ESP32 microcontrollers enable low-latency sensor fusion providing real-time multi-modal user feedback. Static and dynamic experiments using a custom-built motion rig evaluated detection accuracy and feedback latency under repeatable laboratory conditions. Results demonstrate millimetre-level accuracy and sub-30 ms proximity-to-feedback latency across all nodes. The Cane node’s dual LiDAR achieved a coefficient of variation at most 0.04%, while the Belt and Glasses nodes maintained mean detection errors below 1%. The validated tri-modal ETA architecture establishes a scalable, resilient framework for safe, real-time navigation—advancing sensory augmentation for individuals with VI.

1. Introduction

Visual impairment (VI) affects over two billion people worldwide, limiting independence and access to spatial information required for safe mobility [1]. Orientation and mobility (OM) research has long emphasized that navigation for individuals with VI relies on accurate perception of environmental cues, spatial awareness, and the integration of auditory, tactile, and proprioceptive feedback. Traditional aids such as the white cane or guide dog remain indispensable but provide limited sensing range and context. Recent advances in embedded electronics and low-power sensing have led to renewed interest in Electronic Travel Aids (ETAs)—wearable or handheld devices that augment human perception through technological means [2,3].
Despite decades of exploration, existing ETAs often face three persistent challenges. First, most systems are confined to a single physical platform (e.g., head-, torso-, or cane-mounted), restricting the perceptual field to one proxemic zone. Second, reliance on a single sensing modality—typically ultrasonic or infrared—limits environmental fidelity and robustness under variable lighting or surface conditions. Third, user feedback mechanisms are frequently slow or ambiguous, reducing trust and usability. Consequently, the integration of multi-sensor, multi-platform configurations that distribute perception across the body remains an under-explored yet promising direction.
In this pioneering phase of the research, the primary objective is to develop a fully functional prototype and to rigorously assess the efficacy and accuracy of its functional components through objective, quantitative testing. Demonstrating the reliability and core performance of the proposed device is a critical first step, and must be established before broader considerations such as user experience and user interface can be meaningfully addressed. User experience and interface design are undoubtedly essential to the long-term success of the proposed assistive technology, but they depend on a proven foundation of technical effectiveness and efficacy. As such, user testing involving human subjects, and user experience, fall outside the scope of this study. A detailed investigation into usability and user interaction will be undertaken as a critical part of future work once the prototype’s fundamental capabilities have been validated.
This work presents a multi-platform, multi-sensor ETA that integrates complementary sensing modalities—ultrasonic, LiDAR, and vision—across three physically distinct yet functionally cooperative nodes: a head-mounted Glasses node, a torso-mounted Belt node, and a ground-oriented Cane node. Each node covers a specific region of the user’s personal space, ensuring continuous environmental awareness from head to ground. The design follows Hall’s proxemic framework [4], which categorizes interpersonal space into personal, near, and far zones. Mapping these zones onto the body enables targeted sensor placement, overlap for redundancy, and context-appropriate feedback.
The system further incorporates orientation and mobility principles by translating sensor data into multi-modal feedback—vibrations for immediate alerts, auditory tones for directional information, and synthesized speech for semantic context. Embedded microcontrollers (ESP32 family) process sensor data locally, maintaining low latency while supporting modular expansion.
The contributions of this study are threefold. First, it presents the complete design and implementation of a multi-platform ETA that integrates ultrasonic, LiDAR, and vision-based sensing within a proxemic framework. Second, it reports a comprehensive evaluation in which detection accuracy and feedback latency were measured for each node under controlled laboratory conditions simulating Hall’s spatial zones. Third, it introduces a custom autonomous testing platform developed to ensure repeatable and objective performance assessment. The findings demonstrate millimetre-level precision and sub-30 ms response times across all nodes, validating the system’s capacity to deliver timely and proxemically aligned feedback. By uniting proxemic theory, orientation and mobility (OM) principles, and hardware–software co-design, this study establishes a scalable architectural framework for next-generation assistive mobility technologies.
The remainder of this paper is organized as follows. Section 2 presents an abridged systematic review of the literature on ETAs to contextualize the proposed system and highlight the contributions of this work. Section 3 outlines the theoretical framework underpinning this study, discussing how individuals with VI perceive their surrounding space and how this perception influences their OM—insights that inform the sensor plan and overall design of the proposed system described in Section 4. Section 5 details the quantitative experiments conducted to evaluate the accuracy and performance of the developed ETA device, followed by analyses of the resulting data. The paper concludes with a discussion in Section 6 and a summary of key findings and implications in Section 7.

2. Related Work (Abridged)

ETAs augment non-visual perception by sensing the environment and conveying information via auditory or haptic channels. In this context, a physical platform denotes the wearable or handheld structure—e.g., cane shaft, belt strap, eyeglass frame—onto which sensors and feedback modules are mounted. Platform choice determines ergonomics, body-region coverage, and the cognitive effort required to interpret feedback. While multi-region systems can broaden field of view (FoV), they often introduce added complexity in integration and wearability.
To maintain relevance, only studies published from 2015 to the present were considered, with particular emphasis on the most recent six years (2020–2024) (percentages reported below reflect counts as of the search end date). Of the 43 studies selected for inclusion [5,6,7,8,9,10,11,12,13,14,15,16,17,18,19,20,21,22,23,24,25,26,27,28,29,30,31,32,33,34,35,36,37,38,39,40,41,42,43,44,45,46,47], approximately 74% (n = 32) were published during 2020–2025 [5,6,7,8,9,10,11,12,13,14,15,16,17,18,19,20,21,22,23,24,25,26,27,28,29,30,31,32,33,34,35,36]. Devices were analysed along three functional components—input, processing, and output (Figure 1)—and by body placement. Most systems used a single body region ( n = 23 , ∼53%), commonly hand-based (e.g., cane-mounted modules), with two-region designs comprising ∼30% (n = 13), and only seven devices (∼16%) spanning three distinct regions. Notably, in most three-part designs, one body part was typically reserved for housing processing and/or power units rather than for sensor placement. In such cases, additional input sensors were not distributed across all worn components. The system proposed by Gao et al. [47] was the only solution identified in this review that deployed input sensors across three distinct body parts—the wrist, waist, and ankle. Concentration on one site restricts spatial coverage and leaves blind spots; multi-part systems improve coverage but can be fragile when a single failure degrades overall function.
Input (Sensing Modalities) Table 1 summarises the input sensing strategies across reviewed ETA designs, detailing sensor types, modality counts, total sensors deployed, and distinct placement distributions. Two primary input classes are most prevalent among ETA designs: proximity sensors (ultrasonic, infrared, LiDAR) and image sensors (RGB/RGB-D). Approximately half of the reviewed systems employed proximity sensing as the main input, with ultrasonic sensors being the most prevalent; LiDAR, though less common, provided higher precision and more stable range measurements. Image-based ETAs, leveraging RGB or RGB-D vision, enabled semantic scene understanding and contextual awareness, although many lacked effective fusion with complementary sensing technologies. Across studies, sensors were most frequently concentrated around the hand or waist, offering limited rear coverage and no configurations achieving full panoramic perception.
Processing (Architectures and Platforms) Table 2 summarises the processing hardware strategies across reviewed ETA designs, detailing hardware and hardware type distributions. Processing pipelines ranged from MCU-centric (microcontroller unit) designs (ESP32/Arduino-class) for low-latency control to SBC-centric designs (e.g., Raspberry Pi, Jetson) for on-device vision and ML inference. Hybrid or distributed approaches were less common but promising: distributing sensing and computation across multiple input sensor components can reduce latency, improve resilience, and support modular upgrades. However, standardized metrics linking processing choices to end-to-end responsiveness (e.g., detection-to-feedback latency) were rarely reported.
Output (feedback modalities). Table 3 summarises the feedback modality strategies across reviewed ETA designs, detailing the modality type and feedback type distributions. Auditory feedback was most prevalent (speech or non-speech tones), sometimes complemented by haptics. Speech affords clarity and semantic richness but can be slower and raise cognitive load; non-speech tones and vibrotactile cues provide rapid alerts but limited context. Truly multi-modal feedback (coordinated speech + non-speech audio + haptics) was uncommon, and few studies examined perceptual latency or user workload systematically. Solutions that avoided occlusive headphones (e.g., bone conduction, open speakers, localized buzzers) better preserved environmental hearing.
Synthesis and gaps. Two ETA solutions [11,23] developed by Kammoun et al. and Tachiquin et al. are noteworthy for their use of Global Positioning System (GPS) technology as a primary sensor. Although GPS is not inherently a proximity sensor and has a limited sensing resolution, these solutions leveraged global positioning data related to buildings and other defined landmarks to approximate the distance between the user and these landmarks, effectively repurposing GPS as an indirect proximity sensor.
Among the reviewed ETA solutions, the preferred input modality was ultrasonic sensing, accounting for approximately 62% of all designs. The majority of these designs focused on hand-based configurations [7,8,12,17,18,28,30,32,34,37,41,42,43,47], representing about 67% (n = 14) of the reviewed systems and typically taking the form of handheld canes, gloves, or wrist-mounted devices. Only four ETA designs [12,17,34,47] distributed primary sensors across multiple body regions, with one system [47] incorporating identical sensors on three distinct body parts; however, none included rear-facing detection capabilities.
Approximately 35% (n = 15) of the reviewed ETA designs [6,7,9,11,12,14,17,22,23,29,34,36,39,45,47] incorporated multiple processing components, combining diverse devices to distribute computational loads or dedicate hardware to specific functions such as feedback generation. Within this distribution, MCUs accounted for roughly 36% (n = 19) of implementations, favoured for their low power consumption, compactness, and suitability for real-time control tasks. SBCs were used in about 32% (n = 17) of systems, offering higher computational capacity for vision processing and machine learning tasks—often employing Raspberry Pi or NVIDIA Jetson platforms. Smartphones and tablets appeared in approximately 19% (n = 10) of studies, leveraging built-in sensors, connectivity, and user interfaces, though with trade-offs in power efficiency and hardware variability. Proprietary smart glasses [5,22,36] and laptops [25,36,46] each constituted about 6% (n = 3) of implementations, while desktop computers [44] were least common (2%, n = 1), primarily used for prototyping and software development. Collectively, these findings highlight a trend toward distributed, multi-component architectures that exploit the complementary strengths of MCUs for embedded control, SBCs for advanced computation, and mobile or wearable devices for user interaction, thereby enhancing the scalability and adaptability of ETA systems.
The majority of ETA designs employing auditory feedback avoided traditional headphones (n = 19) [5,10,17,18,19,21,22,26,27,28,29,30,34,35,36,37,40,44,45], instead adopting alternative audio delivery methods that preserved environmental awareness. These included bone-conduction transducers (n = 3) [5,22,36] and externally mounted speakers or buzzers (n = 16) [10,17,18,19,21,26,27,28,29,30,34,35,37,40,44,45], enabling auditory cues without occluding ambient sounds. Combined tactile–auditory feedback represented the second most common approach, comprising approximately 26% (n = 11) of the reviewed systems, leveraging complementary sensory channels to enhance perception and reduce cognitive load. Purely tactile feedback appeared least frequently (n = 7) [9,11,20,23,25,32,39], likely due to its limited signal resolution and smaller feedback surface area. To compensate, some designs used multiple tactile actuators to encode richer spatial information. Overall, ETA systems predominantly favoured auditory feedback, with speech-based approaches prevailing, whereas multi-modal and haptic methods—though less common—show considerable promise for improving robustness and user safety.
Across the corpus, several recurring limitations were identified: (i) Restricted FoV and blind spots due to single-platform placement and scarce rear/side coverage; (ii) Limited sensor fusion, with many systems relying on a single modality, reducing robustness across varying lighting/surface conditions; (iii) Fragility in multi-part systems, where failure of one component compromises the whole; (iv) Latency underreported, with few works quantifying end-to-end detection-to-feedback delays; (v) Feedback optimization underexplored, particularly balanced multi-modal strategies that minimize cognitive load while retaining semantic value. A proxemically distributed, multi-sensor, and latency-validated architecture—such as the one proposed and evaluated in the current research—offers a practical route toward resilient, real-time assistive navigation.
Positioning of the present work. The prototype introduced in this study addresses these gaps by (1) distributing sensing across three autonomous, wirelessly networked nodes (Glasses–head, Belt–torso, Cane–ground) mapped to Hall’s proxemic zones; (2) combining ultrasonic, LiDAR, and vision to balance immediacy and semantic context; (3) using local, node-level processing on MCUs/SBCs to achieve sub-30 ms feedback for proximity pathways; and (4) implementing complementary haptic/audio channels to align cue urgency with information richness. By operationalizing proxemic theory in hardware placement and feedback mapping, the system provides overlapping coverage with redundancy while reporting standardized static-test metrics (accuracy, variability, and end-to-end latency) to support reproducibility and comparison.

3. Theoretical Framework

Kellman et al. [48] describe perception as the interface between biology and awareness, with space perception enabling individuals to understand their position relative to objects [49]. Thinus-Blanc and Gaunet define spatial representation as a mental map extending beyond immediate reach [50]. Vision dominates spatial awareness from early development, often diminishing reliance on other senses over time.
For individuals with VI, spatial perception relies primarily on touch and hearing, with aids like canes, guide dogs, and human guides serving as sensory extensions [51,52,53,54]. Those with congenital blindness perceive space differently from those with acquired VI. Hollins [54] describes spatial understanding in VI individuals as “framing”—the construction of cognitive maps through multi-sensory input. OM training emphasizes these skills, helping users visualize routes and refine spatial awareness.
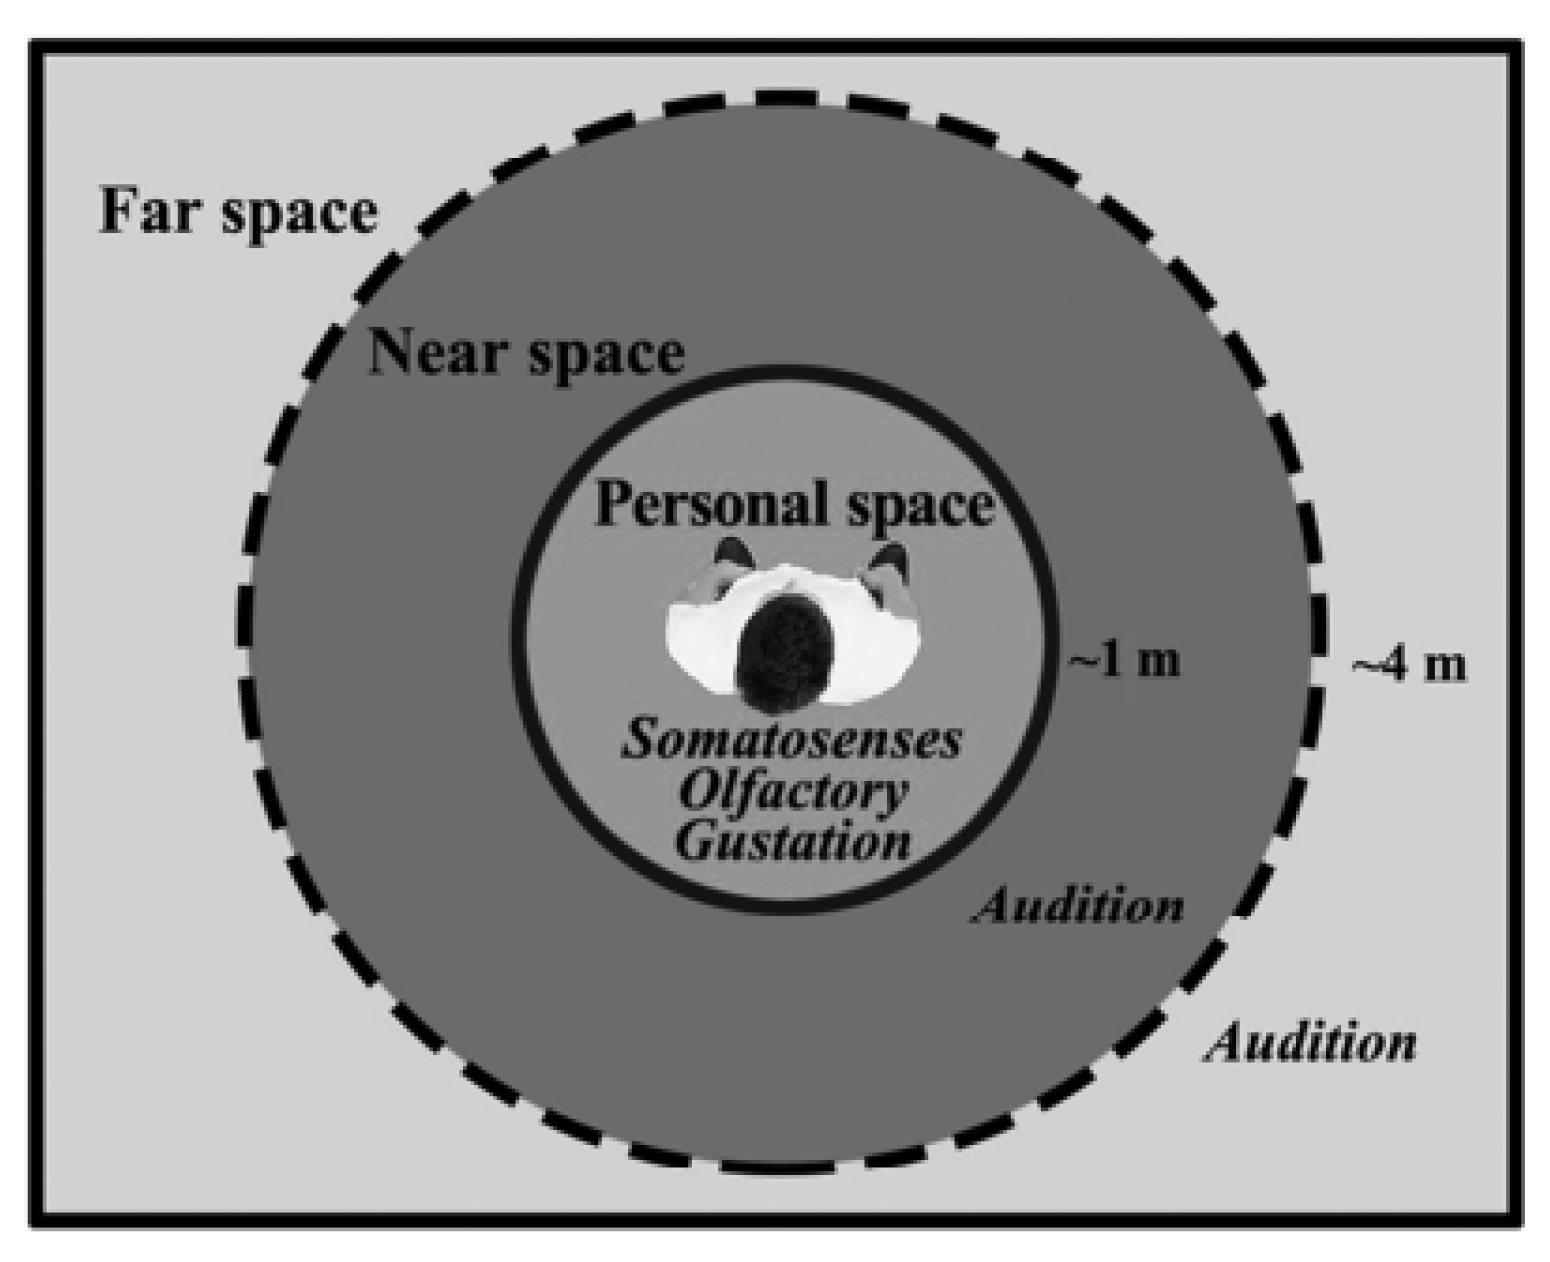
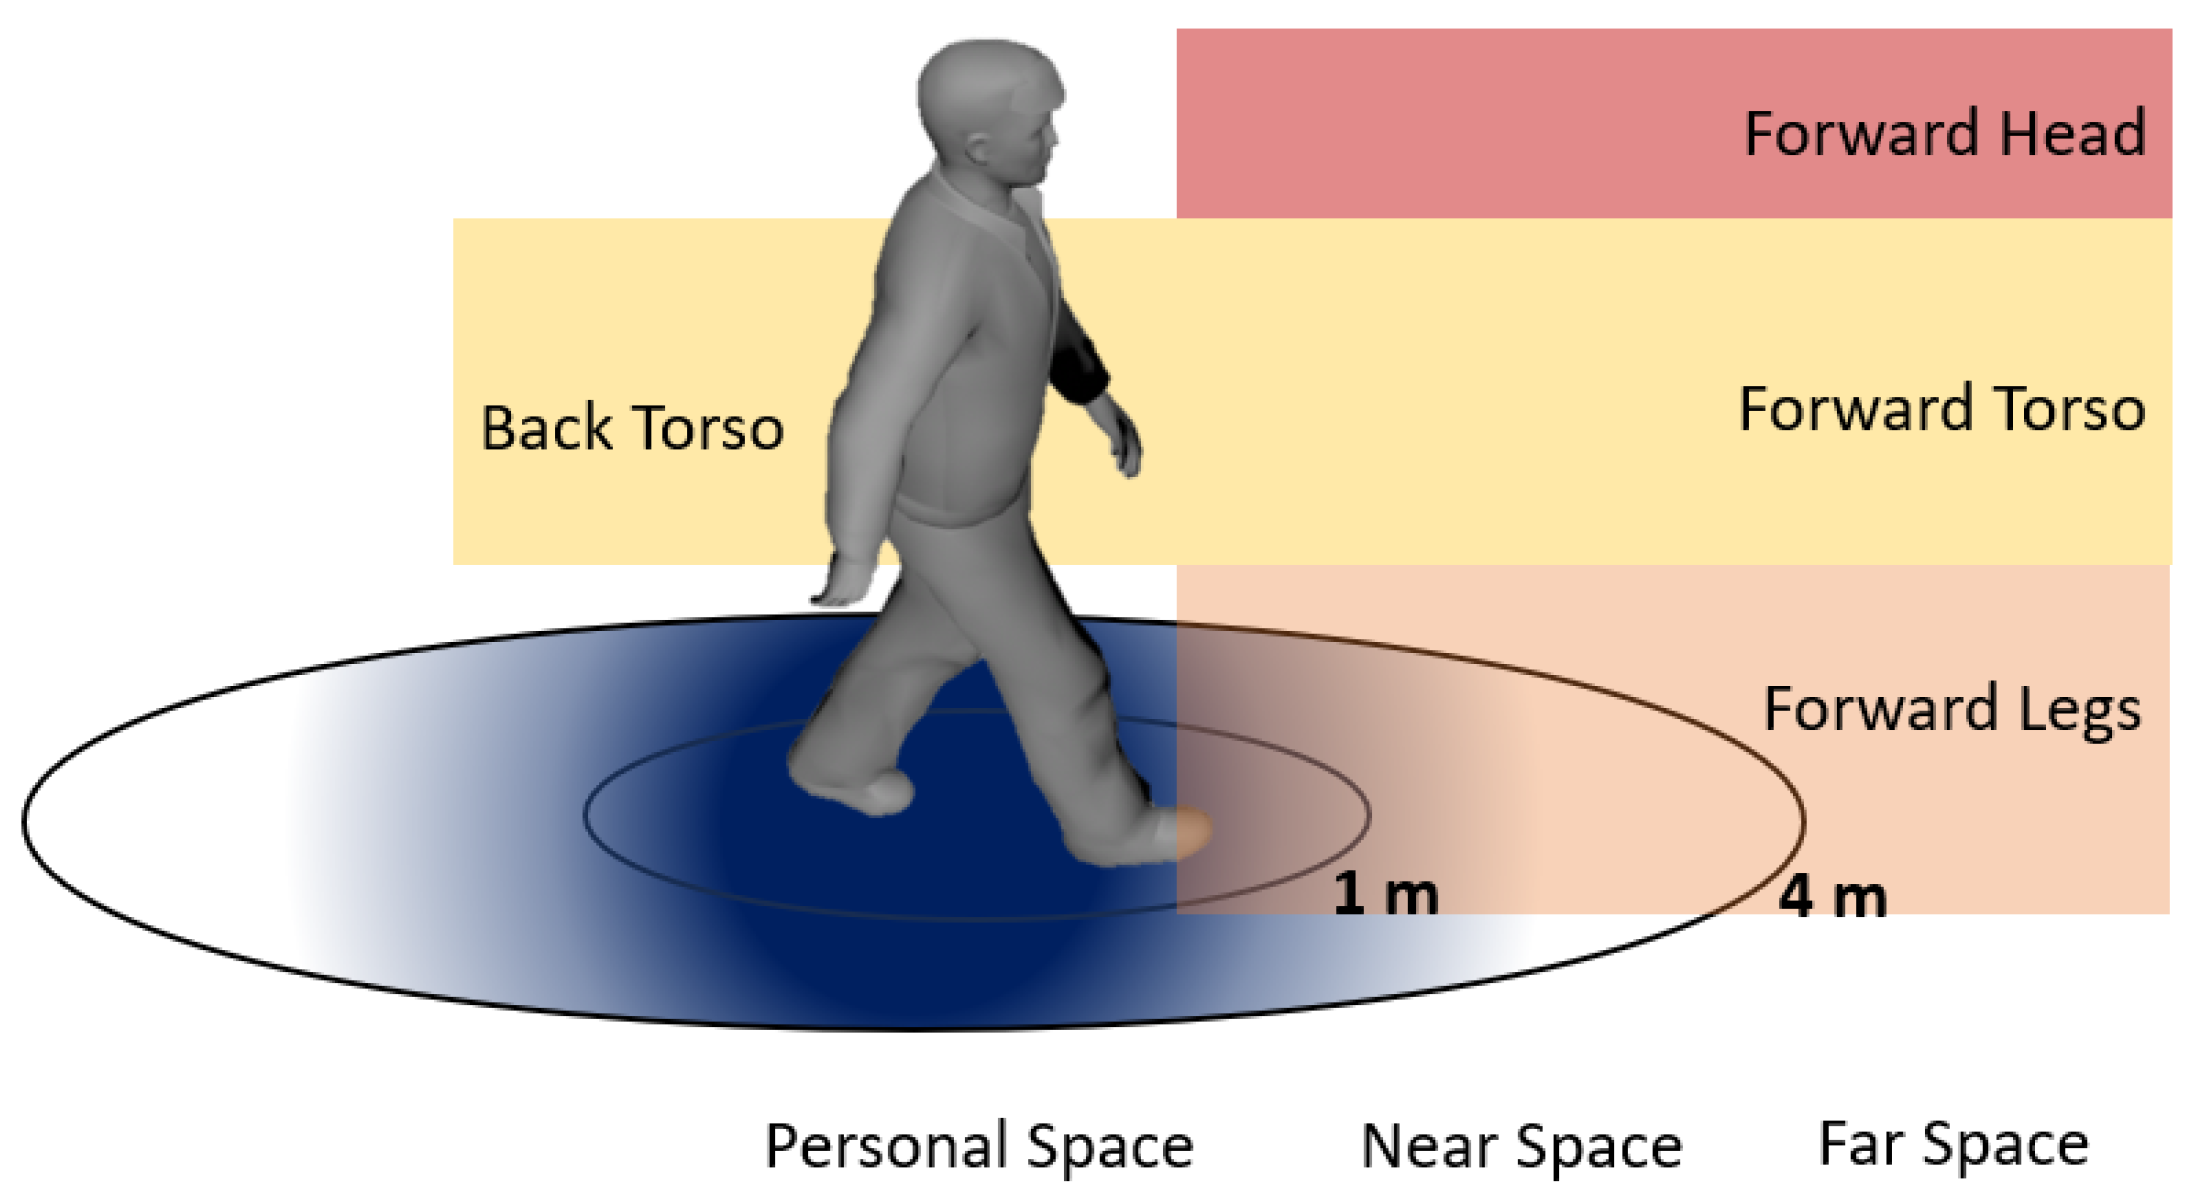
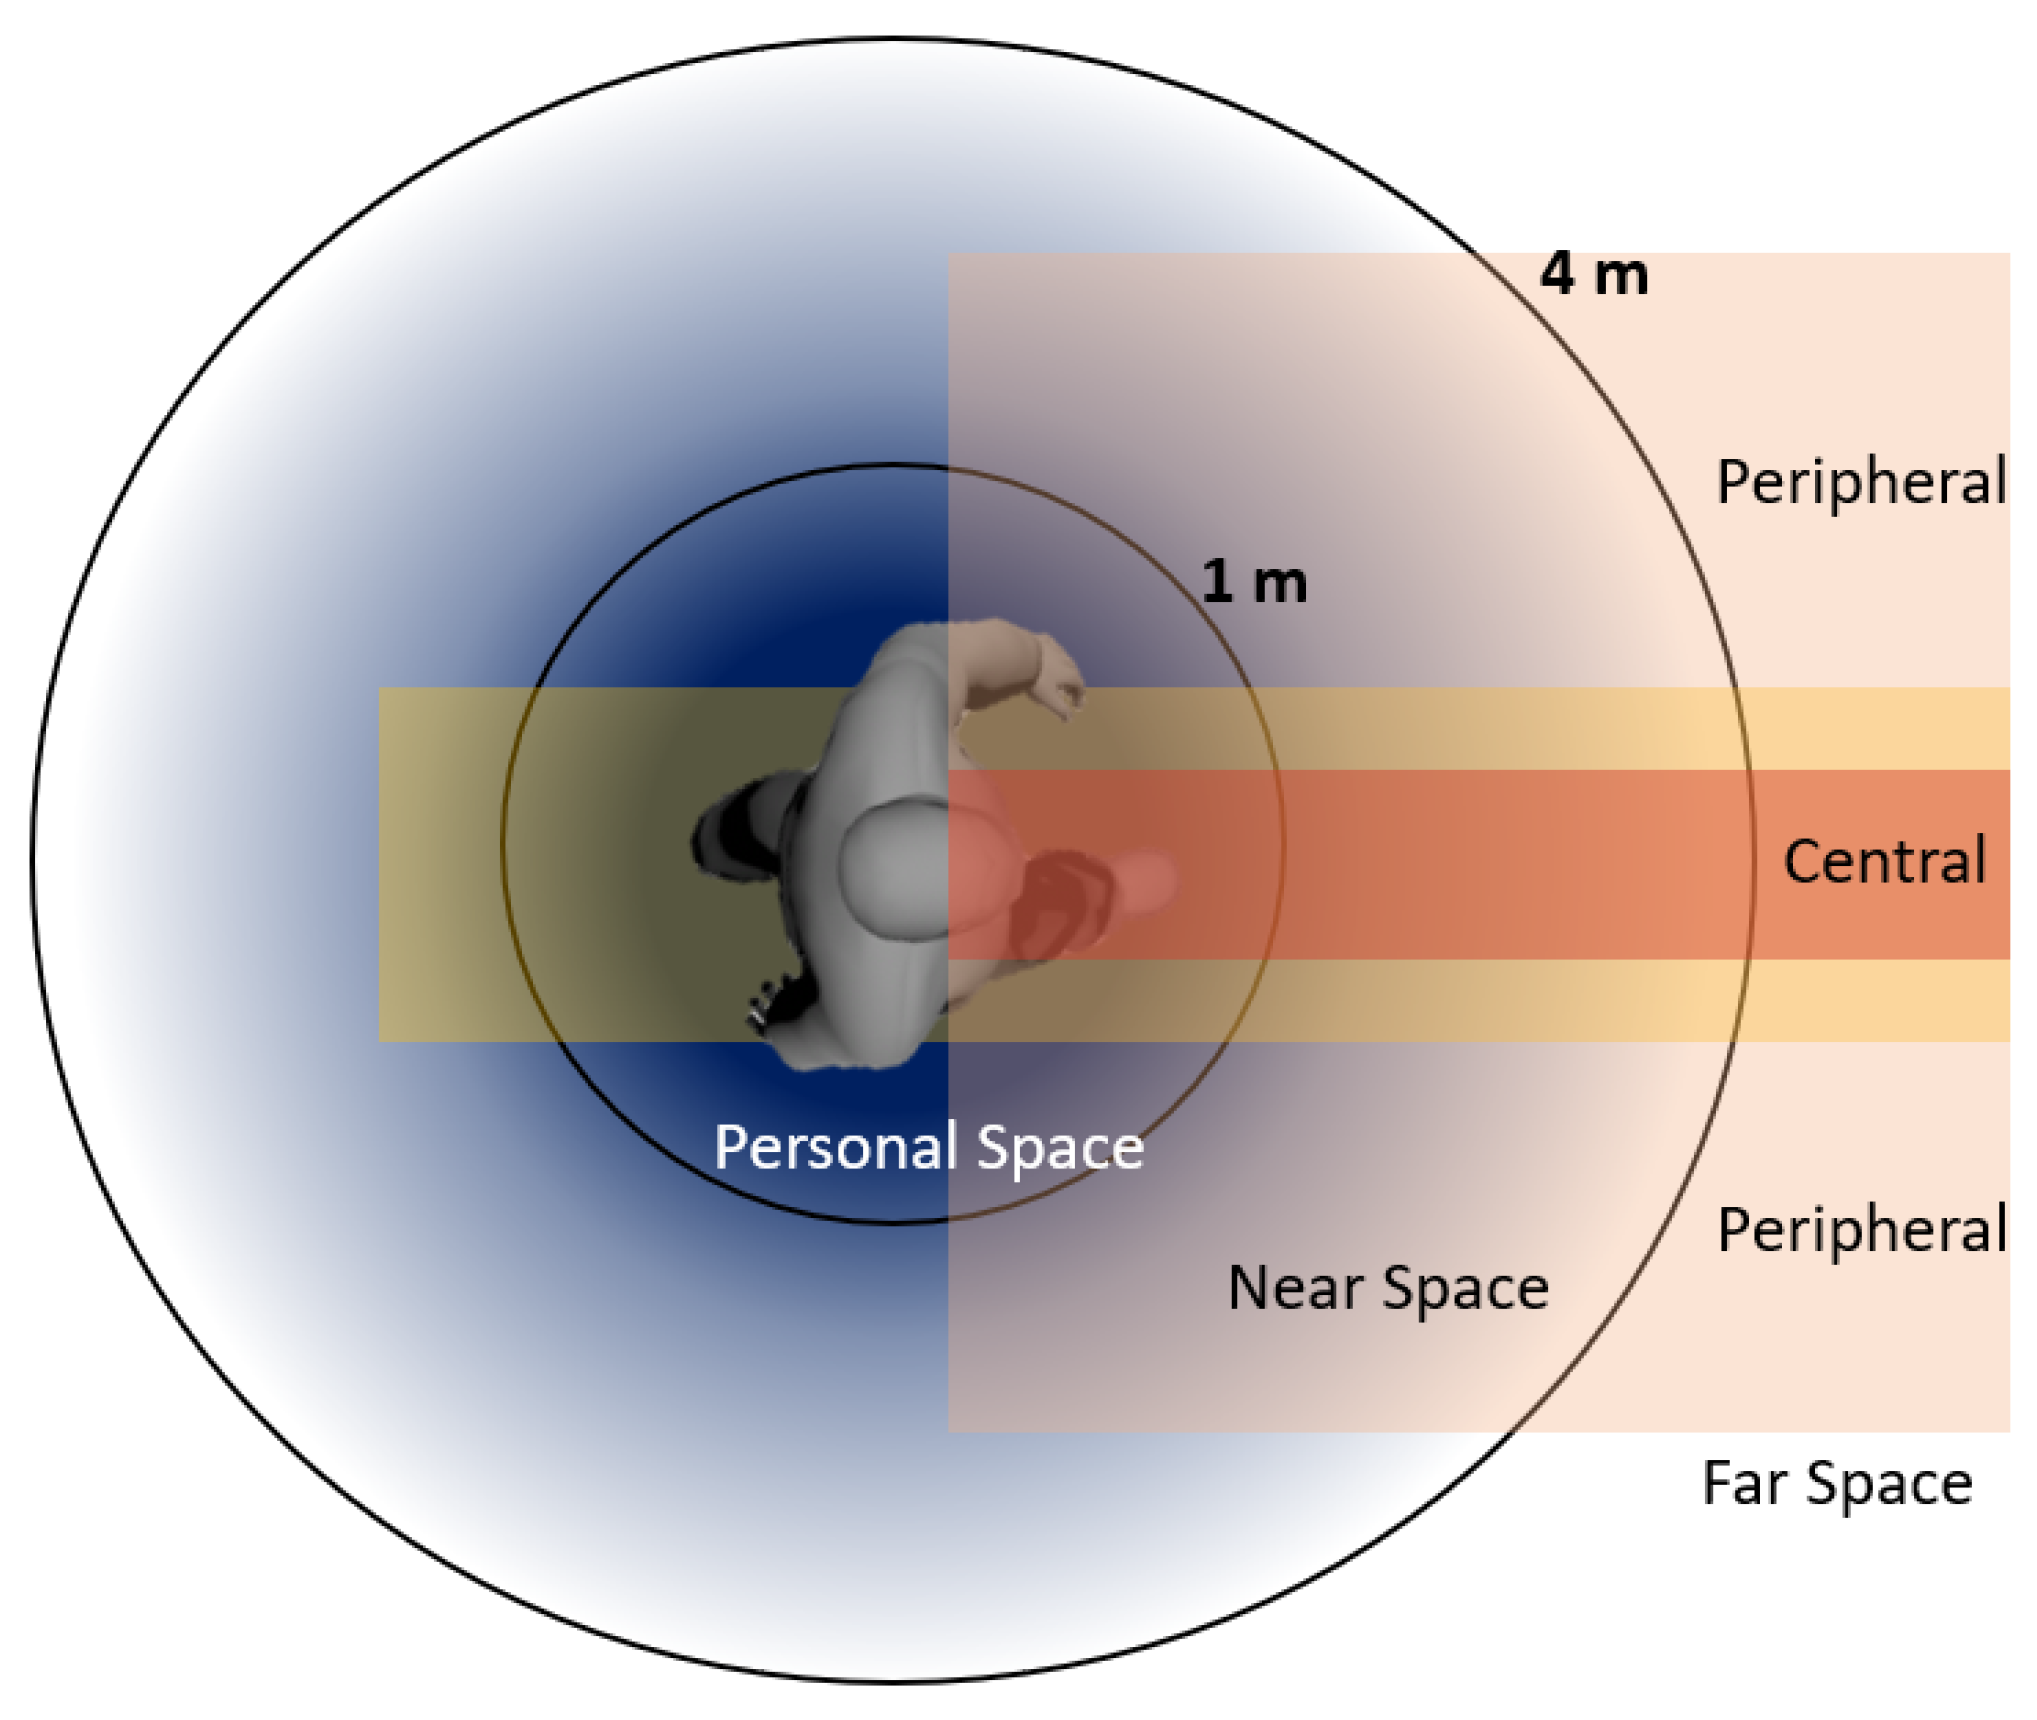
In the context of Hollins’ orientation skills [54], which emphasize the importance of spatial framing, Hall’s earlier work “The Hidden Dimension” [4] introduces the concept of extra-personal space, illustrated in Figure 2. This space is delineated by the effective range of human senses extending outward from the individual, serving as a perceptual framework for constructing a cognitive map of the surrounding environment. Hall categorizes spatial zones into personal space (less than 1 m), near space (1–4 m), and far space (beyond 4 m).
By evaluating the effective range of each sensory modality—excluding vision—it becomes possible to determine which sense predominantly mediates perception within each spatial zone. Somatosensory perception, defined as the body-wide processing of tactile, pressure, thermal, and pain stimuli [55], governs personal space. The use of a mobility aid, such as a cane, extends this perceptual boundary to approximately one metre, thereby expanding the user’s personal space.
Olfaction and gustation, both chemical senses with overlapping neural processing pathways [56], are similarly limited to the domain of personal space due to their constrained range. In contrast, audition, which involves the transduction of pressure waves into neural signals, operates effectively across both near and far spaces. Consequently, in the absence of visual input, hearing emerges as the only sensory modality capable of spanning all three spatial zones described in Hollins’ model of extra-personal space shown in Figure 2.
With spatial framing serving as a fundamental mechanism for constructing cognitive maps essential to navigation, Hall’s concept of extra-personal space offers a systematic framework for organizing sensory information relative to an individual’s position in the environment. The cognitive map functions not only in the planning phase—enabling individuals to chart a route from point A to point B—but also during execution, guiding real-time decision making. In controlled environments, spatial framing may be required only once at the outset. However, in dynamic or uncontrolled settings, the cognitive map must be continuously revised. Objects may shift, new elements may emerge, and the spatial configuration can change substantially over time, necessitating constant sensory engagement and cognitive recalibration.
Hall’s framework provides a systematic basis for organizing sensory input into cognitive maps, which support both route planning and real-time navigation. While spatial framing may occur once in controlled settings, dynamic environments require continuous updating as objects move or new elements appear. Effective navigation, thus, depends on constant sensory engagement and ongoing recalibration of the cognitive map.
To the knowledge of the researchers, no ETA in the literature has adopted a framework of this kind into its design. The next section explores the design of the proposed working prototype, describing both input and output sensor plan designs defined by the aforementioned framework.

4. Materials and Methods (Abridged)

The proposed ETA system comprises multiple interconnected components—henceforth referred to as nodes—each purposefully designed for seamless integration with specific wearable and assistive platforms, namely, smart glasses, a belt, and a cane. These nodes are strategically positioned across different body regions to function collaboratively, with their spatial distribution providing complementary fields of view and thereby enhancing overall system performance. Each node—Glasses, Belt, and Cane—operates autonomously, powered by lithium-ion batteries, enabling a fully wireless, portable configuration optimized for continuous and unfettered wearable use.
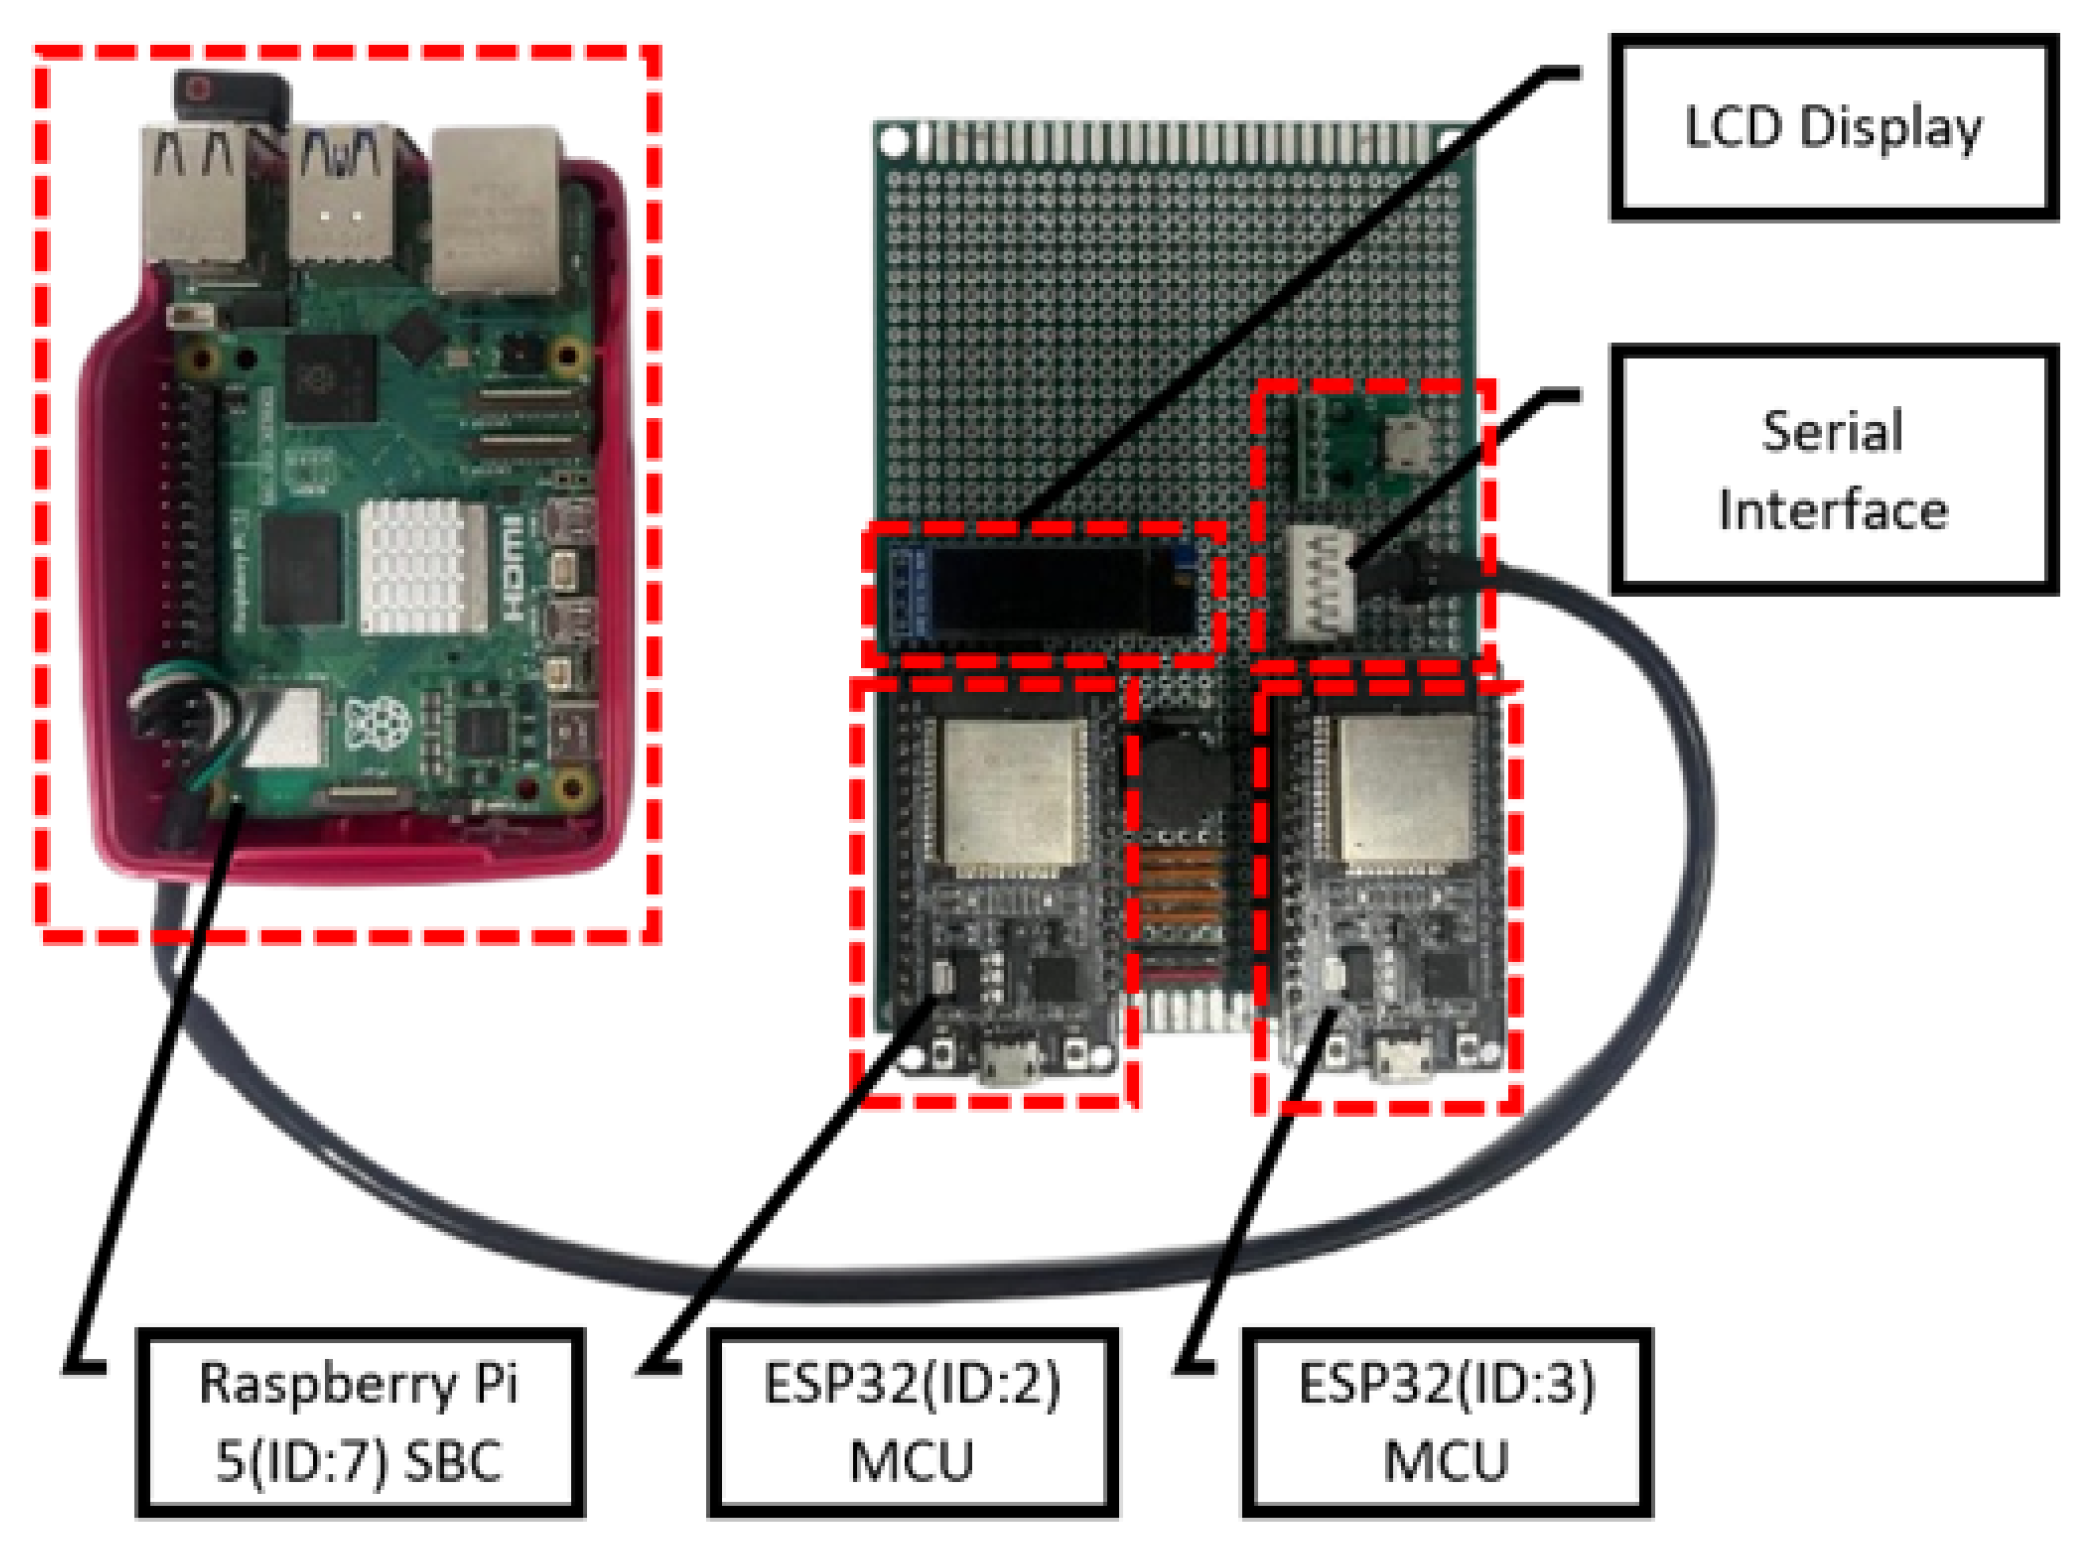
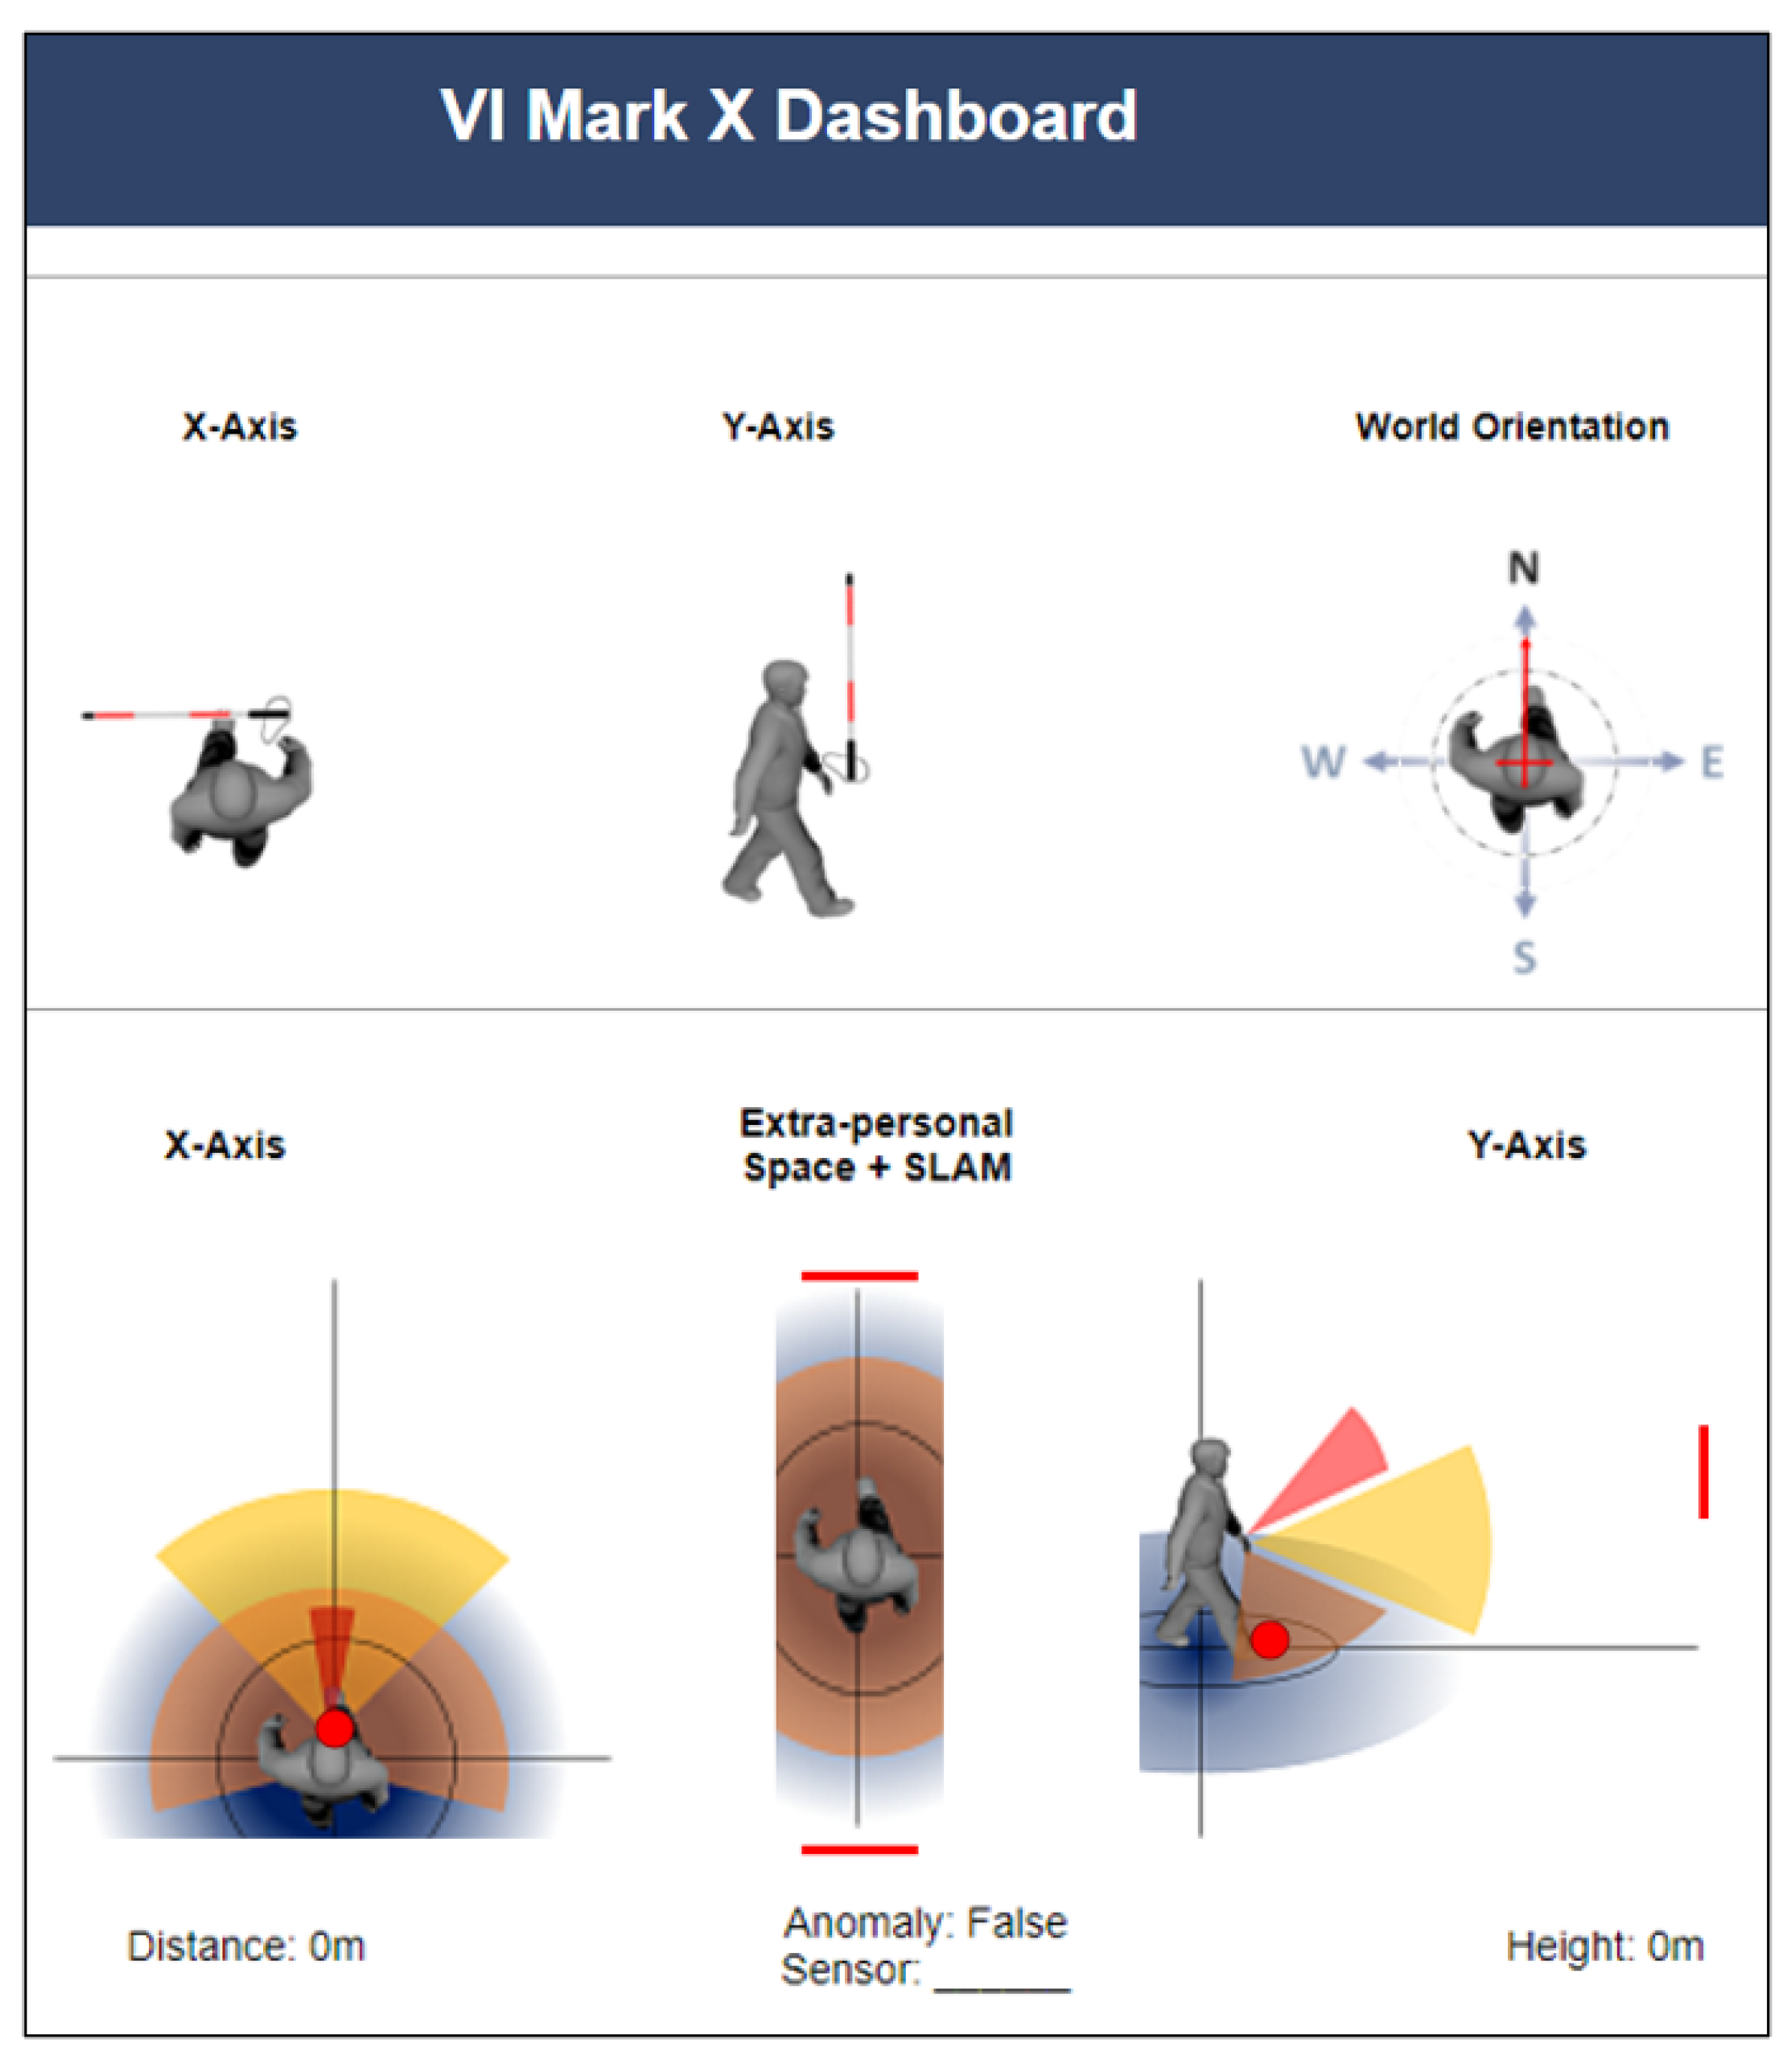
To facilitate real-time monitoring, performance evaluation, and object classification, an additional AI Processing and Monitoring Node was developed. The AI Processing and Monitoring node functions as the supervisory hub of the ETA system. It classifies objects detected in the Glasses video feed using lightweight vision models, returning outputs as auditory cues. Simultaneously, it aggregates data from all nodes for logging, monitoring, and performance evaluation. Figure 3 and Figure 4 illustrate the hardware and real-time interface.

4.1. ETA Architecture

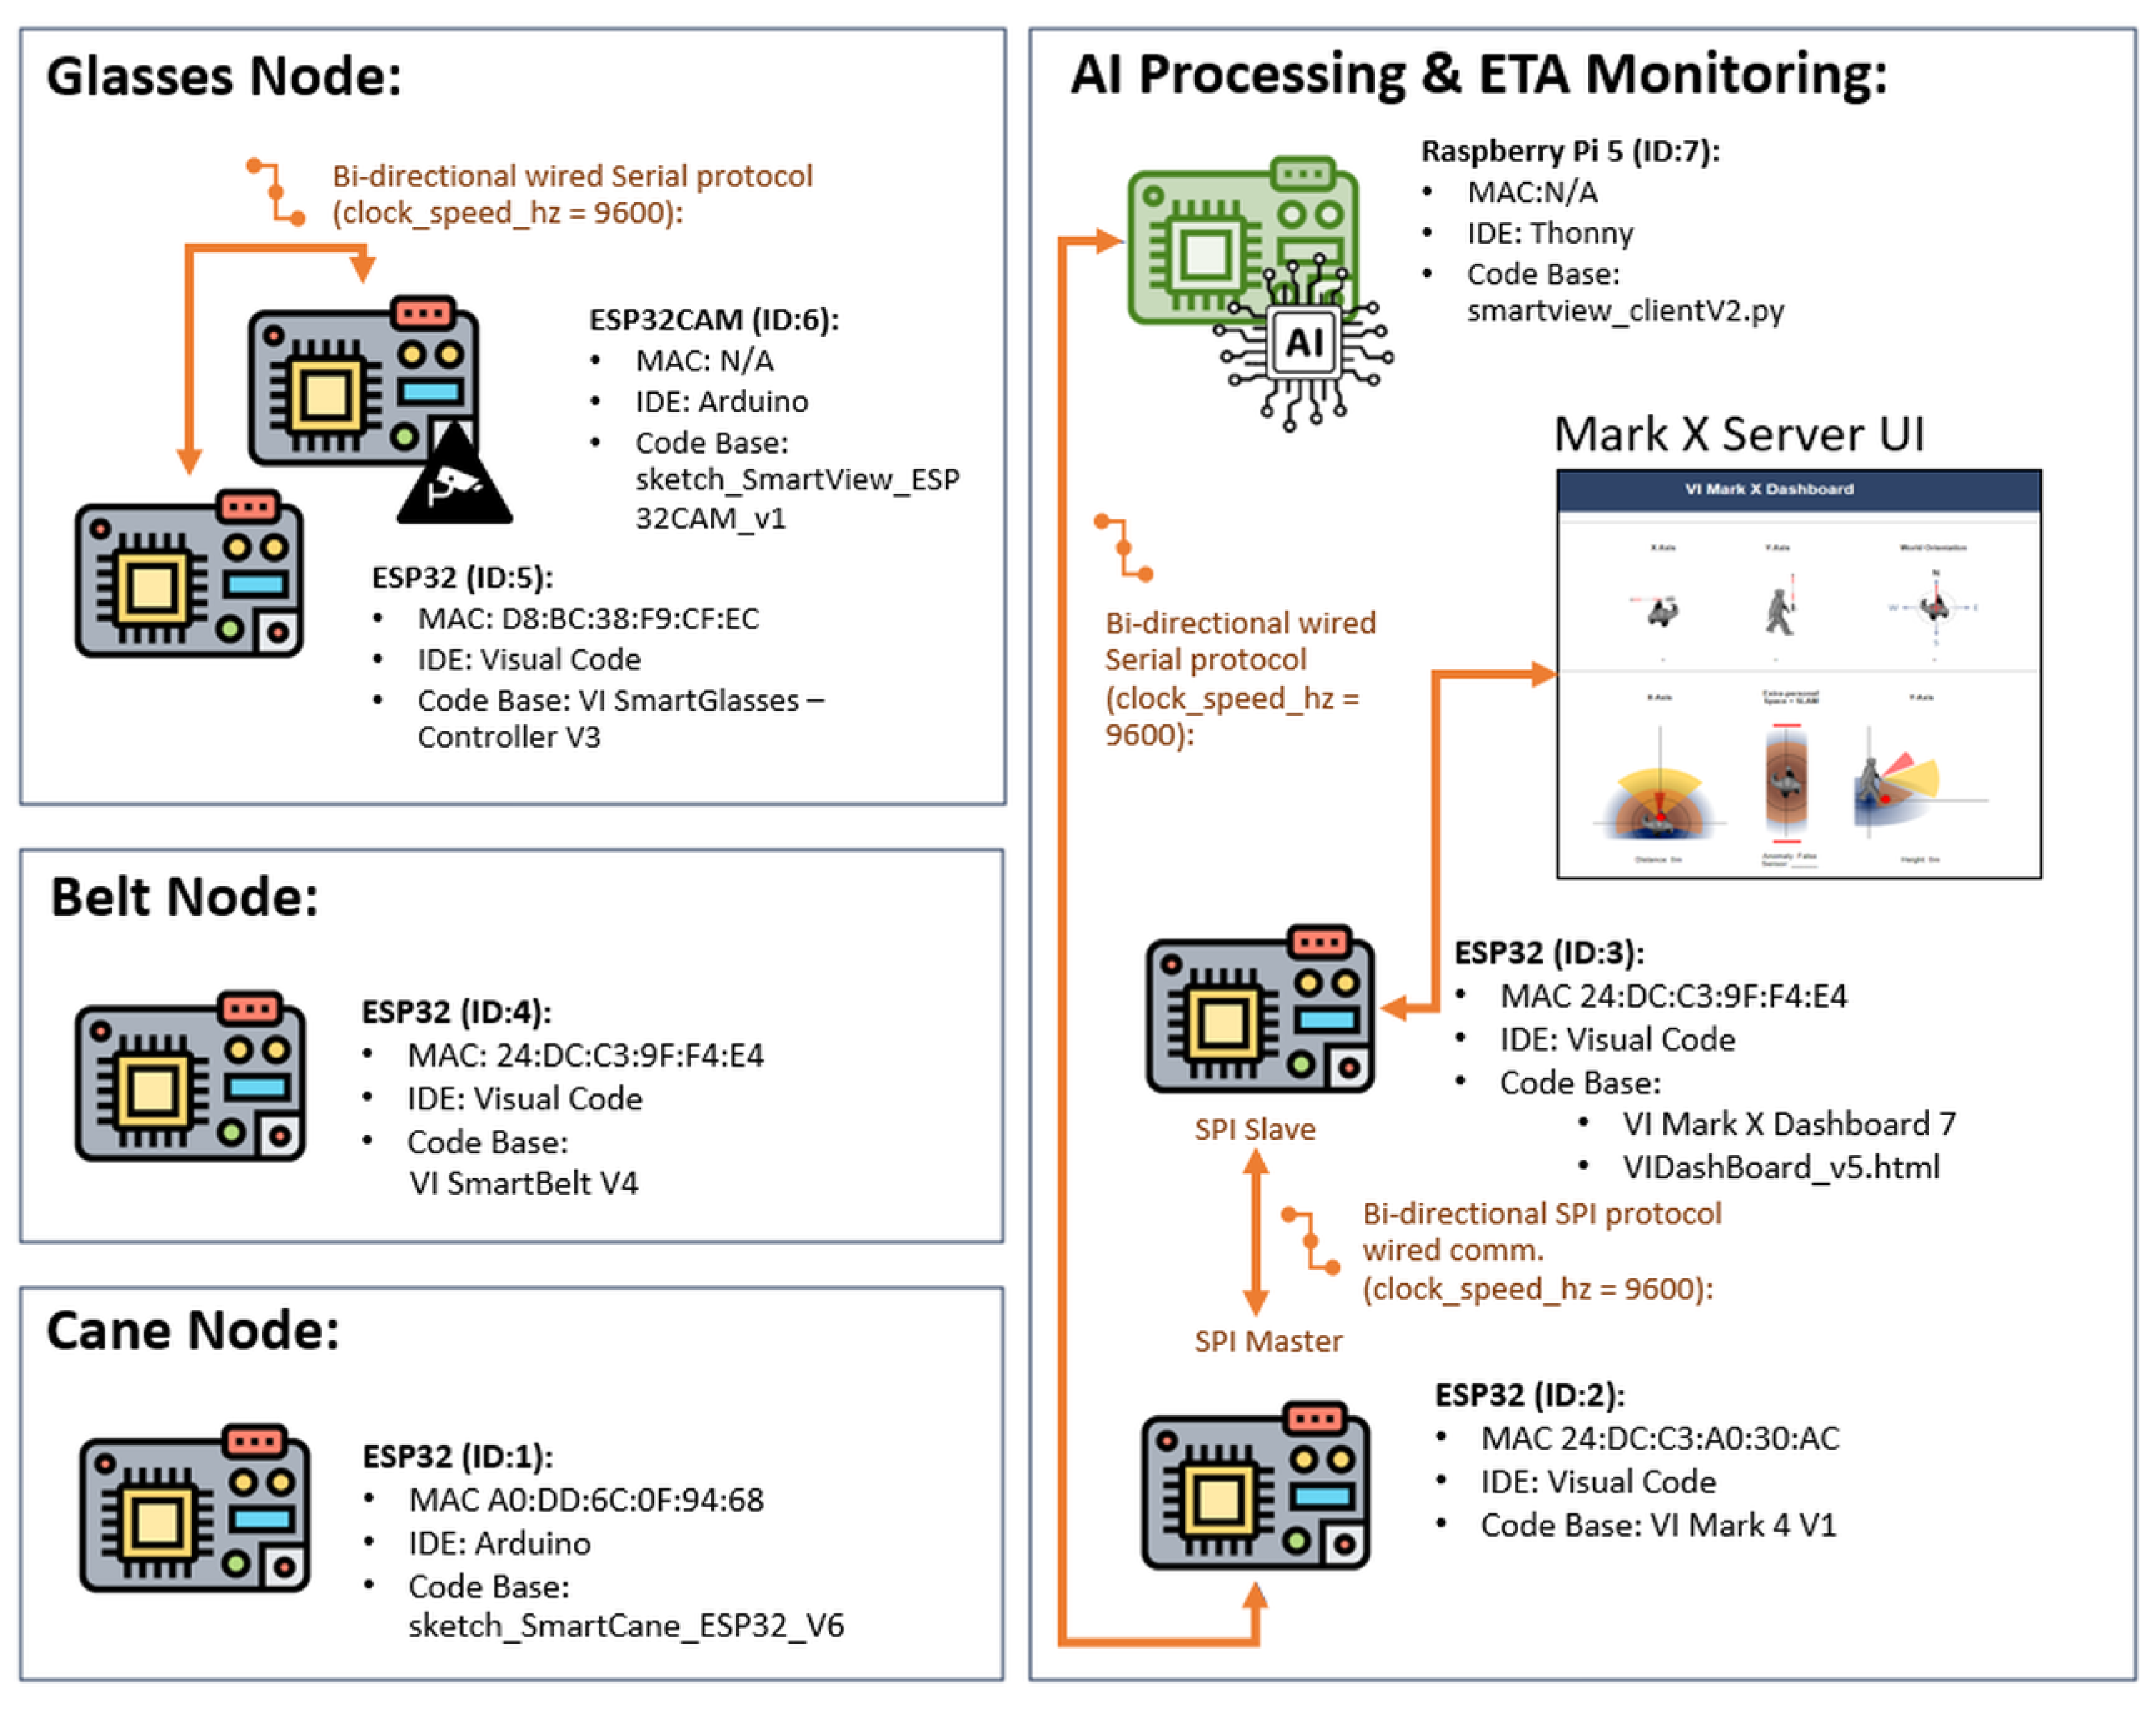
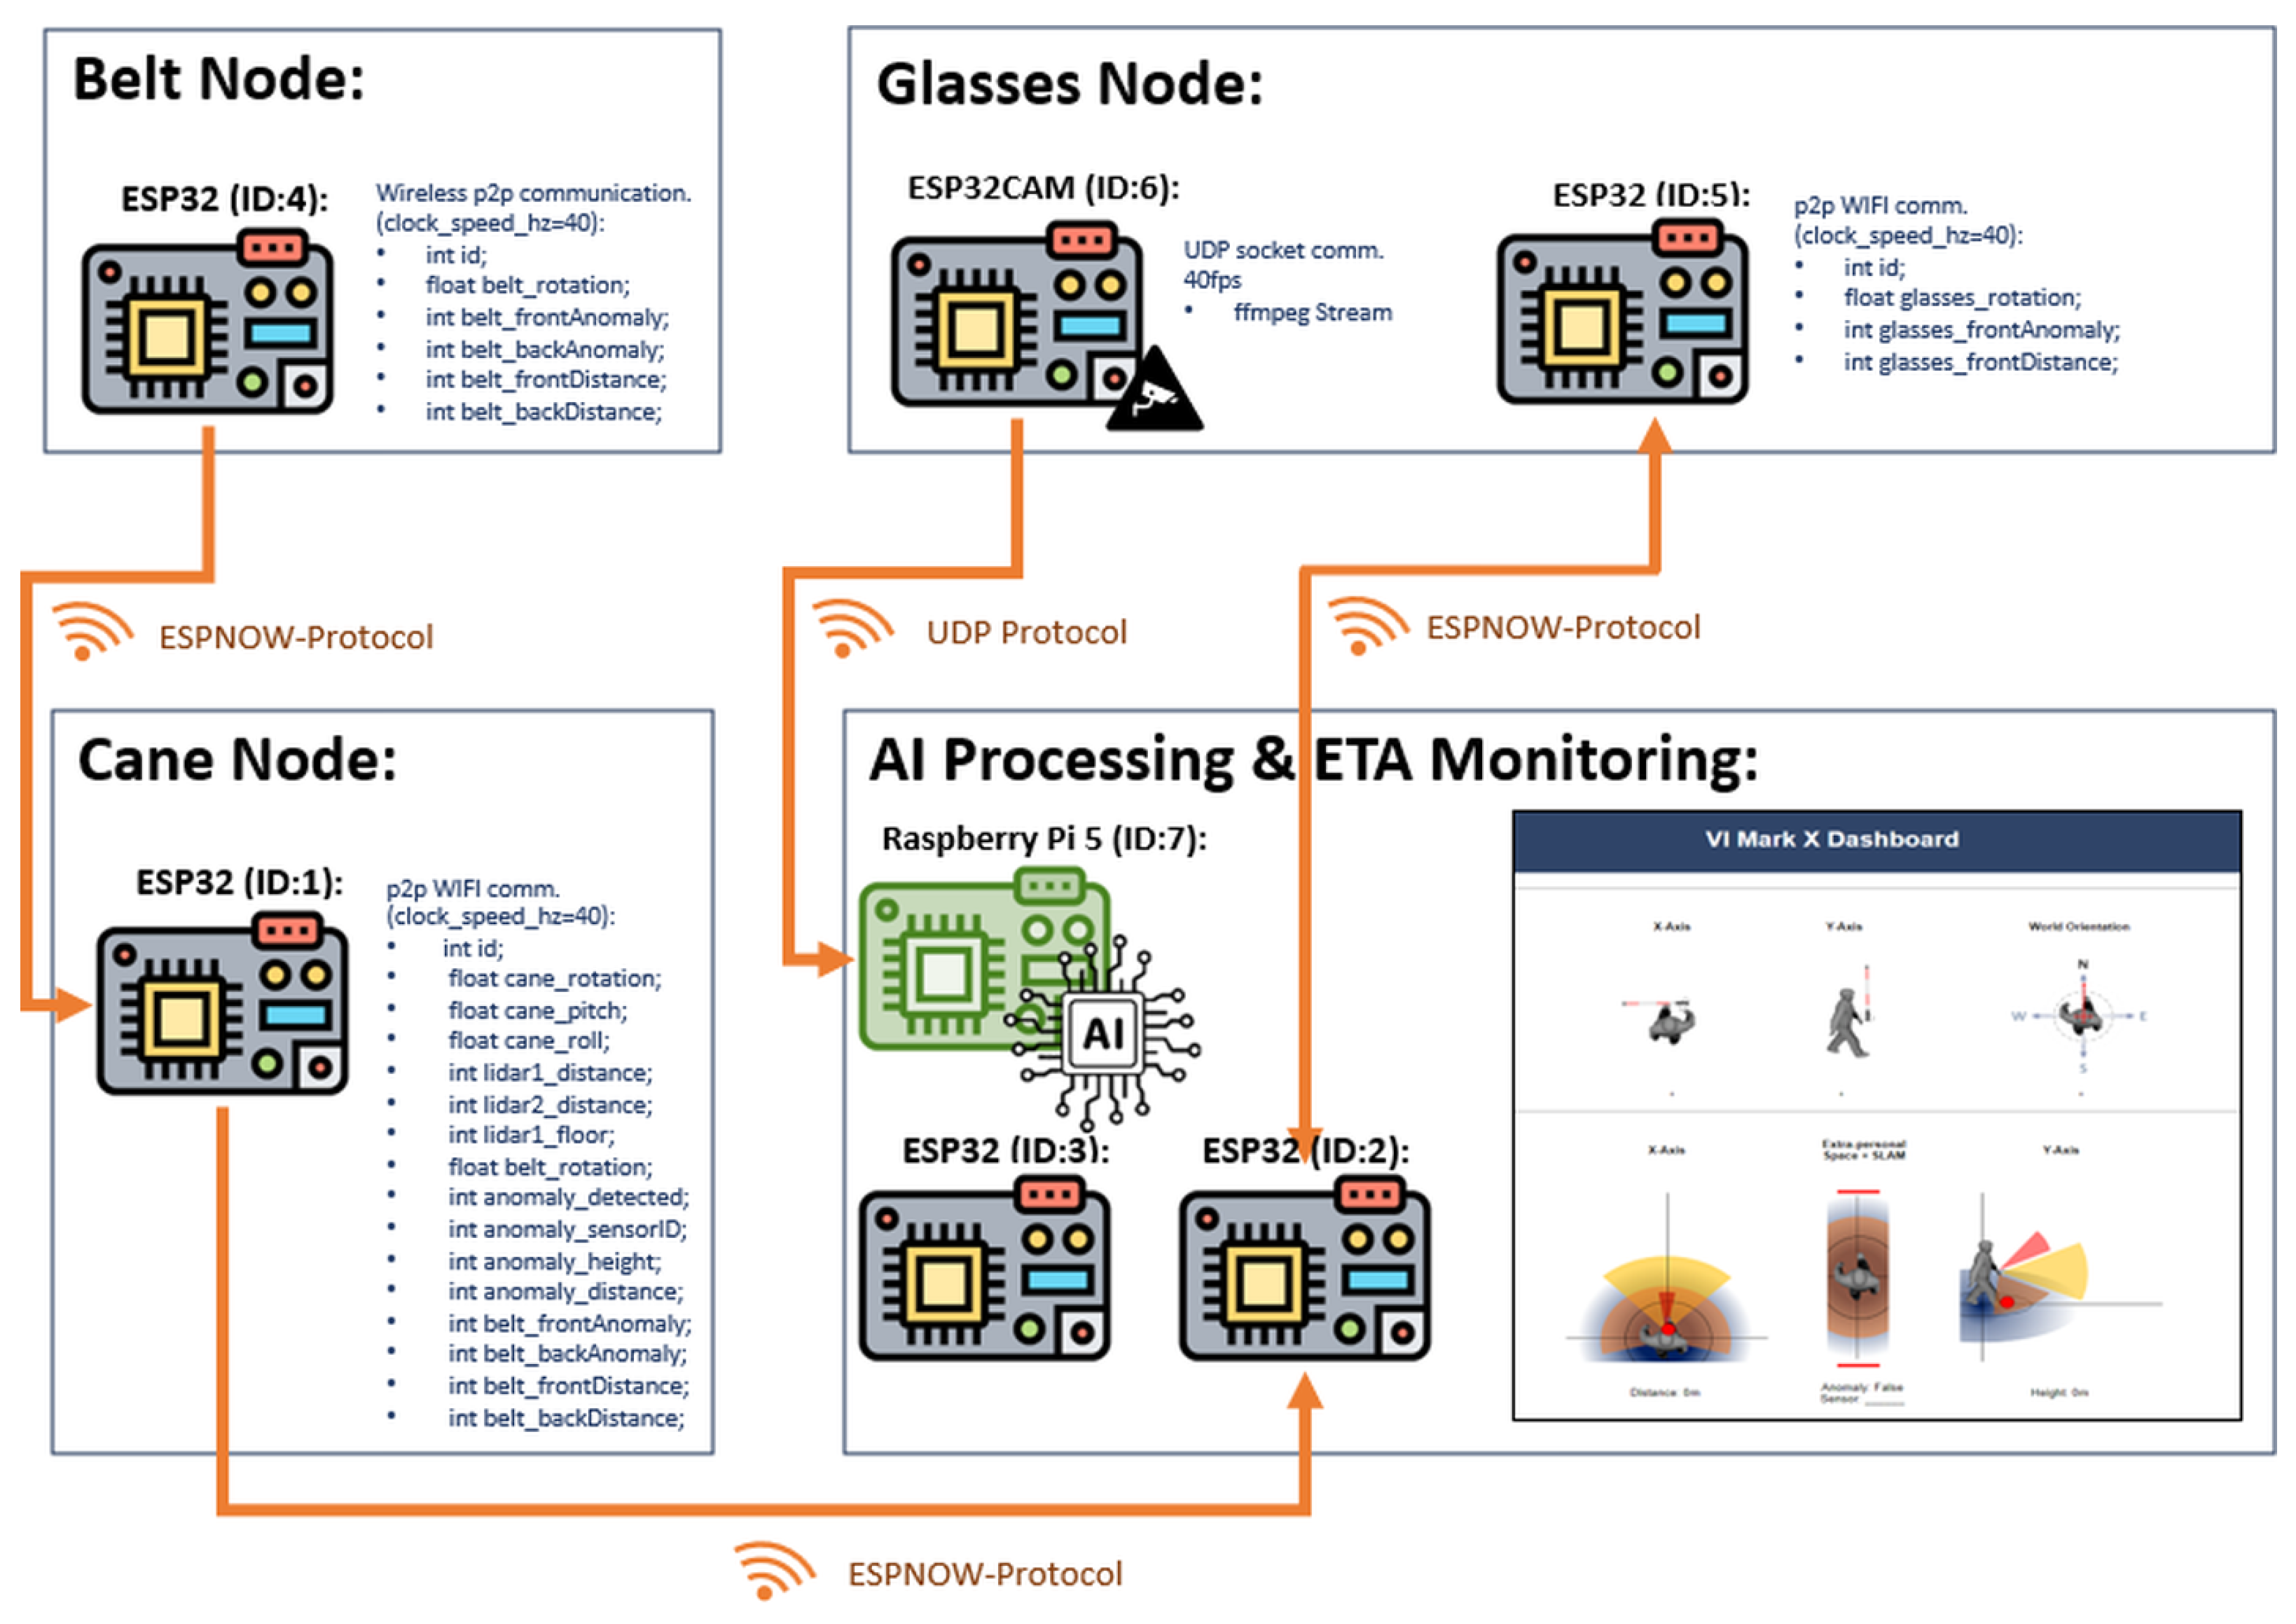
Figure 5 illustrates the complete node architecture, detailing the hardware components, internal node communication protocols, and development framework employed across the system.
Inter-node communication is achieved through a modified peer-to-peer ESP-NOW protocol [57], enabling efficient, low-latency data sharing. For video streaming from the Glasses node to the Raspberry Pi 5 SBC, the User Datagram Protocol (UDP) [58] is employed to support lightweight, high-speed transmission. This communication architecture ensures that environmental perception is shared across nodes, enabling cooperative interpretation and synchronized feedback. Figure 6 illustrates the wireless communication model.
With the overall system architecture and communication framework established, the following sections examine each node individually, detailing its hardware configuration, algorithm logic, sensor deployment, and functional role within the multi-node ETA design.

4.2. Glasses Node

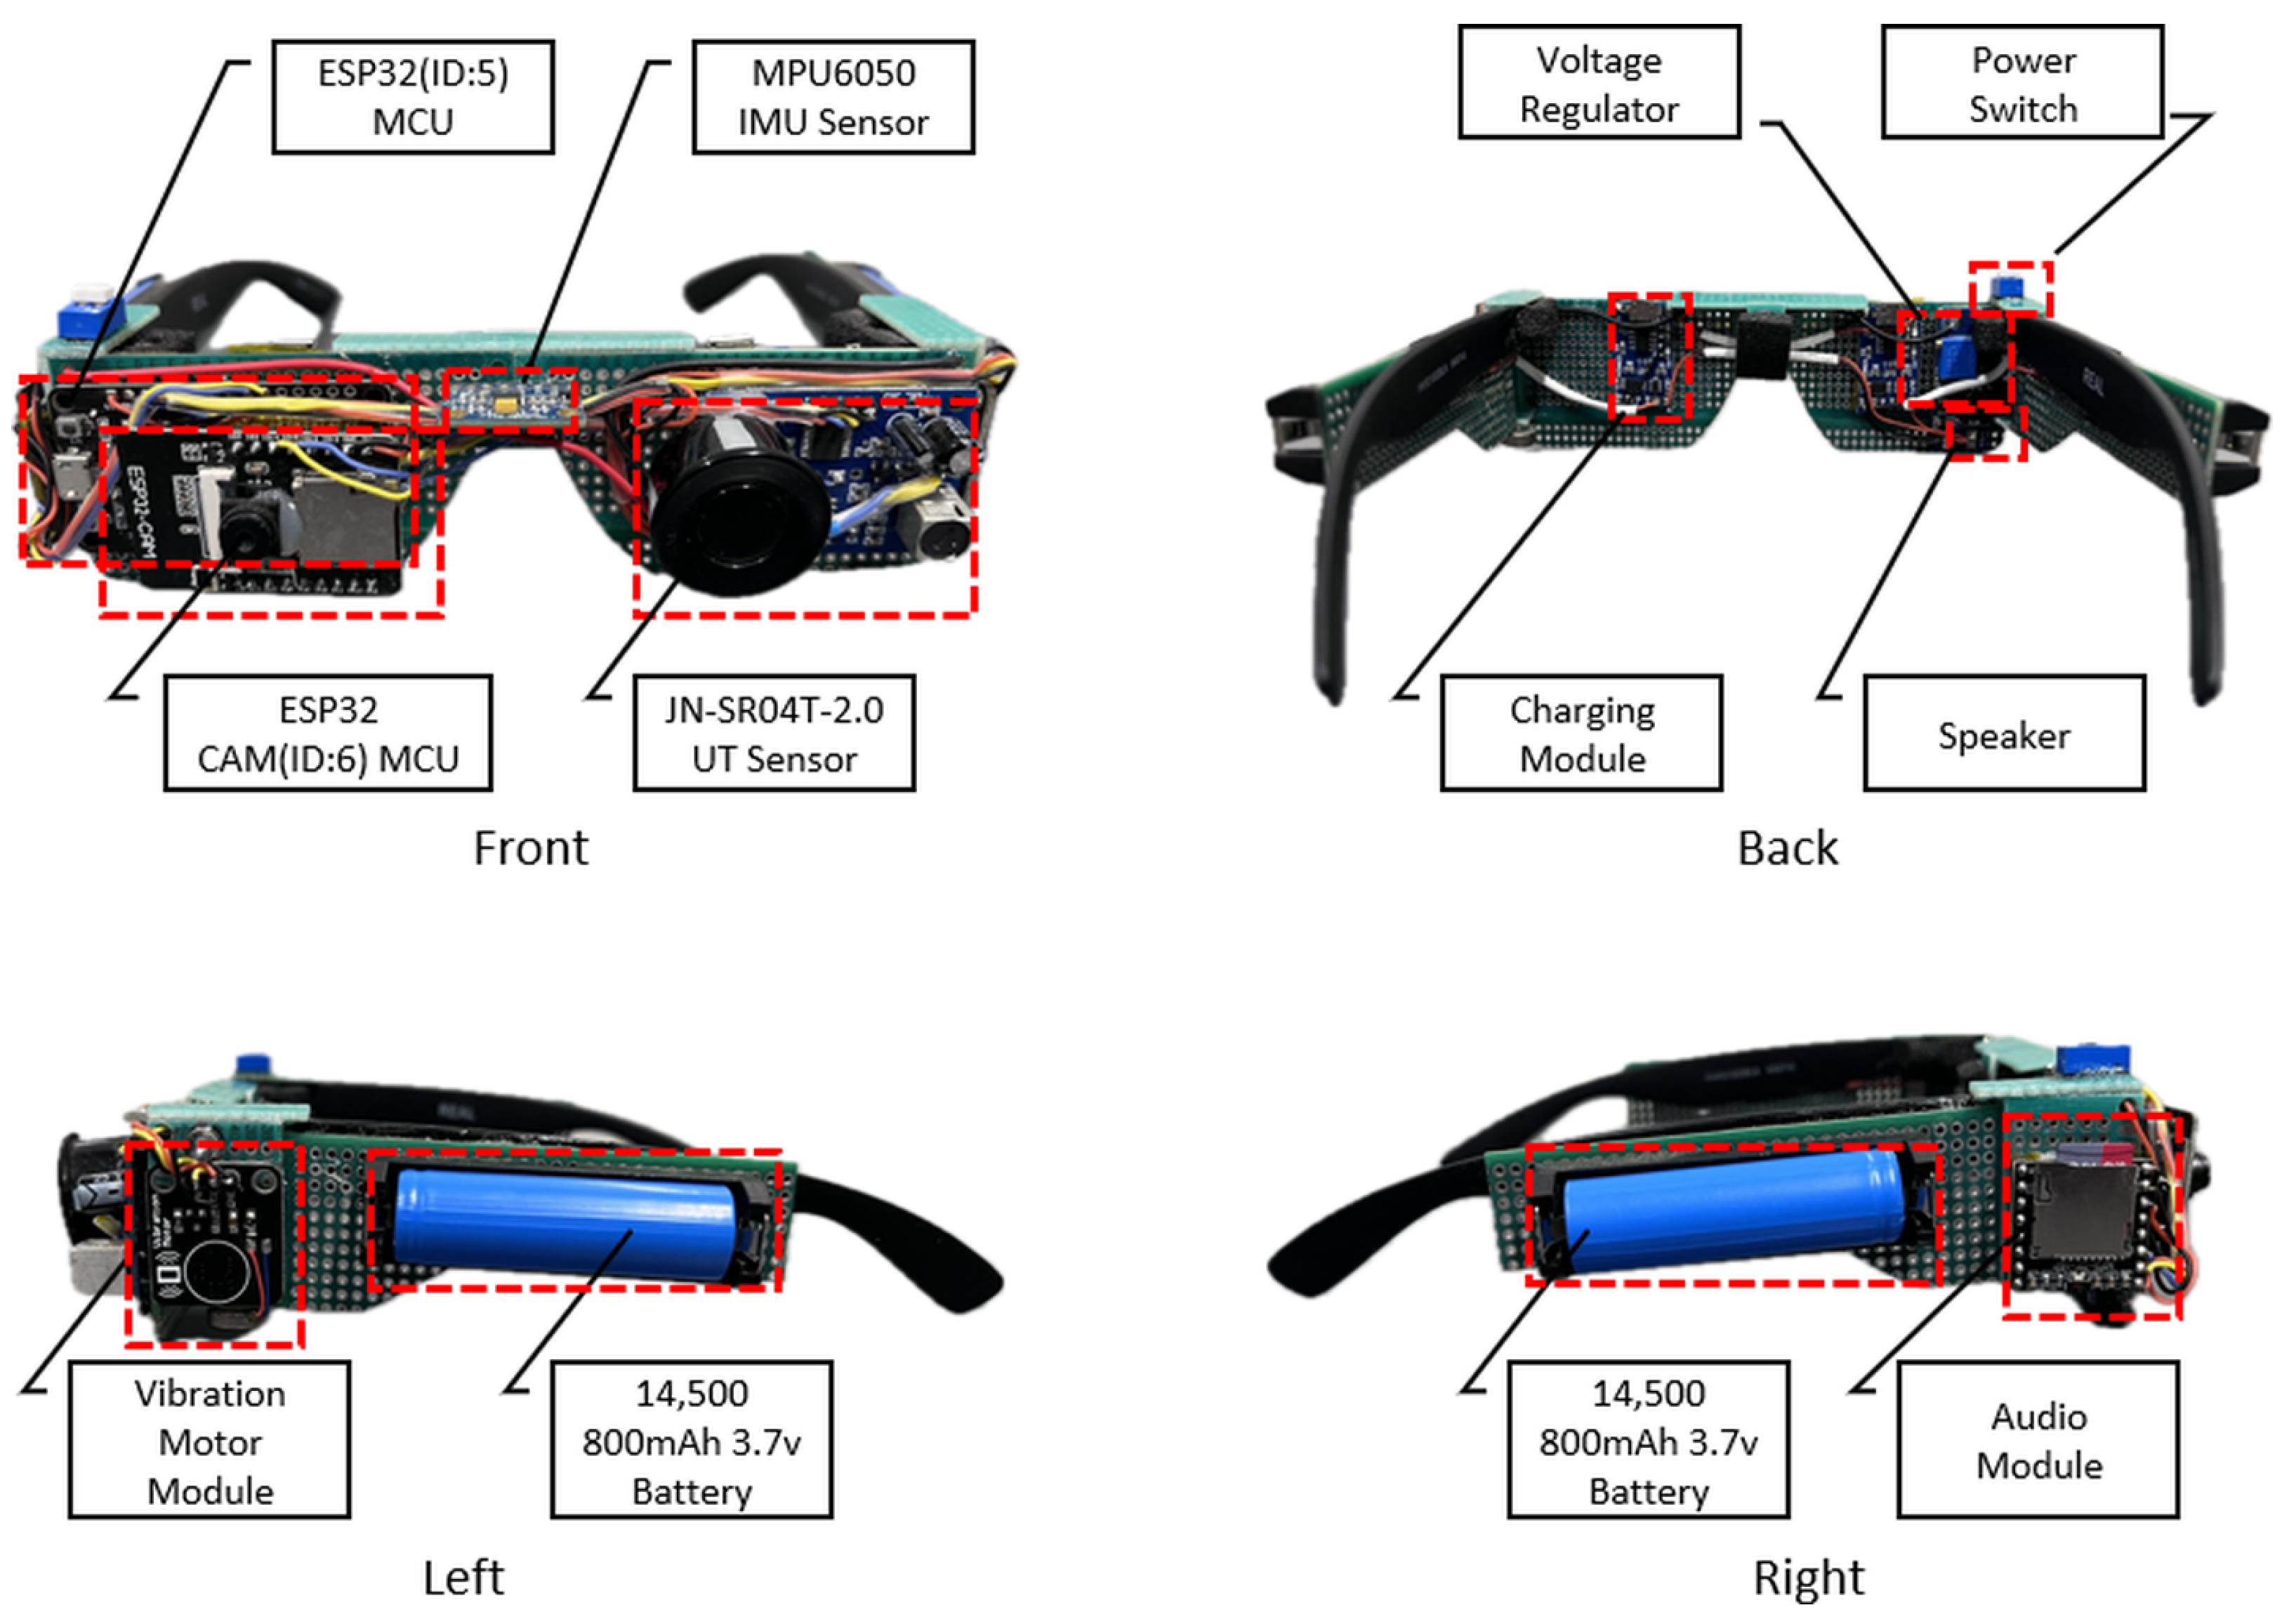
The Glasses node is designed to collect environmental data from a head-mounted perspective. The primary input sensor configuration includes an ESP32-CAM module [59], which features an image-based sensor for capturing a live video stream of the user’s front-facing FoV. Additionally, a waterproof ultrasonic sensor JSN-SR04T-2.0 [60] sensor is integrated to a second ESP32 MCU to enable forward-facing range sensing. The secondary input configuration incorporates an MPU6050 Inertial Measurement Unit (IMU) module for orientation and movement tracking of the head. For output, the system includes a vibration motor for haptic feedback and a speaker for audio-based speech feedback. Figure 7 depicts the hardware configuration for the Glasses node.
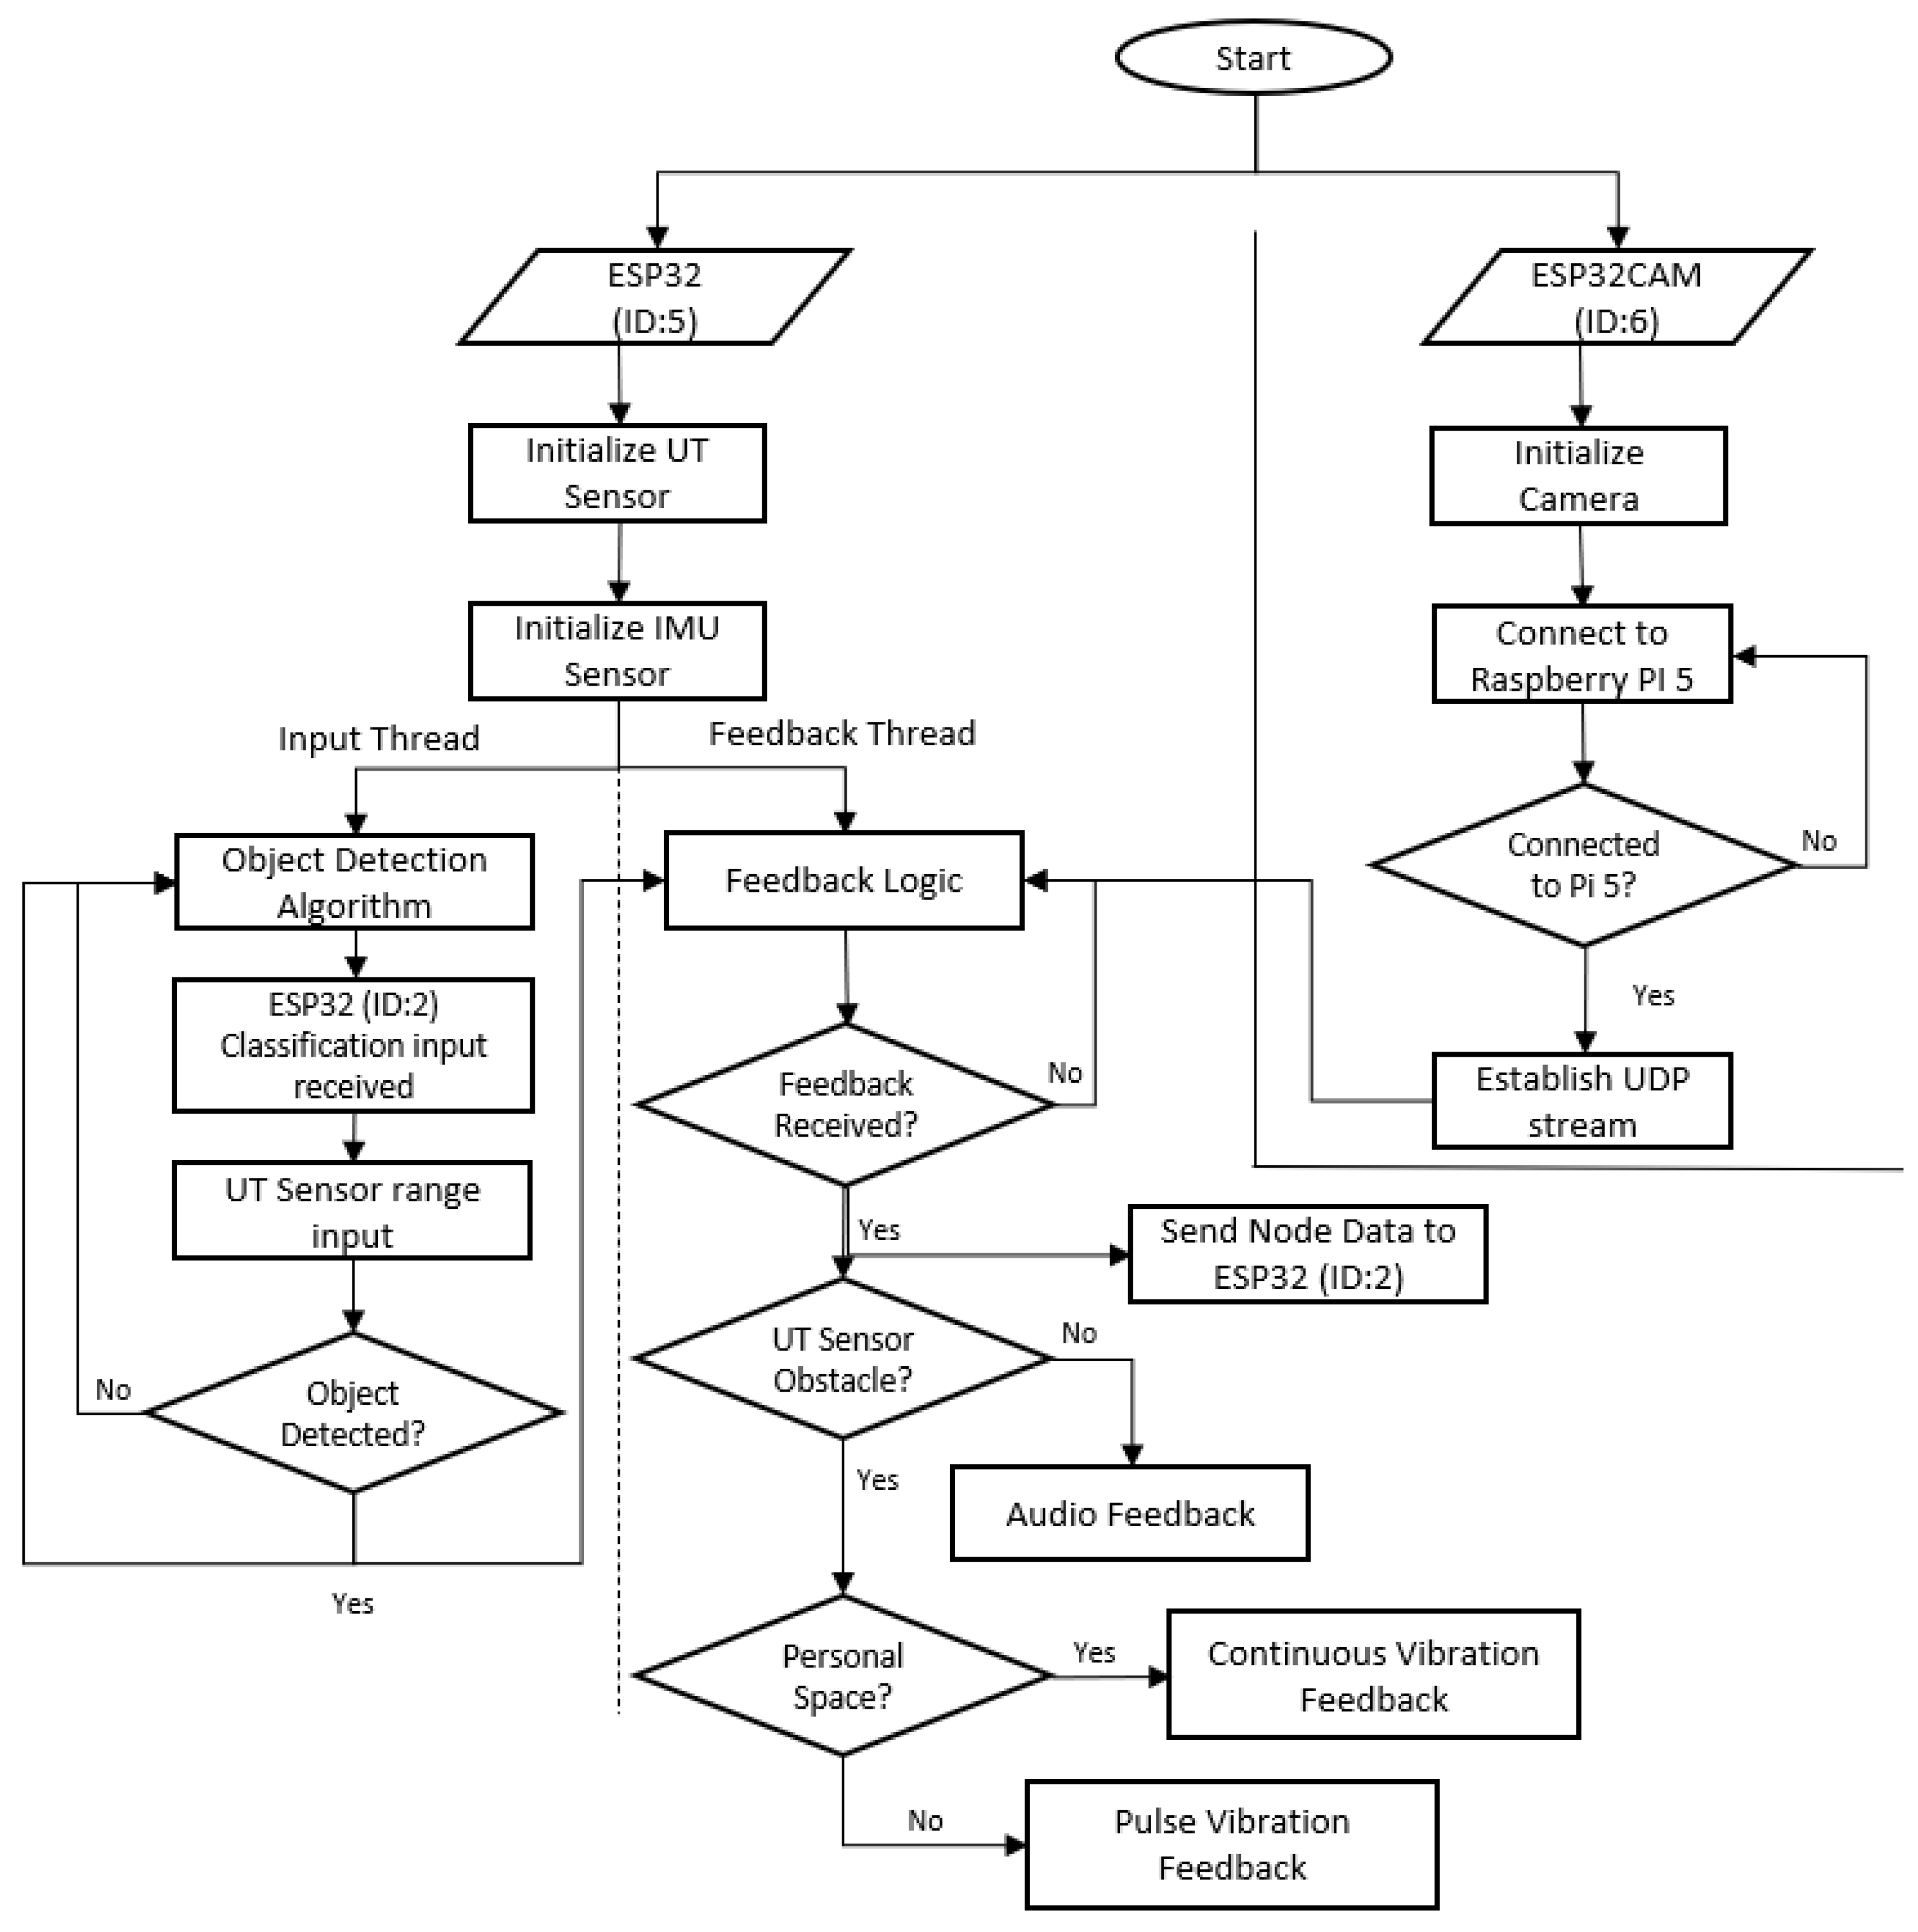
The algorithm is distributed across two MCUs. The ESP32 manages inter-node communication, ultrasonic sensing, and feedback, while the ESP32-CAM streams video to the Raspberry Pi 5 for classification. Figure 8 summarizes this logic.
The next section explores the evaluation of YOLO models for the purpose of object classification within the proposed system.

Object Classification Using COCO and YOLO

YOLO (You Only Look Once) represents a family of convolutional neural network models developed for real-time object detection. Initially introduced by Redmon et al. [61], the YOLO architecture has evolved through multiple iterations (YOLOv1–v11) and lightweight derivatives such as YOLO Lite and YOLO Nano, designed to balance detection accuracy and computational efficiency for embedded and mobile platforms.
Among these, YOLOv8, released by Ultralytics in 2023 [62], builds upon the YOLOv5 framework and incorporates architectural enhancements that improve inference speed, accuracy, and usability. The model consists of two main components: a convolutional backbone for feature extraction and a modular detection head for classification, regression, and objectness prediction. Structural optimizations, including the C2f module and cross-stage partial (CSP) connections [63,64], enhance feature propagation while reducing computational redundancy. The detachable head design enables independent task specialization, improving both precision and efficiency.
To evaluate lightweight YOLO variants for embedded deployment, a test bench was implemented using a Raspberry Pi 5 single-board computer and the COCO (Common Objects in Context) dataset [65]. Model performance was benchmarked using two key metrics: mean average precision (mAP) for detection accuracy and frames per second (FPS) for inference speed. These tests were conducted at varying input resolutions to assess the trade-off between accuracy and computational efficiency.
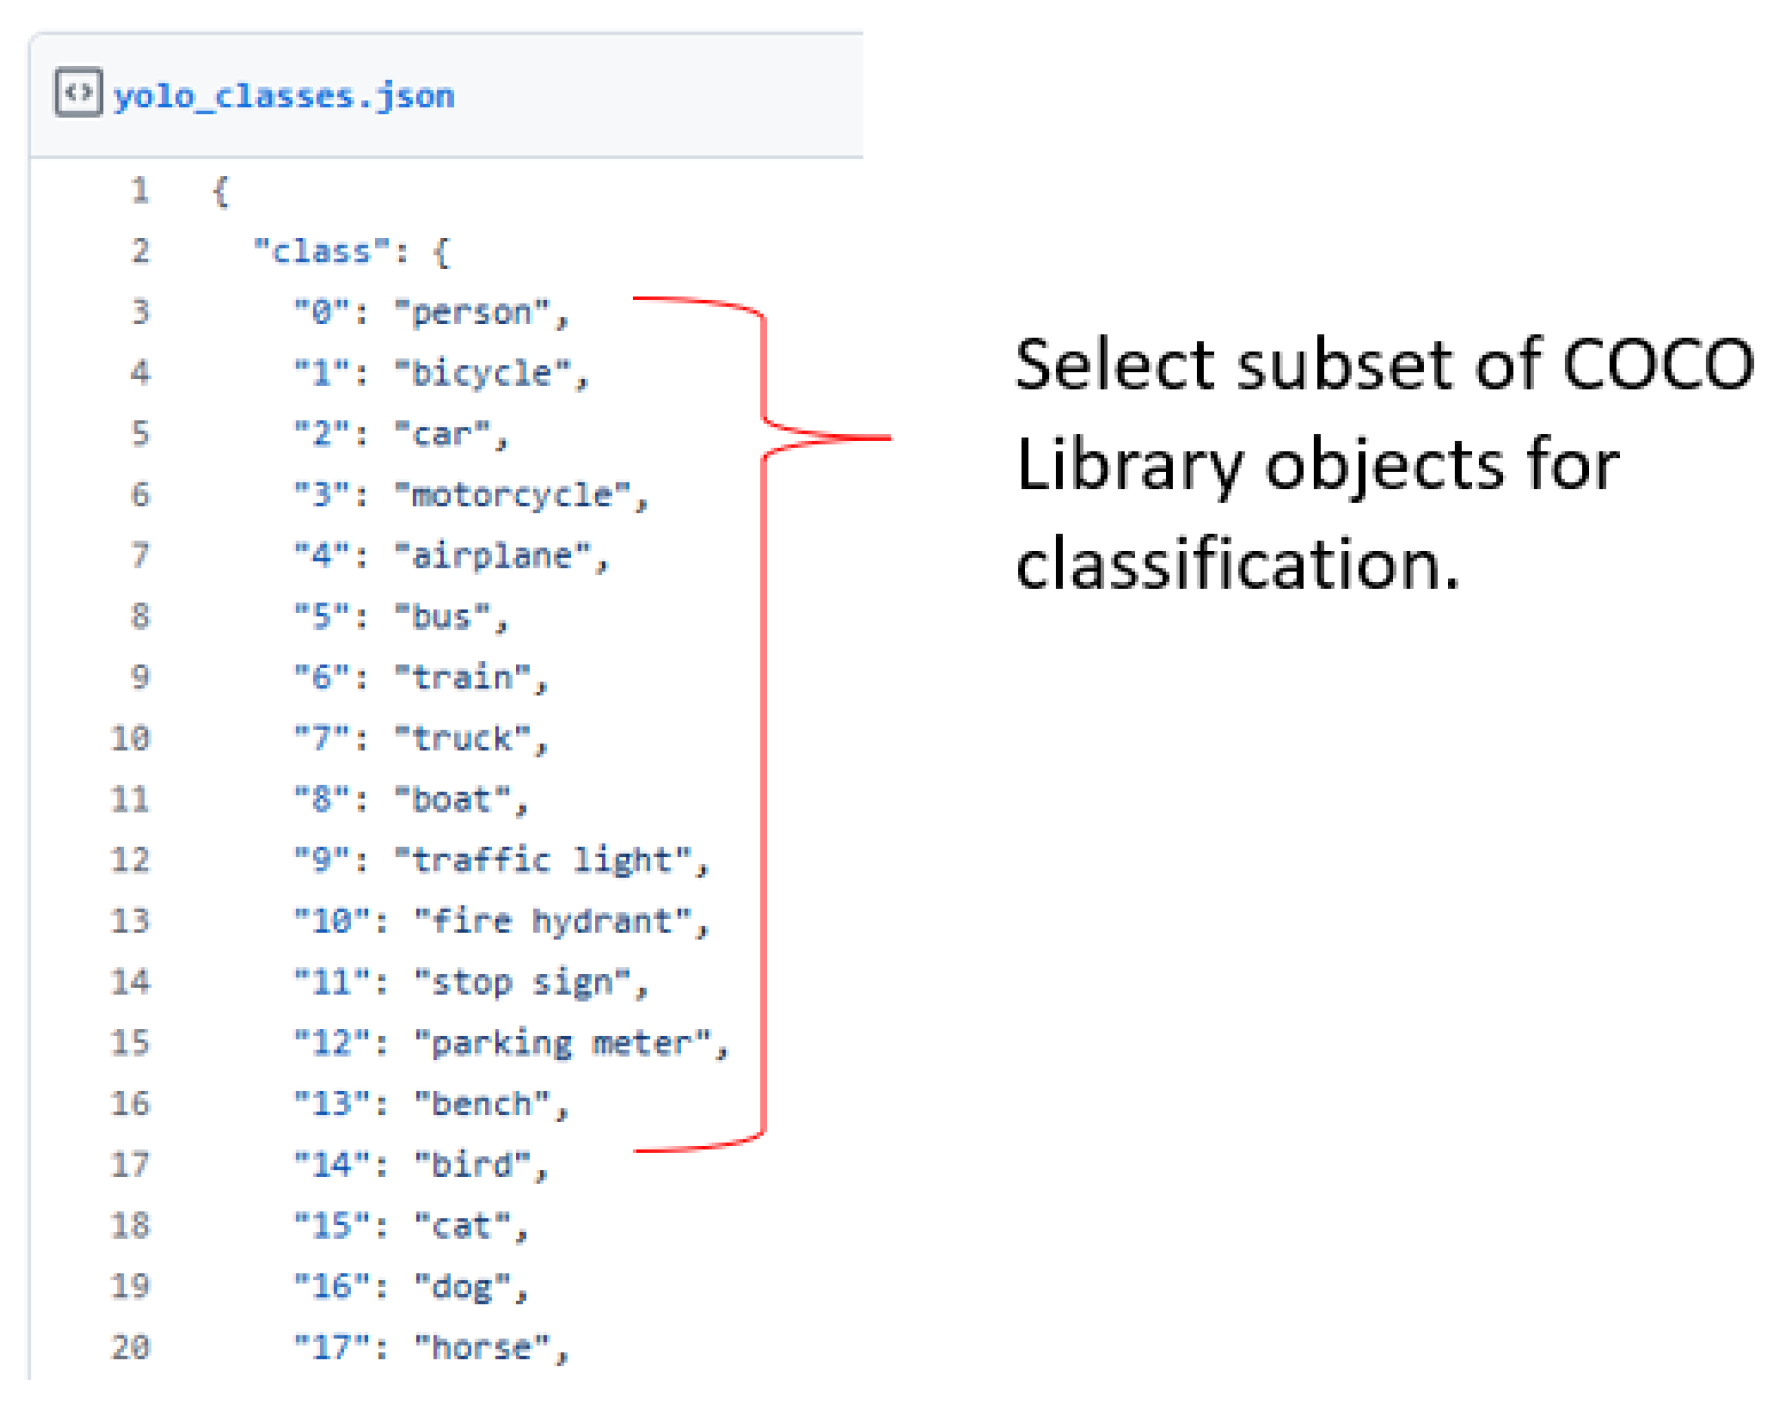
A subset of objects from the COCO dataset was selected to enhance situational awareness during navigation, targeting relevant environmental features for ETA applications. Figure 9 shows the selected classification categories.
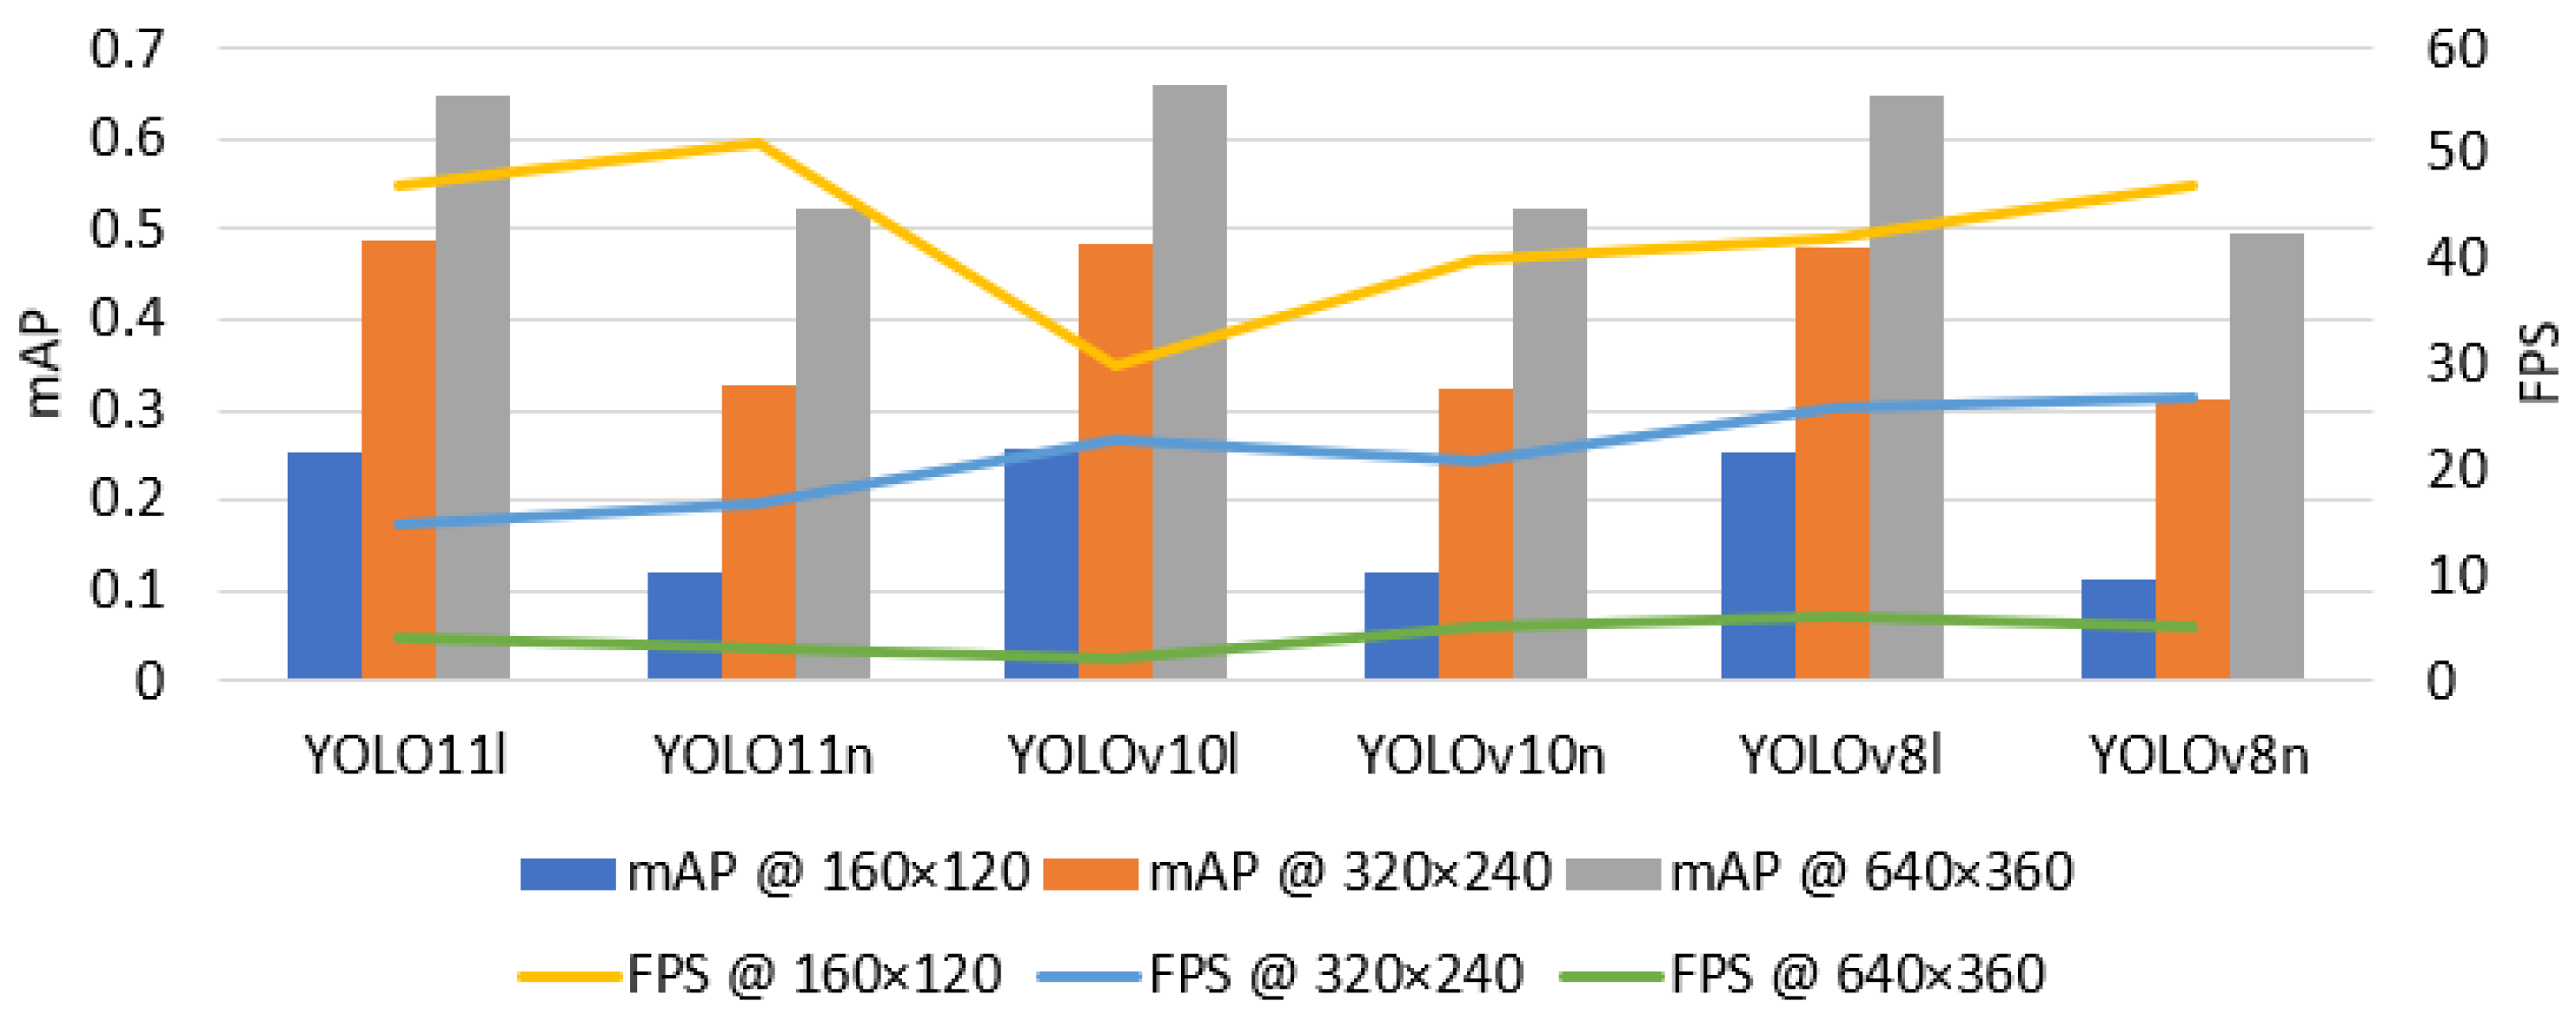
A fifteen-second evaluation video containing a diverse set of object images was used to test various YOLO Lite and YOLO Nano models. The average mAP and FPS were recorded for each model to assess detection accuracy and inference speed across multiple resolutions. Figure 10 summarizes the experimental findings.
As expected, higher input resolutions yielded improved mAP values due to richer image detail, whereas lower resolutions achieved higher FPS owing to reduced computational load. Among all tested variants, YOLOv8 Nano achieved the best balance, delivering high real-time performance at 320 × 240 resolution with only a marginal reduction in detection precision. This trade-off between speed and accuracy identifies YOLOv8 Nano as a suitable candidate for integration into compact, low-power ETA systems.

4.3. Belt Node

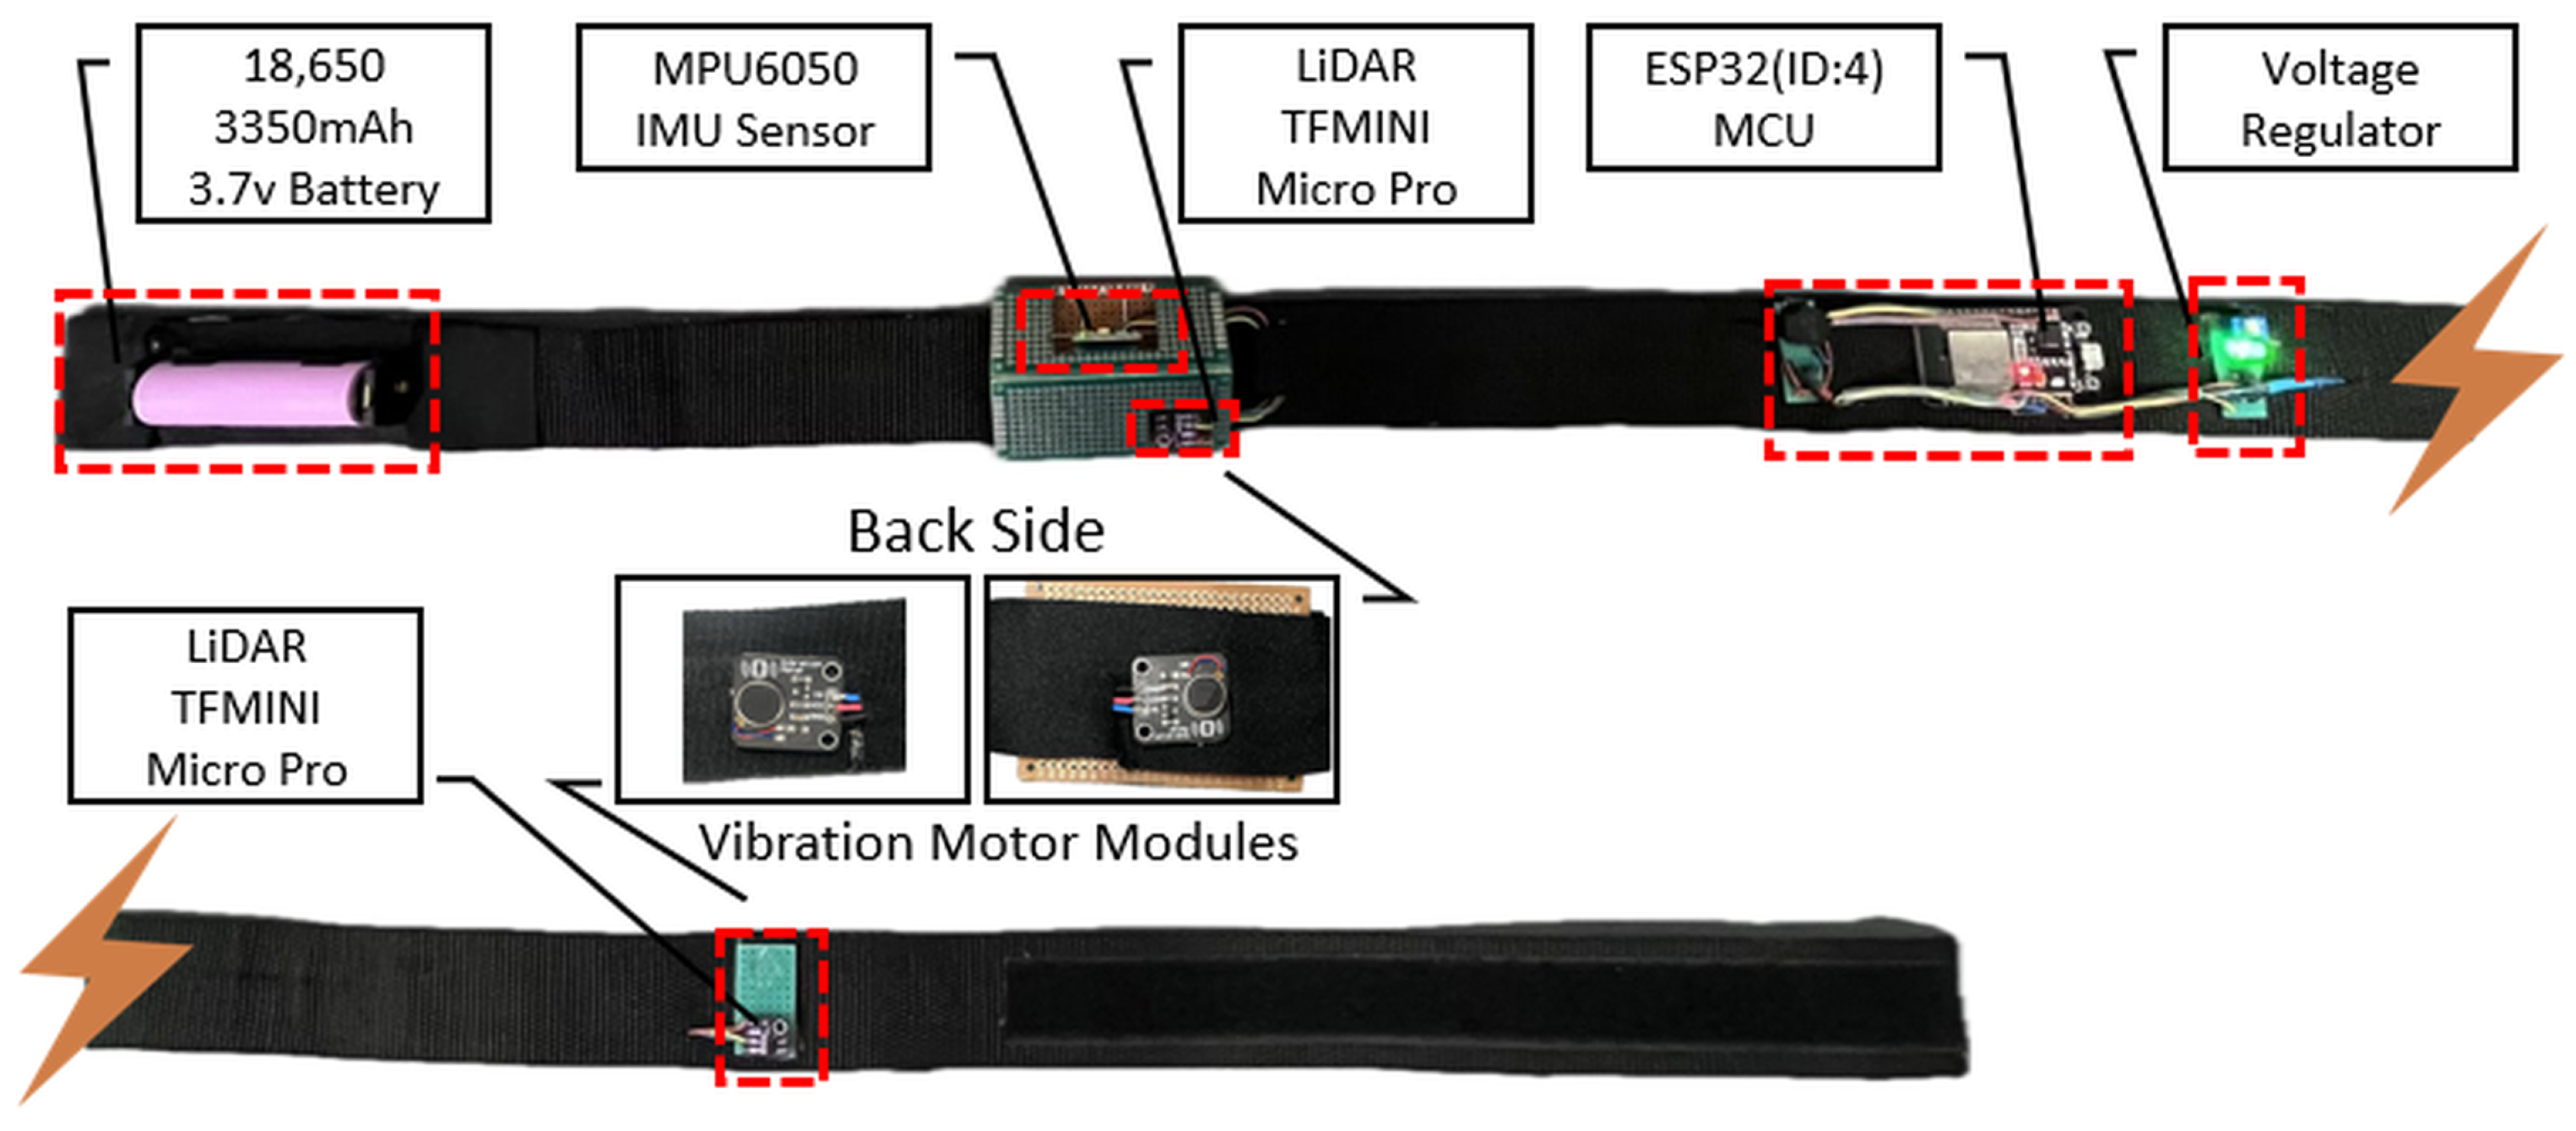
The Belt node is designed to collect environmental data from both the front and rear of the user, enhancing situational awareness and navigation assistance. Its primary input sensor configuration includes two Light Detection and Ranging (LiDAR) TFMINI Micro [66] range sensors, positioned at waist height, enabling accurate distance measurement in both forward and backward directions. To complement this, the secondary input configuration integrates an MPU6050 IMU module, which continuously tracks the user’s orientation and movement by capturing accelerometer and gyroscopic data. For user feedback, the output system consists of two vibration motors embedded on the inner side of the belt, strategically placed at the front and back to deliver intuitive haptic feedback corresponding to detected obstacles or changes in the environment. Figure 11 depicts the hardware configuration for the Belt node.
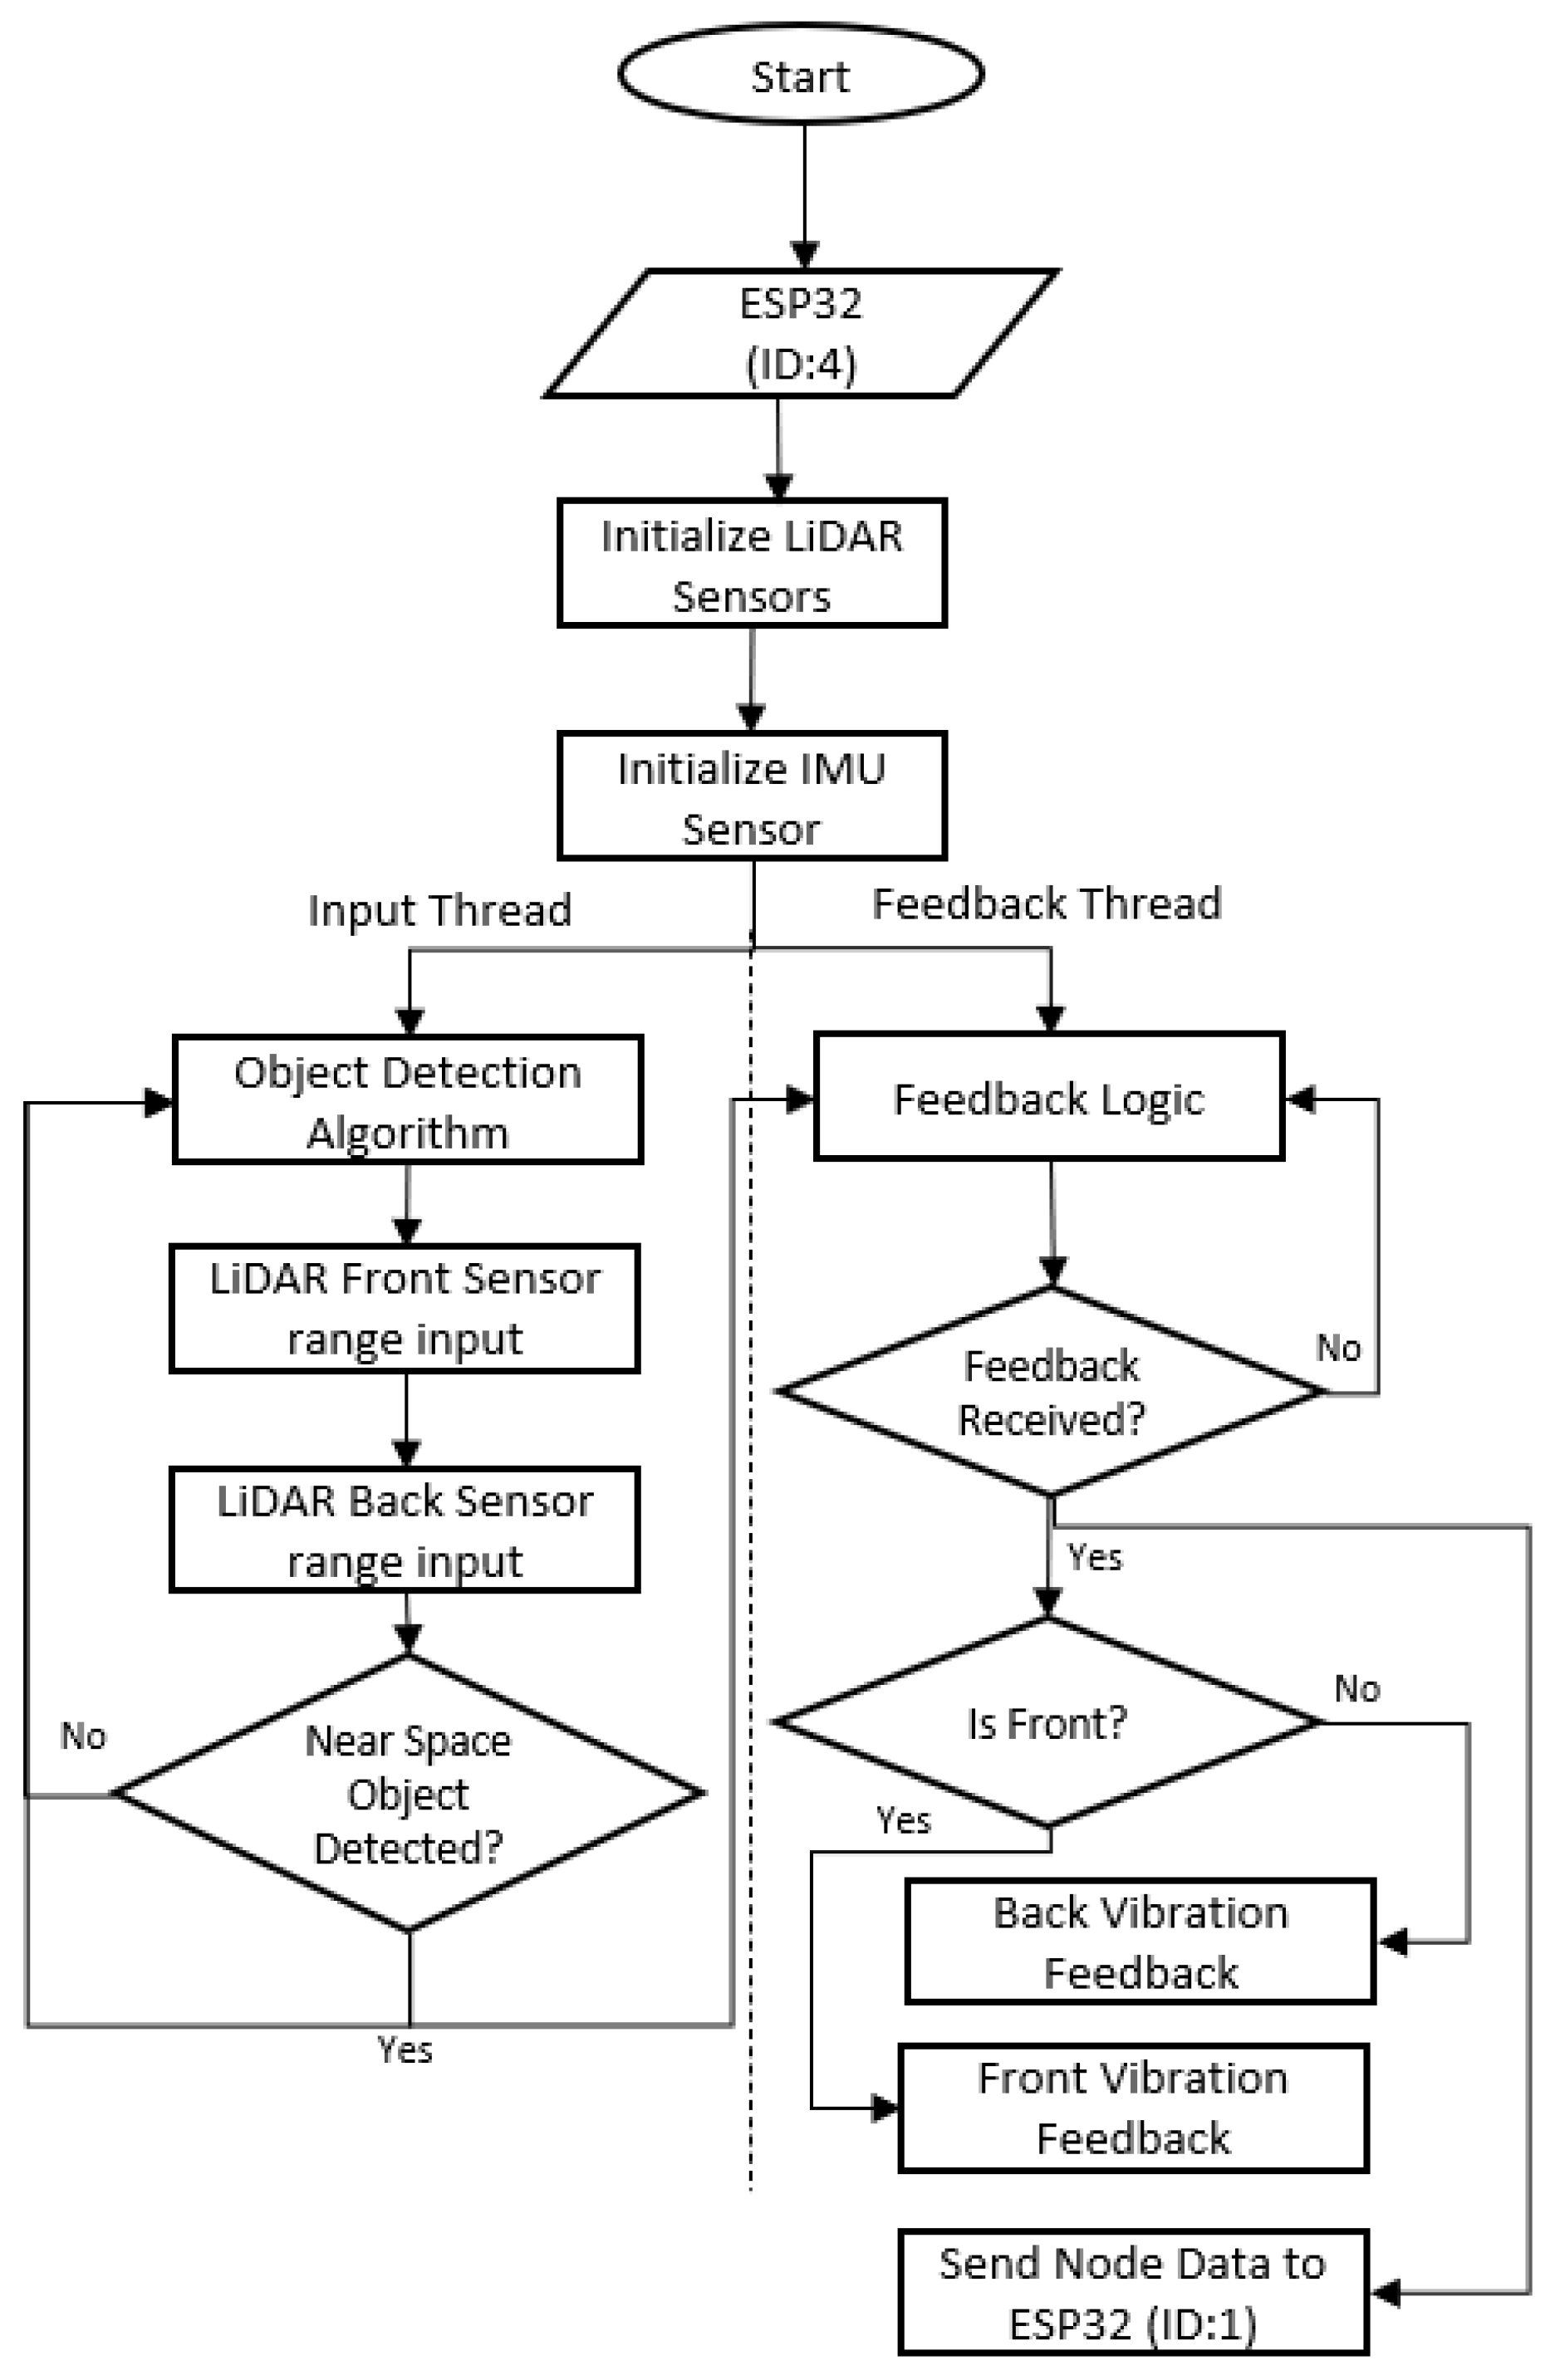
This node employs a single ESP32 MCU and its algorithm logic, shown in Figure 12. The program is divided into two concurrent threads to manage sensing and haptic feedback.

4.4. Cane Node

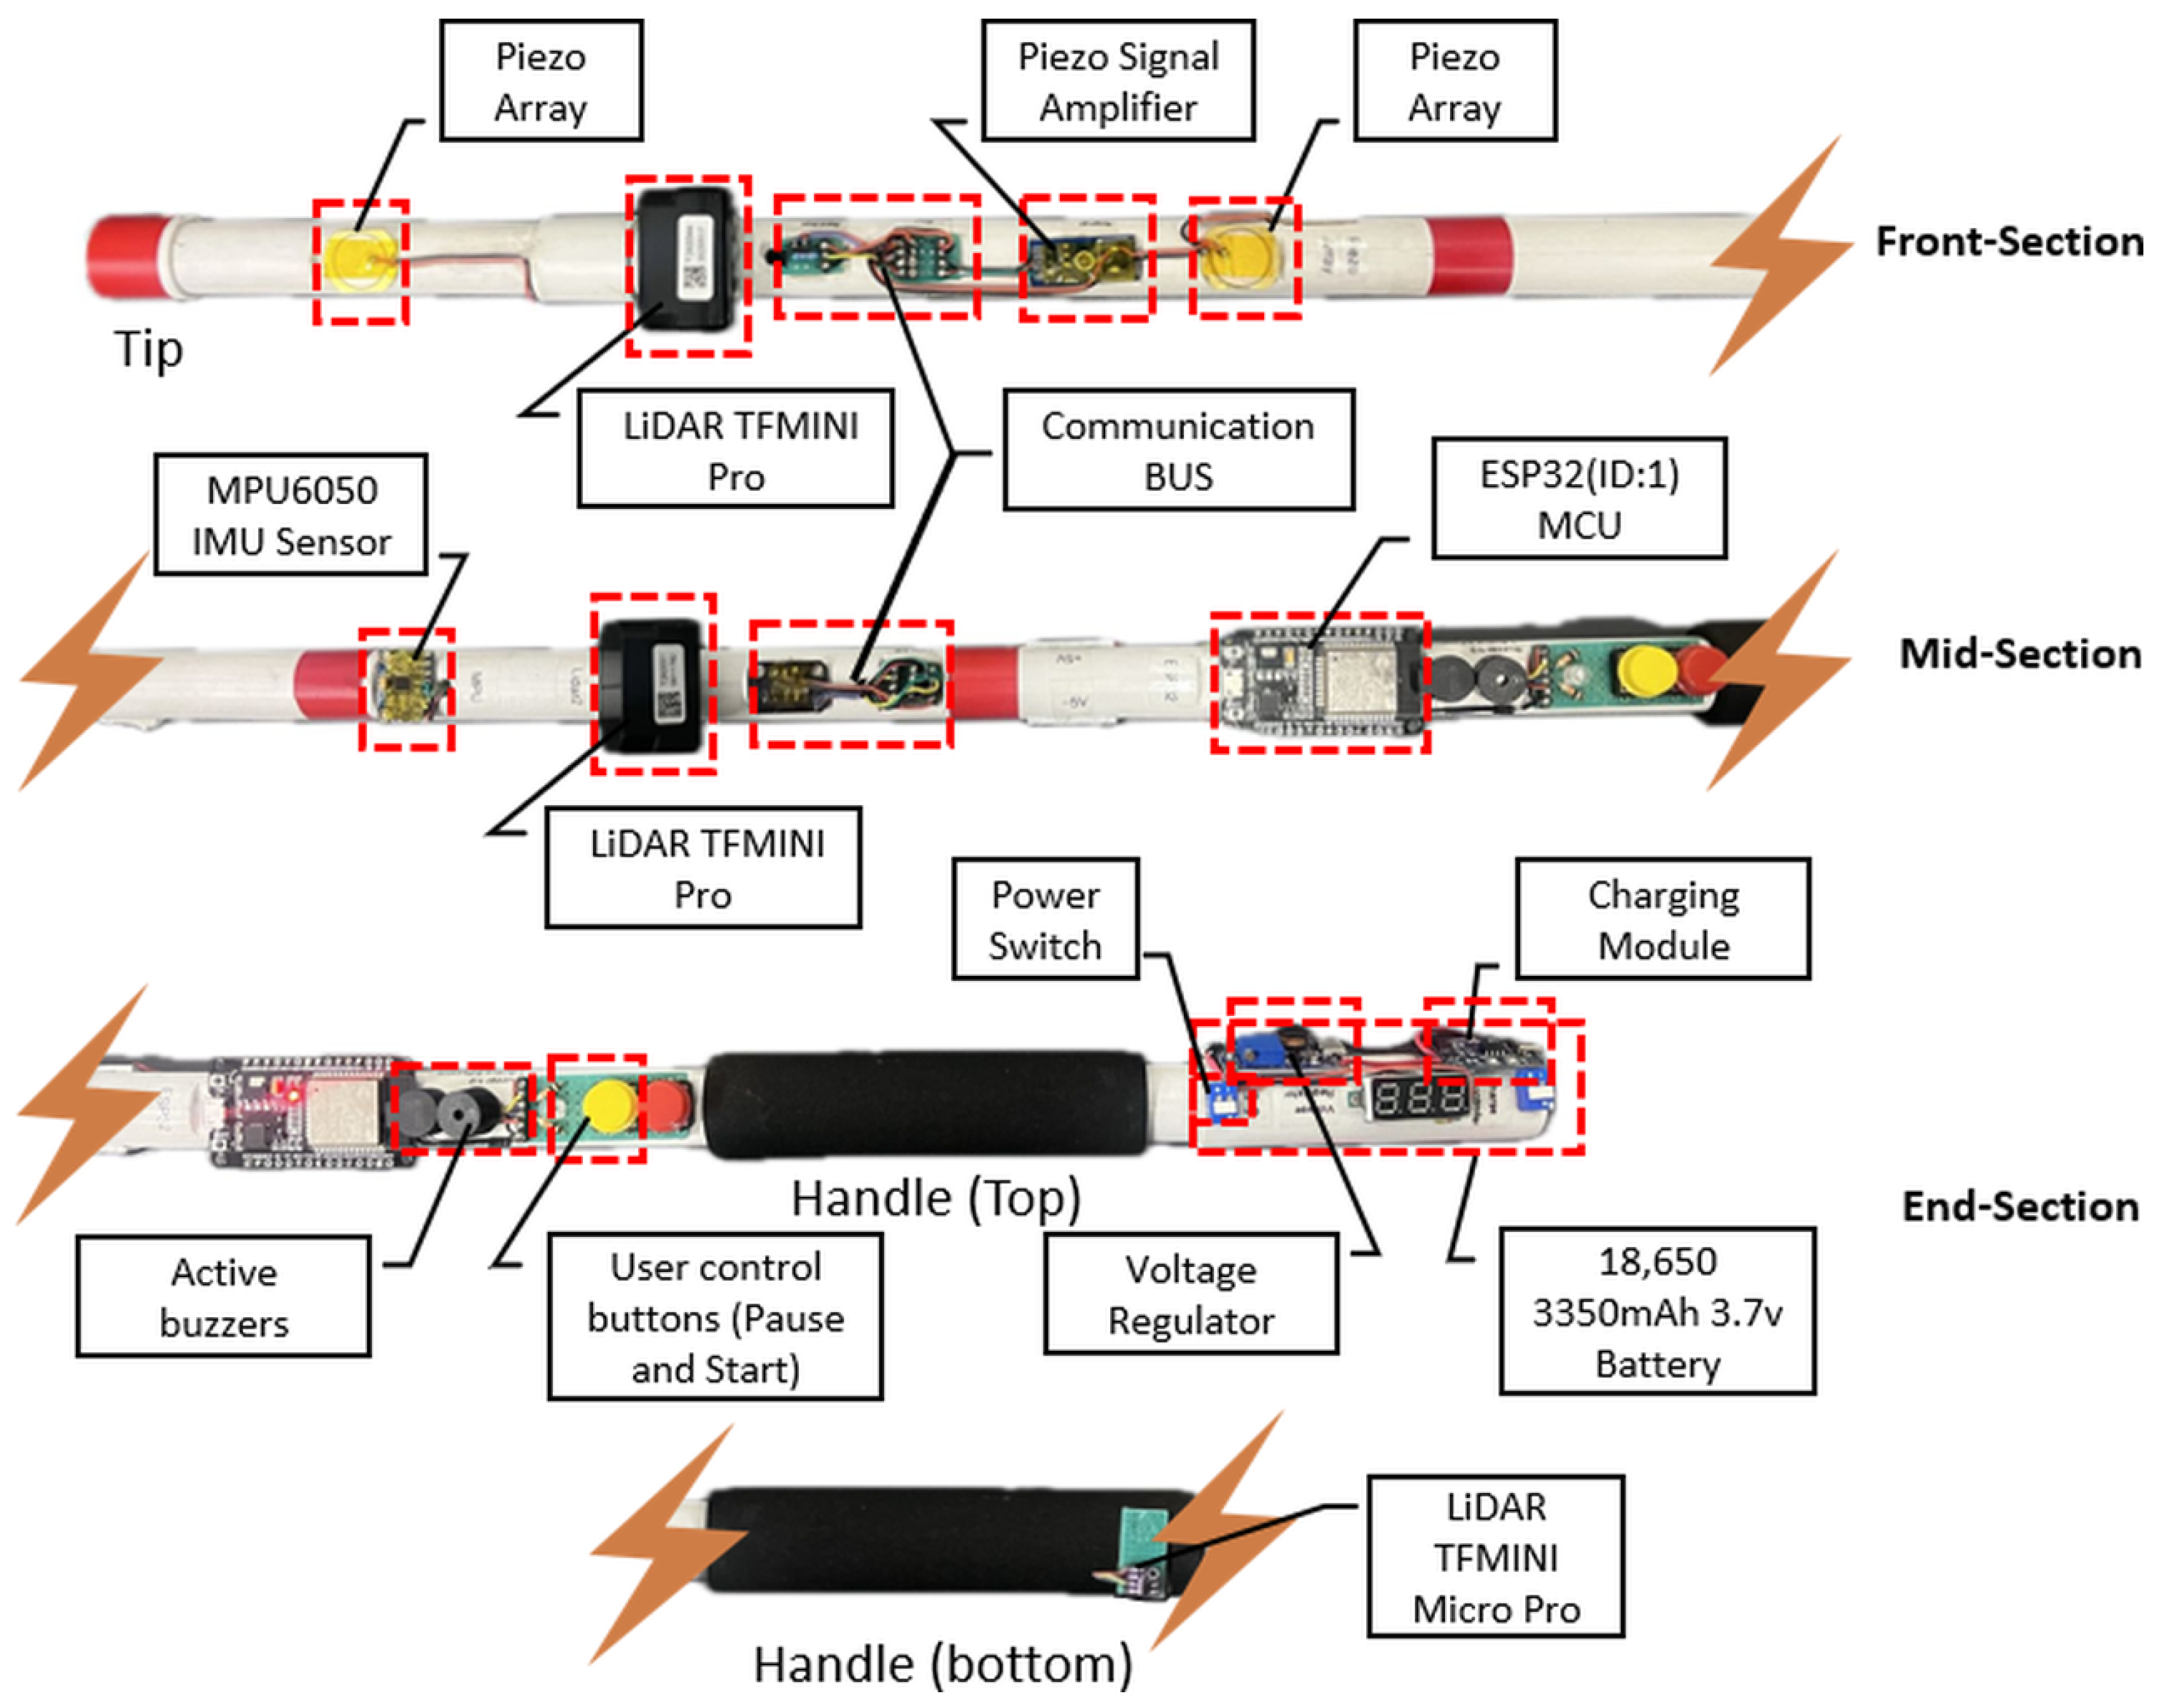
The Cane node is engineered for precise obstacle detection and localization, integrating multiple sensors and feedback mechanisms to enhance user navigation and safety. Its primary input configuration features two TFMINI Pro LiDAR sensors oriented at a 40° angle relative to each other, enabling improved spatial awareness and depth perception through time of flight (ToF) measurements for accurate distance estimation. An MPU6050 IMU sensor is also incorporated to monitor the cane’s orientation and movement, capturing both acceleration and gyroscopic data to support motion tracking. In addition, a TFMINI Micro LiDAR embedded within the cane handle faces downward to measure the ground-to-handle height, enabling direct estimation of floor position when the cane is oriented toward the ground. However, when the cane is angled upward—such as during probing or obstacle negotiation—the downward-facing LiDAR cannot register ground distance; in these cases, geometric height calculations based on the IMU-reported attitude angle are used to estimate obstacle height relative to the user. Together, these complementary methods ensure robust and reliable height estimation across the full range of cane orientations encountered during natural use. Figure 13 illustrates the complete hardware configuration of the Cane node.
By integrating range sensors with orientation data derived from the IMU, the ETA system accurately determines the position of objects relative to the user’s current position within the surrounding environment. This sensor fusion enhances spatial awareness by supporting real-time proxemic mapping of obstacles, thereby facilitating efficient path planning and navigation. Specifically, the ETA determines the height from the ground h of obstacles/objects that the cane is directed towards, which is used to ascertain the nature of the detected feature, i.e., an obstacle ( h is higher than the cane’s elevation from the ground) or a depression, e.g., stairs or a hole ( h is lower than the cane’s elevation from the ground), as well as the horizontal distance b of those obstacles/depressions from the user. This information is then relayed to the user in a usable format. The computation of these values is described in more detail below.
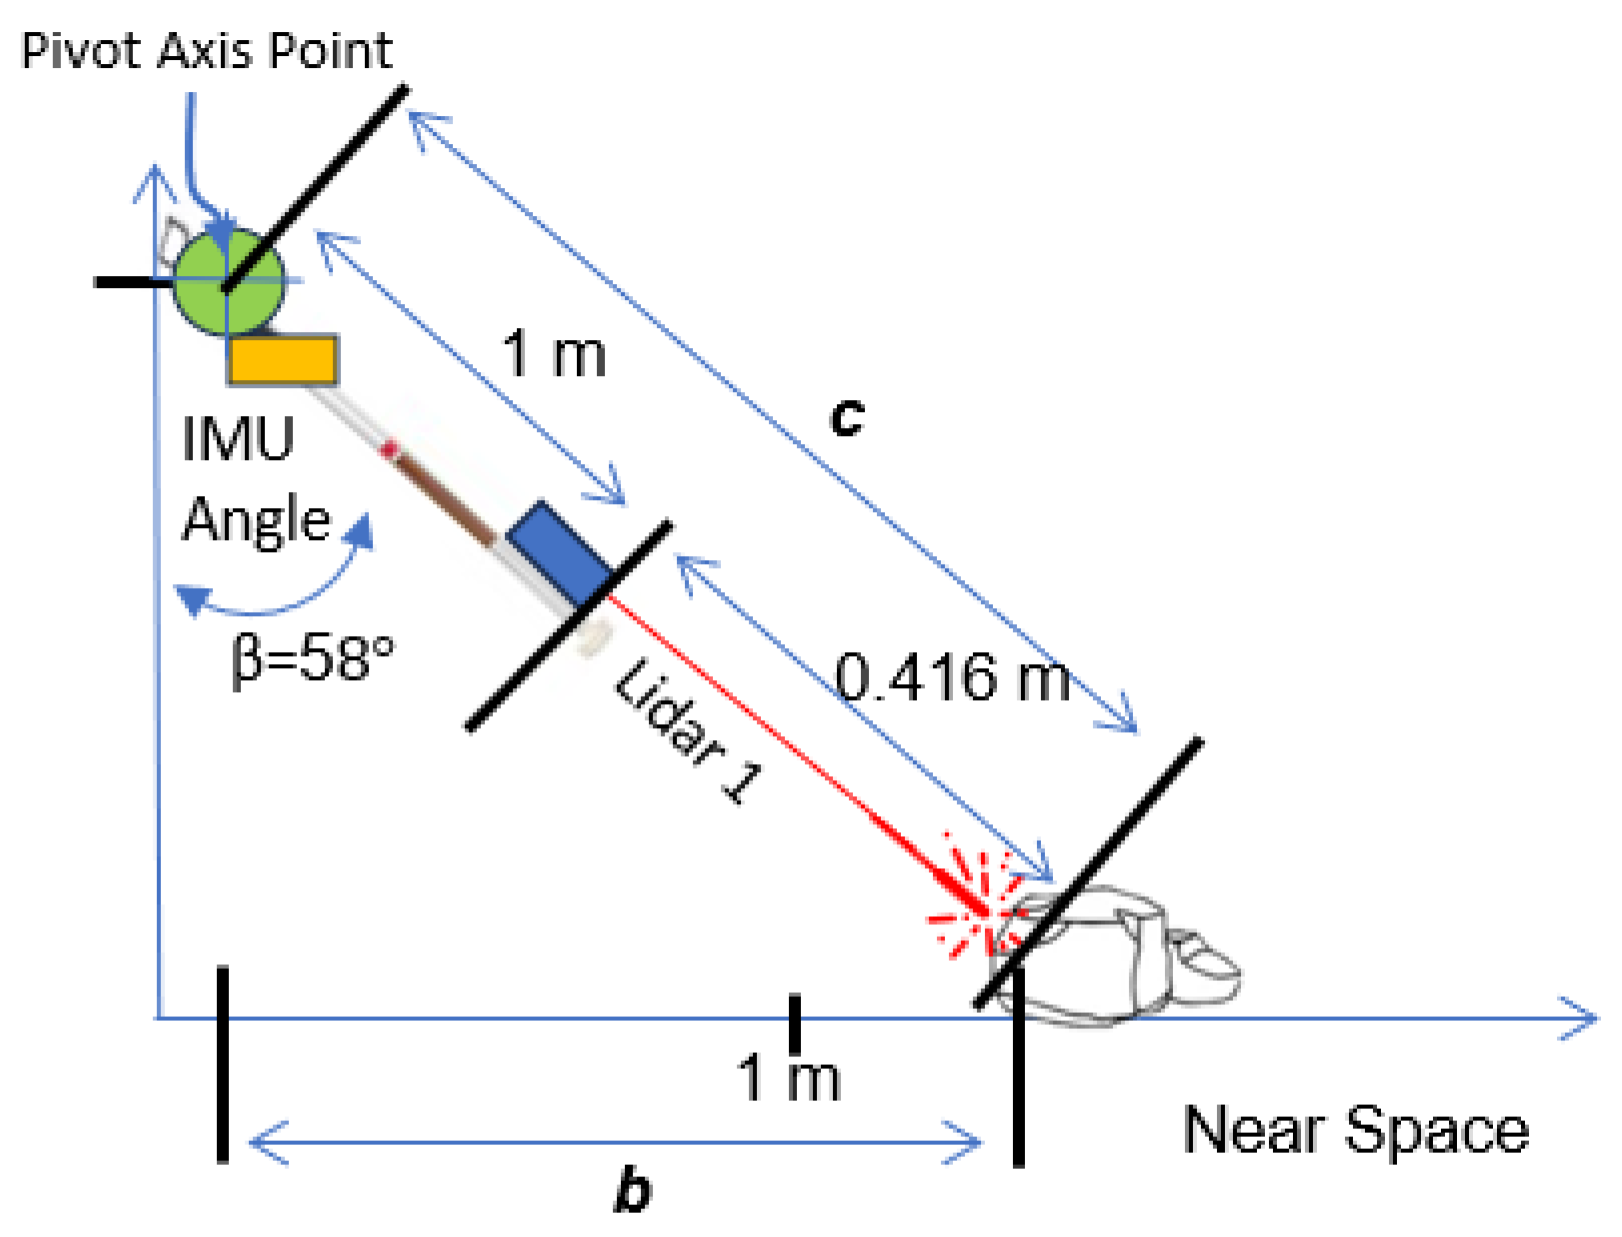
Figure 14 illustrates the process of determining the distance b of an obstacle to the user’s position using sensor readings, specifically, the LiDAR and IMU data, which are combined to localize obstacles relative to the user’s position and orientation.
Referring to Figure 14, the user points the cane at an obstacle. The LiDAR provides a precise reading on the distance of the obstacle to the LiDAR sensor (in this example, 0.416 m). Simultaneously, the IMU captures the attitude angle β of the cane from the vertical axis; in this example, the attitude measurement is β = 58°. While a few different methods of estimating the distance b of the obstacle to the user exist, the following method is used in the proposed ETA.
Given the attitude angle β , the LiDAR range measurement to the obstacle, and the known offset of 1 m between the LiDAR and the Cane pivot axis point, the total distance from the pivot axis point to the obstacle c (i.e., the hypotenuse) can be obtained as
c = 0.416 + 1.000 = 1.416 m .
Trigonometric estimation can then be used to compute the horizontal ground distance b between the user and the obstacle as
b = c · sin ( β ) ,
where
  • c is the total distance from the Cane pivot axis point to the detected obstacle (m);
  • β is the IMU-measured attitude angle relative to the vertical axis (degrees);
  • b is the horizontal ground distance between the user and the detected obstacle (m).
For β = 58 , this yields b = 1.416 sin ( 58 ) 1.20 m .
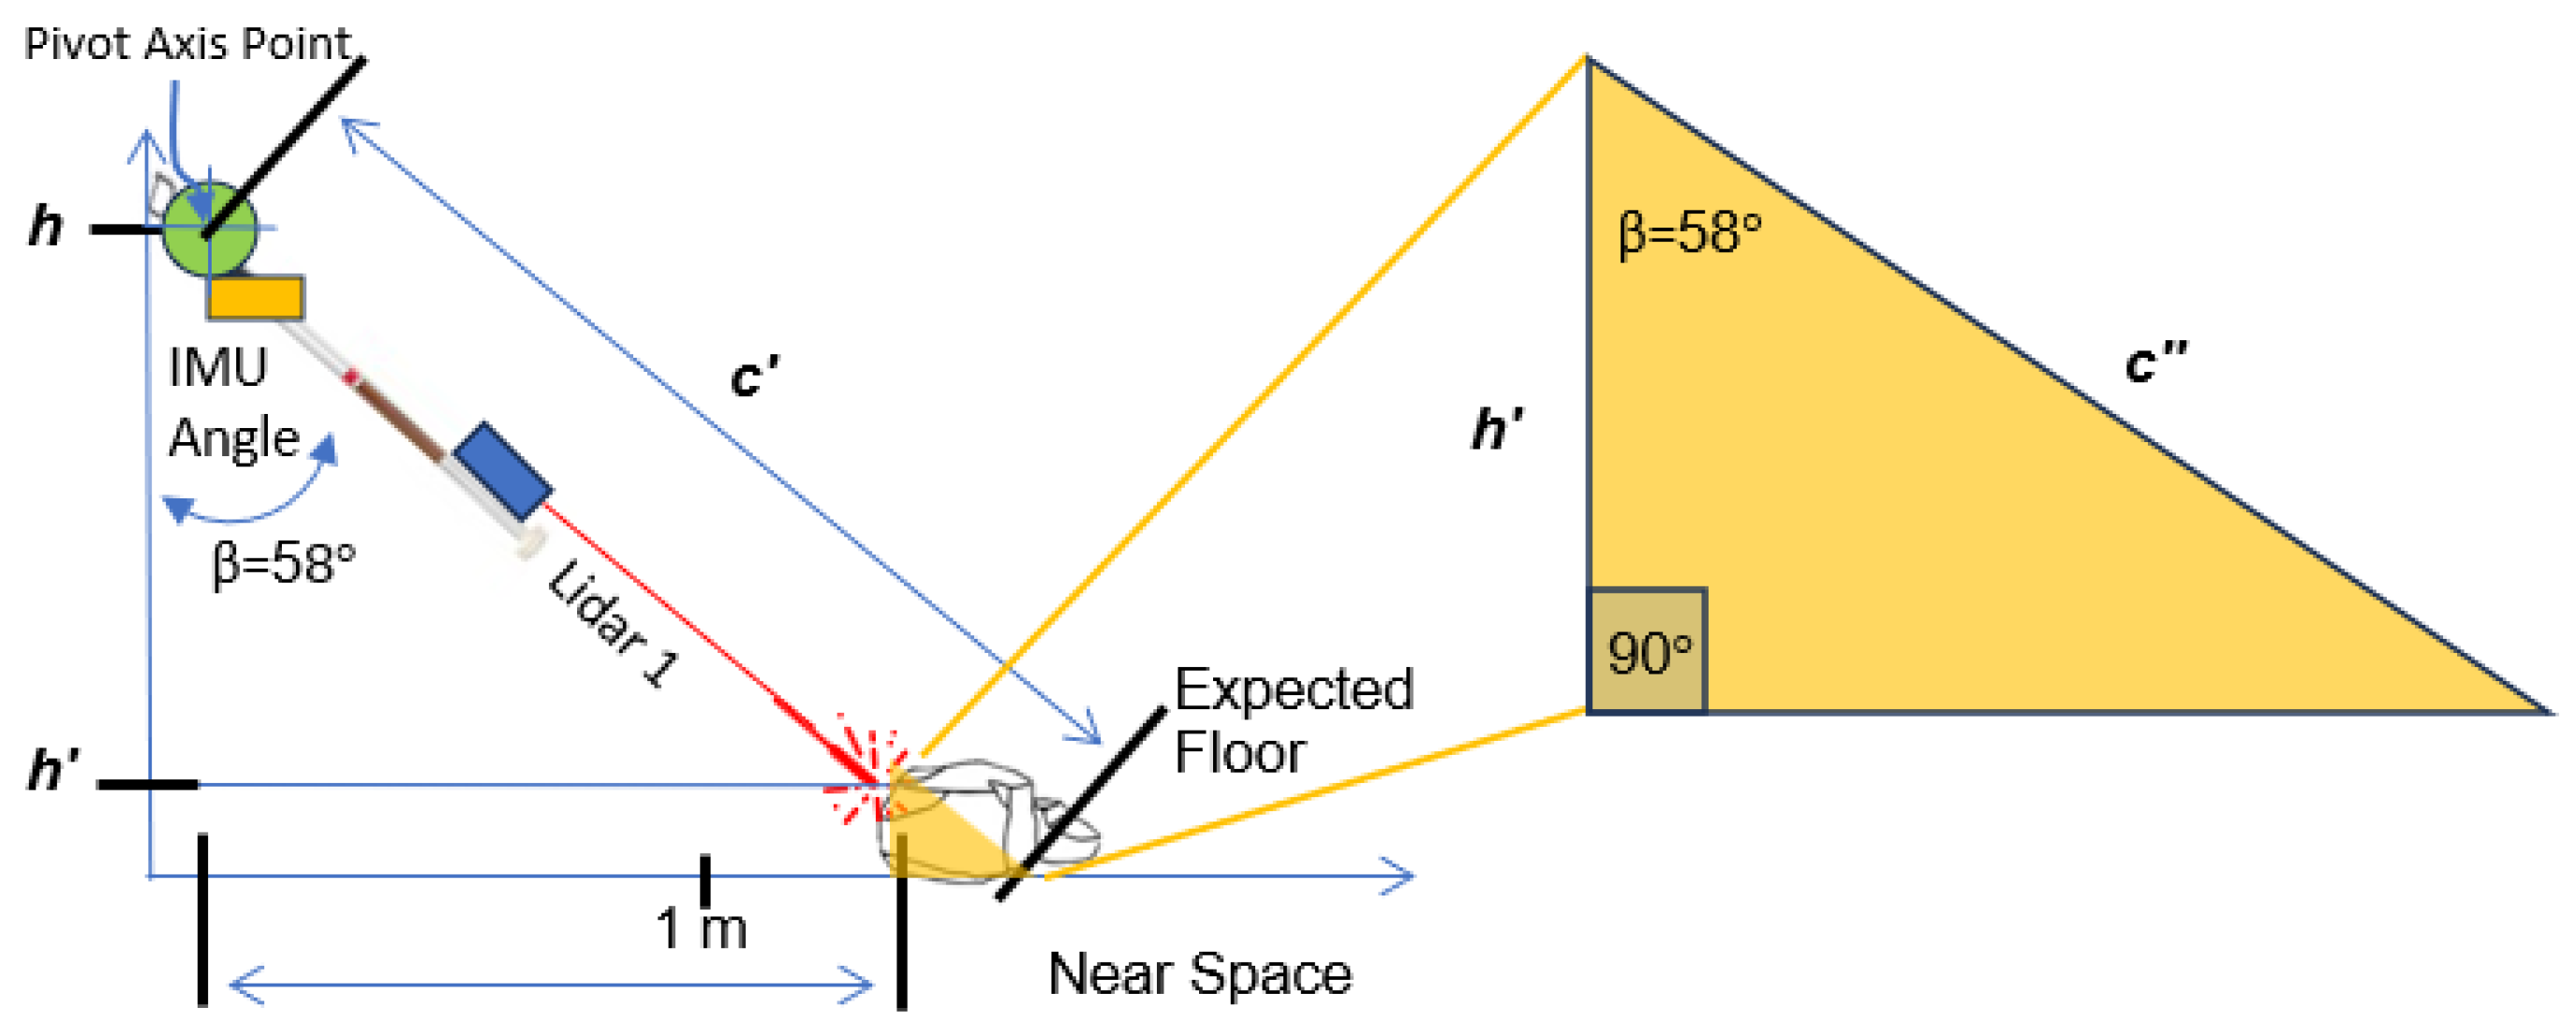
The handle-mounted LiDAR measures the vertical height of the cane pivot axis point; in this case, h = 0.795 m . h is used to compute the expected distance from the pivot axis point to the floor in the direction of the Cane’s axis, denoted as c , depicted in Figure 15 which is a continuation of Figure 14.
Trigonometric estimation is used to compute c as follows:
c = h cos ( β )
where
  • c is the expected distance from the Cane pivot axis point to the ground (m);
  • h is the measured handle-to-ground height (m);
  • β is the IMU-measured attitude angle relative to the vertical axis (degrees).
In the running example, c is computed as c 1.5 m . The height of the detected obstacle from the ground, denoted as h , can now be computed using trigonometric estimation in the smaller triangle highlighted in yellow in Figure 15, noting that c = c c = 0.3 m , as below. In this example, h 0.16 m , which indicates that an obstacle exists.
h = c · cos ( β )
where
  • h is the calculated height of the detected obstacle above the ground (m);
  • c is the difference between the expected distance c and the measured LiDAR distance + the distance between the Cane’s handle and LiDAR sensor c (m);
  • β is the IMU-measured attitude angle relative to the vertical axis (degrees).
Note that the above calculations hold true whether an obstacle or depression is detected, where h > 0 indicates an obstacle or protrusion; h < 0 indicates a depression, such as a hole or stairs; and h 0 indicates no feature of concern detected. This computation provides a real-time geometric estimation of obstacle elevation, forming a ground-level reference for validating LiDAR measurements during dynamic testing and enabling accurate spatial localization within the Cane’s proxemic sensing zone.
This integrated approach enables precise spatial reconstruction of the environment, thereby enhancing navigation accuracy and situational awareness. The output subsystem employs two active buzzers that generate dynamic, non-speech auditory feedback through modulated tones, conveying information about obstacle proximity and height in real time.
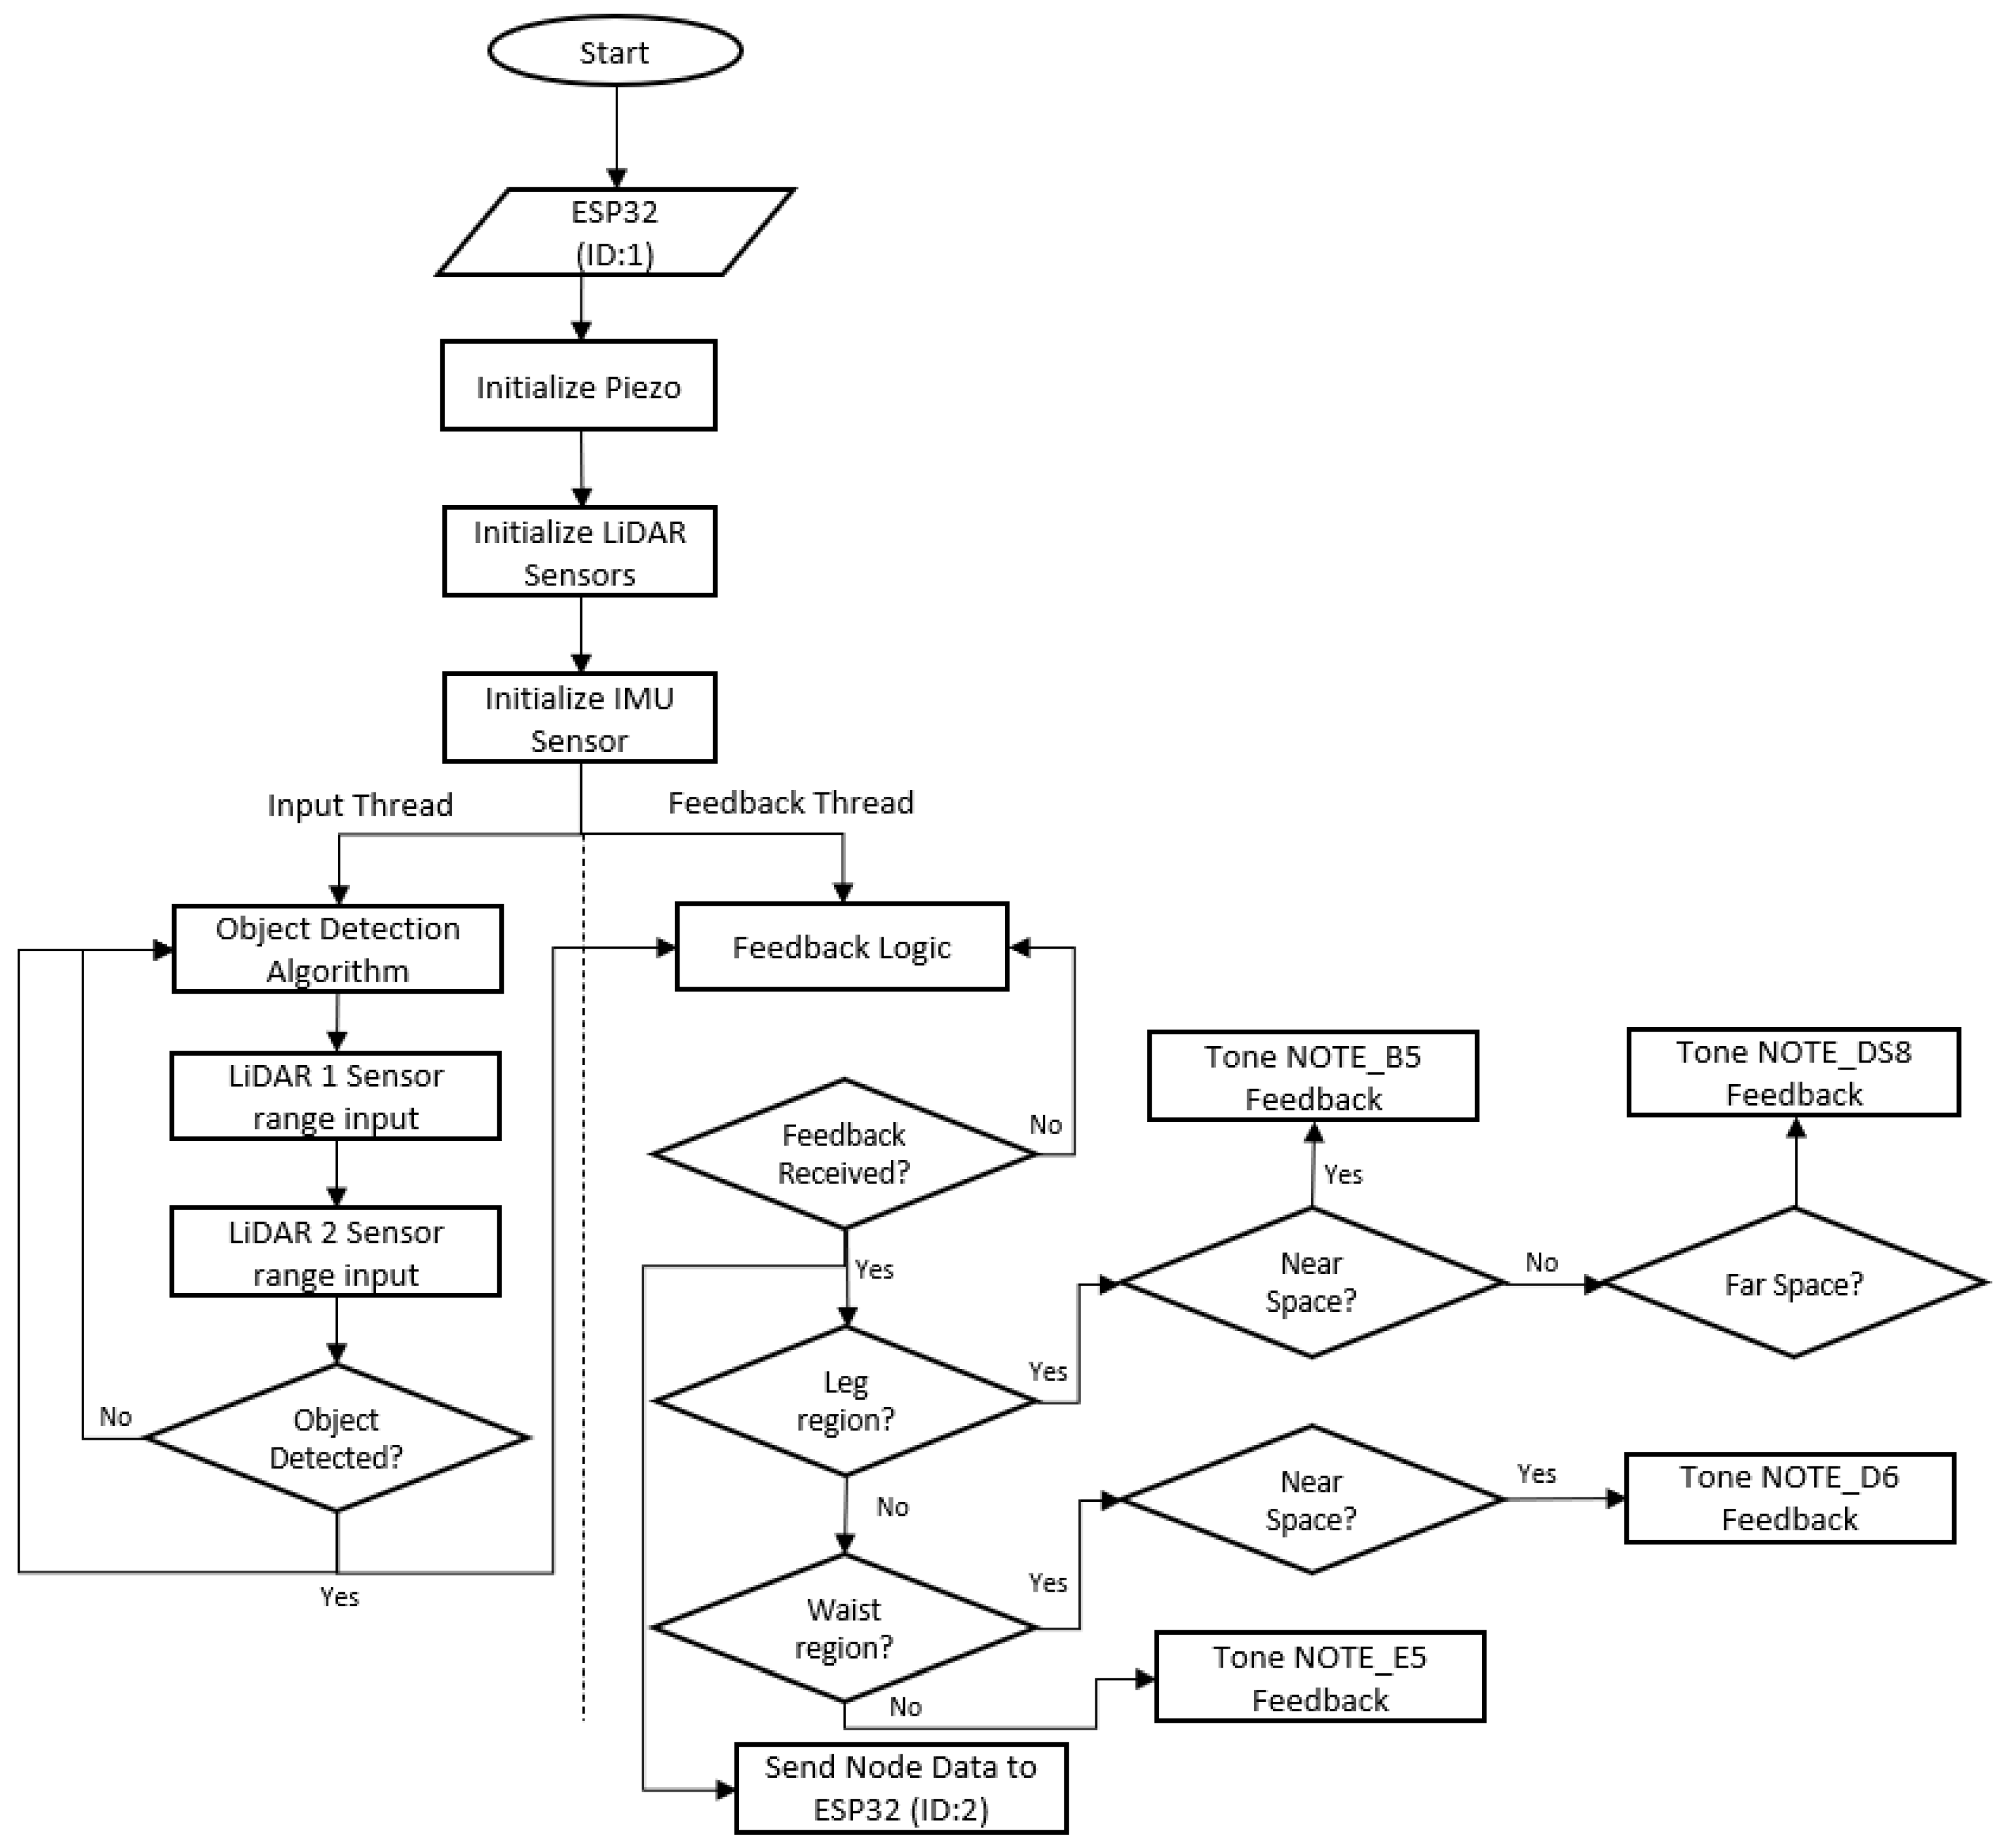
The Cane node is controlled by a single ESP32 microcontroller MCU, and its operational logic is illustrated in Figure 16. The system fuses stereo LiDAR data for obstacle localization and translates spatial measurements into auditory tones that represent both obstacle distance and relative height.
Section 4.5 outlines the sensor plan design for the proposed ETA, grounded in the OM theoretical framework. By aligning sensor placement with established OM principles, it demonstrates how head-, torso-, and ground-mounted sensing modalities achieve comprehensive spatial coverage and ergonomic coherence across proxemic zones.

4.5. Input Sensor Plan Design

The first step in developing a sensor deployment strategy is to define key coverage zones around the user, representing critical regions for environmental data acquisition. Clear delineation of these zones ensures comprehensive monitoring, minimizes blind spots, and supports reliable environmental interpretation. Following OM spatial framing principles and gaps in current designs outline in Section 2, the sensor configuration is structured to cover all relevant domains for continuous sensing.
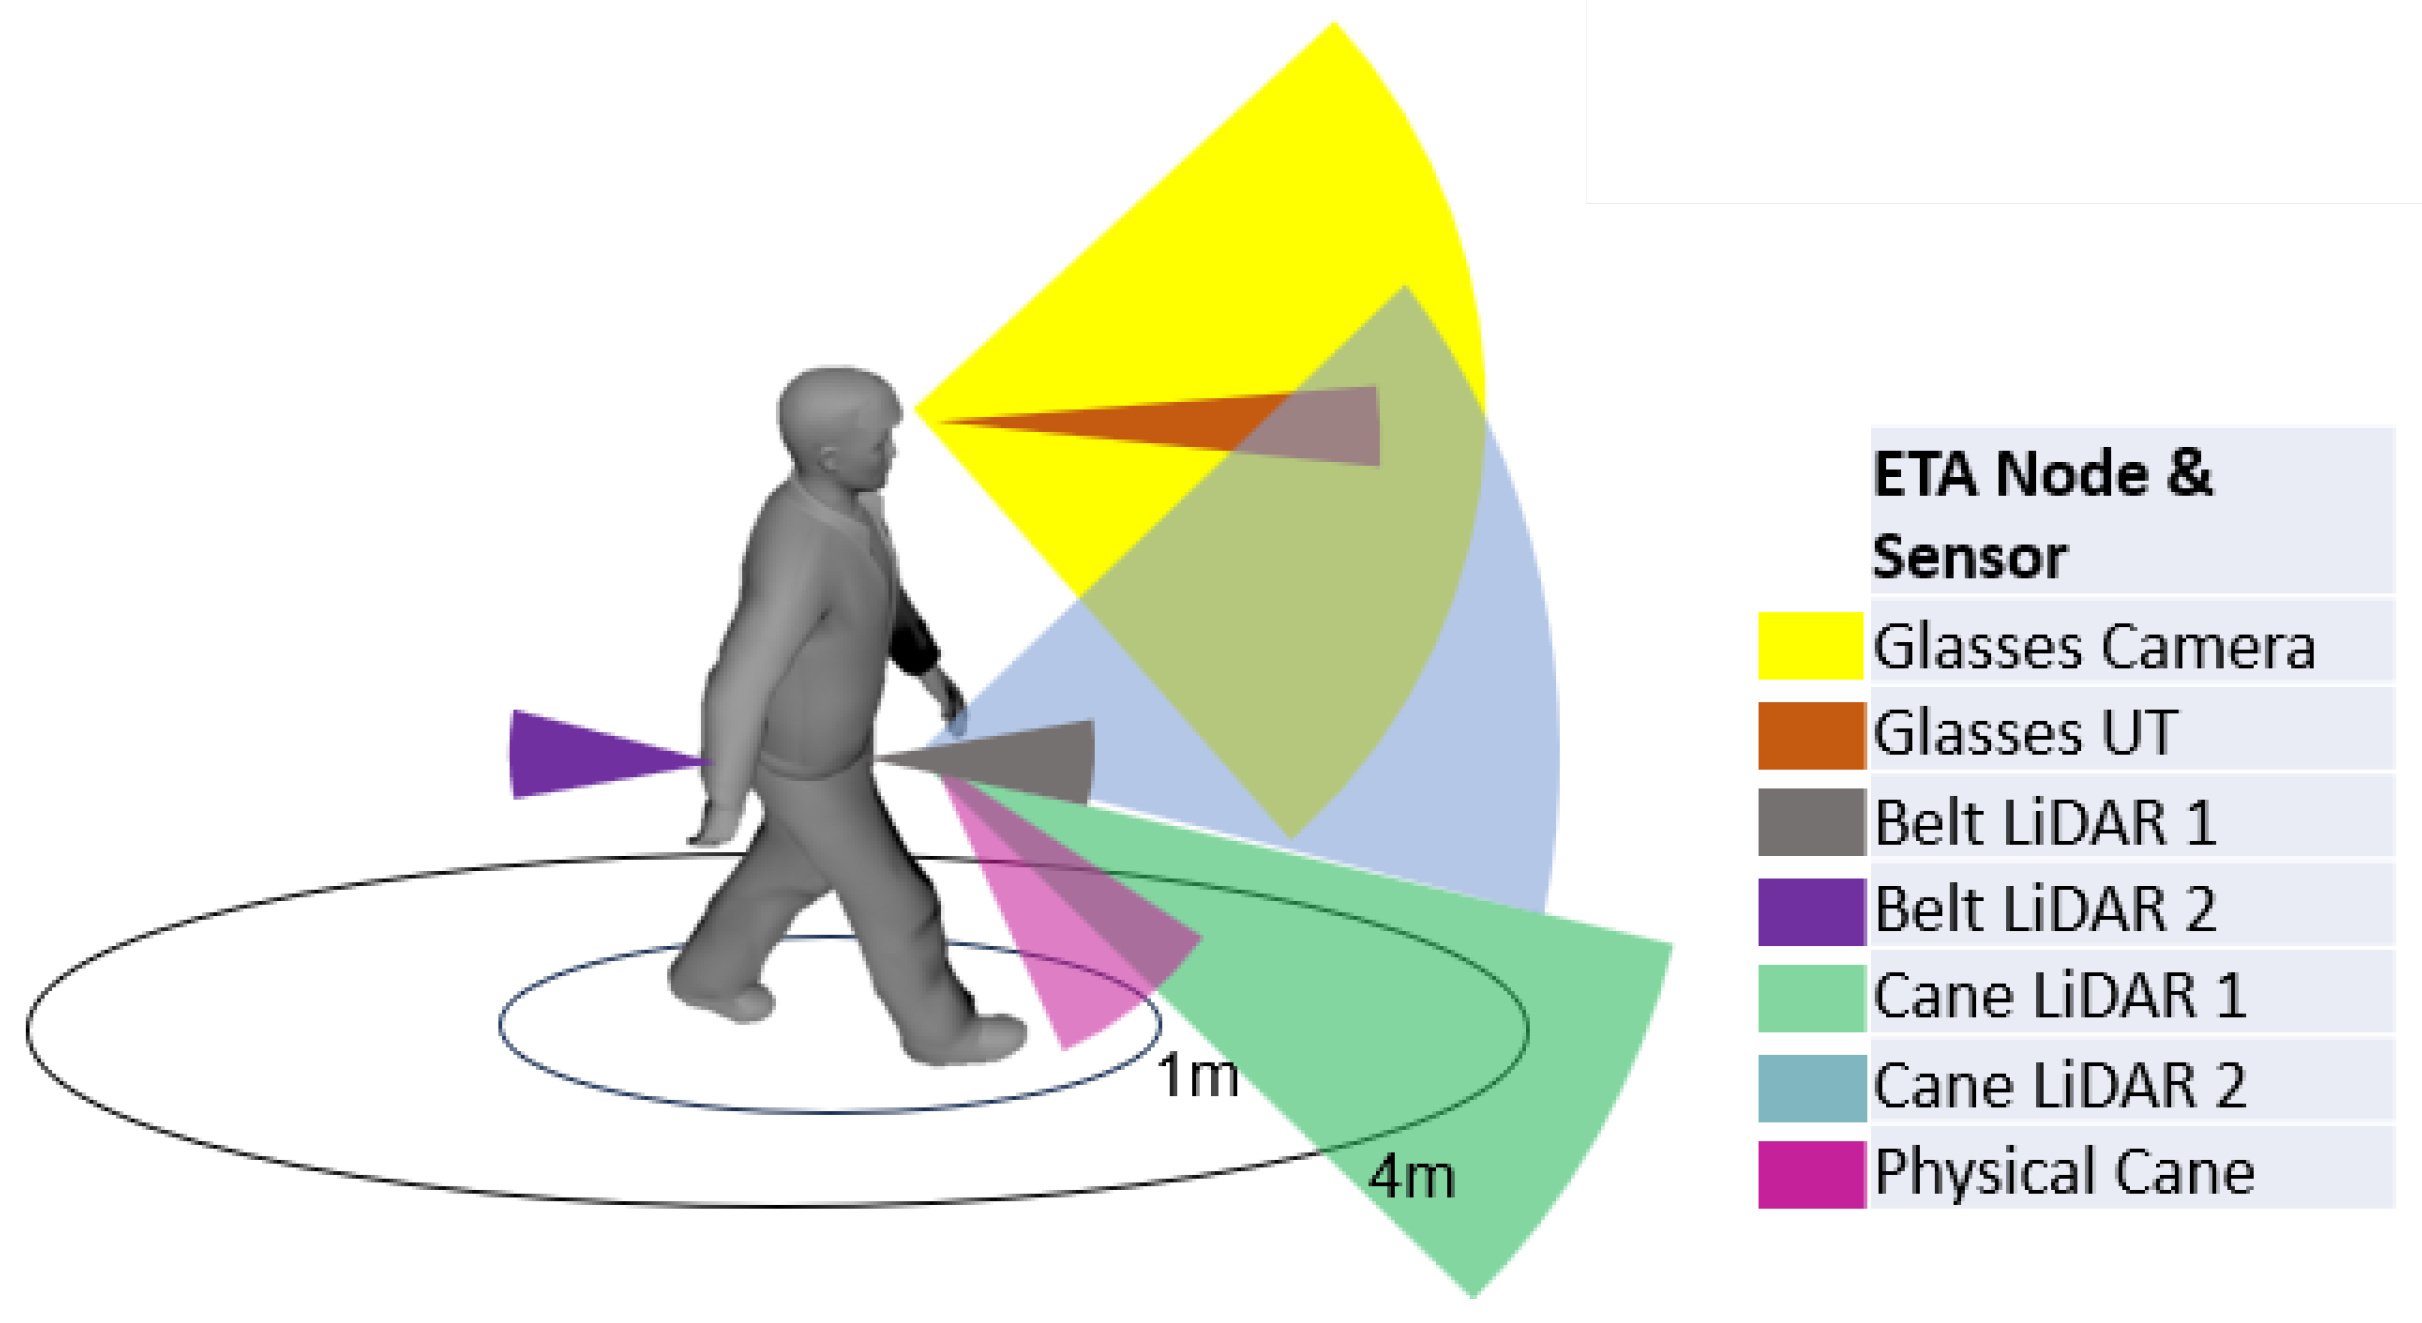
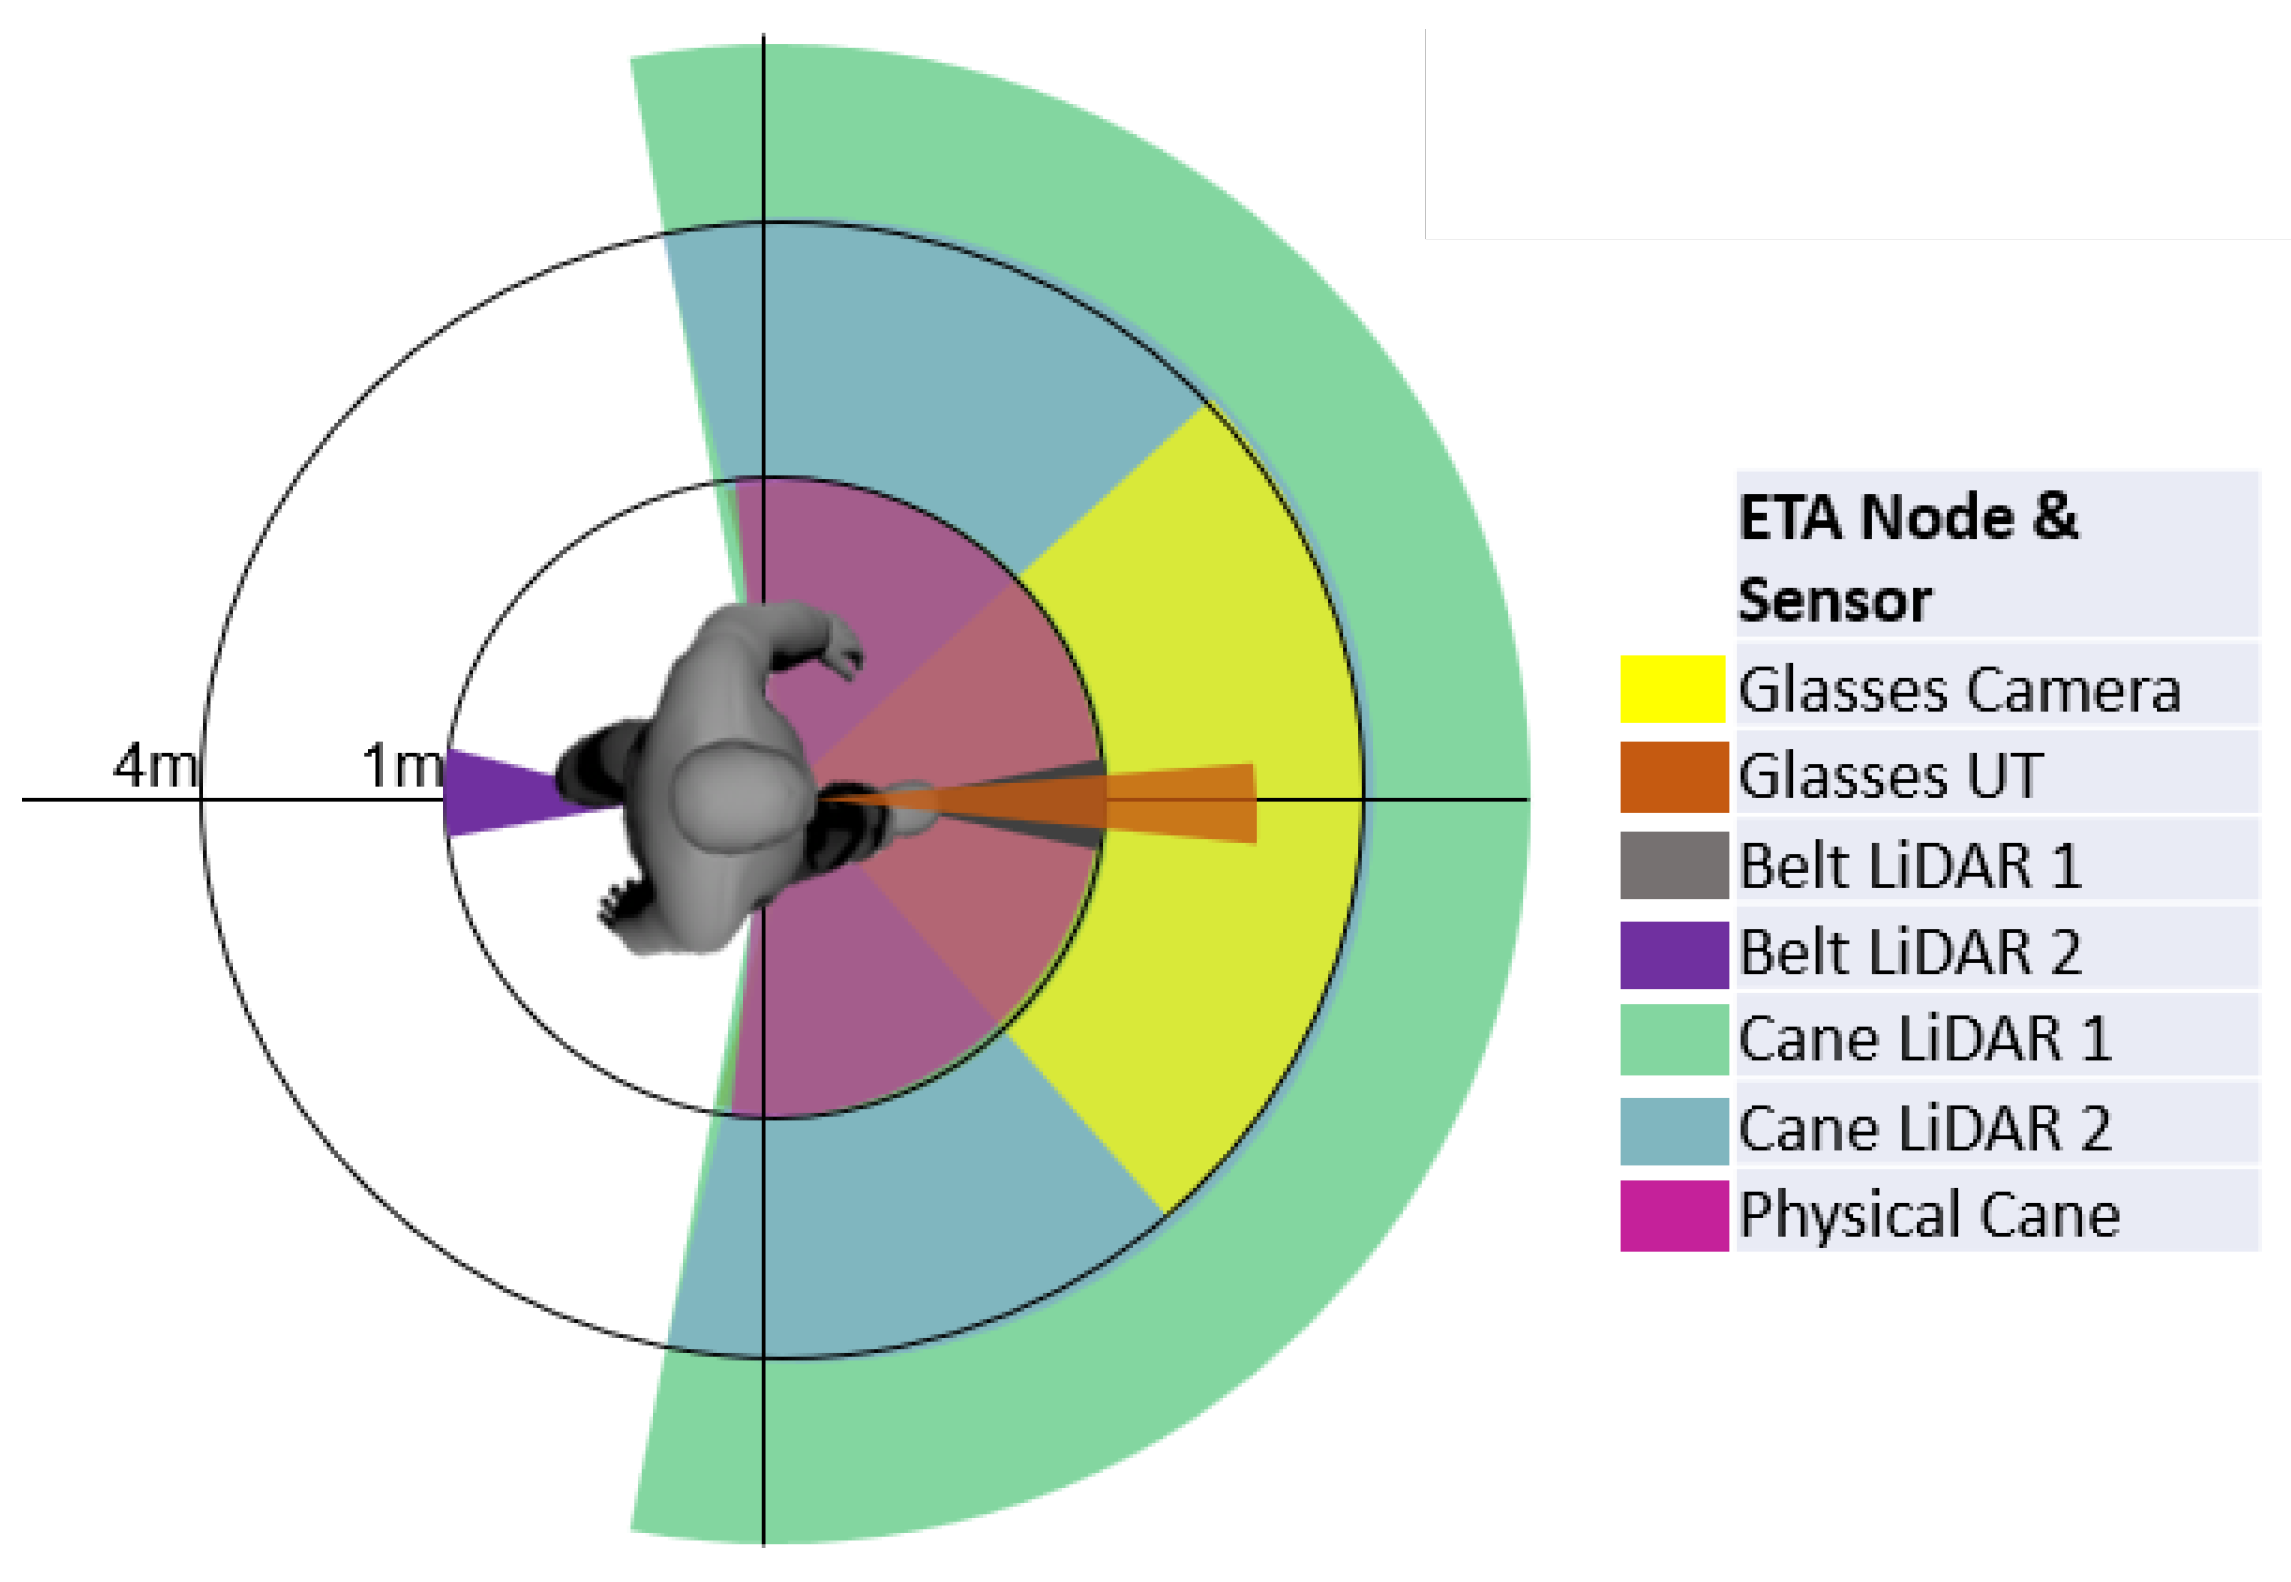
Figure 17 and Figure 18 provide side and top-down views of sensor coverage overlaid on Hall’s [4] model of extra-personal space. This framework categorizes spatial zones around the individual, guiding systematic and informed sensor placement.
Given the breadth of the spatial regions of interest, it is evident that a single sensor configuration from one vantage point is insufficient to gather the necessary environmental information for safe navigation. Consequently, an effective ETA solution must incorporate multiple sensor modalities strategically distributed across different regions of the body to ensure comprehensive and reliable spatial awareness.
For comprehensive spatial coverage, the user’s horizontal plane is segmented into three regions of interest: head, torso, and legs. Sensors are strategically allocated across these zones through the Glasses, Belt, and Cane platforms, each offering targeted perception within its respective domain as defined by Hall’s proxemic spatial framework. Each input sensor is deliberately confined to its designated spatial zone to ensure systematic coverage and minimize sensory redundancy. Constraining detection ranges helps prevent feedback overload and aligns input modalities with the perceptual strategies emphasized in OM training for individuals with VI. This spatially structured configuration enhances obstacle detection, situational awareness, and navigational efficiency while maintaining ergonomic comfort and overall usability.
Figure 19 and Figure 20 illustrate the overlapping fields of view across the designated nodes aligned with the aforementioned strategy.
The Glasses node provides head-height, forward-facing detection encompassing both personal and near spatial zones. The Belt node, positioned at waist height, facilitates bidirectional sensing—covering both forward and rear regions within the personal space. Owing to its pendulum-like motion, the Cane node achieves broader coverage across personal to far spaces. Furthermore, the secondary, upward-angled LiDAR module provides overlapping detection across the waist and head-height regions, ensuring continuity between spatial zones.
The next section discusses the ETA user output modalities by exploring the output sensor plan design.

4.6. Output Sensor Deployment

Effective navigation requires feedback that is both timely and comprehensible, conveyed in a clear and intuitive manner that reduces cognitive load while enhancing responsiveness. By ensuring that users can promptly react to obstacles and dynamic environmental changes, the feedback system directly supports both safety and mobility.
Two critical considerations guide the design of the feedback mechanism. First, the method of delivery must not override or obstruct the user’s natural sensory input. For example, using headphones may block out important environmental sounds, such as approaching vehicles or conversations, which are essential for safe navigation. Alternative solutions, such as bone conduction headphones or spatialized audio cues, may, therefore, be considered to preserve situational awareness while still providing necessary feedback.
Second, information from multiple input sensors must be presented in a clear and manageable way to avoid overwhelming the user. An effective feedback system prioritizes critical data, filters out nonessential signals, and delivers information through multi-modal outputs such as haptic, audio, and auditory-speech cues that align with the user’s cognitive and perceptual capacities.
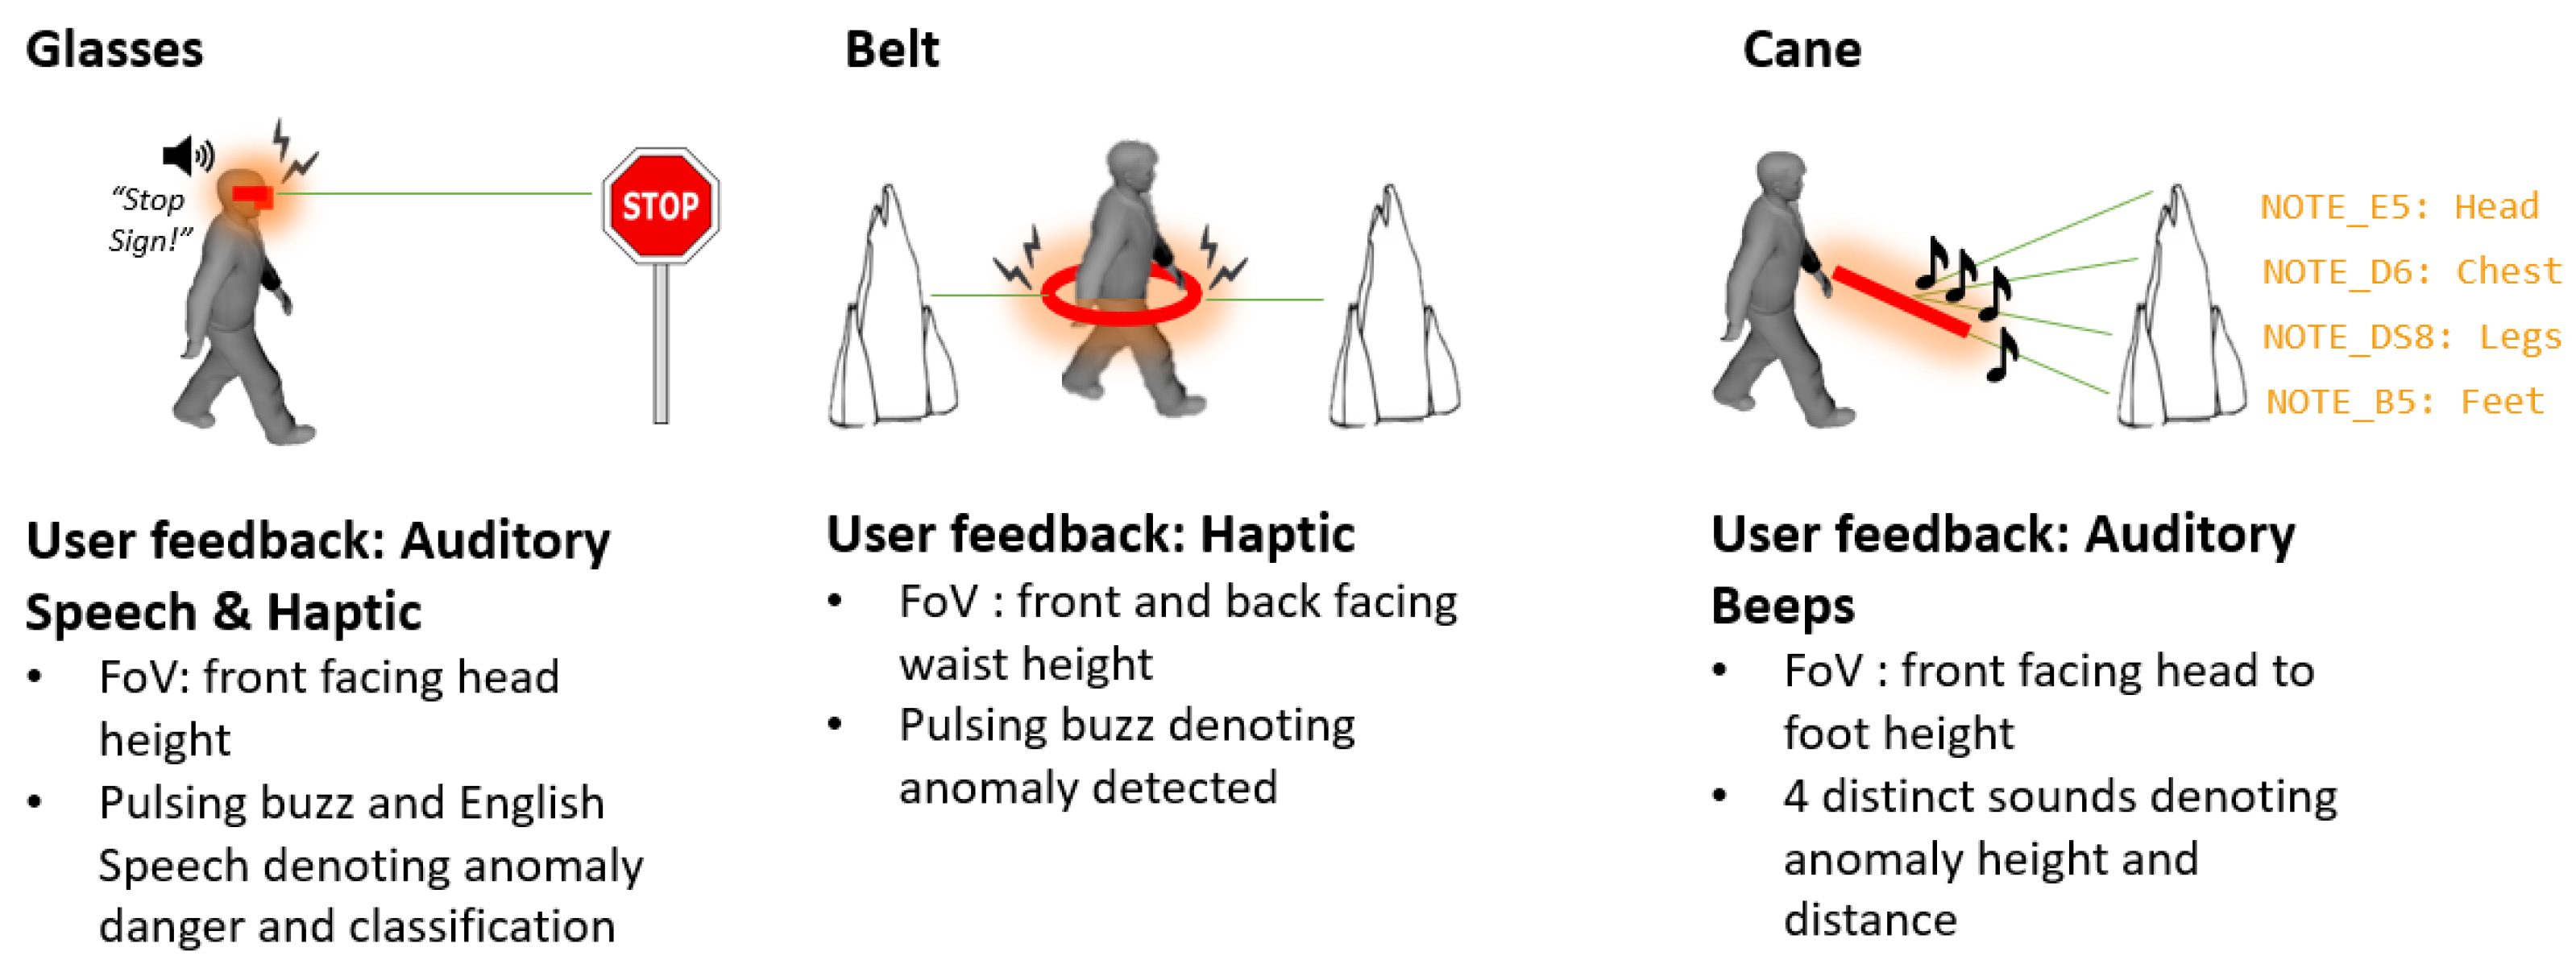
A multi-node ETA design inherently supports this approach by assigning each node a modality suited to its body region. This enables diverse yet complementary feedback strategies tailored to user needs and environmental conditions. Figure 21 illustrates the proposed multi-node, multi-modal configuration.
Each node independently processes and transmits data according to its predefined sensor configuration, ensuring that feedback is localized to the specific site of detection. This distributed architecture enables precise stimulus–response mapping and fosters intuitive spatial correspondence between environmental events and user perception. The Glasses, Belt, and Cane nodes operate autonomously, each providing spatially coherent cues through their respective feedback modalities, as detailed in Section 4.6. Process flow diagrams illustrate the algorithmic pathways through which sensor inputs are interpreted and converted into feedback actions. Specifically, the Glasses node delivers haptic feedback via cheekbone vibrations and auditory cues through a directional speaker; the Belt node provides localized tactile feedback at the waist; and the Cane node with stereo LiDAR sensors with dedicated non-speech tonal alerts.
The deliberate separation of feedback channels across distinct body regions, combined with non-overlapping haptic and auditory modalities, minimizes perceptual interference and enhances cue clarity during navigation. As the sensing ranges of each node are defined according to Hall’s proxemic framework, the feedback and alert prioritization scheme naturally align with these spatial boundaries. Consequently, prioritization is determined by both the spatial proximity of detected obstacles and their relative location with respect to the head (Glasses), torso (Belt), and legs (Cane). Each node, therefore, maintains its own prioritization hierarchy and feedback modality, enabling simultaneous, multi-modal feedback for a rich, context-aware navigation experience. This hierarchical structure prevents sensory overload, preserves situational awareness, and supports a consistent, proxemically grounded feedback experience that mirrors natural human spatial perception.
The Glasses node integrates both haptic and auditory speech feedback. A vibration motor on the arm of the frame delivers tactile alerts through the user’s cheekbone, while a small speaker positioned near the ear provides adjustable-volume speech feedback for object classification. This dual-modality strategy enhances situational awareness without obstructing ambient sounds.
The Belt node delivers directional tactile alerts via vibration motors at the front and rear, pressed against the user’s torso for clear perception. This configuration supports intuitive front–back awareness while remaining discreet and non-intrusive.
The Cane node employs a stereo LiDAR configuration for auditory non-speech feedback. LiDAR sensors at the tip and midsection of the cane deliver distinct tones corresponding to obstacle proximity and height, improving spatial awareness across leg, torso, and head regions.

4.7. Working Prototype Summary

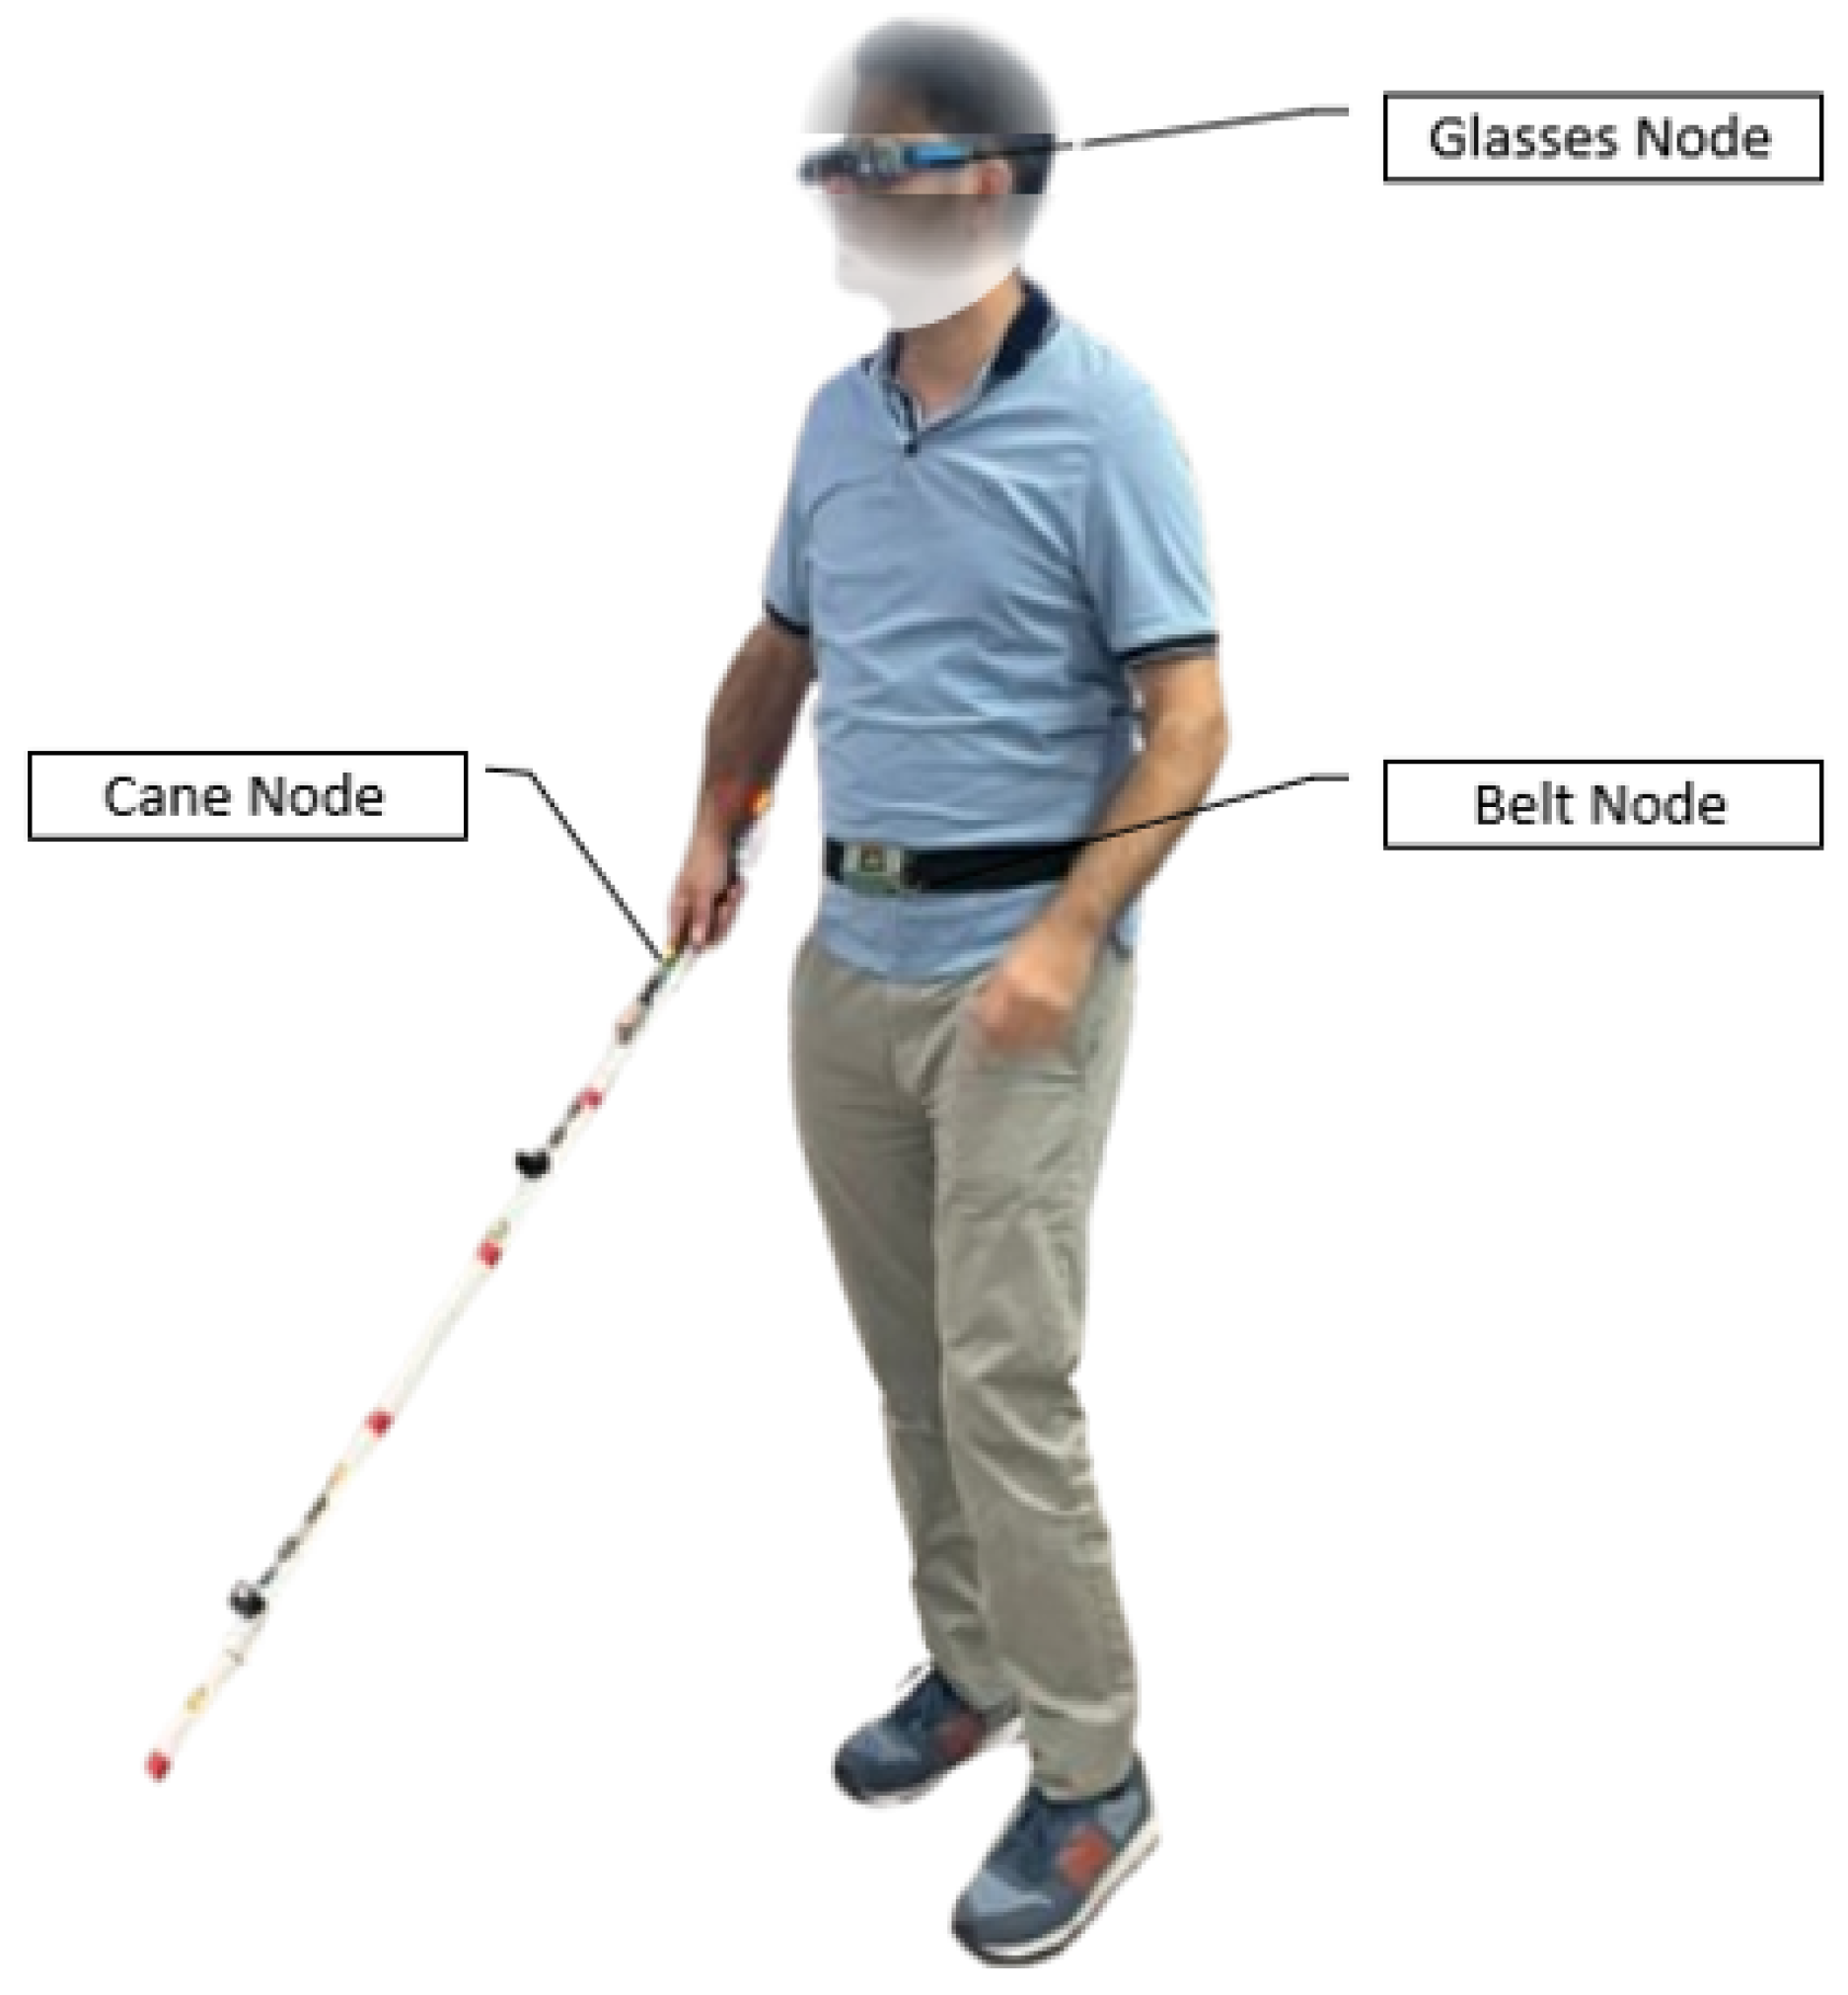
This multi-node configuration leverages anatomical positioning—head, torso, and legs—to create a layered, overlapping multi-modal input and output sensor network. The redundancy improves robustness, minimizes blind spots, and delivers a more holistic, reliable representation of the environment for safe navigation. By coordinating these modalities, the system enhances spatial coverage, minimizes cognitive overload, and supports safe, efficient navigation. The wearable aspect of this research is demonstrated in Figure 22, showcasing the complete ETA system as worn by a user and highlighting its compact, modular, and ergonomic design. The physical form factors of the nodes—the Glasses, Belt, and Cane—have been carefully designed to ensure that the overall system remains lightweight and unobtrusive, allowing users to maintain natural movement and posture during prolonged use, and to remain as close to normal navigation as a person with VI would normally experience. This design consideration is crucial in assistive technologies, where user comfort and ease of integration into daily routines significantly impact usability and adoption.

5. Experimentation and Results

This section reports the experimental setup, protocols, and quantitative results for the three ETA nodes (Glasses, Belt, and Cane) dynamic conditions. All tests used ground-truth distances aligned with the ETA sensor plan and Hall’s proxemics, and measurements were rounded to the nearest millimetre unless noted.
All experiments employed the hardware configuration described in Section 4, with each node mounted on a custom-built “testing rig” replicating human form and posture. The rig, developed as part of this research, enables automated, reproducible testing and represents a unique methodological contribution.
The subsections that follow outline the experimental framework: Section 5.1 describes the rig’s design and control features, Section 5.2 details the testing protocol and data collection methods, and Section 5.3 presents and analyses the results. The section concludes with a summary of key findings and their implications for future development.

5.1. Testing Rig

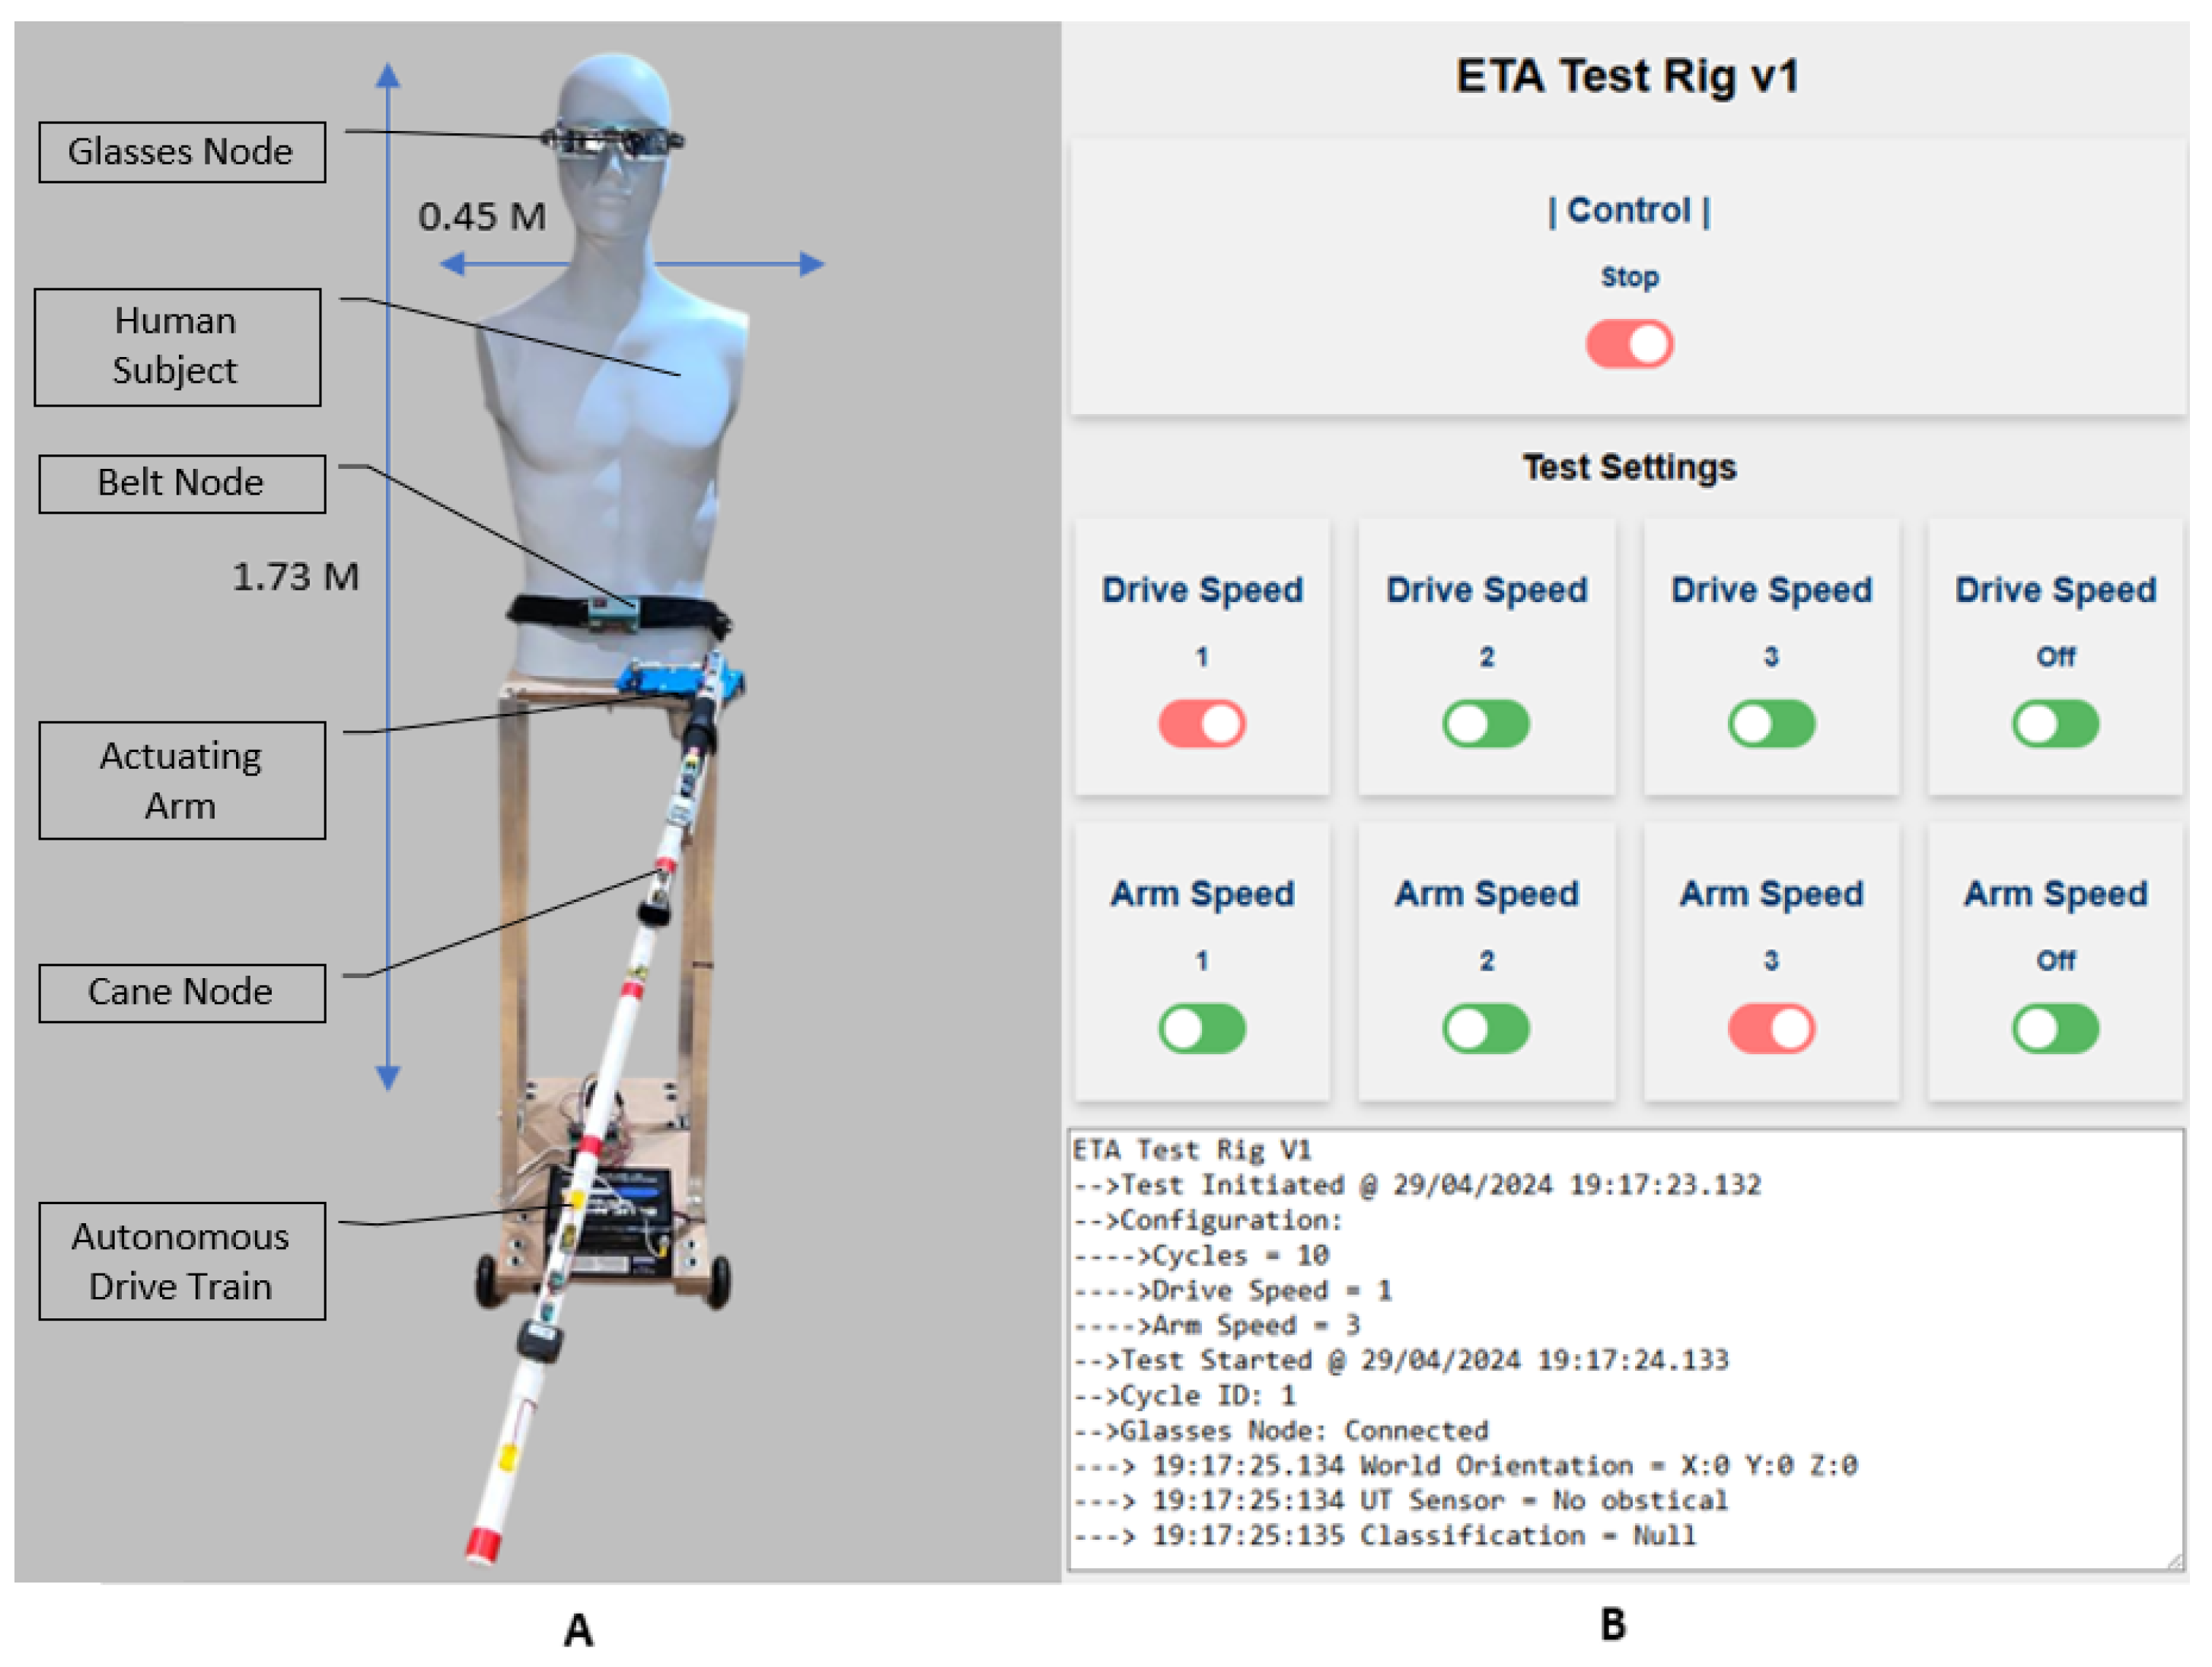
The complete experimental setup—incorporating the Glasses, Belt, and Cane nodes into the testing rig—is shown in Figure 23A. The rig was configured to match the designer’s anthropometric profile, with the height from the ground to the top of the head set to ≈1.73 m, the waist height set to ≈0.95 m, and a shoulder-to-shoulder width of ≈0.45 m. The platform operates autonomously and is capable of controlled linear motion in both forward and backward directions. It additionally incorporates an actuated arm that generates pendular movement to emulate the natural swinging of a long cane. All test sequences were preprogrammed to allow automated execution, consistent self-resetting, and systematic data acquisition.
An ESP32 MCU governs the operation of the test rig, providing remote control, system configuration, and real-time data acquisition capabilities. The ESP32 enables wireless communication, allowing for remote initiation, monitoring, and modification of test procedures. The graphical user interface (GUI) (Figure 23B) displays preset test configurations and presents real-time data collected during experiments.
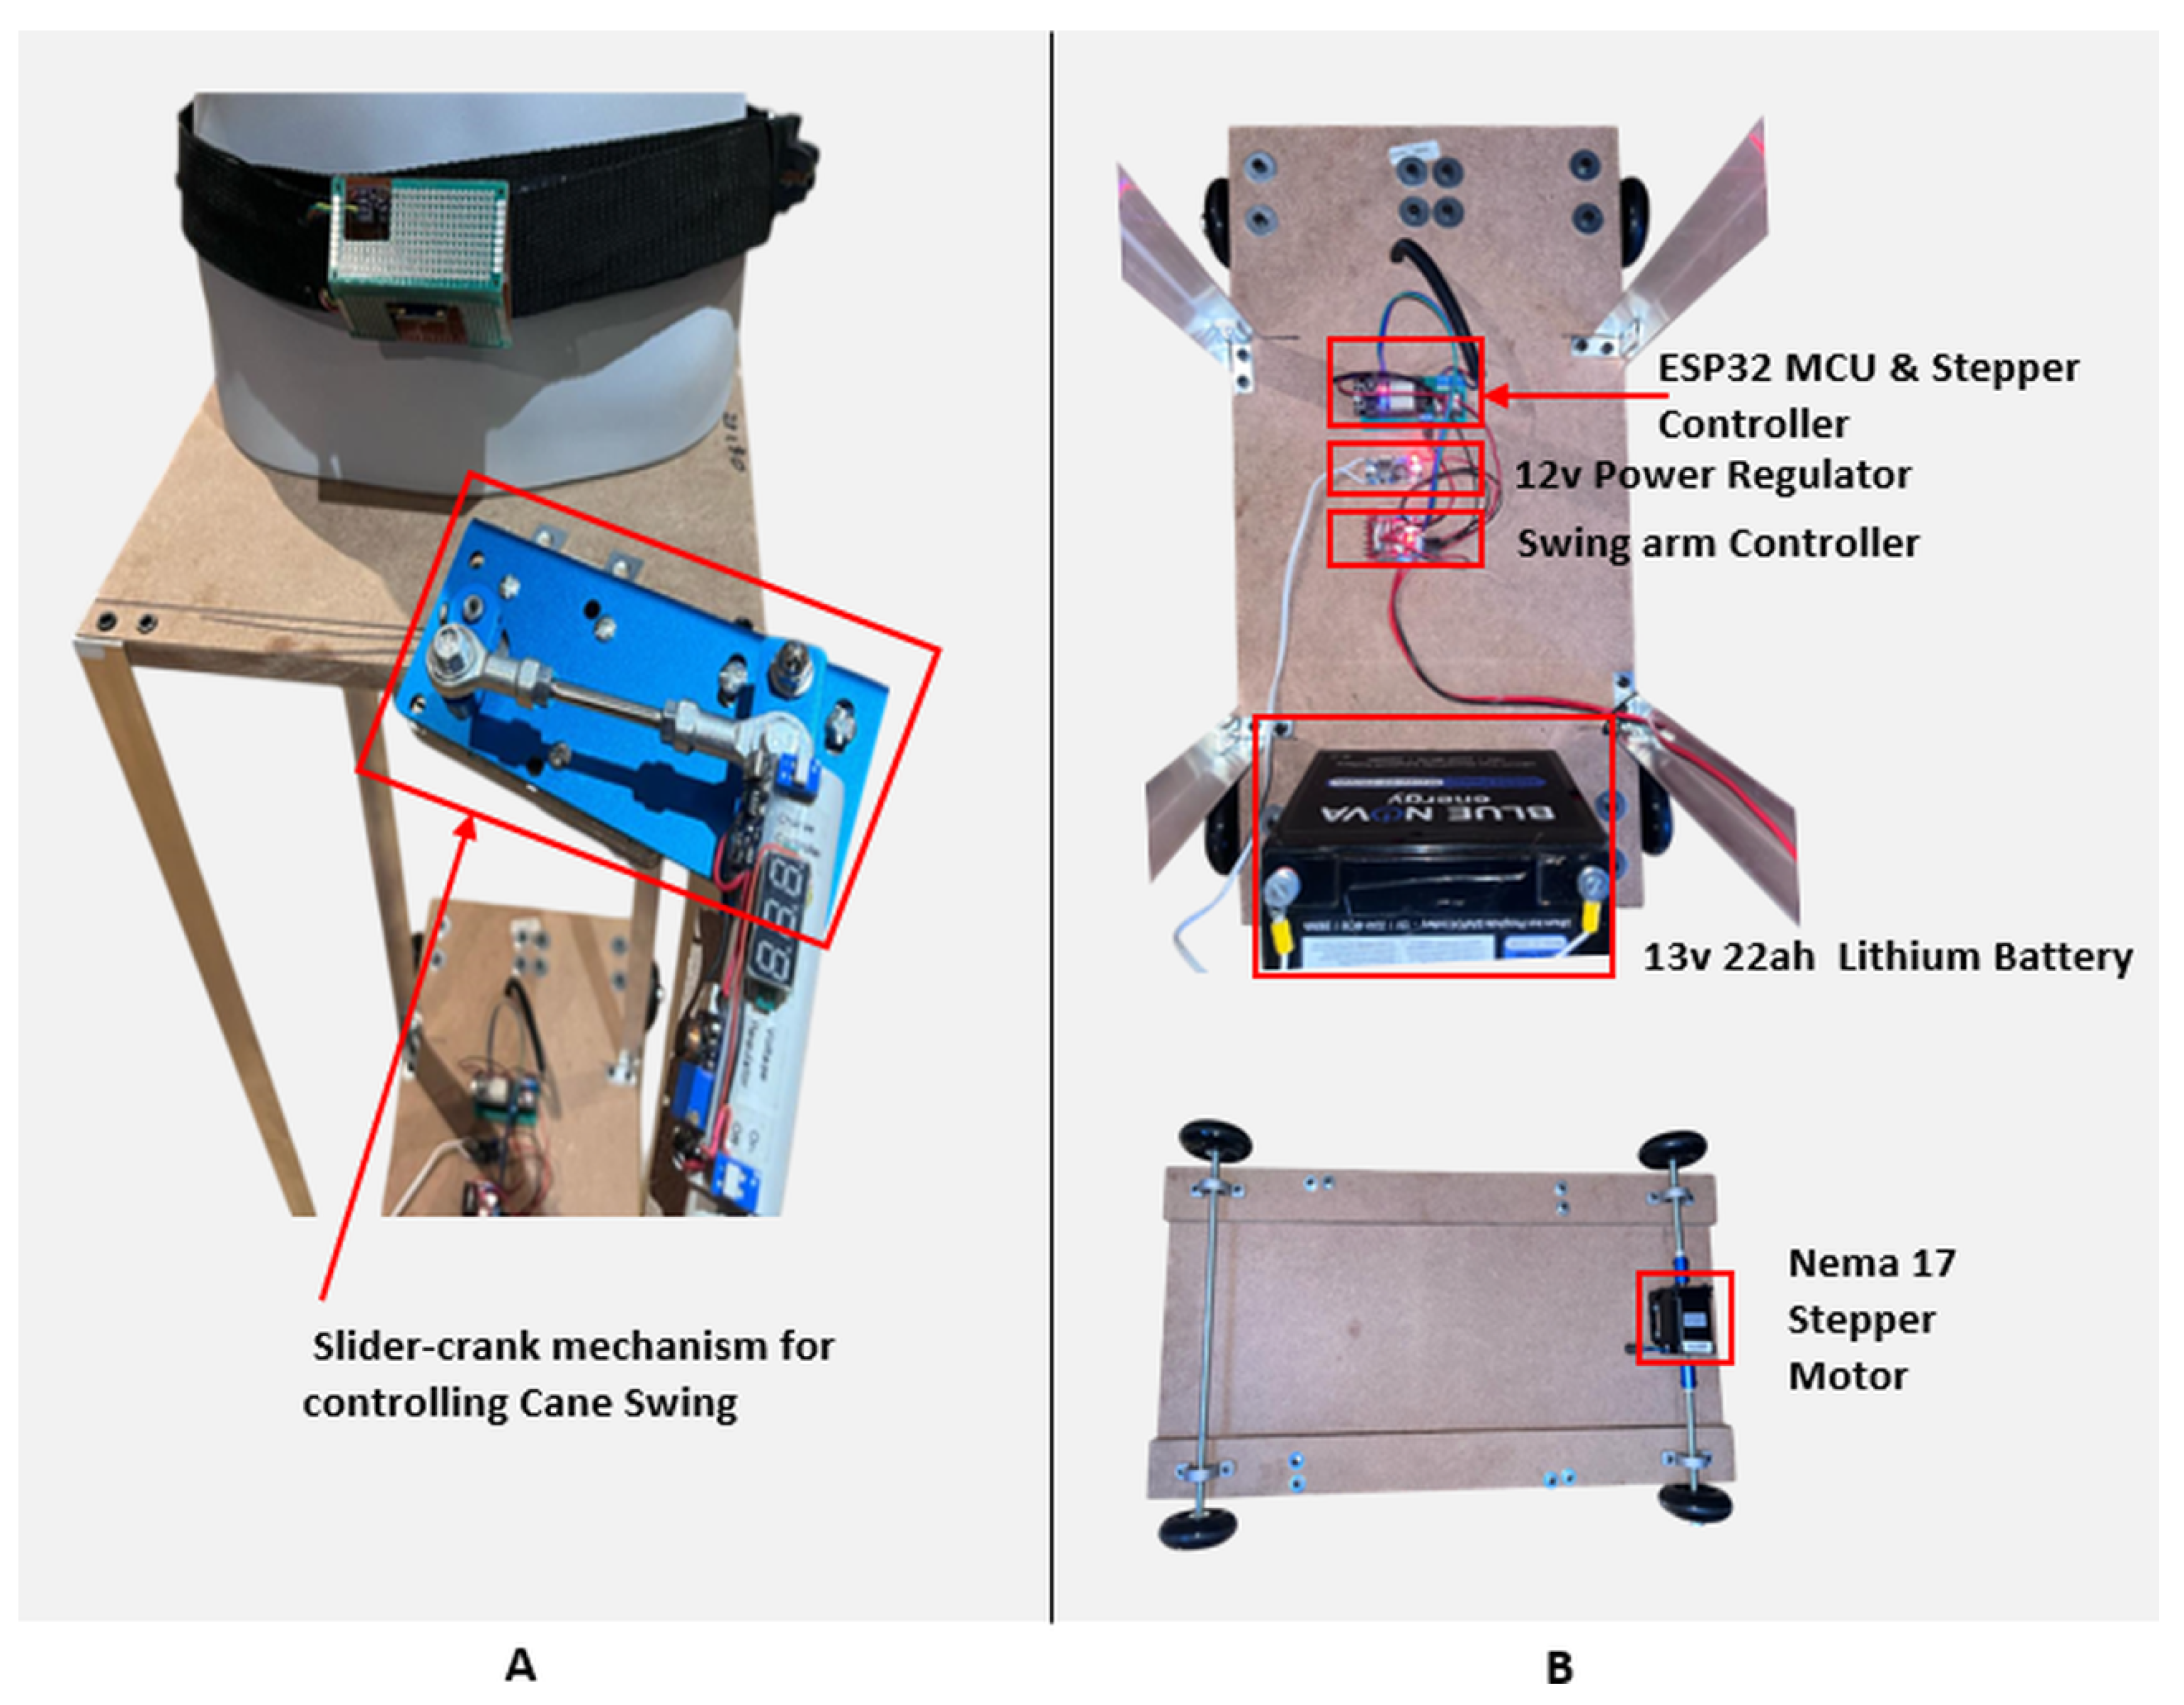
To quantify detection distance, the system employs the microstepping capability of the integrated stepper motor (visible on the test rig’s undercarriage in Figure 24B). As the drivetrain advances, the number of microsteps taken is recorded. These microsteps are then translated into a linear displacement using the arc length formula, which converts the angular motion of the stepper motor into corresponding linear travel distance. The stepper motor has a step angle of 1 . 8 , meaning that a full 360 rotation requires 200 steps. The testing rig utilizes microstepping at a resolution of 1/8 of 1 . 8 , which equates to 0 . 225 per microstep, allowing for smooth and precise control of motor-driven movements. Given a wheel diameter D of 80 cm, the minimum linear distance travelled in one microstep D m can be calculated using the arc length formula as follows:
D m = θ 360 × π × D Substituting for θ = 0 . 225 and D = 80 cm yields : D m = 0.225 360 × π × 80 0.157 cm
This offers high-resolution and high-precision tracking of the rig’s movement and enables precise measurement of the distance covered.
The testing rig’s drivetrain has been precisely calibrated to simulate human walking speeds at three distinct levels: slow, medium, and brisk. These walking speeds were selected to represent common pedestrian movement patterns and are defined as follows: 3 km/h for the slow pace, 4.8 km/h for the medium pace, and 6.4 km/h for the brisk pace. These values are consistent with established gait studies [67,68] and provide a representative range for evaluating real-world sensor performance.
The arm employs a slider–crank mechanism to convert rotational motion into linear displacement. A 12 V DC motor, driven by an L298N controller [69] and regulated via PWM, powers the crank. The crank is connected via a coupler to a shaft terminating in a single pivot point, enabling pendular motion. The shaft displacement is fixed at 120 , and the pendular motion was calibrated to approximate the natural swing trajectory observed in human cane use as reported by Kim et al. [70]. A detailed analysis of the mechanical arm’s swing dynamics—including speed profiles and human-motion benchmarking—will be presented in a follow-up study; in the present work, only the components necessary to support the experimental procedures are reported for completeness.
Although the actuating arm evaluation is not included in this paper’s results, its description provides essential context for how the Cane node was integrated into a controlled testing rig, which itself constitutes one of the methodological contributions of this study. The experimental evaluation of the actuating arm will form part of a follow-up paper. Building on this foundation, the following section establishes the criteria used to assess detection performance across all nodes while in motion.

5.2. Dynamic Sensor Testing Protocol

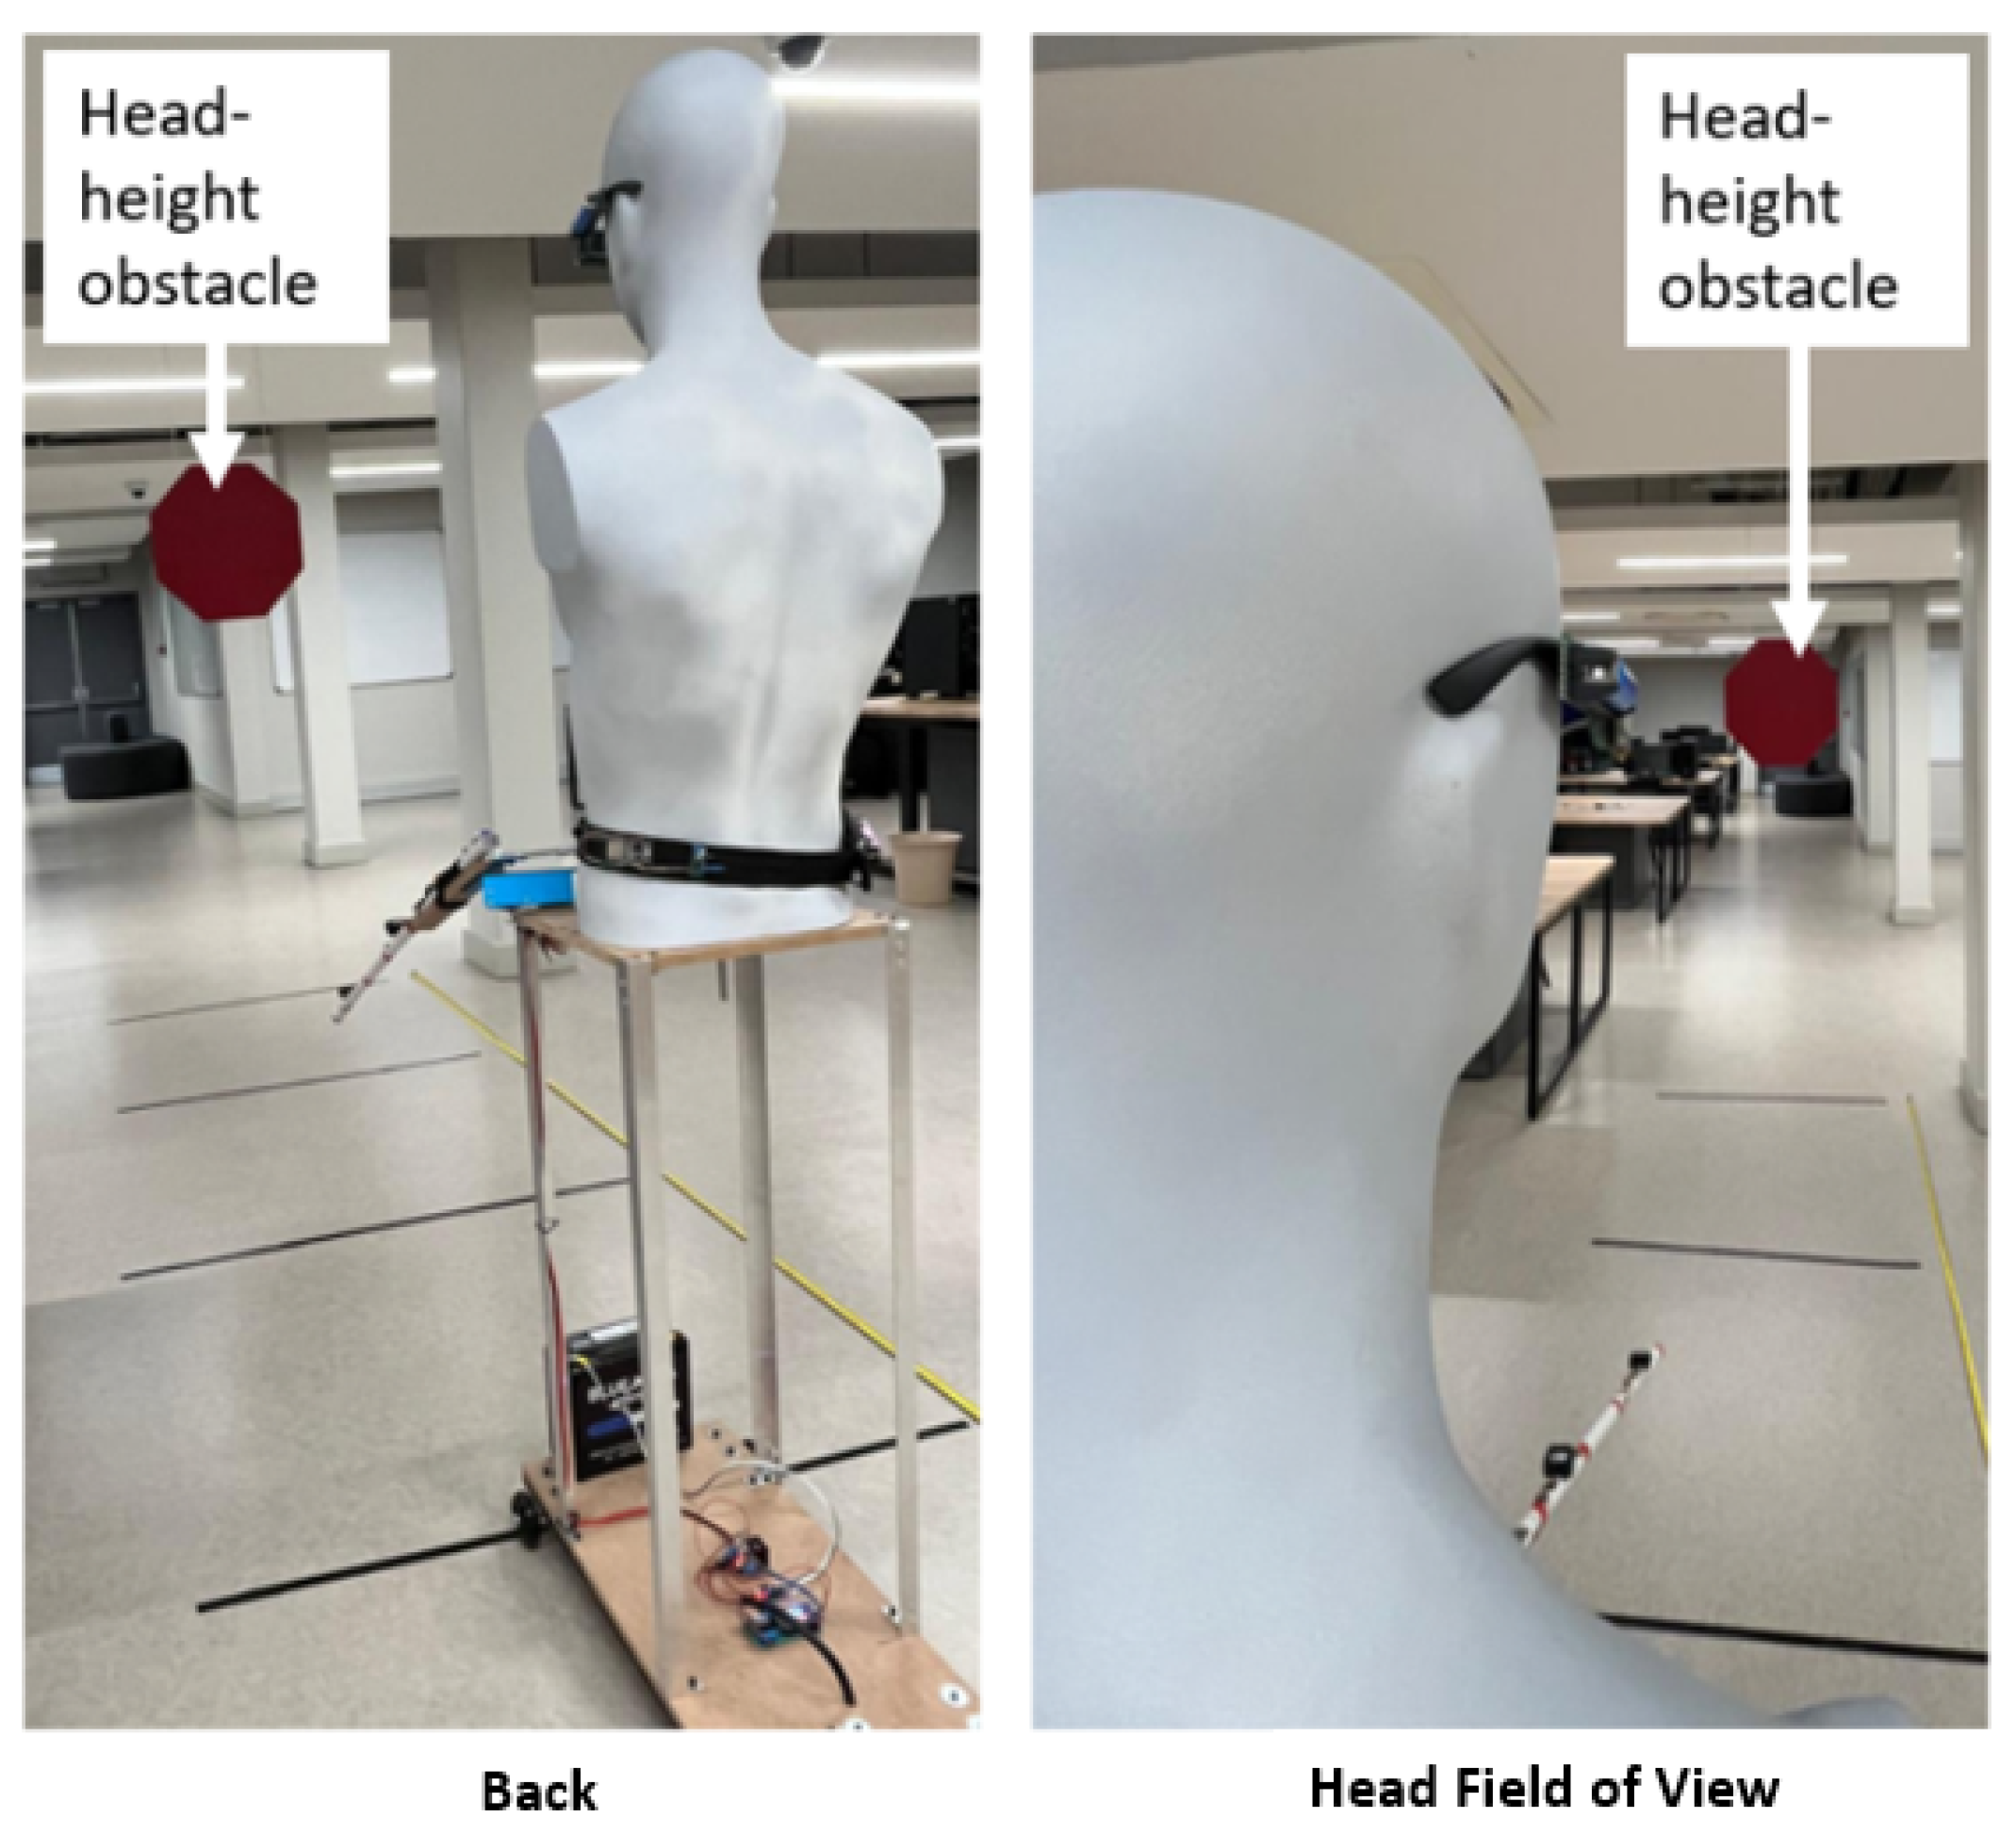
Proximity sensor testing evaluated each sensor’s obstacle detection accuracy across three vantage points—head height (Glasses), waist height (Belt), and leg height (Cane). While this battery of tests explored the accuracy of the ETA while in motion, the Cane node remained static. All tests were conducted under controlled laboratory conditions while in motion. Boxes and cardboard cutouts shaped as stop signs were used as representative obstacles, as illustrated in Figure 25. Each node was tested independently at three approach speeds (slow, medium, and brisk), as detailed in Section 5.1, with the motion rig advancing toward a stationary obstacle until detection was triggered. The initial starting position for each trial was set 1 m beyond the sensor’s maximum detection range to ensure that all tests began in a non-detection state. For each trial, the distance between the sensor and the obstacle at the moment of detection was recorded.
Each distance test was repeated 20 times under controlled laboratory conditions, providing a sufficient sample size for reliable inference given the low variance and repeatable setup. A one-sample t-test was used to compare the measured mean detection distance to the reference distance. Although some results, such as the Cane node at 2 m, were statistically significant (p < 0.001), the mean deviation of less than 1 cm remained within the acceptable detection tolerance. While the test indicates that this difference is unlikely due to random error, its magnitude is too small to influence system performance. Thus, the result is statistically significant but operationally negligible, illustrating the distinction between mathematical detectability and practical relevance in engineering evaluation.
The accuracy metric for obstacle detection was defined as ± 10 % of each node’s maximum detection range. This tolerance ensures that alerts occur neither too early (creating unnecessary cognitive load) nor too late (reducing safety). For example, the Glasses node ultrasonic sensor has a detection range of 3.0 m, so accurate detection is considered valid when obstacles are identified within [2.7, 3.3] metres. This criterion balances timeliness with reliability, ensuring sufficient user reaction time.
The dynamic tests were structured to evaluate obstacle detection and classification performance across all three proxemic zones while the test rig was in motion. For clarity, the Belt node was assessed at a 1 m detection distance—corresponding to personal space—for both forward- and rear-facing LiDAR sensing. The Glasses node image-classification system was evaluated at 2 m within near space, followed by near-space detection at 3 m using the Glasses ultrasonic module and the Cane LiDAR 1 module (the cane was fixed to the rig at a constant orientation to maintain a 3 m detection line). Finally, far-space performance was assessed at 4 m using the Glasses node image-classification system. These distances correspond directly with the detection ranges, rig starting positions, and accuracy bands summarised in Table 4.
The integration of this accuracy metric into the test rig setup ensured consistent benchmarking of node performance across trials. By combining precise motion control, programmed sequences, and objective detection thresholds, the rig enabled systematic evaluation of the ETA solution.

5.3. Dynamic Results

Figure 25 shows the Glasses node setup with an overhead obstacle, emulating real-world hazards.
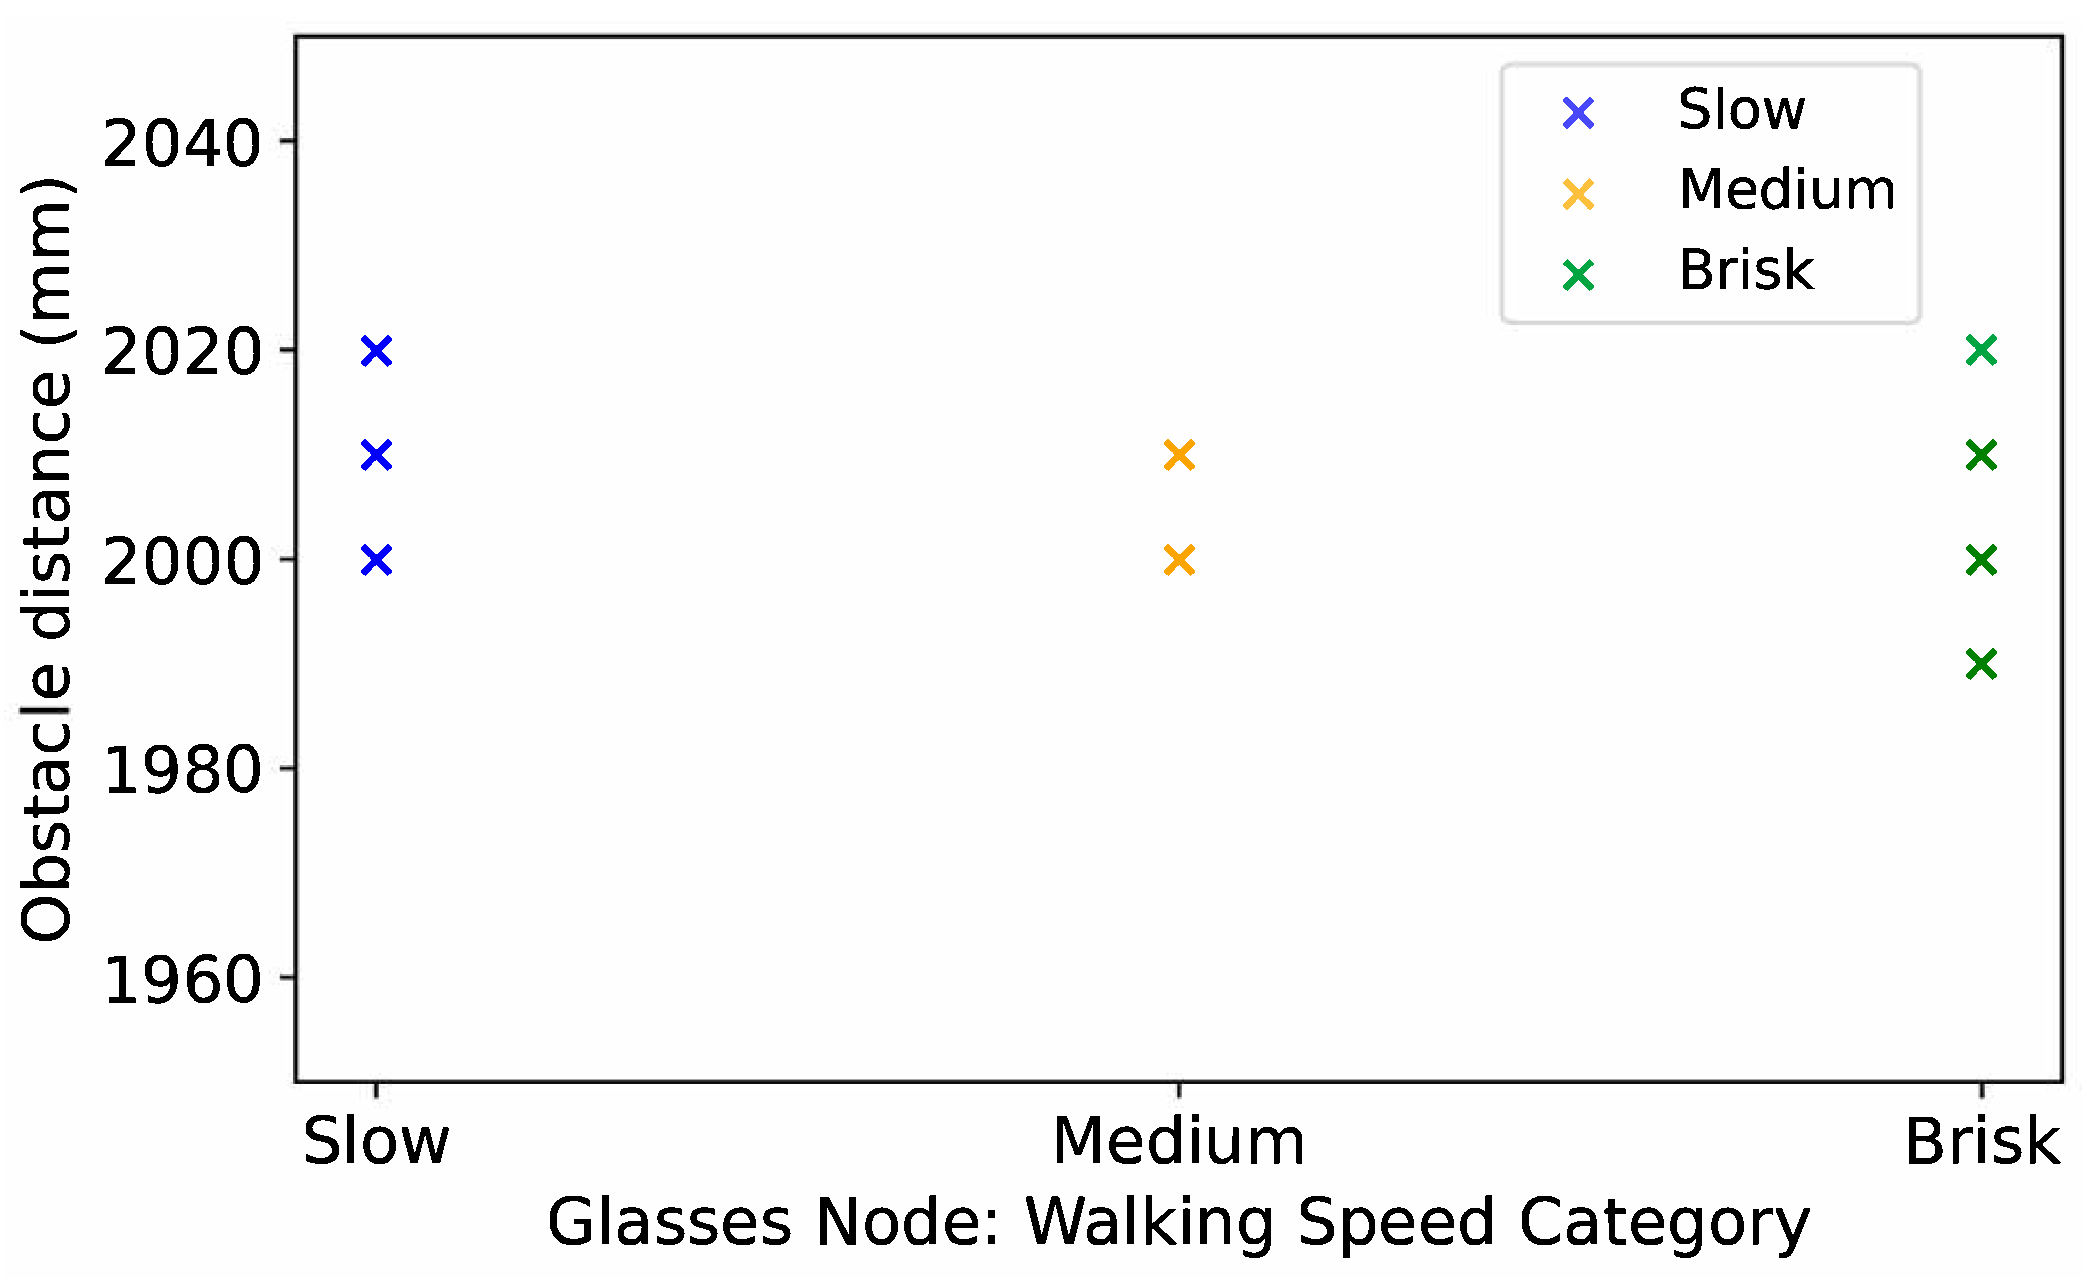
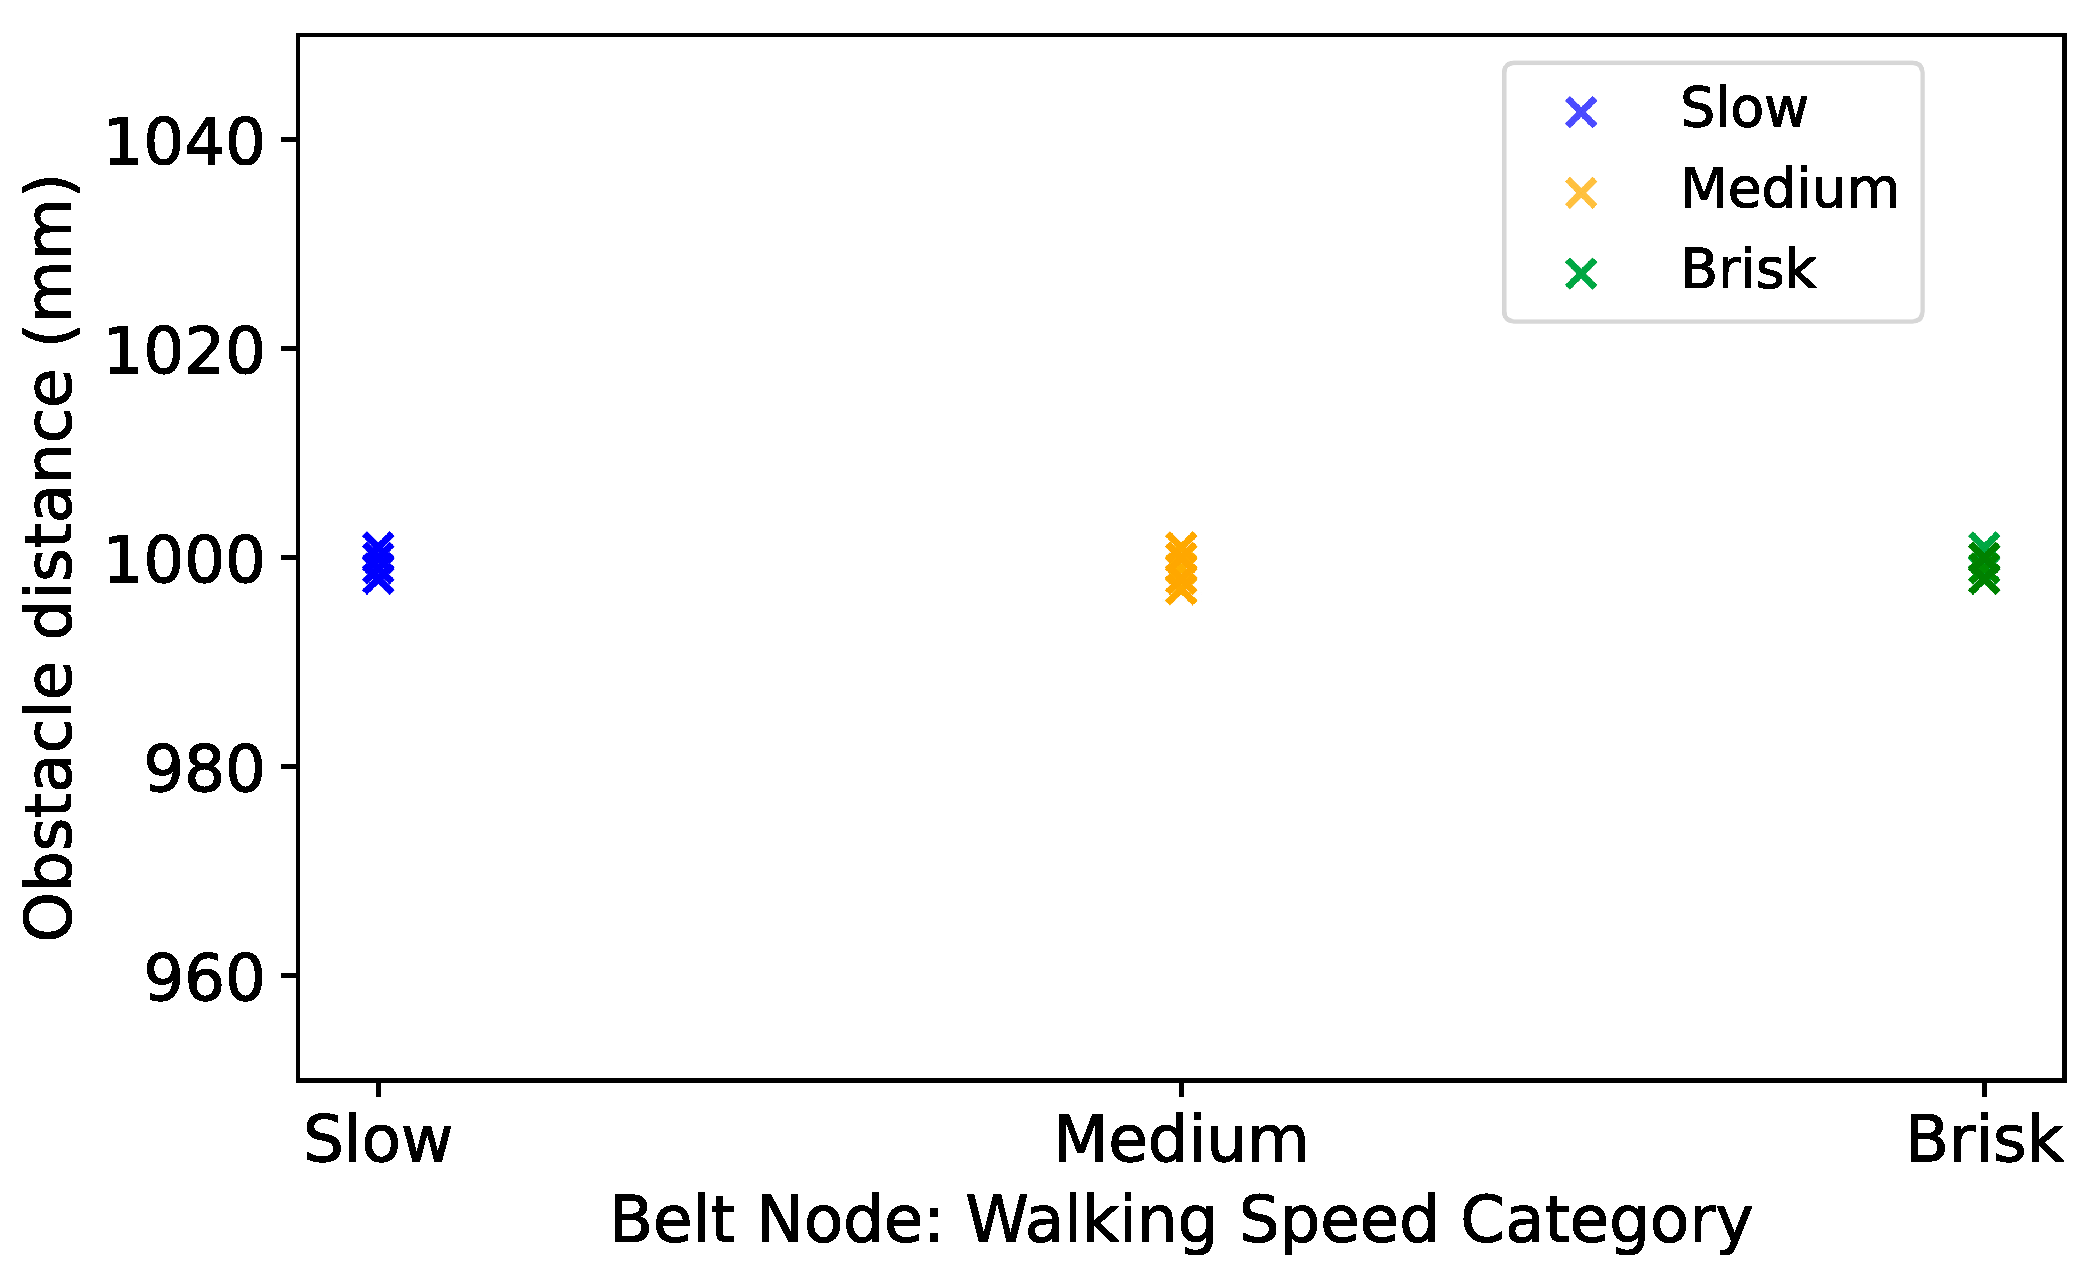
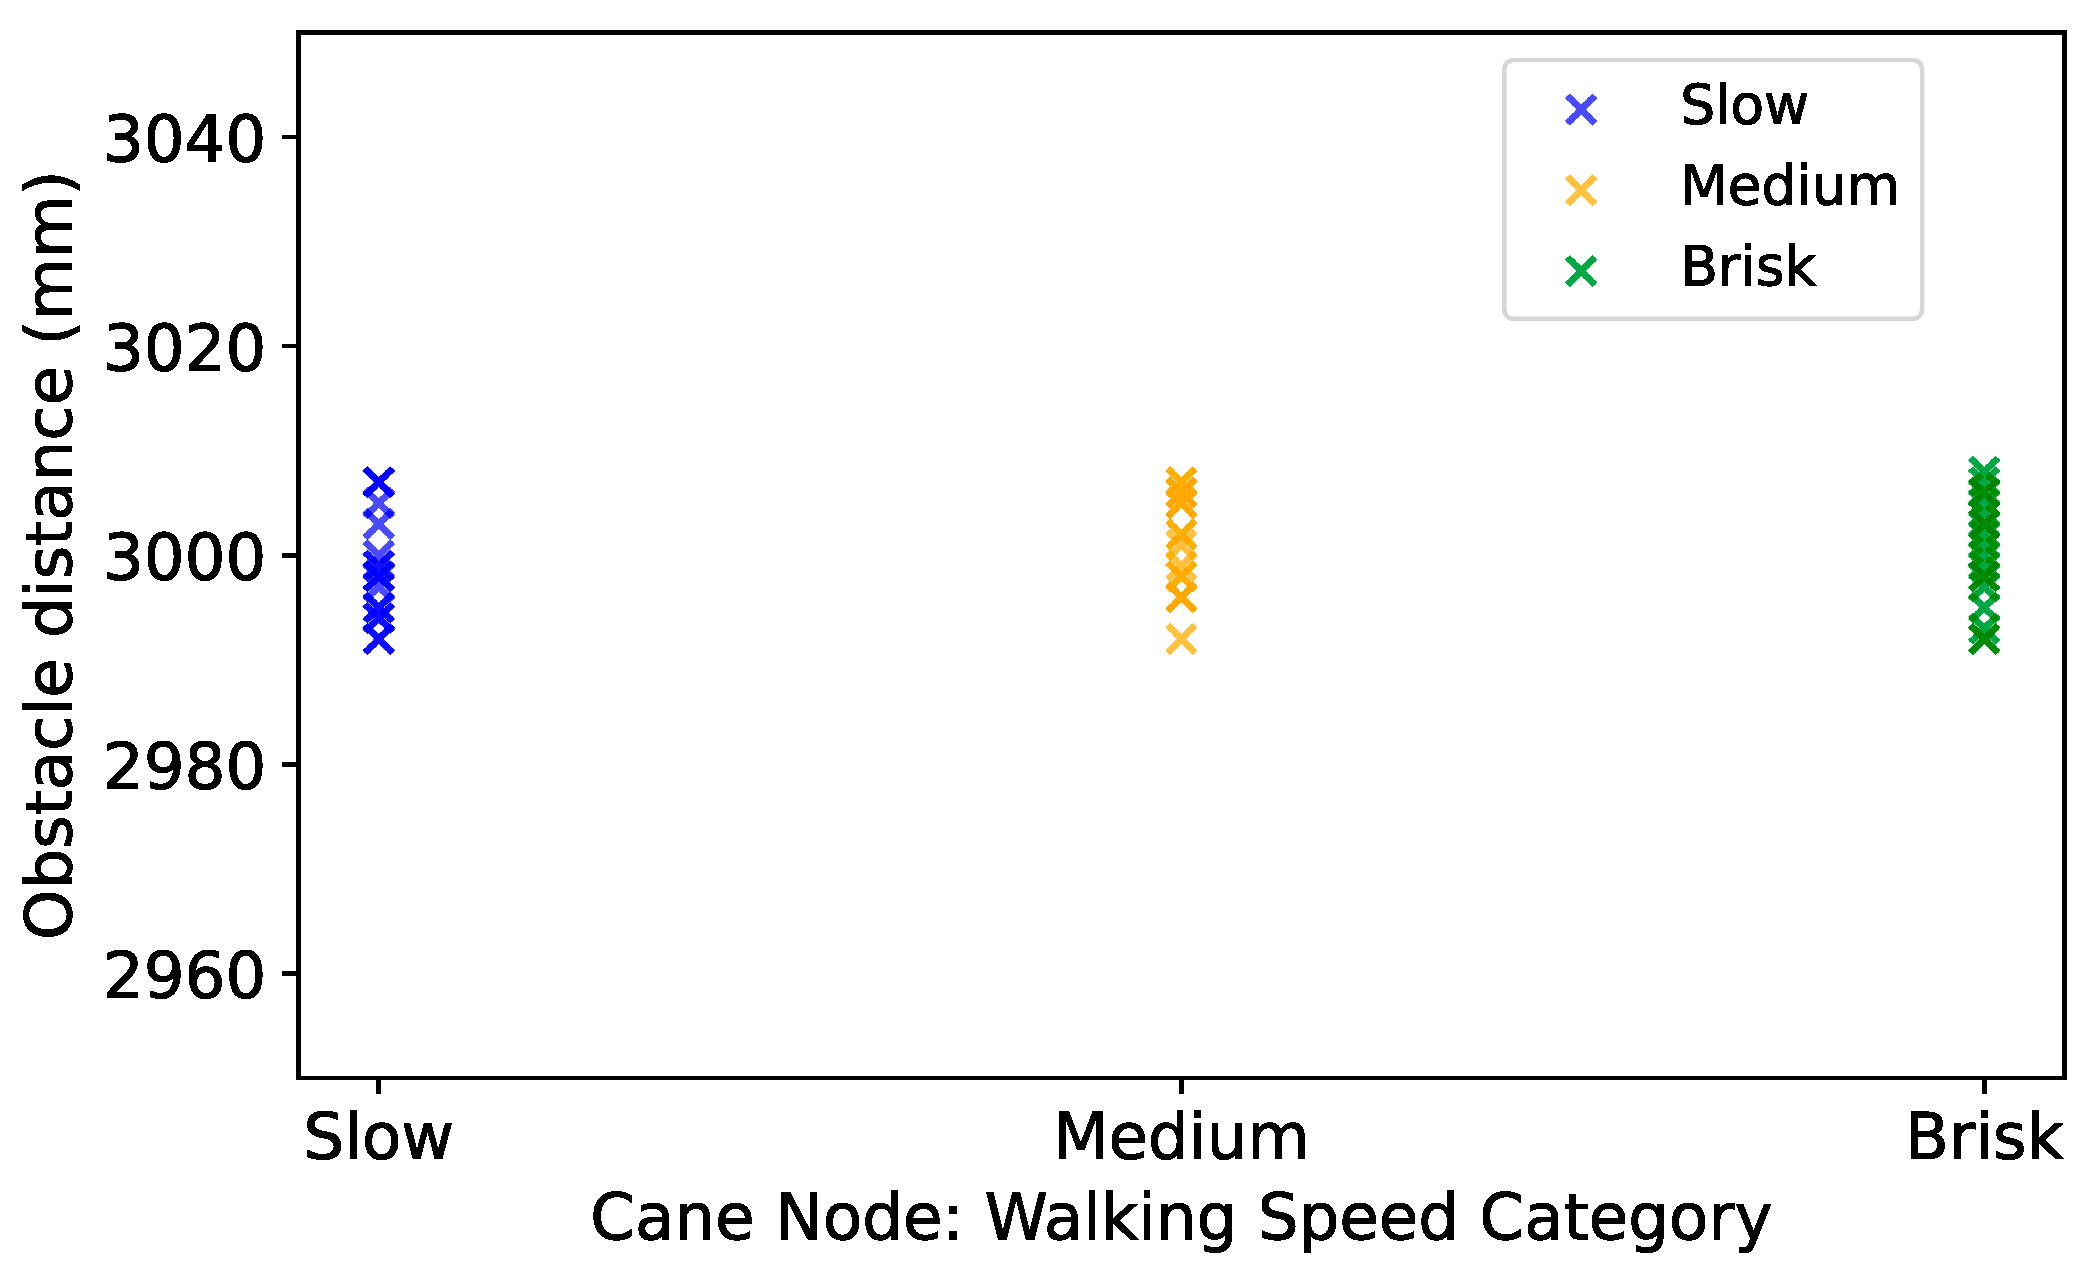
The dynamic evaluation of the multi-node system included tests of the Glasses, Belt, and Cane nodes proximity sensors to evaluate the effectiveness of object detection. Scatter plots (Figure 26, Figure 27 and Figure 28) indicate consistent detection performance across all nodes, with detection distance largely unaffected by speed.
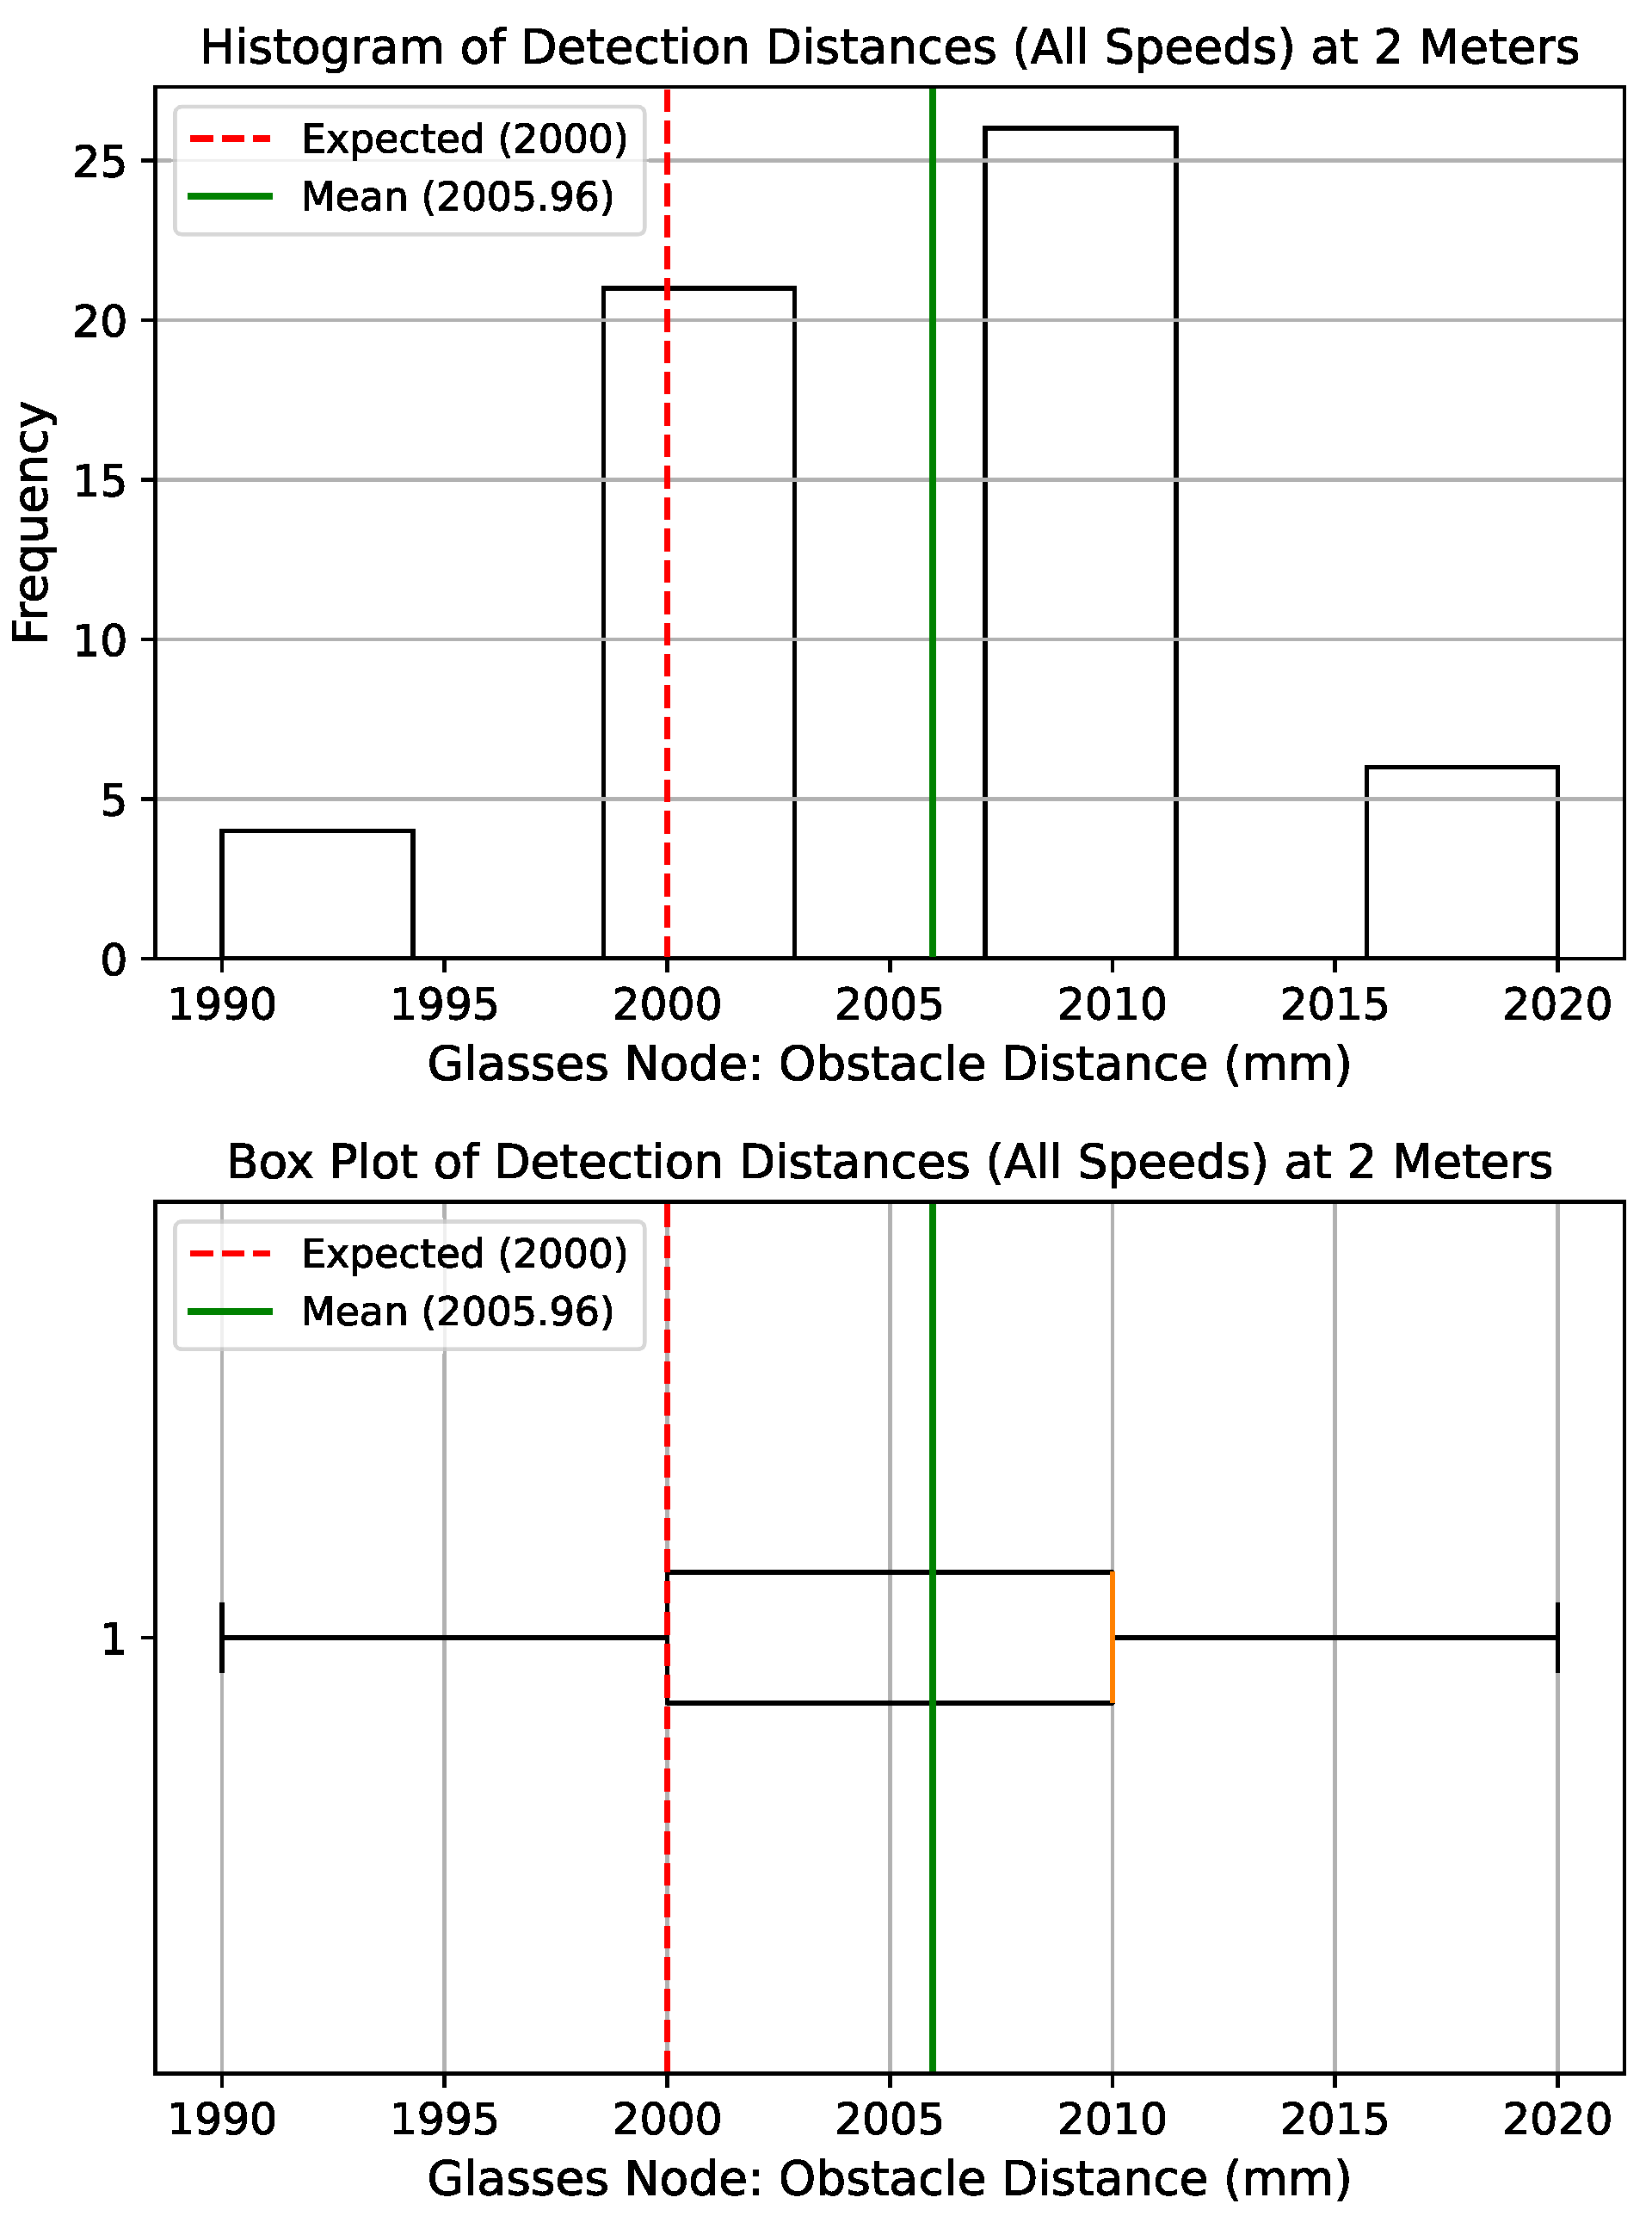
With reference to Figure 29, at a ground-truth distance of 2000 mm, the Glasses node recorded a mean detected distance of 2005.96 mm, corresponding to a small positive bias of +5.96 mm (≈0.3% of ground truth). Variability was low (SD = 7.76 mm, CV = 0.39%), with values spanning 1990–2020 mm. Although the one-sample t-test indicated a statistically significant difference from the expected distance ( t = 5.804 , p < 0.001 ), the magnitude of the bias is negligible in operational terms, lying well within the 10% accuracy margin. This confirms that the Glasses node provides highly consistent obstacle detection in near space.
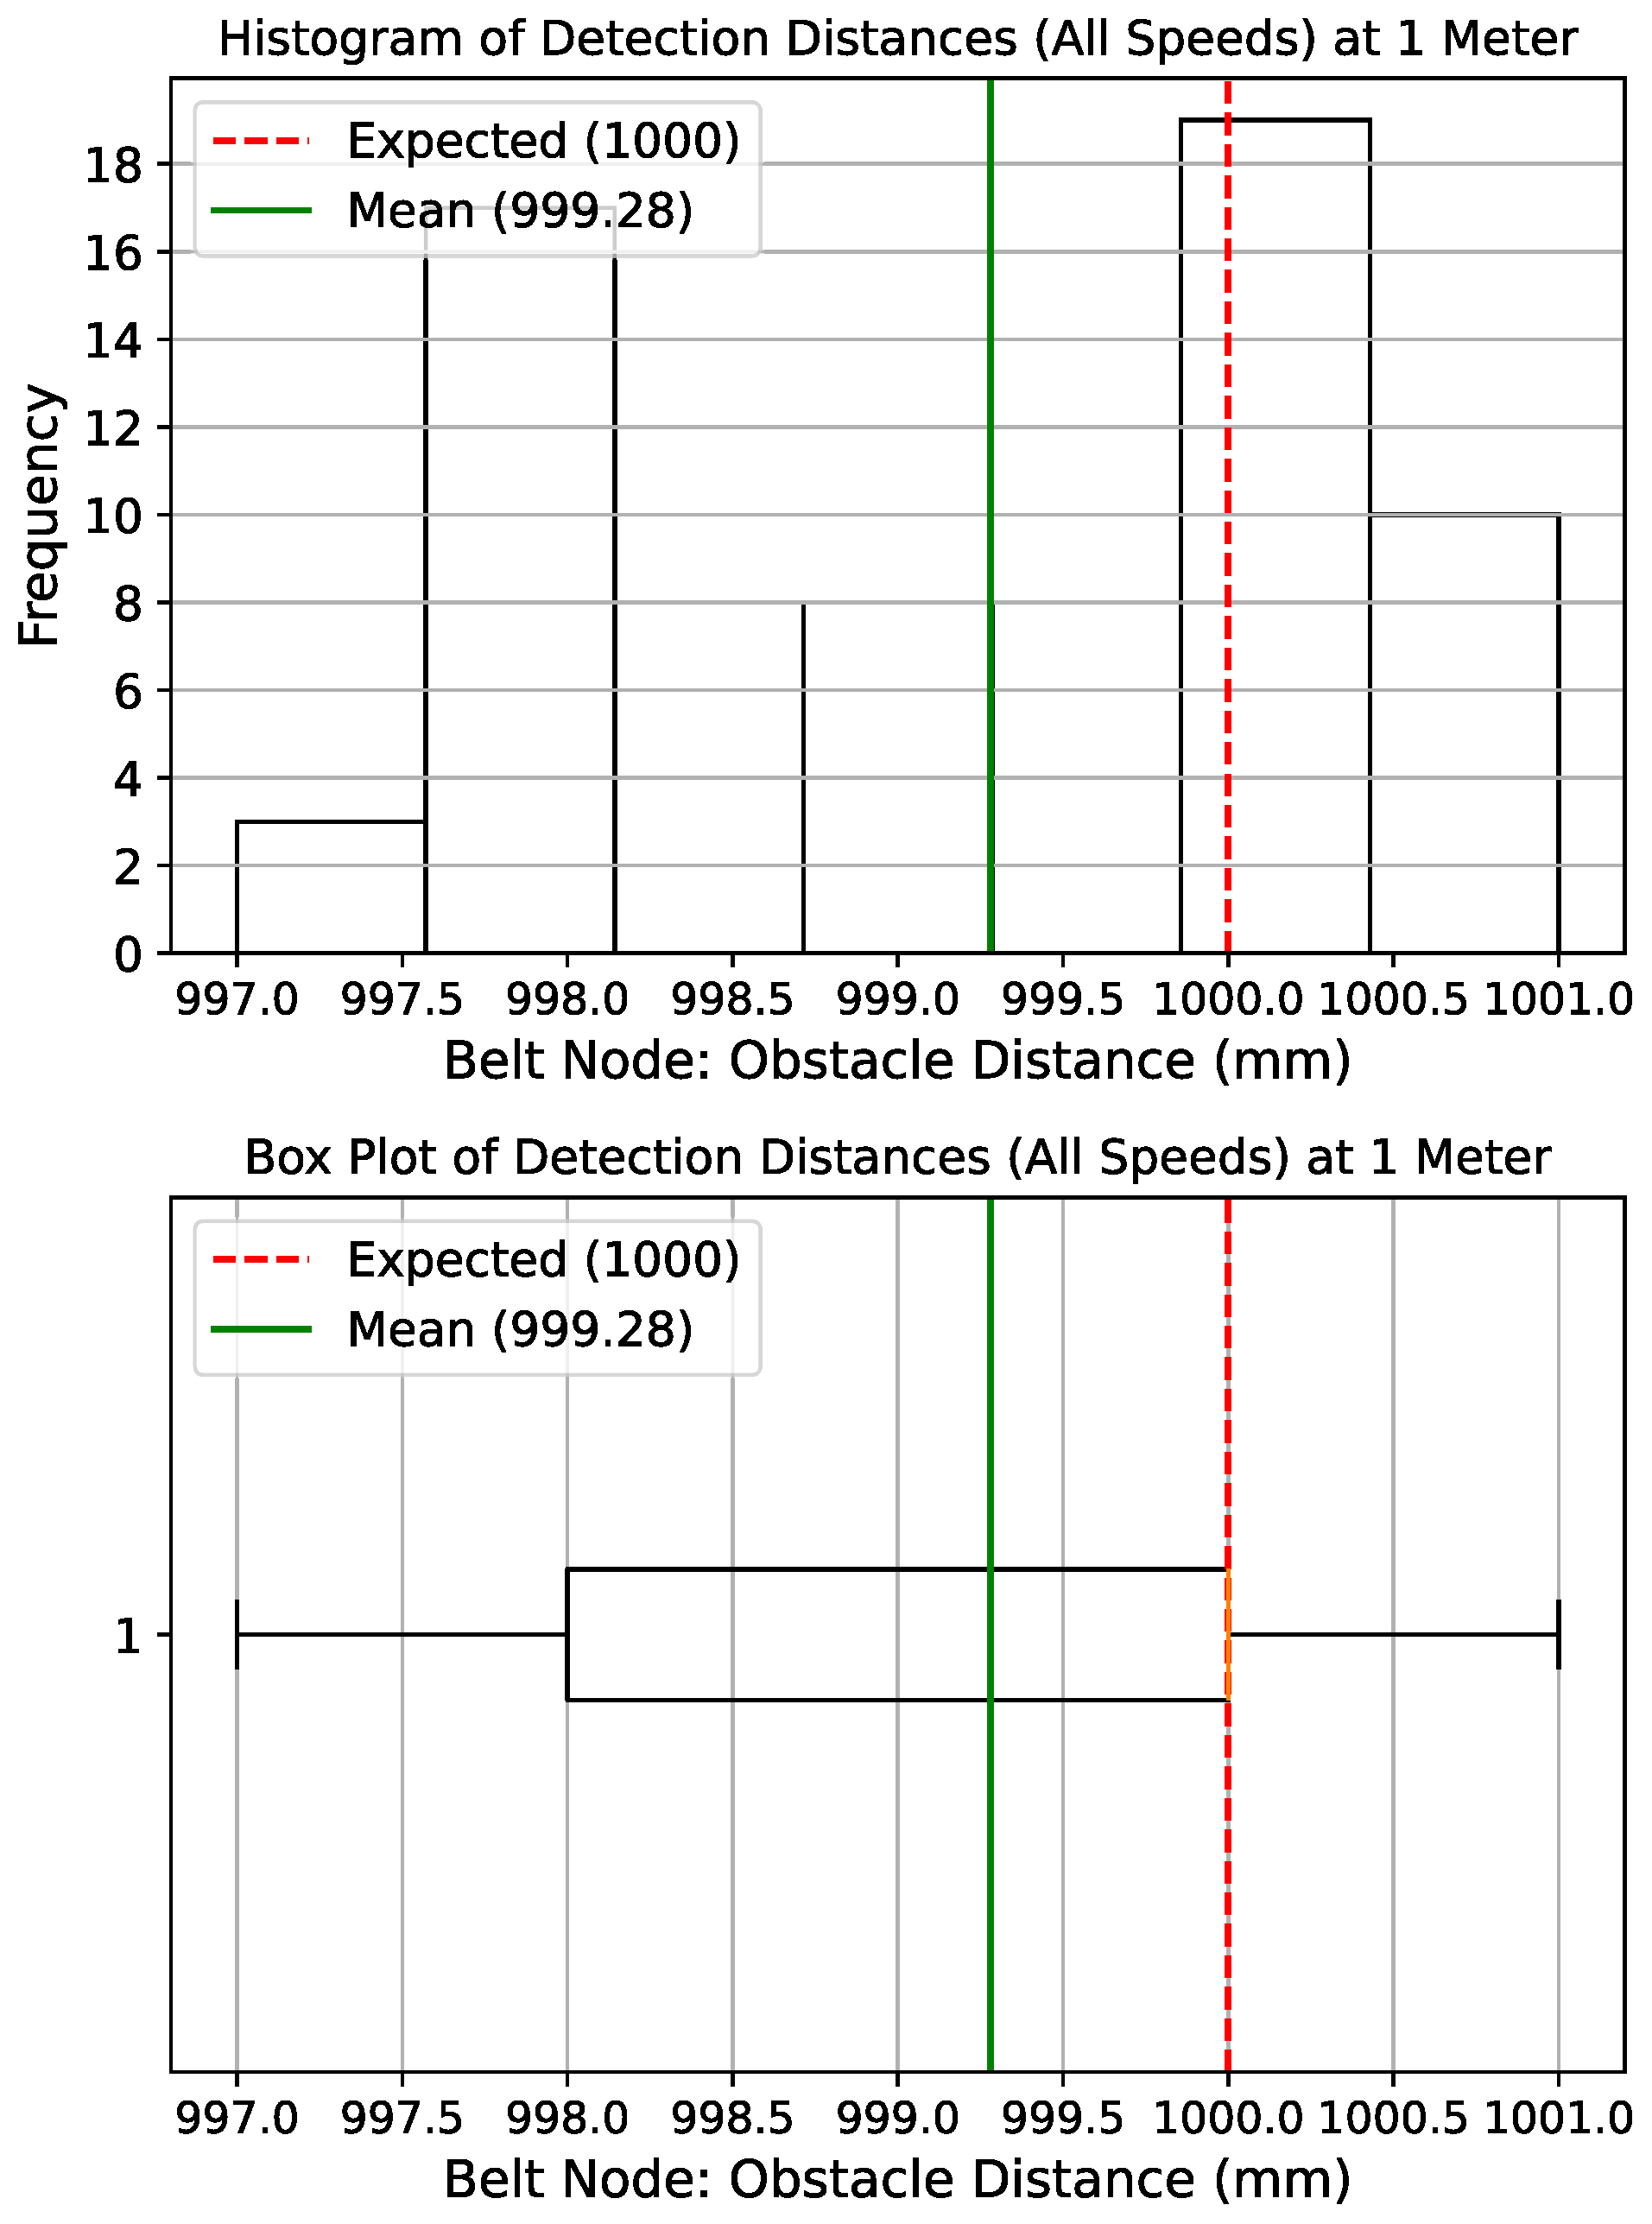
With reference to Figure 30, at a ground-truth distance of 1000 mm, the Belt node reported a mean of 999.28 mm, reflecting a negligible bias of −0.72 mm ( 0.07 % ). Precision was very high (SD = 1.22 mm, CV = 0.12%), with values tightly clustered between 997–1001 mm. Although the one-sample t-test indicated a statistically significant underestimation ( t = 4.447 , p < 0.001 ), the effect is practically insignificant. These results confirm the Belt node’s millimetre-level accuracy and stability for waist-level detection within personal space.
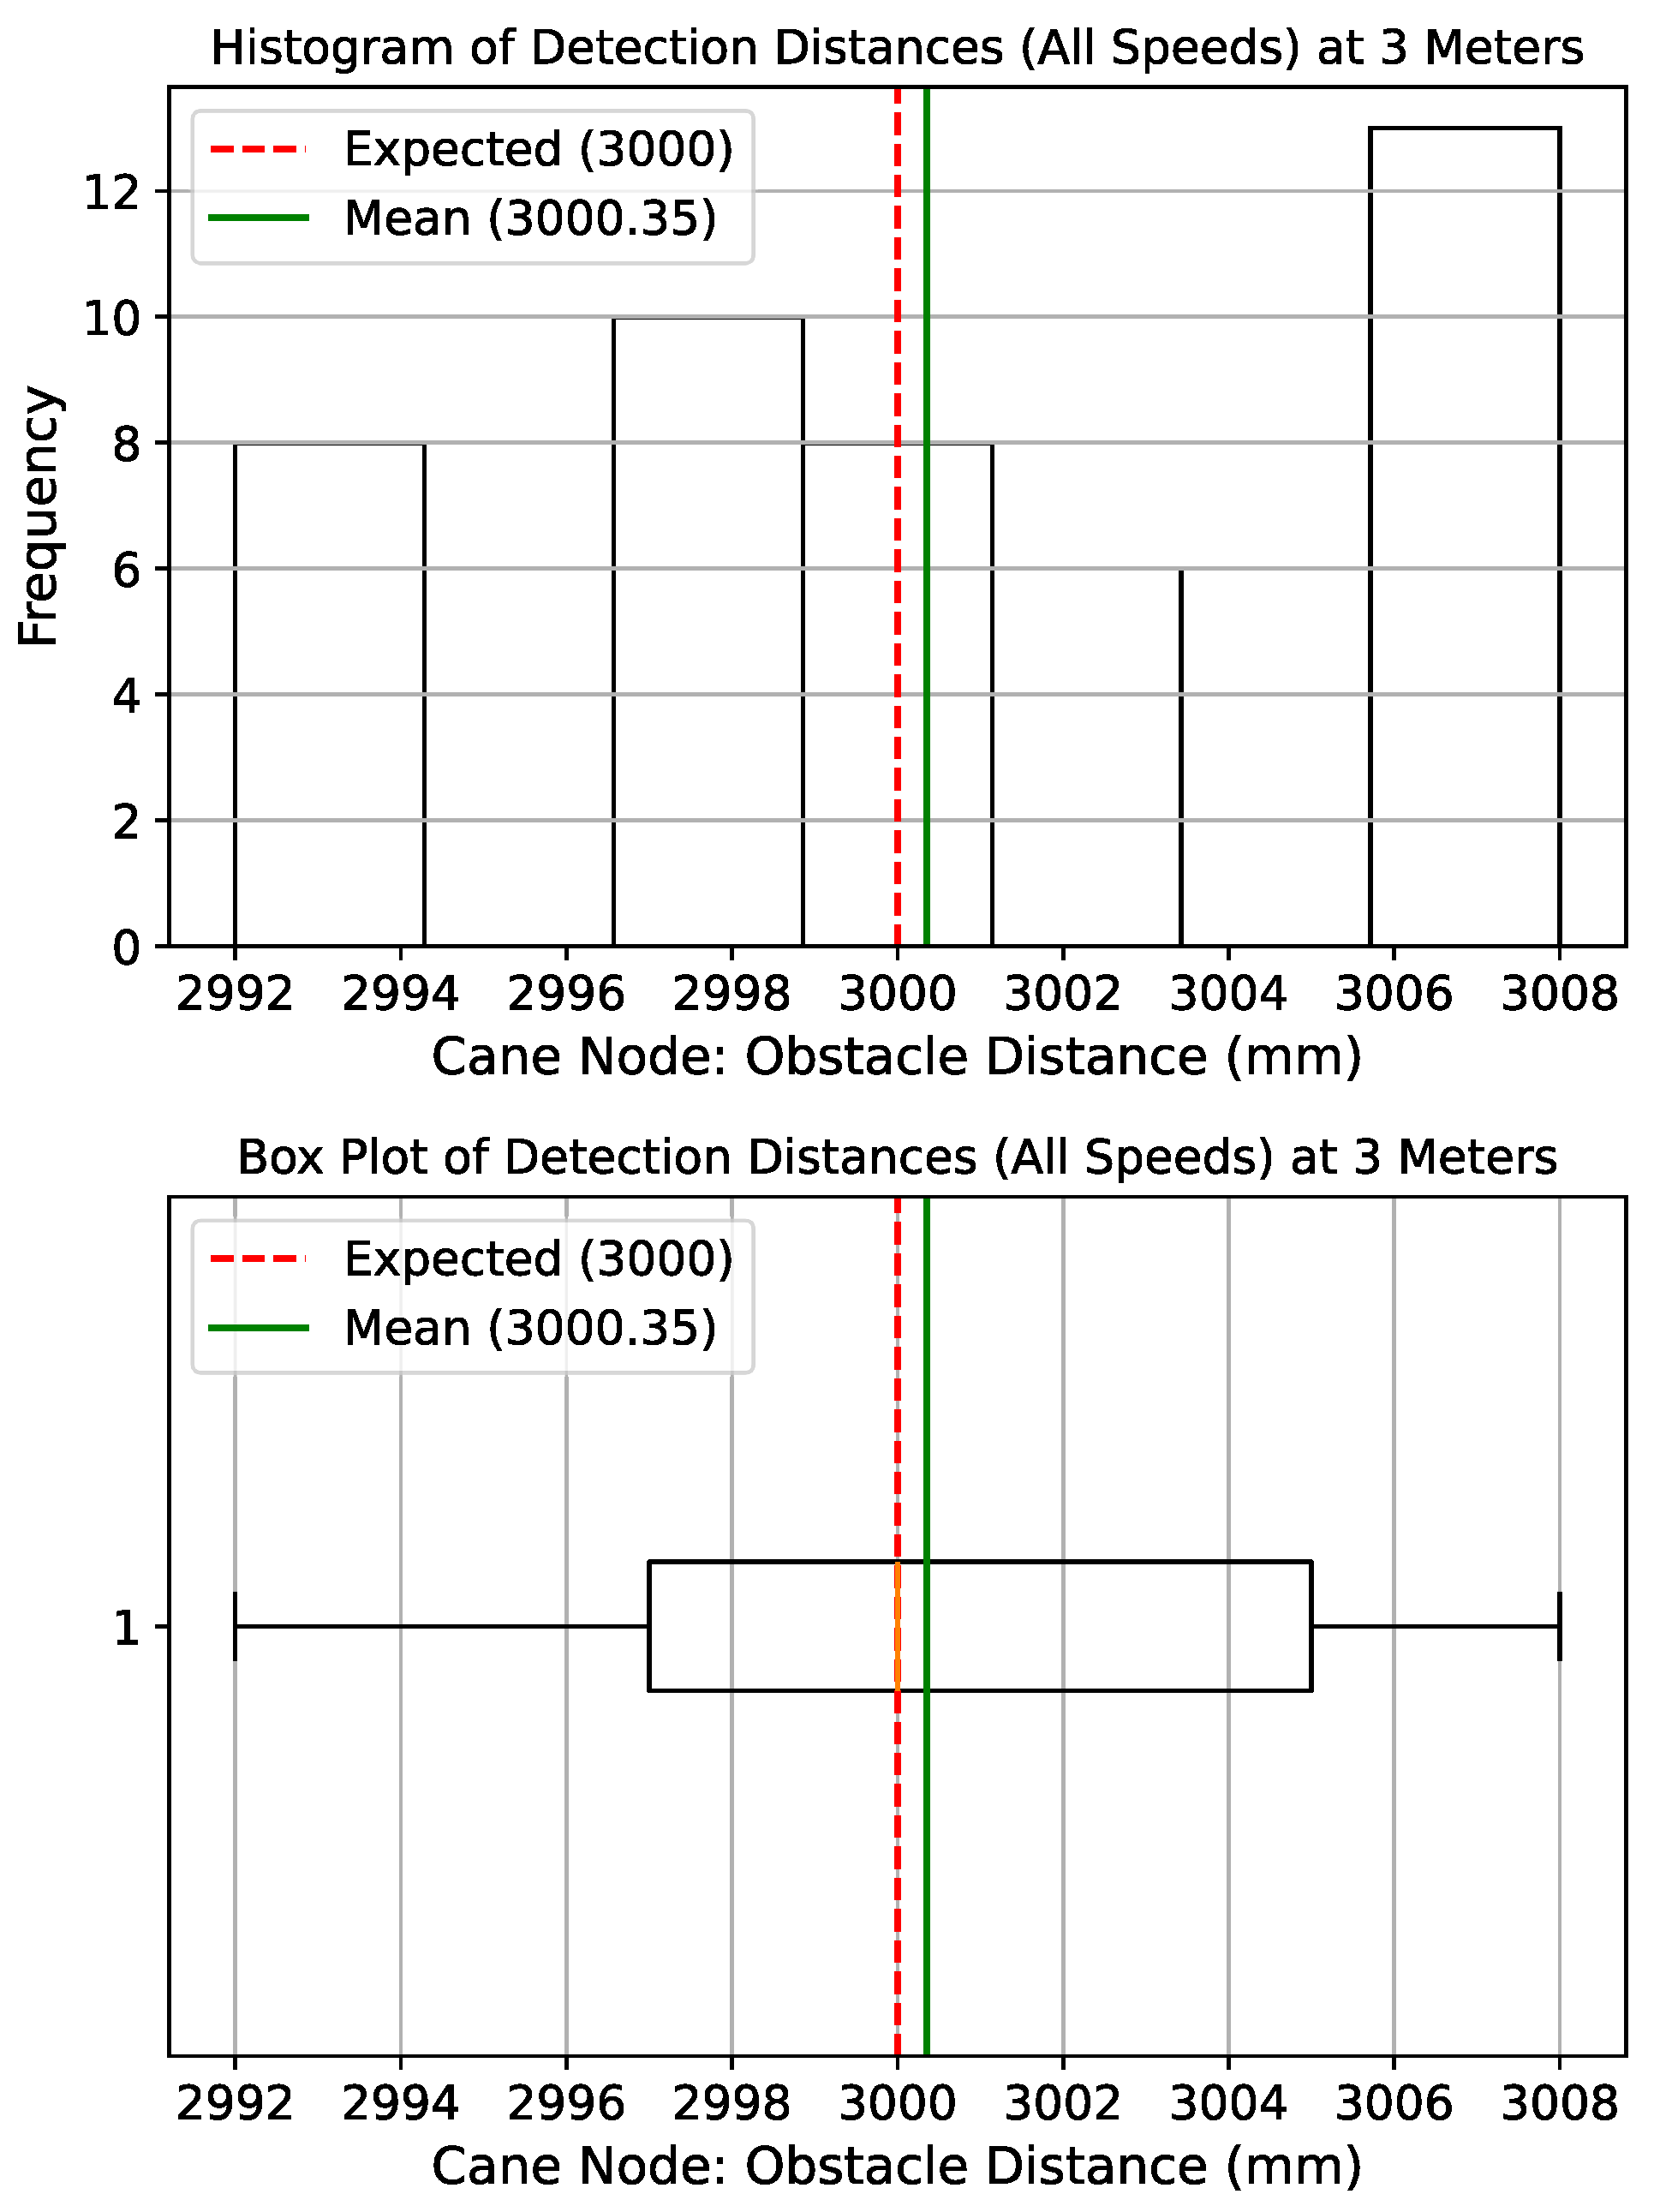
With reference to Figure 31, at a ground-truth distance of 3000 mm, the Cane node recorded a mean of 3000.35 mm, reflecting a minimal bias of +0.35 mm. Variability was modest (SD = 4.94 mm, CV = 0.16%), with a range of 2992–3008 mm. The one-sample t-test found no statistically significant deviation from the reference value ( t = 0.536 , p = 0.594 ). This confirms that the Cane node provides both accurate and precise obstacle detection at extended ranges in far space.
Across all nodes, the observed biases were extremely small, well within the predefined 10% accuracy requirement. The Glasses and Belt nodes exhibited statistically significant differences from ground truth, this consistent deviation is likely due to systematic factors related to the node’s sensor or environment. Possible contributors include rig wobble due to the height of the rig that cause the measured distances to differ slightly, but consistently, from the expected value. These factors introduce reliable and reproducible shifts in the detection measurements, explaining the statistically significant difference observed. It should, however, be reiterated that the variations are very small, with a low variance in their readings, which rendered even millimetre-scale offsets detectable. From an operational perspective, all three nodes delivered reliable performance across their respective zones: the Glasses node in near space, the Belt node in personal space, and the Cane node in far space.

5.4. Object Classification Protocol

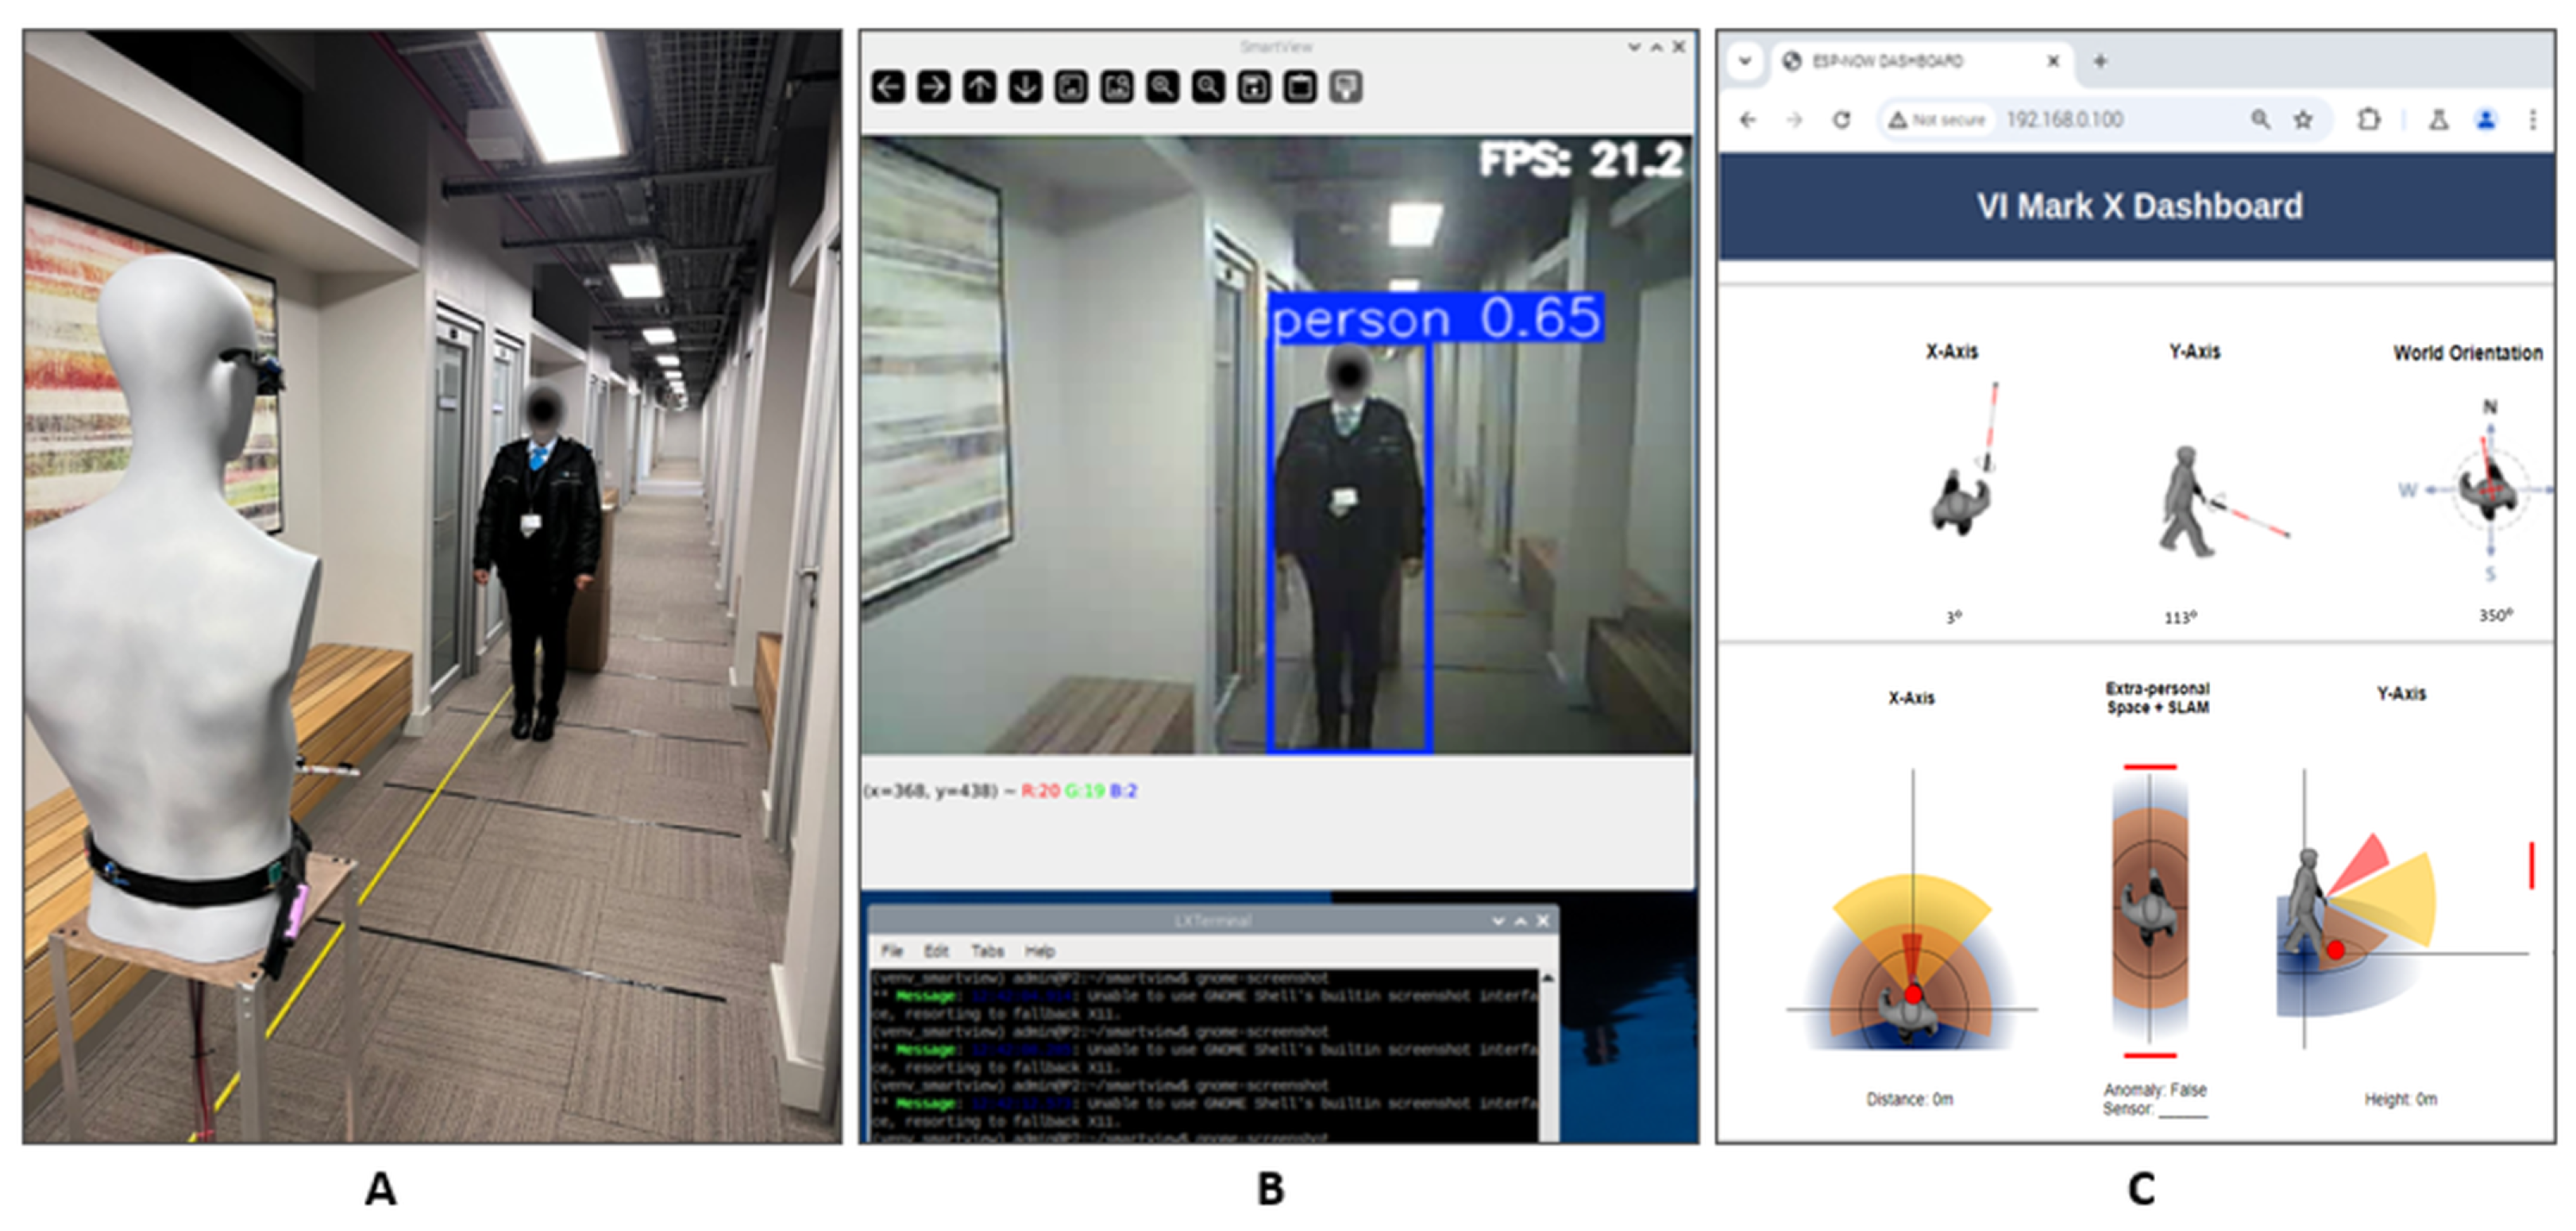
The Glasses node captures environmental data from a head-mounted perspective. Its sensor configuration is optimized to detect potential head-level obstacles while simultaneously providing supplementary contextual awareness through object classification. For the camera integrated within the Glasses node, a total of n = 100 frames were analysed at each distance ranging from personal to far space to identify objects belonging to a predefined subset of interest, with a confidence threshold of 0.30 used to validate detections. Building on the preceding range-sensing evaluation, this stage of analysis focused on the ESP32-CAM module, which enhances the Glasses node’s functionality beyond distance estimation by enabling object recognition and semantic context inference. A person was selected as the target object, representing one of the COCO [65] dataset classes employed in this study. Figure 32 illustrates the experimental setup, including the test subject (panel A), successful real-time classification with corresponding frame rate and confidence values (panel B), and the monitoring interface used for observation (panel C).

5.5. Object Classification Results

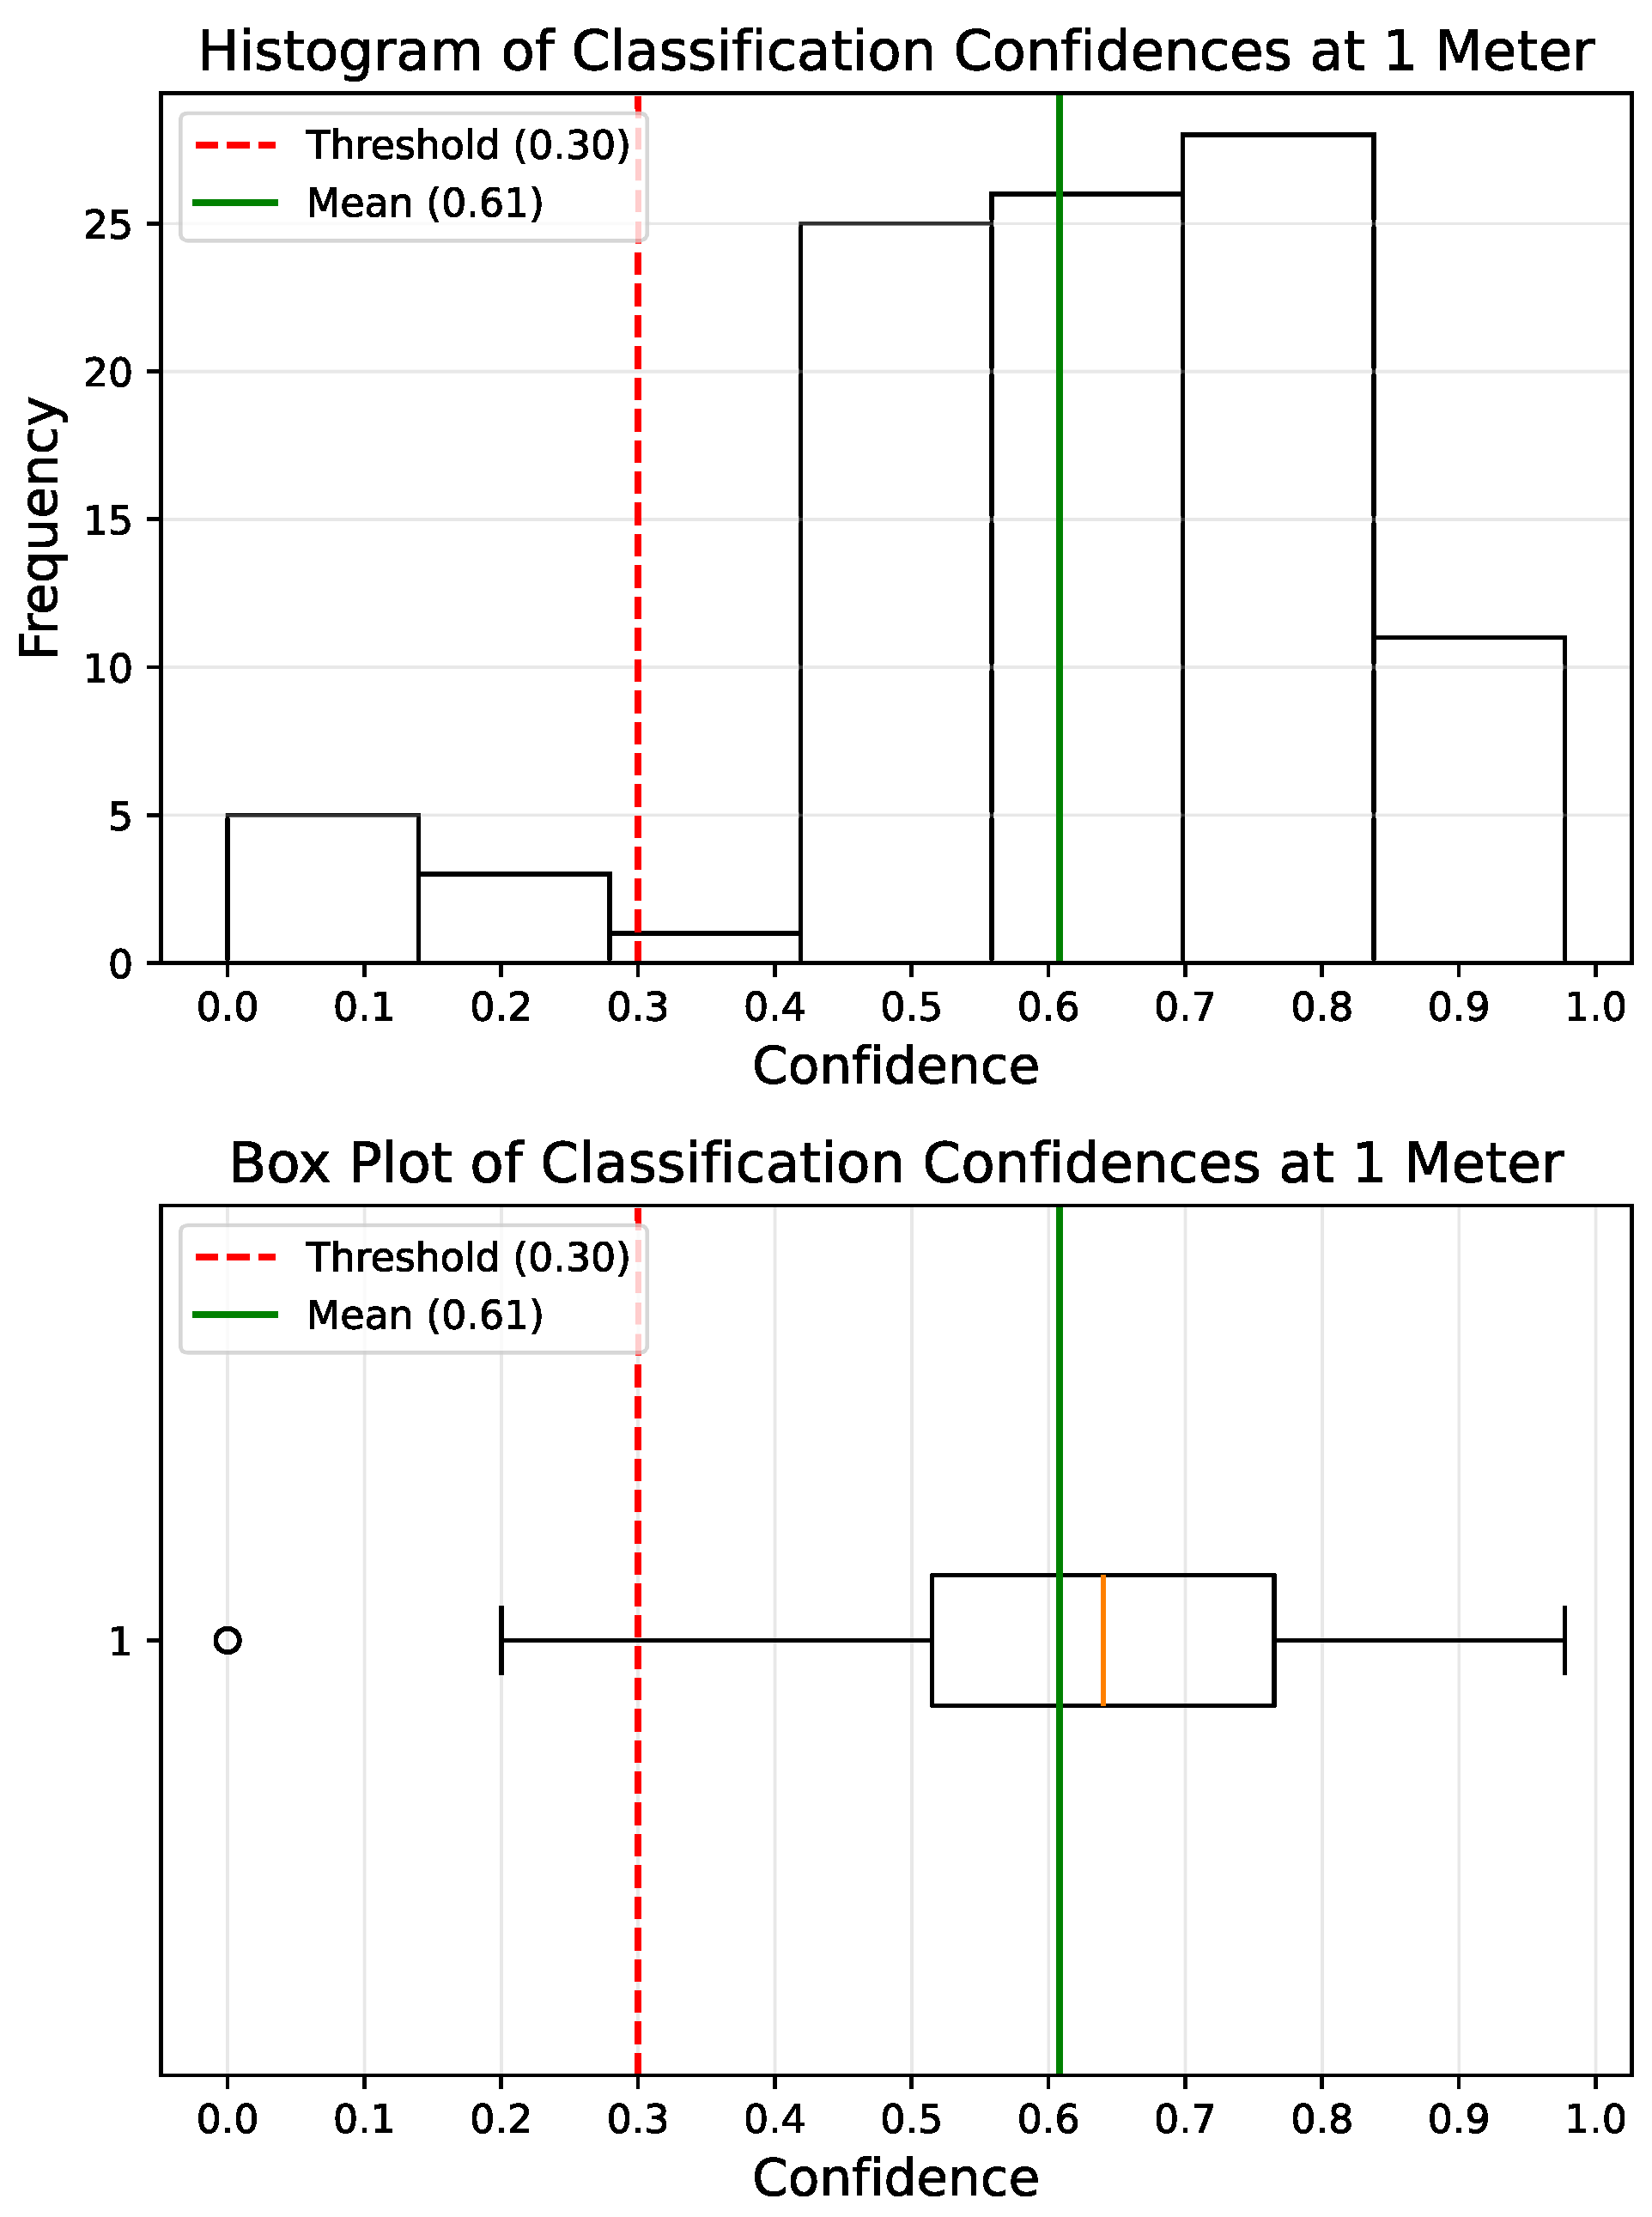
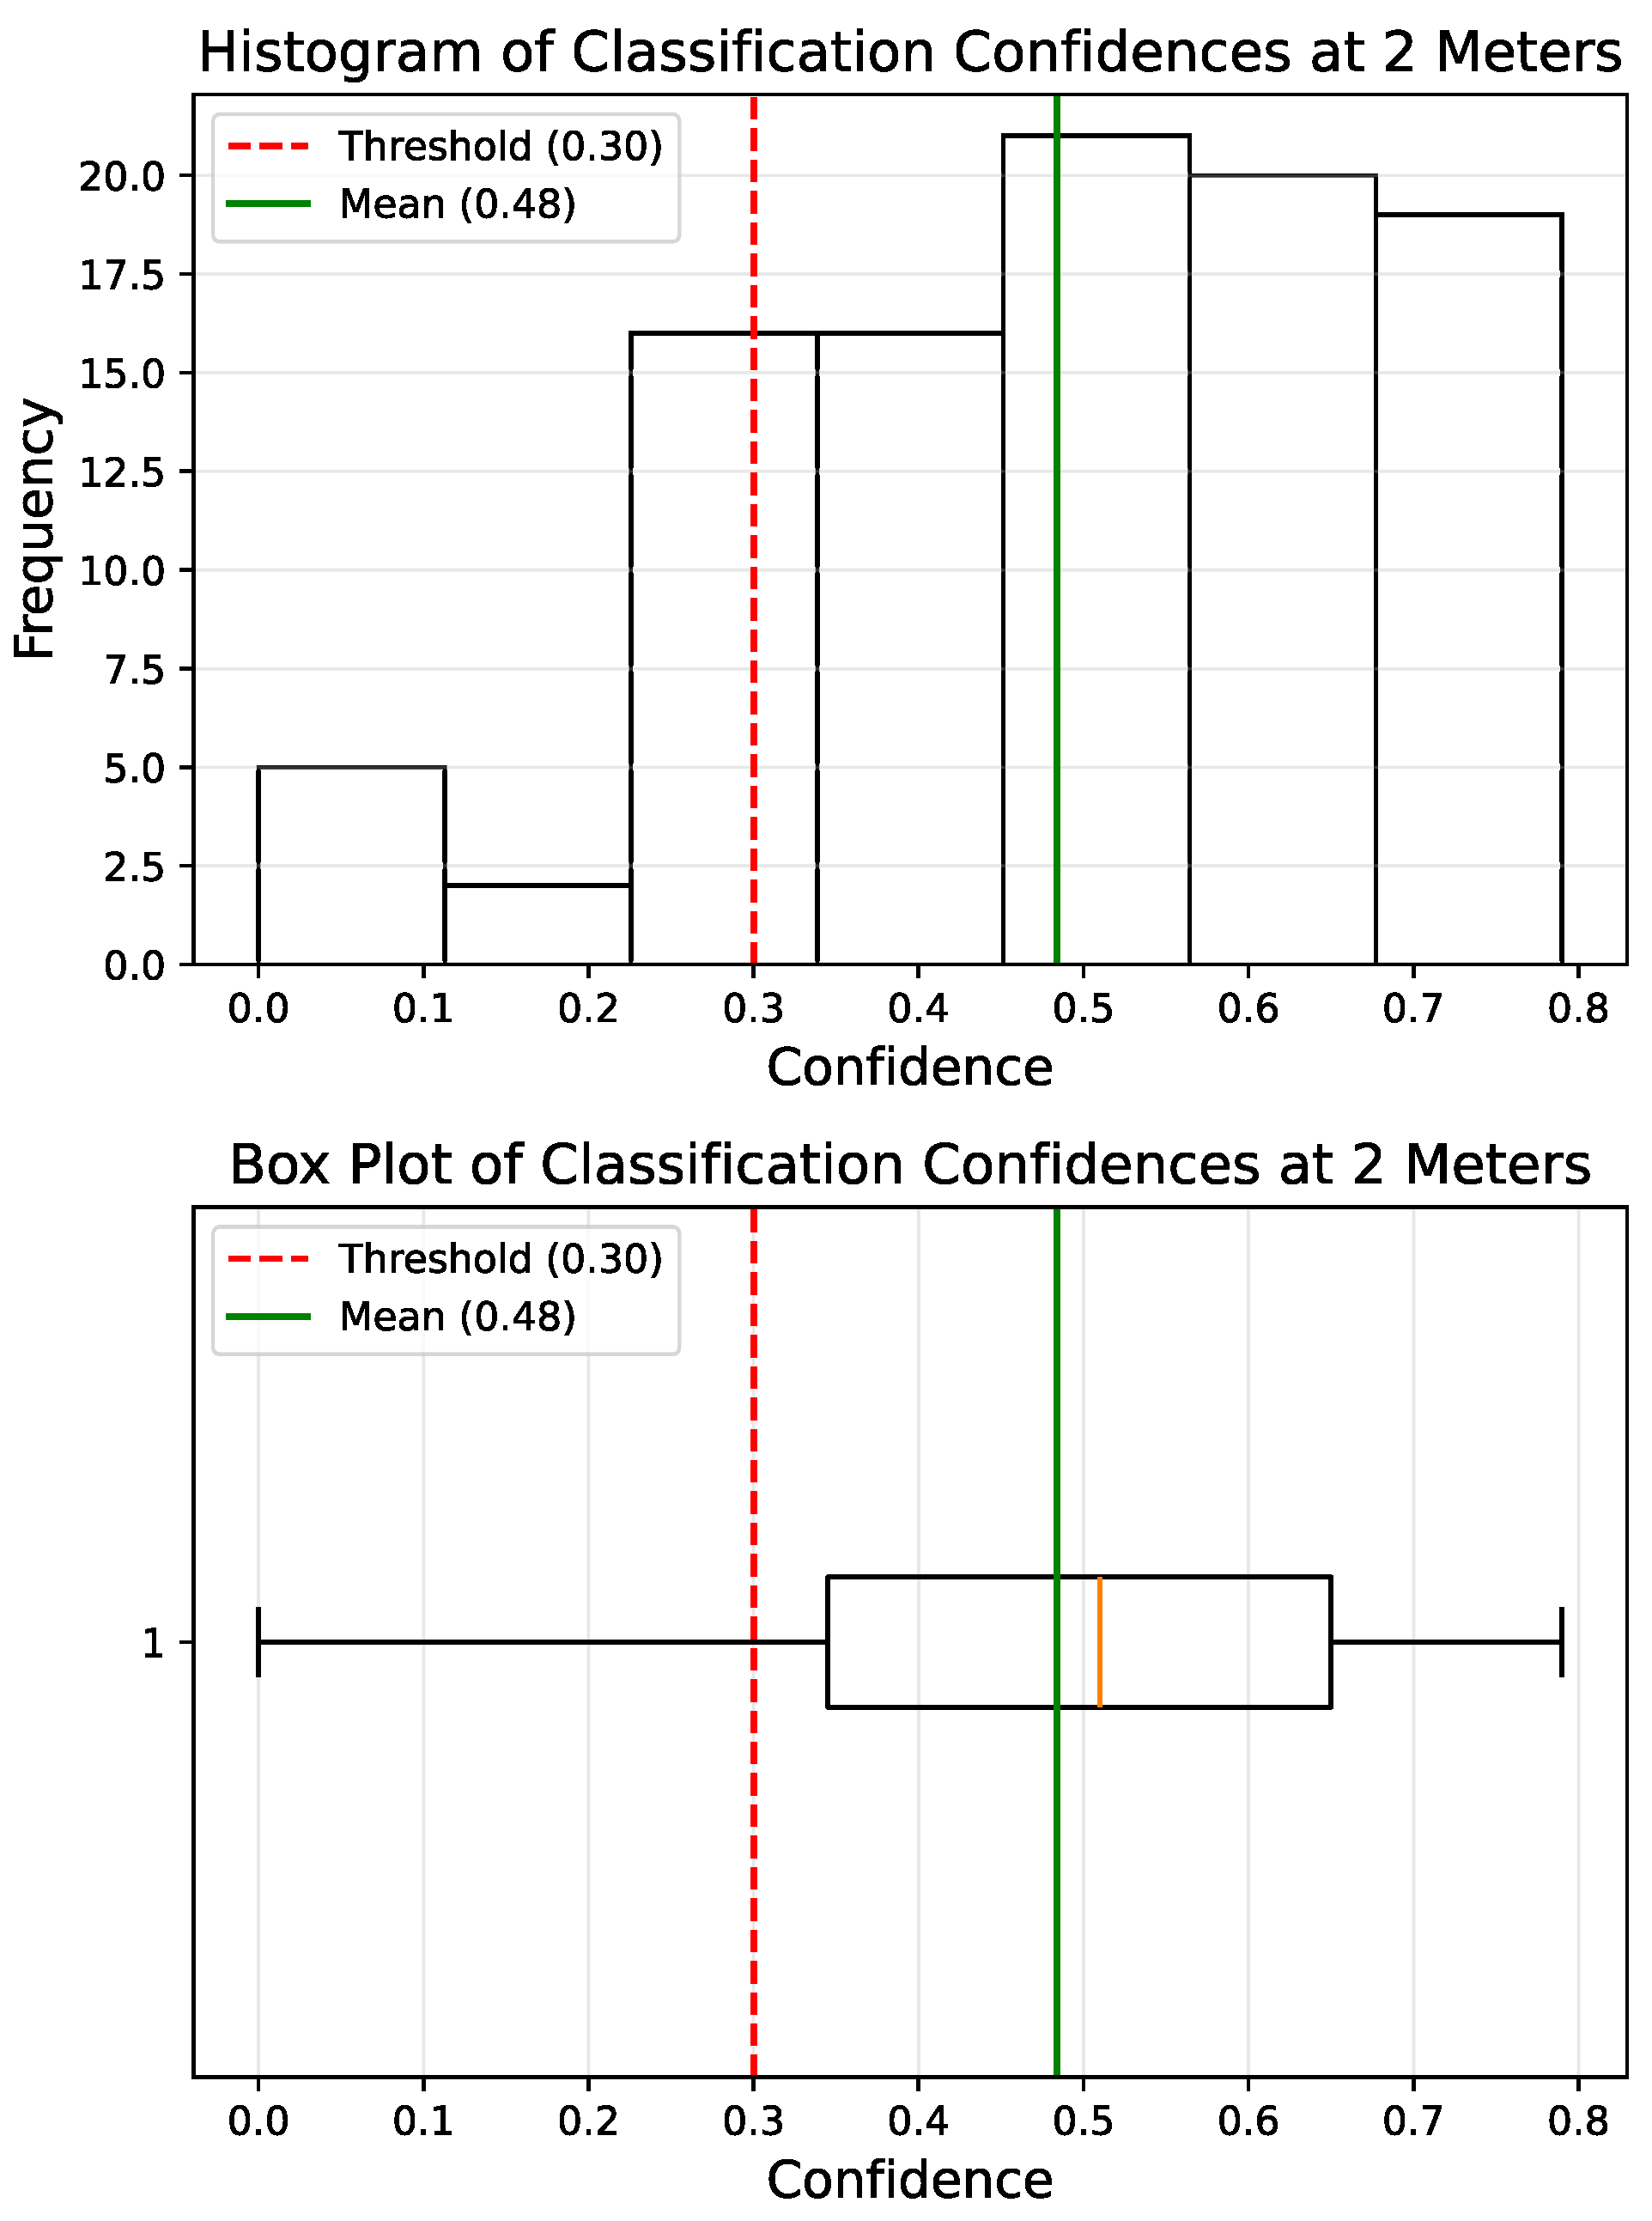
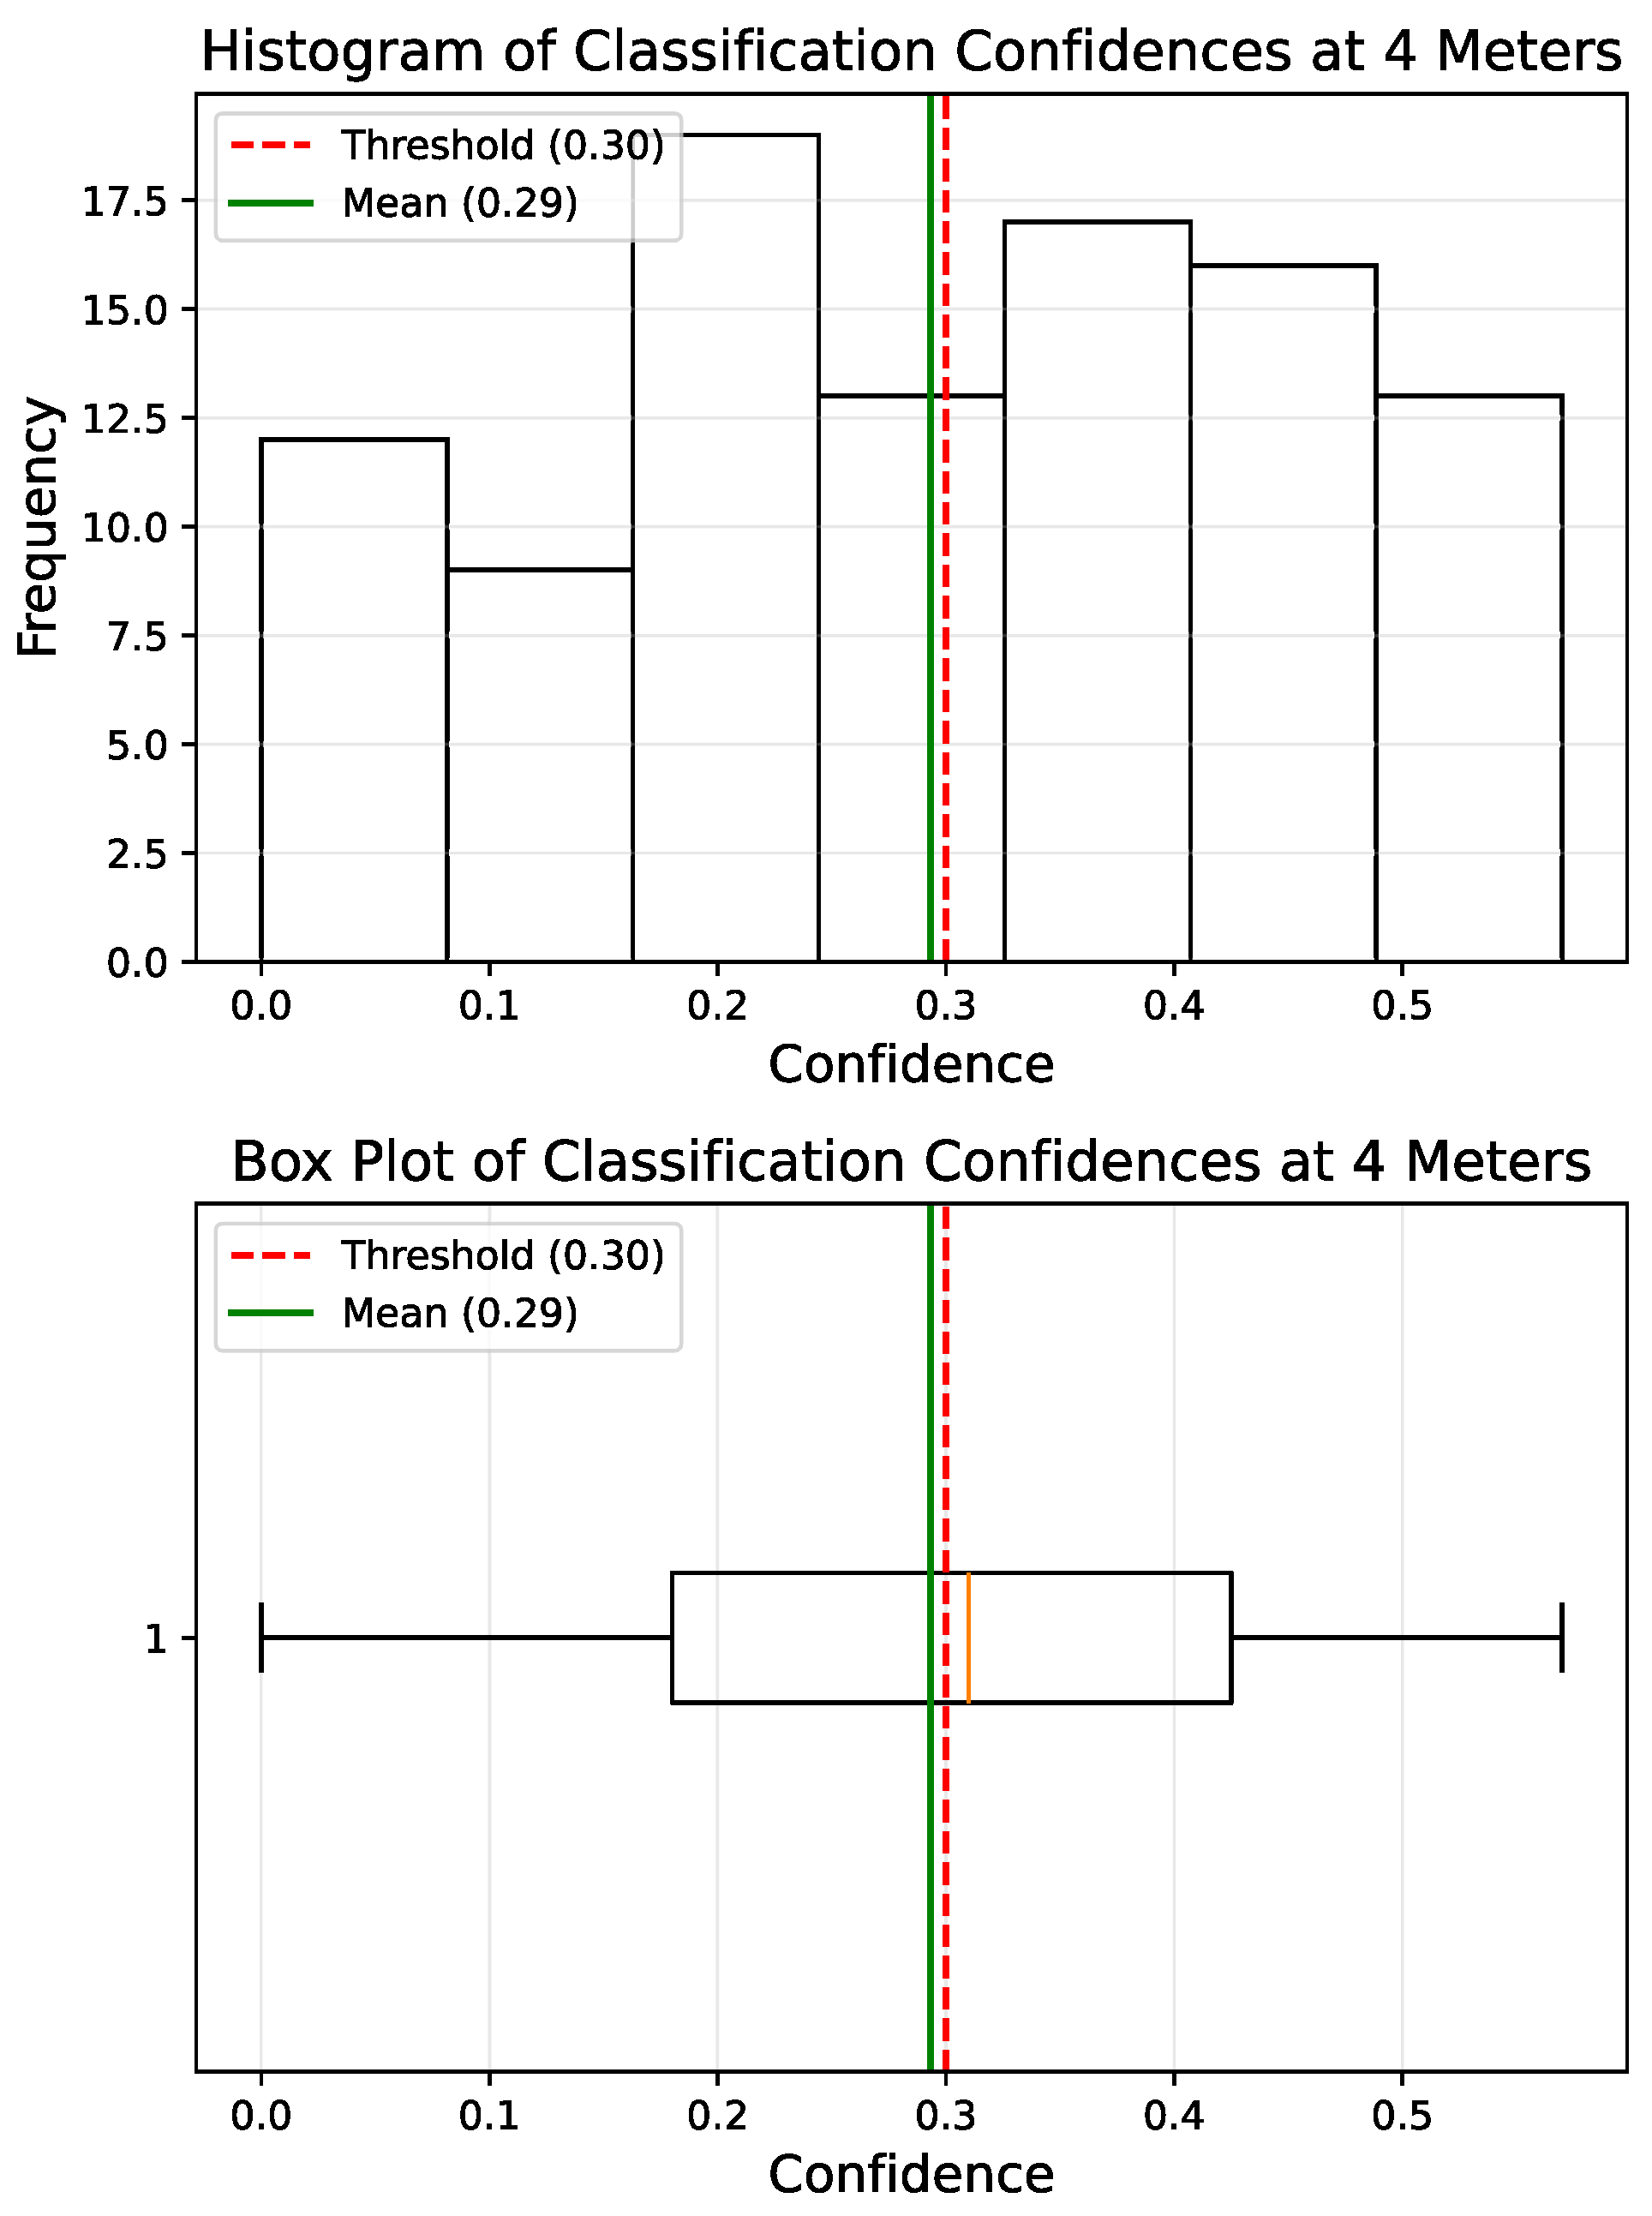
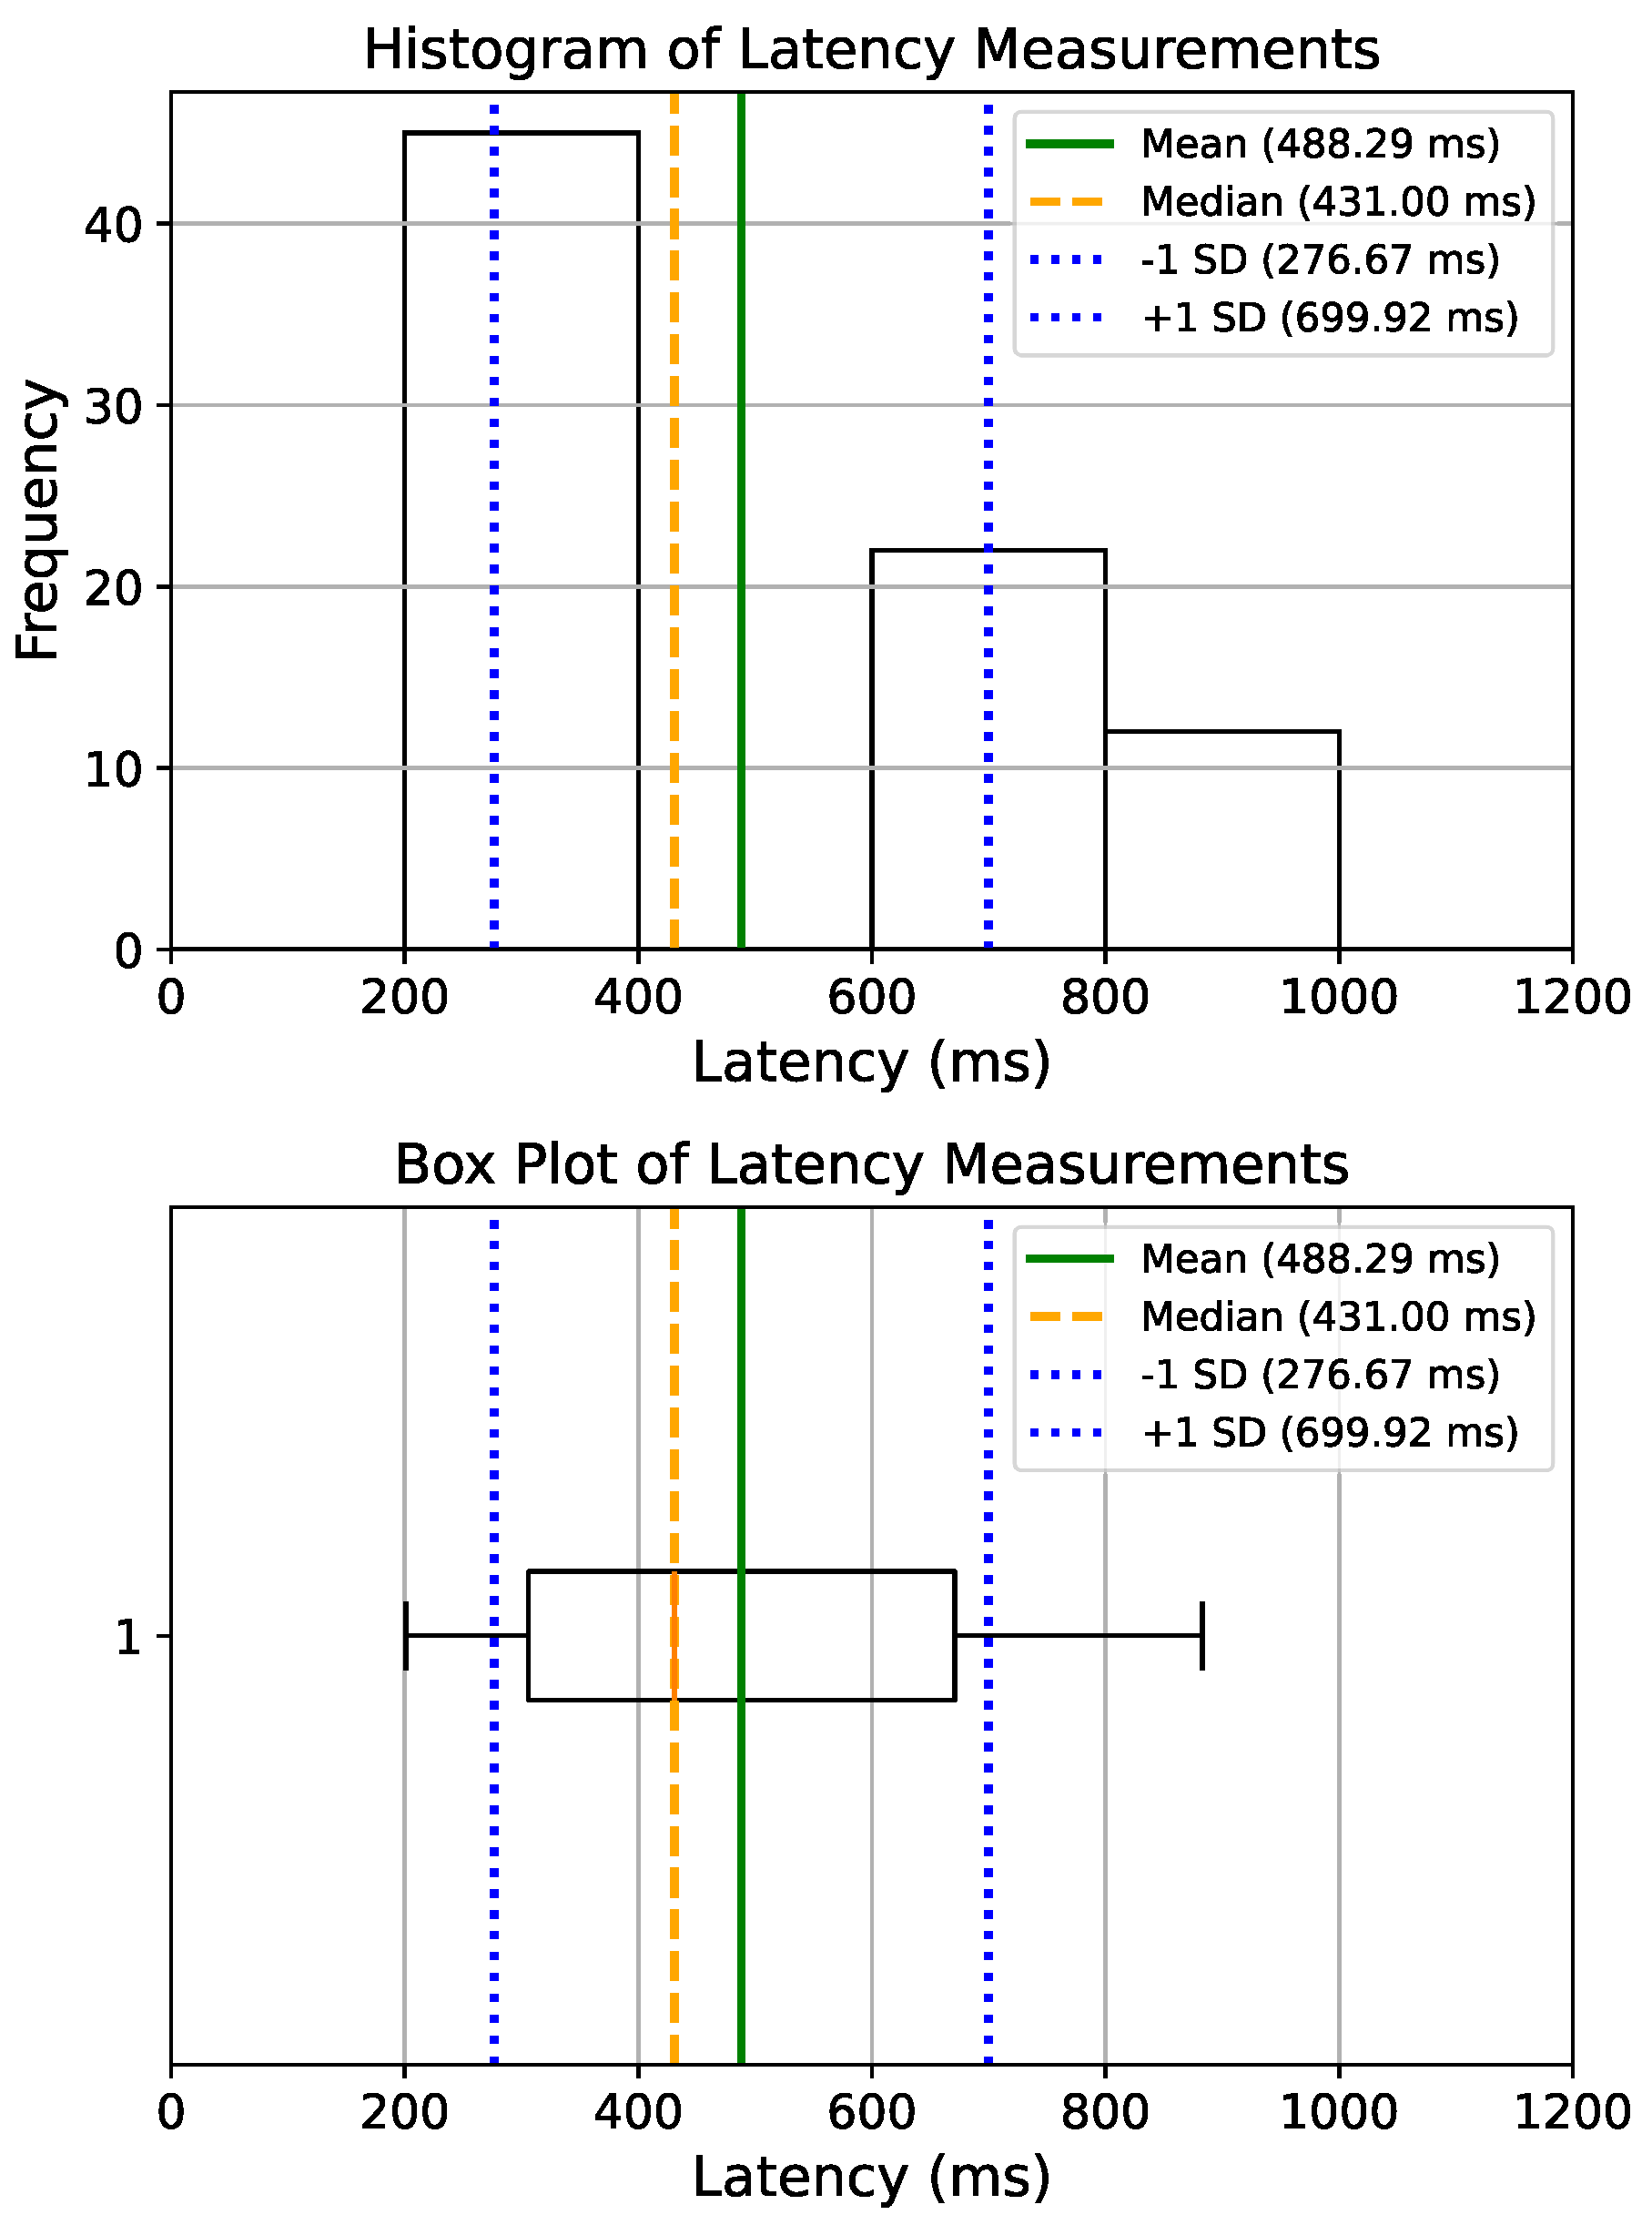
Figure 33, Figure 34 and Figure 35 present histograms and box plots of classification confidence values at 1, 2, and 4 m. These results show robust performance in personal and near space, with classification confidence declining substantially at far space.
At a ground-truth distance of 1 m, the ESP32-CAM delivered high classification confidence, with a mean of 0.608 and a median of 0.640. Variability was moderate (SD = 0.213, CV = 34.98%), and 90.9% of frames surpassed the 0.30 threshold. The few misses exhibited substantial shortfalls (mean = 0.199, max = 0.300), but these were rare. A one-sample t-test confirmed that average performance was significantly above the threshold ( p < 0.001 ), demonstrating robust near-field performance.
At a ground-truth distance of 2 m, performance declined but remained reliable. The mean confidence dropped to 0.484 (median = 0.510), with comparable variability (SD = 0.194, CV = 40.17%). Here, 81.8% of frames exceeded the threshold, while the number of misses nearly doubled compared to 1 m. Shortfalls for misses were smaller on average (mean = 0.121) than at 1 m, suggesting that many failures still produced borderline confidence values. The one-sample t-test again confirmed that mean confidence was significantly above threshold ( p < 0.001 ), supporting continued utility at this range.
At a ground-truth distance of 4 m, classification performance weakened markedly. The mean confidence fell to 0.293 (median = 0.310), straddling the threshold, while variability increased sharply (SD = 0.160, CV = 54.39%). Only 51.5% of frames exceeded the 0.30 threshold, reducing reliability to approximately chance level. Shortfalls for failed detections averaged 0.146, indicating consistent underperformance once the threshold was not met. Importantly, the one-sample t-test showed no statistically significant difference from the threshold ( p = 0.674 ), confirming that at this distance the ESP32-CAM cannot be relied upon for consistent detection. Nevertheless, classification becomes increasingly important as objects move closer to the user, where reliable identification provides critical context for safe and informed navigation.
Taken together, these results indicate that the ESP32-CAM performs reliably within the personal and near space zones (≤2 m), but becomes unsuitable for classification in the far space zone (≥4 m) without supplementary sensing or fusion strategies.

5.6. Feedback Latency Testing Protocol

Building on this classification analysis, the next step evaluates how quickly detected information is conveyed to the user through feedback modalities. Latency is defined as the elapsed time from the moment an object is detected—whether by the JSN-SR04T-2.0 UT sensor or the ESP32-CAM object classification—until the corresponding feedback modality is initiated. To quantify this, the test rig was configured to inject positive object detections and classifications, while voltage readings were recorded to capture the activation latencies of both output modalities. Latency was quantified as the mean deviation between recorded detection and feedback with n = 100 readings per trial.
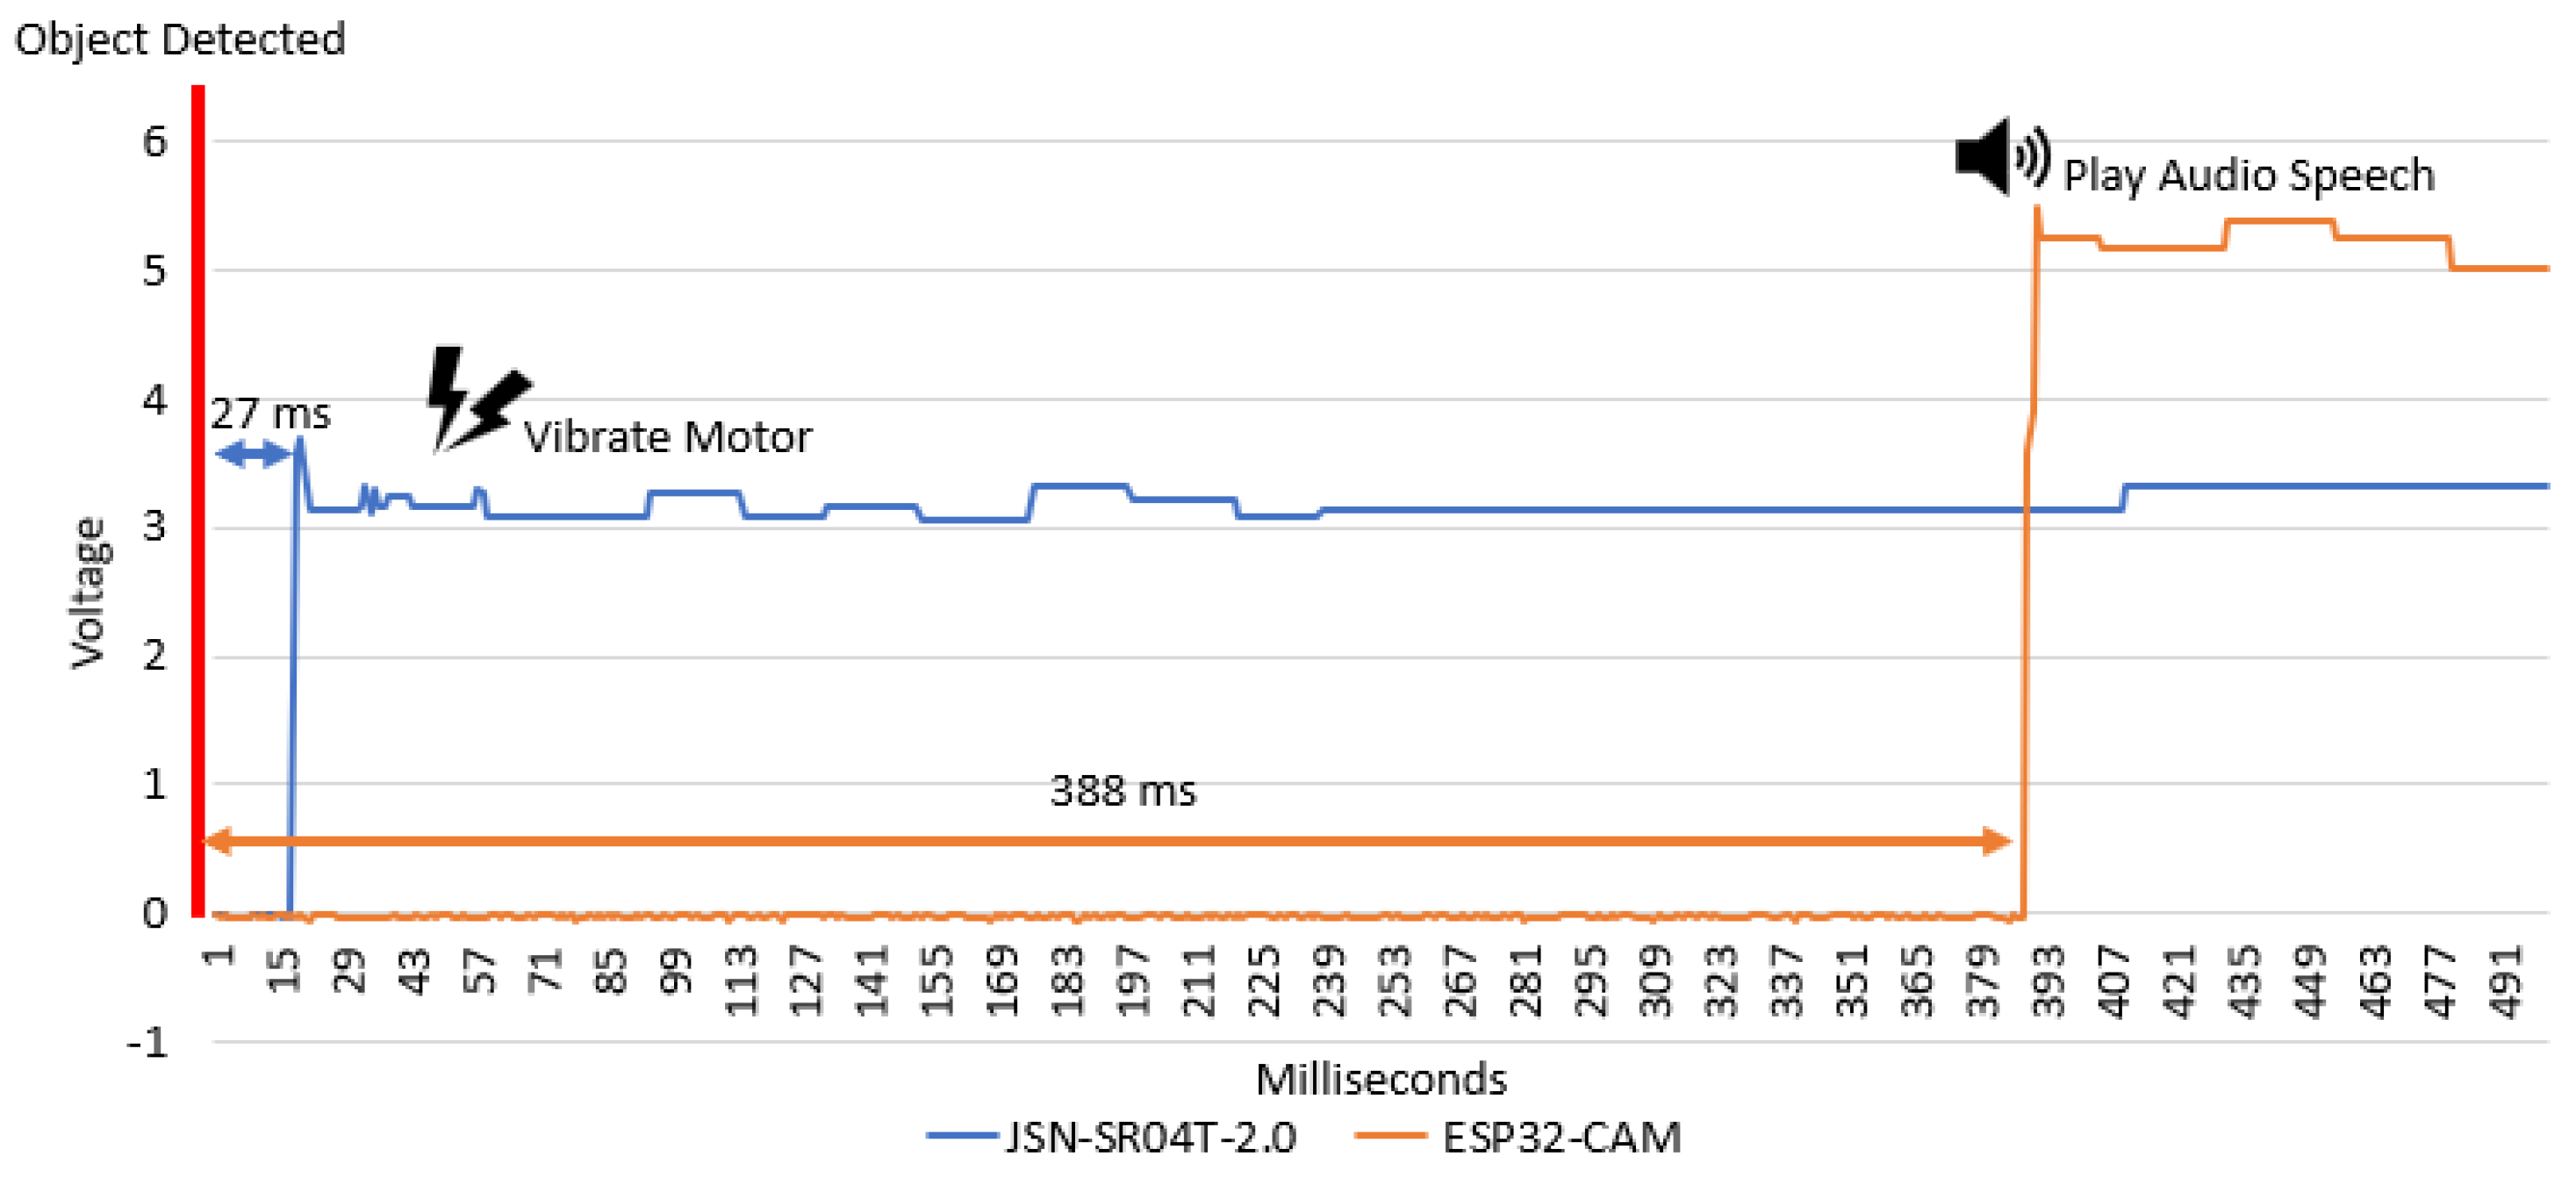
Figure 36 illustrates a representative example, showing voltage traces for the two modalities: the vibration motor driven by the UT sensor (response at 27 ms), and the audio speech output triggered by the ESP32-CAM classification (response at 388 ms). The results highlight the rapid response of the haptic pathway compared to the longer end-to-end latency associated with visual classification and audio output.

5.7. Latency Results

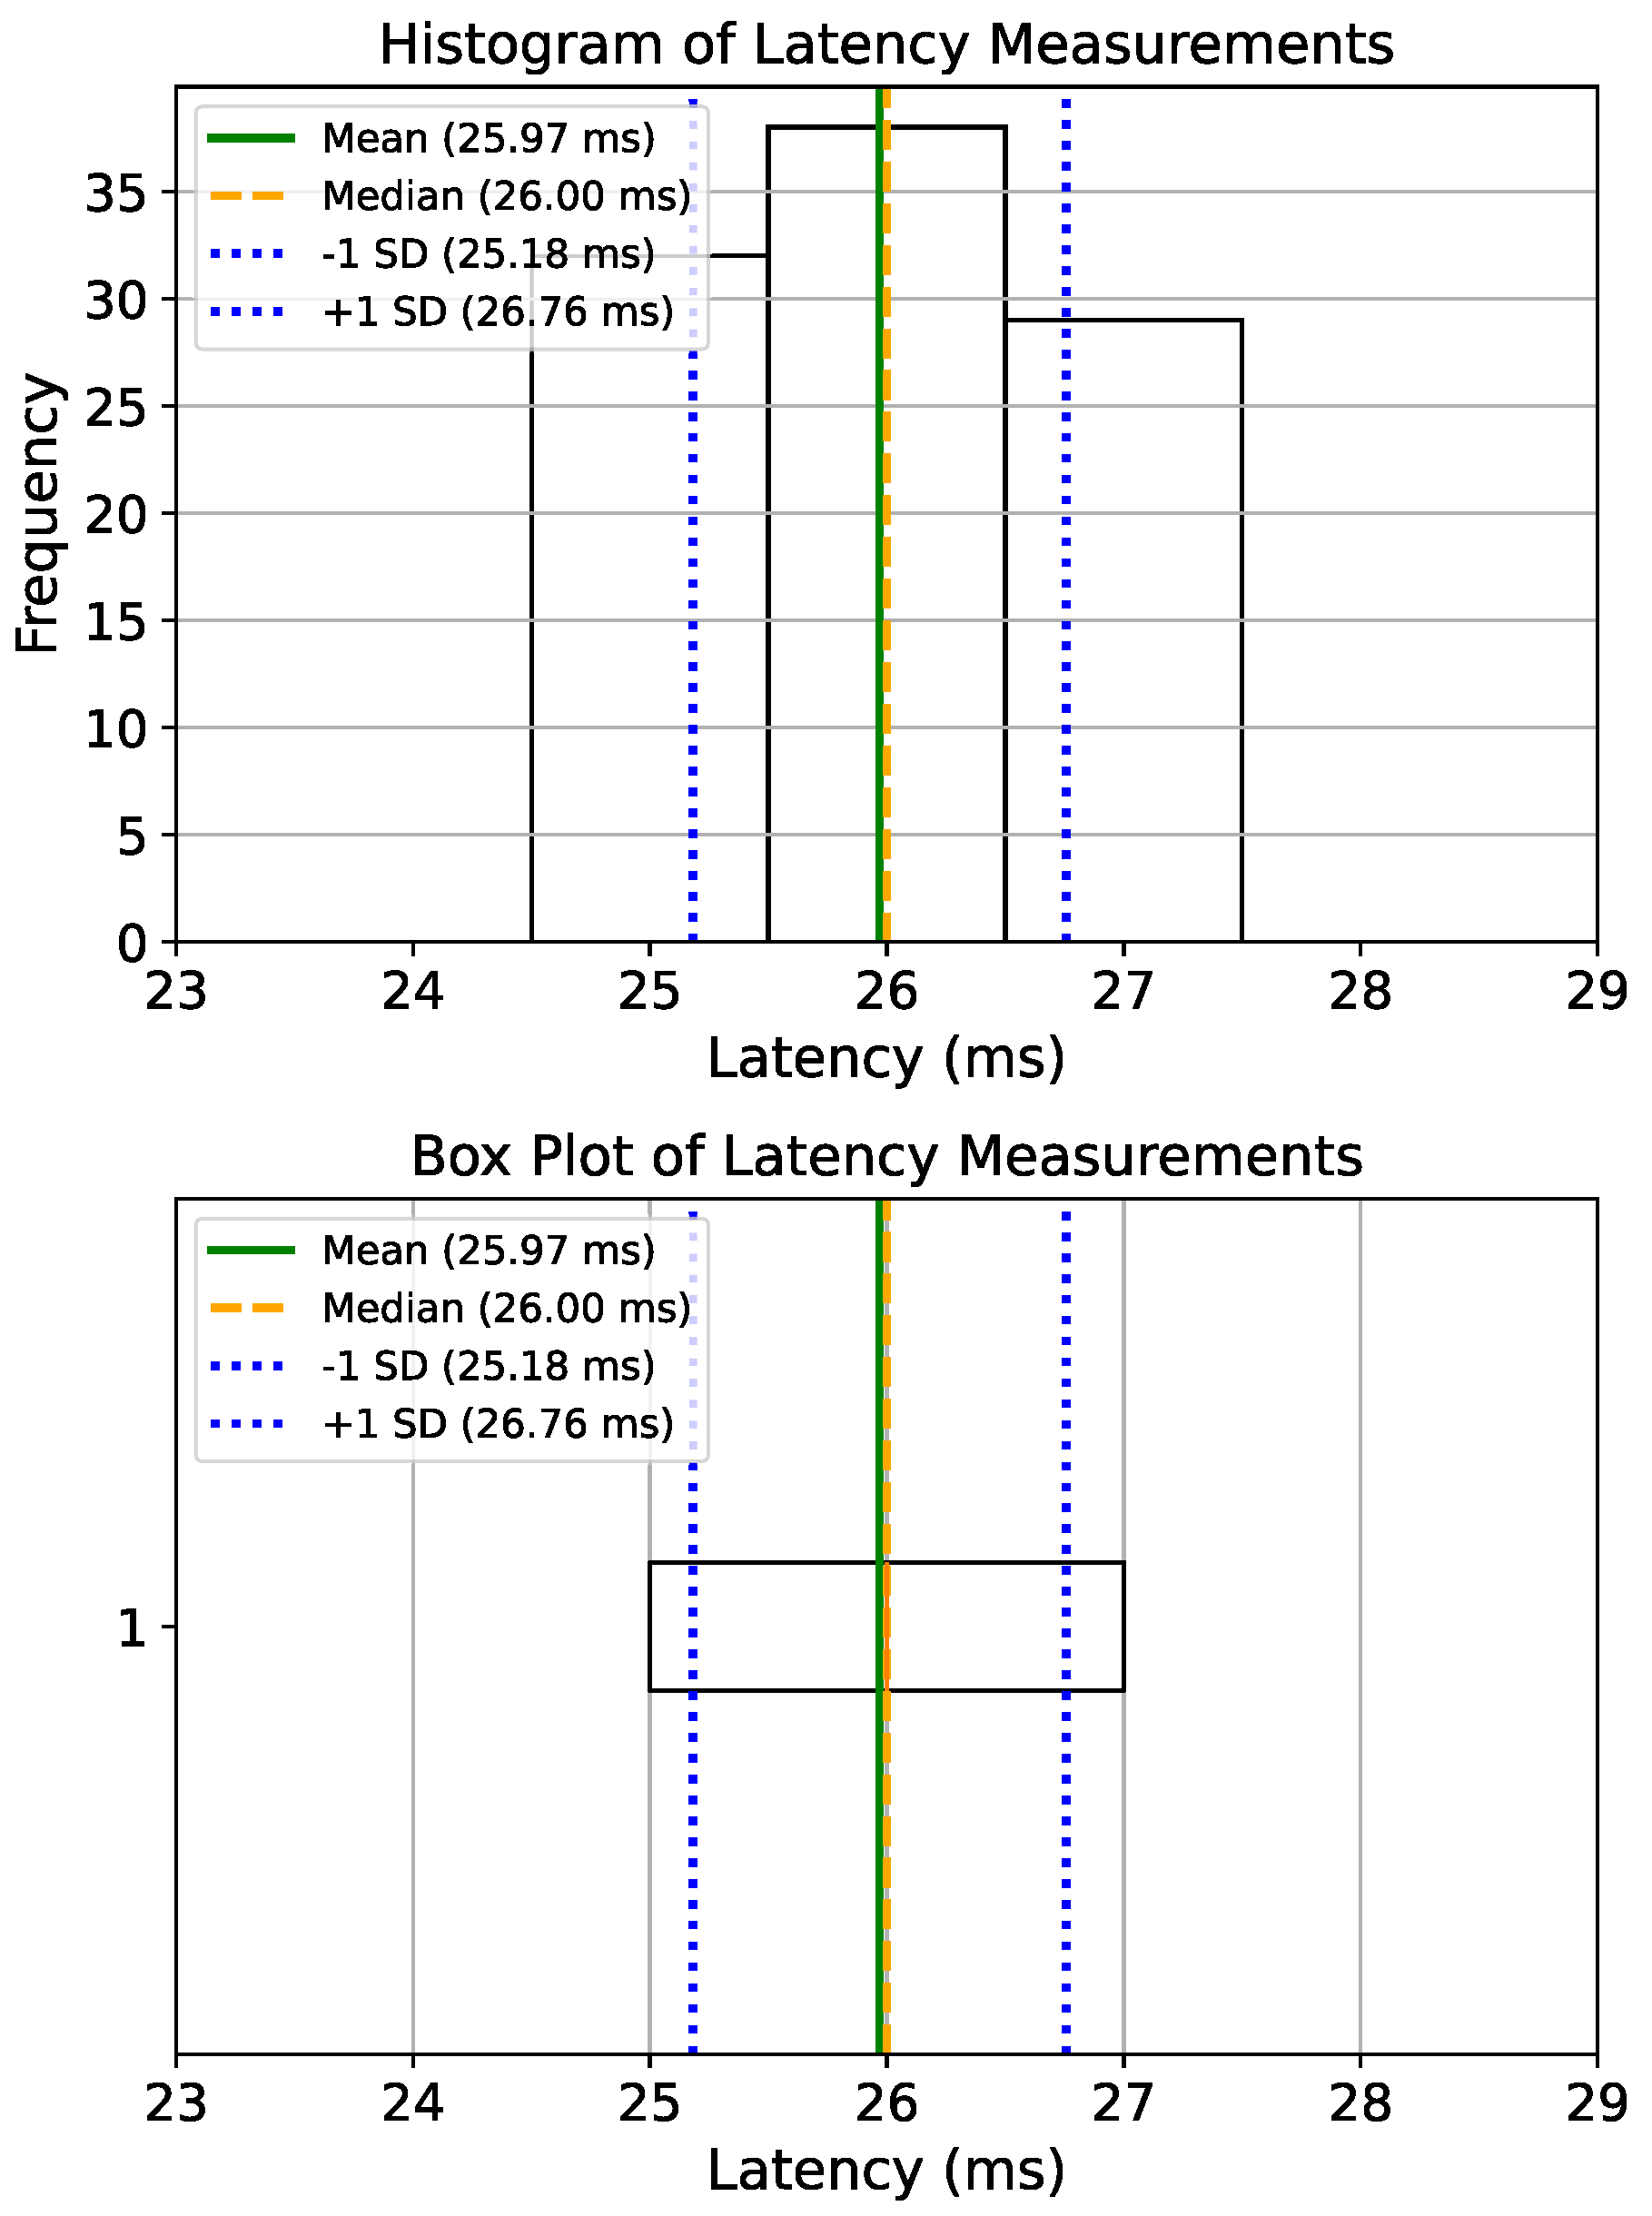
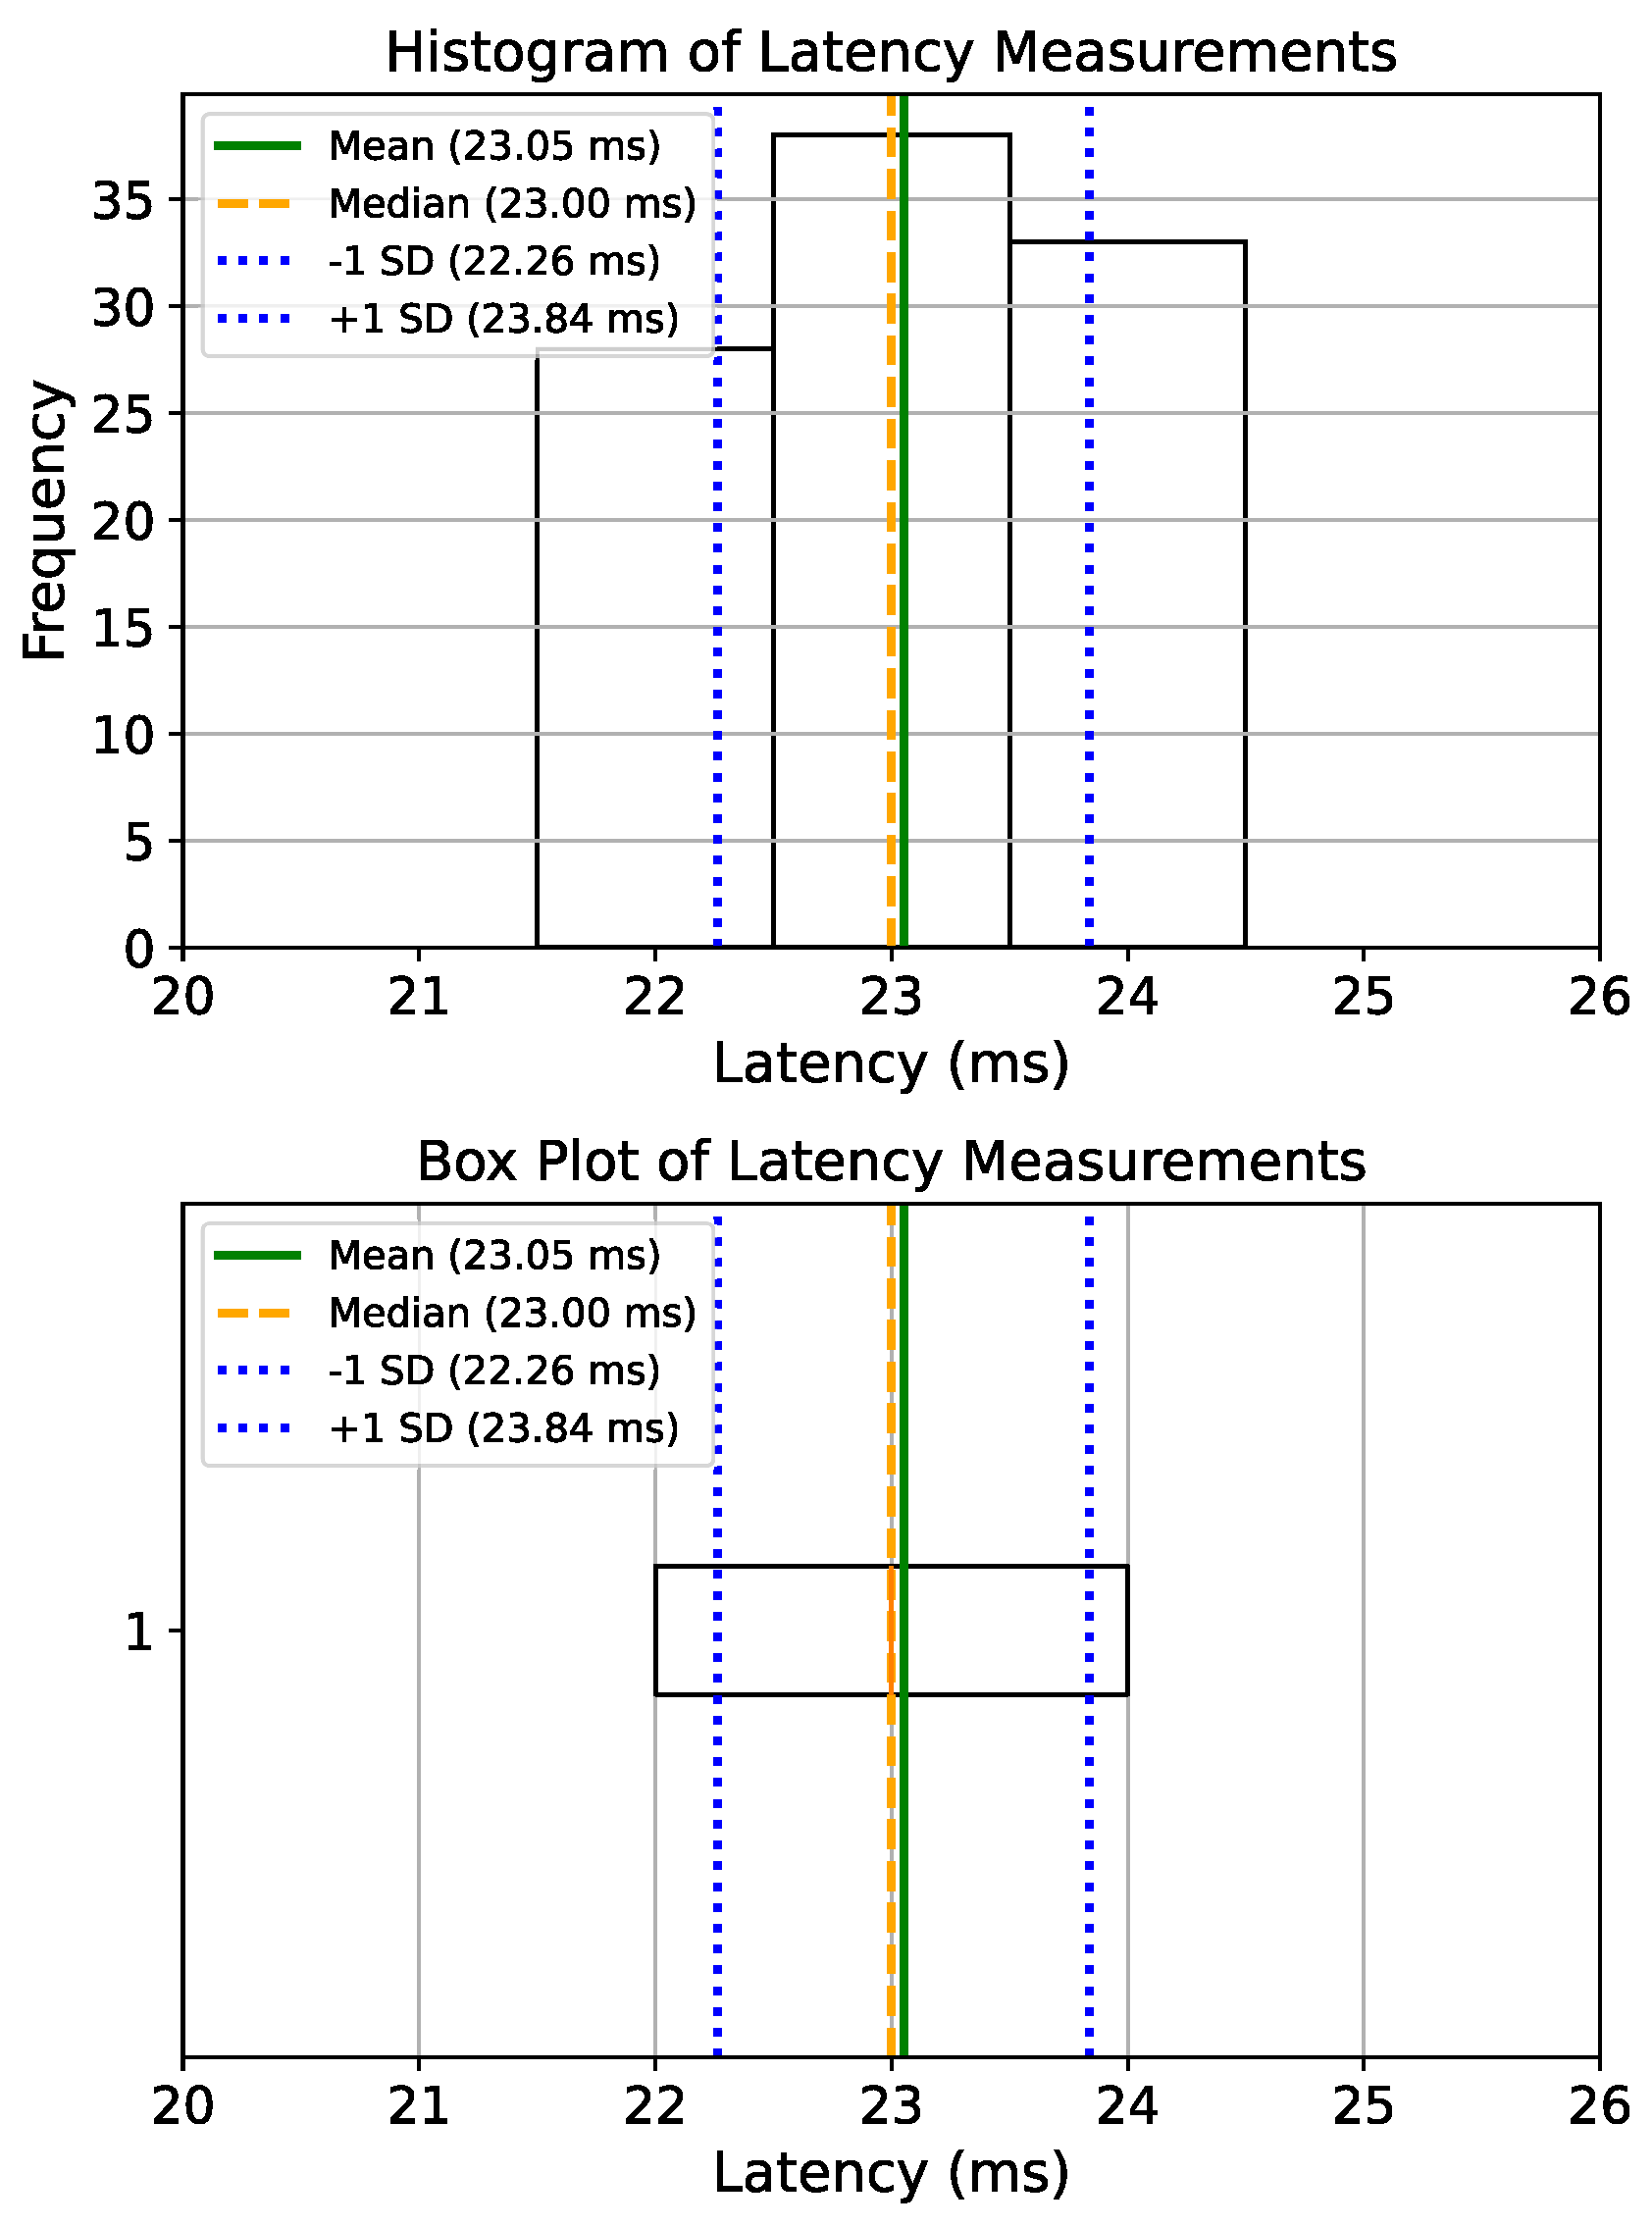
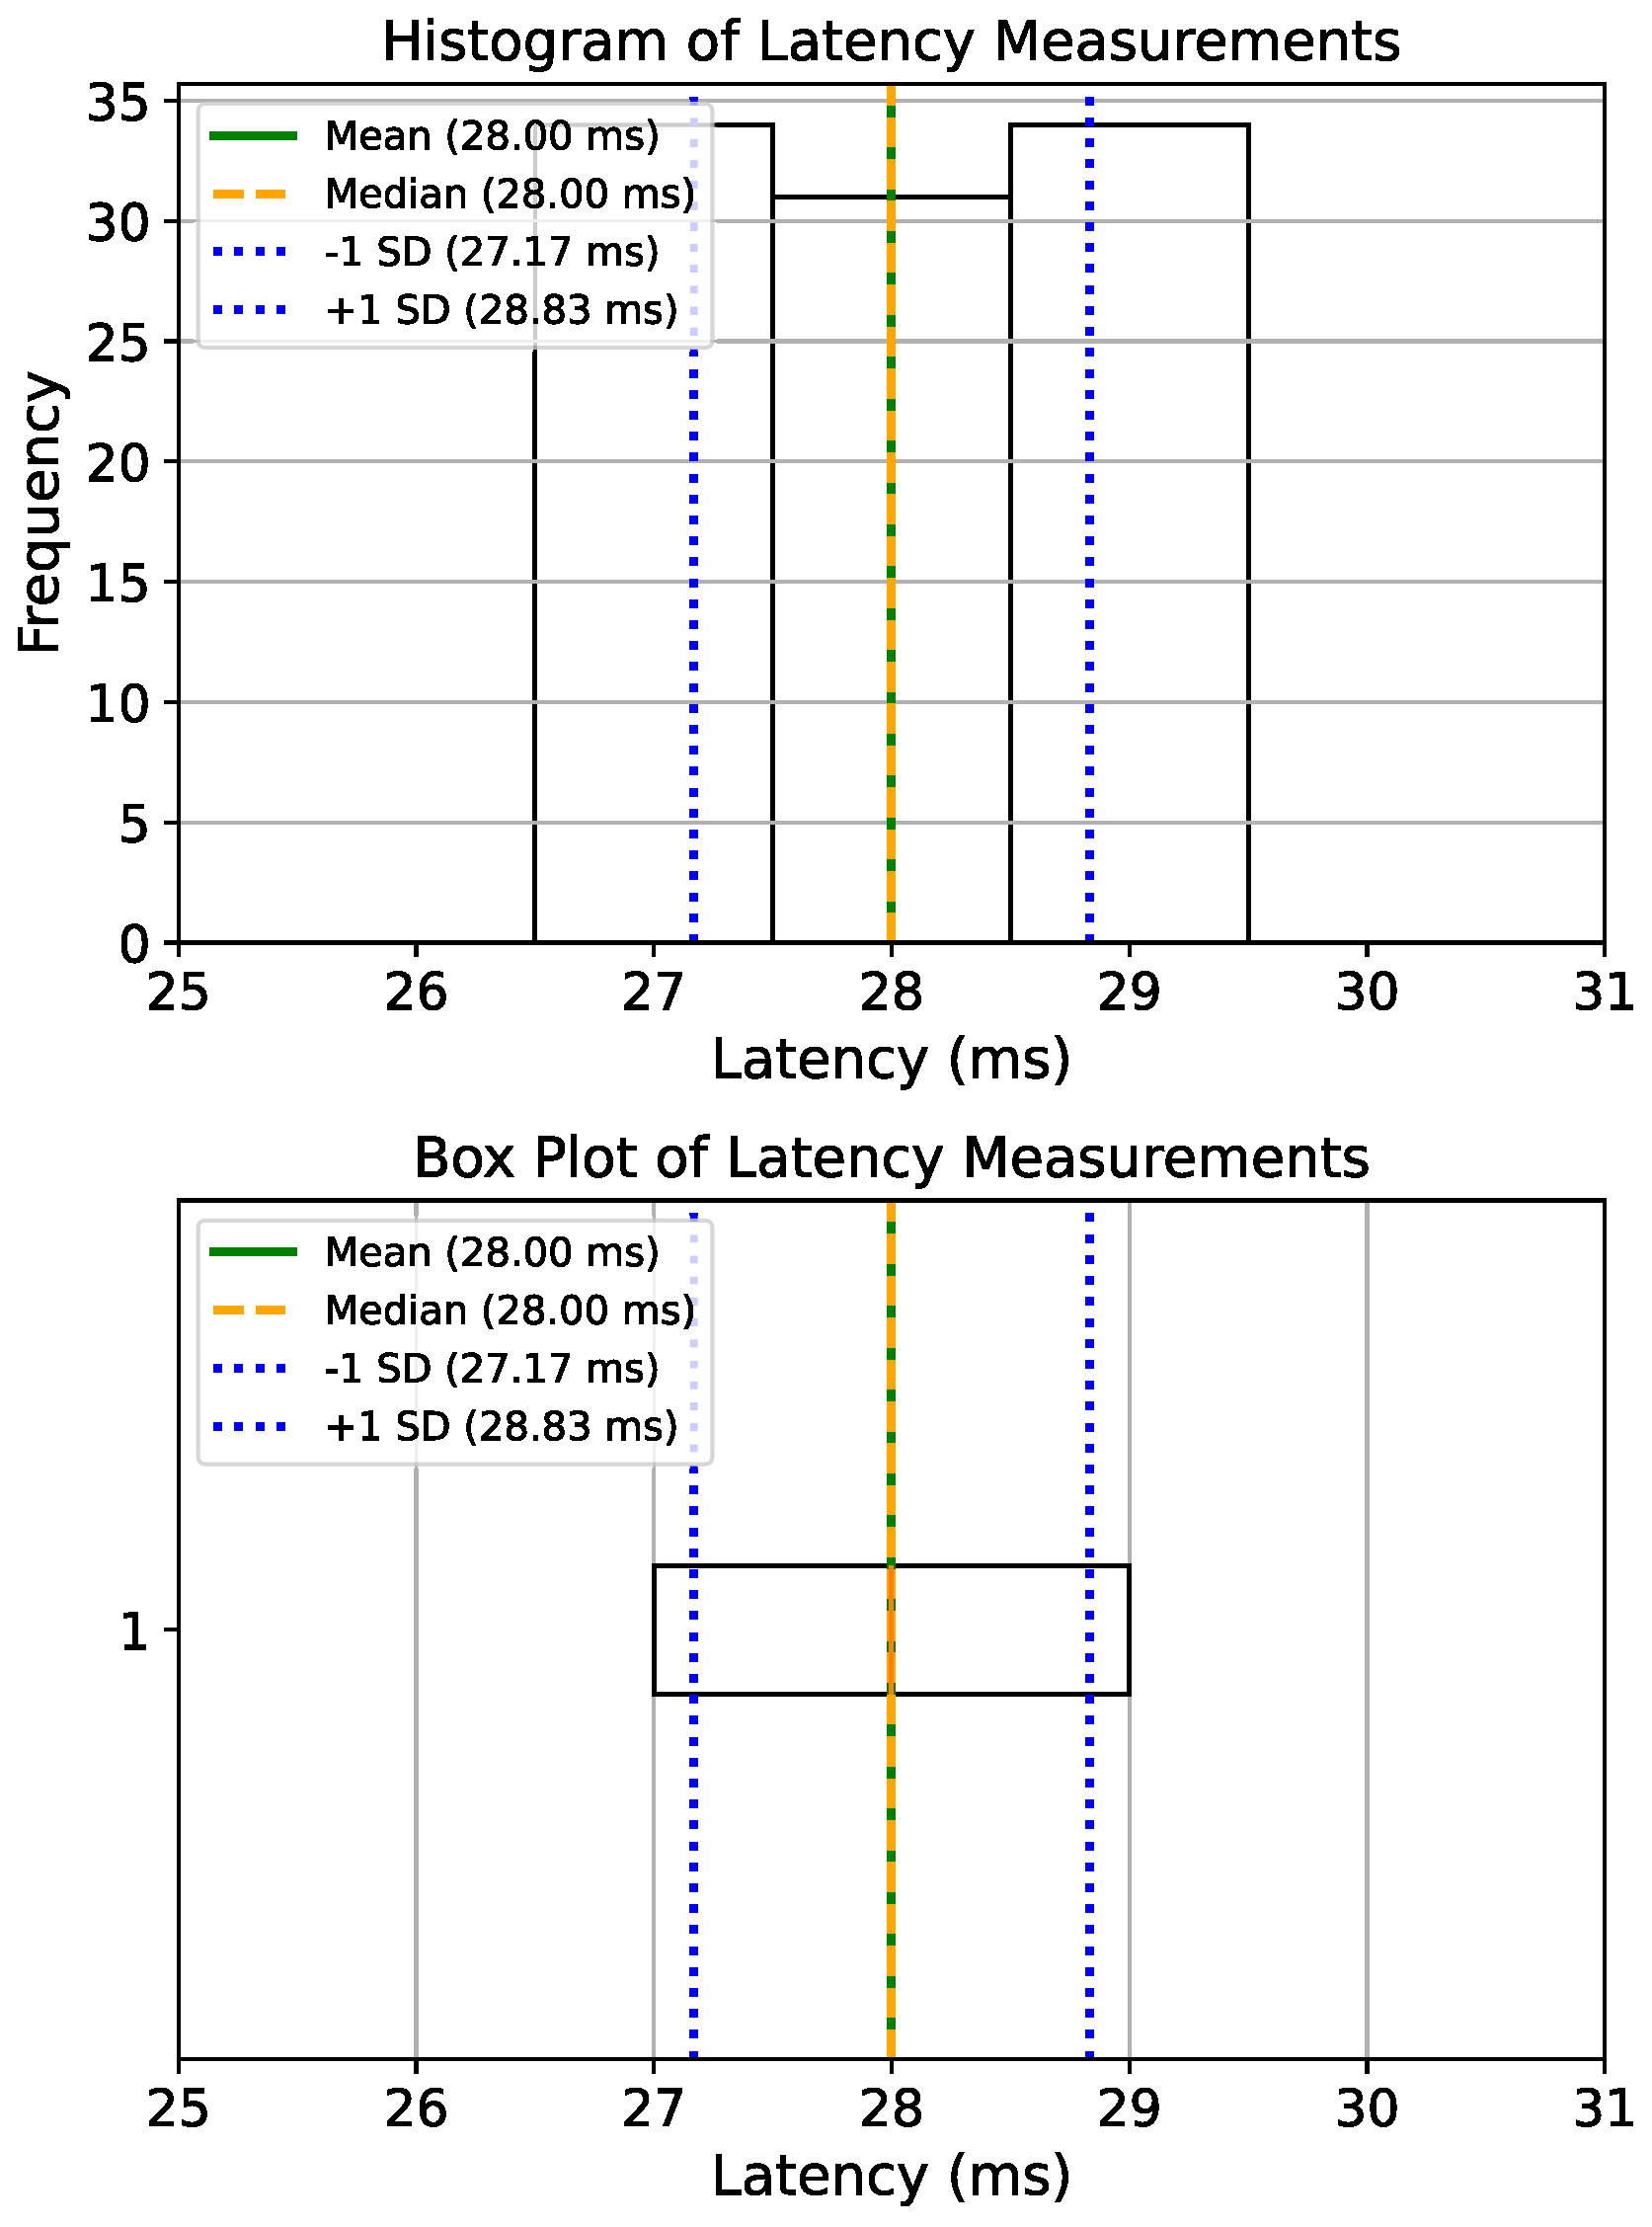
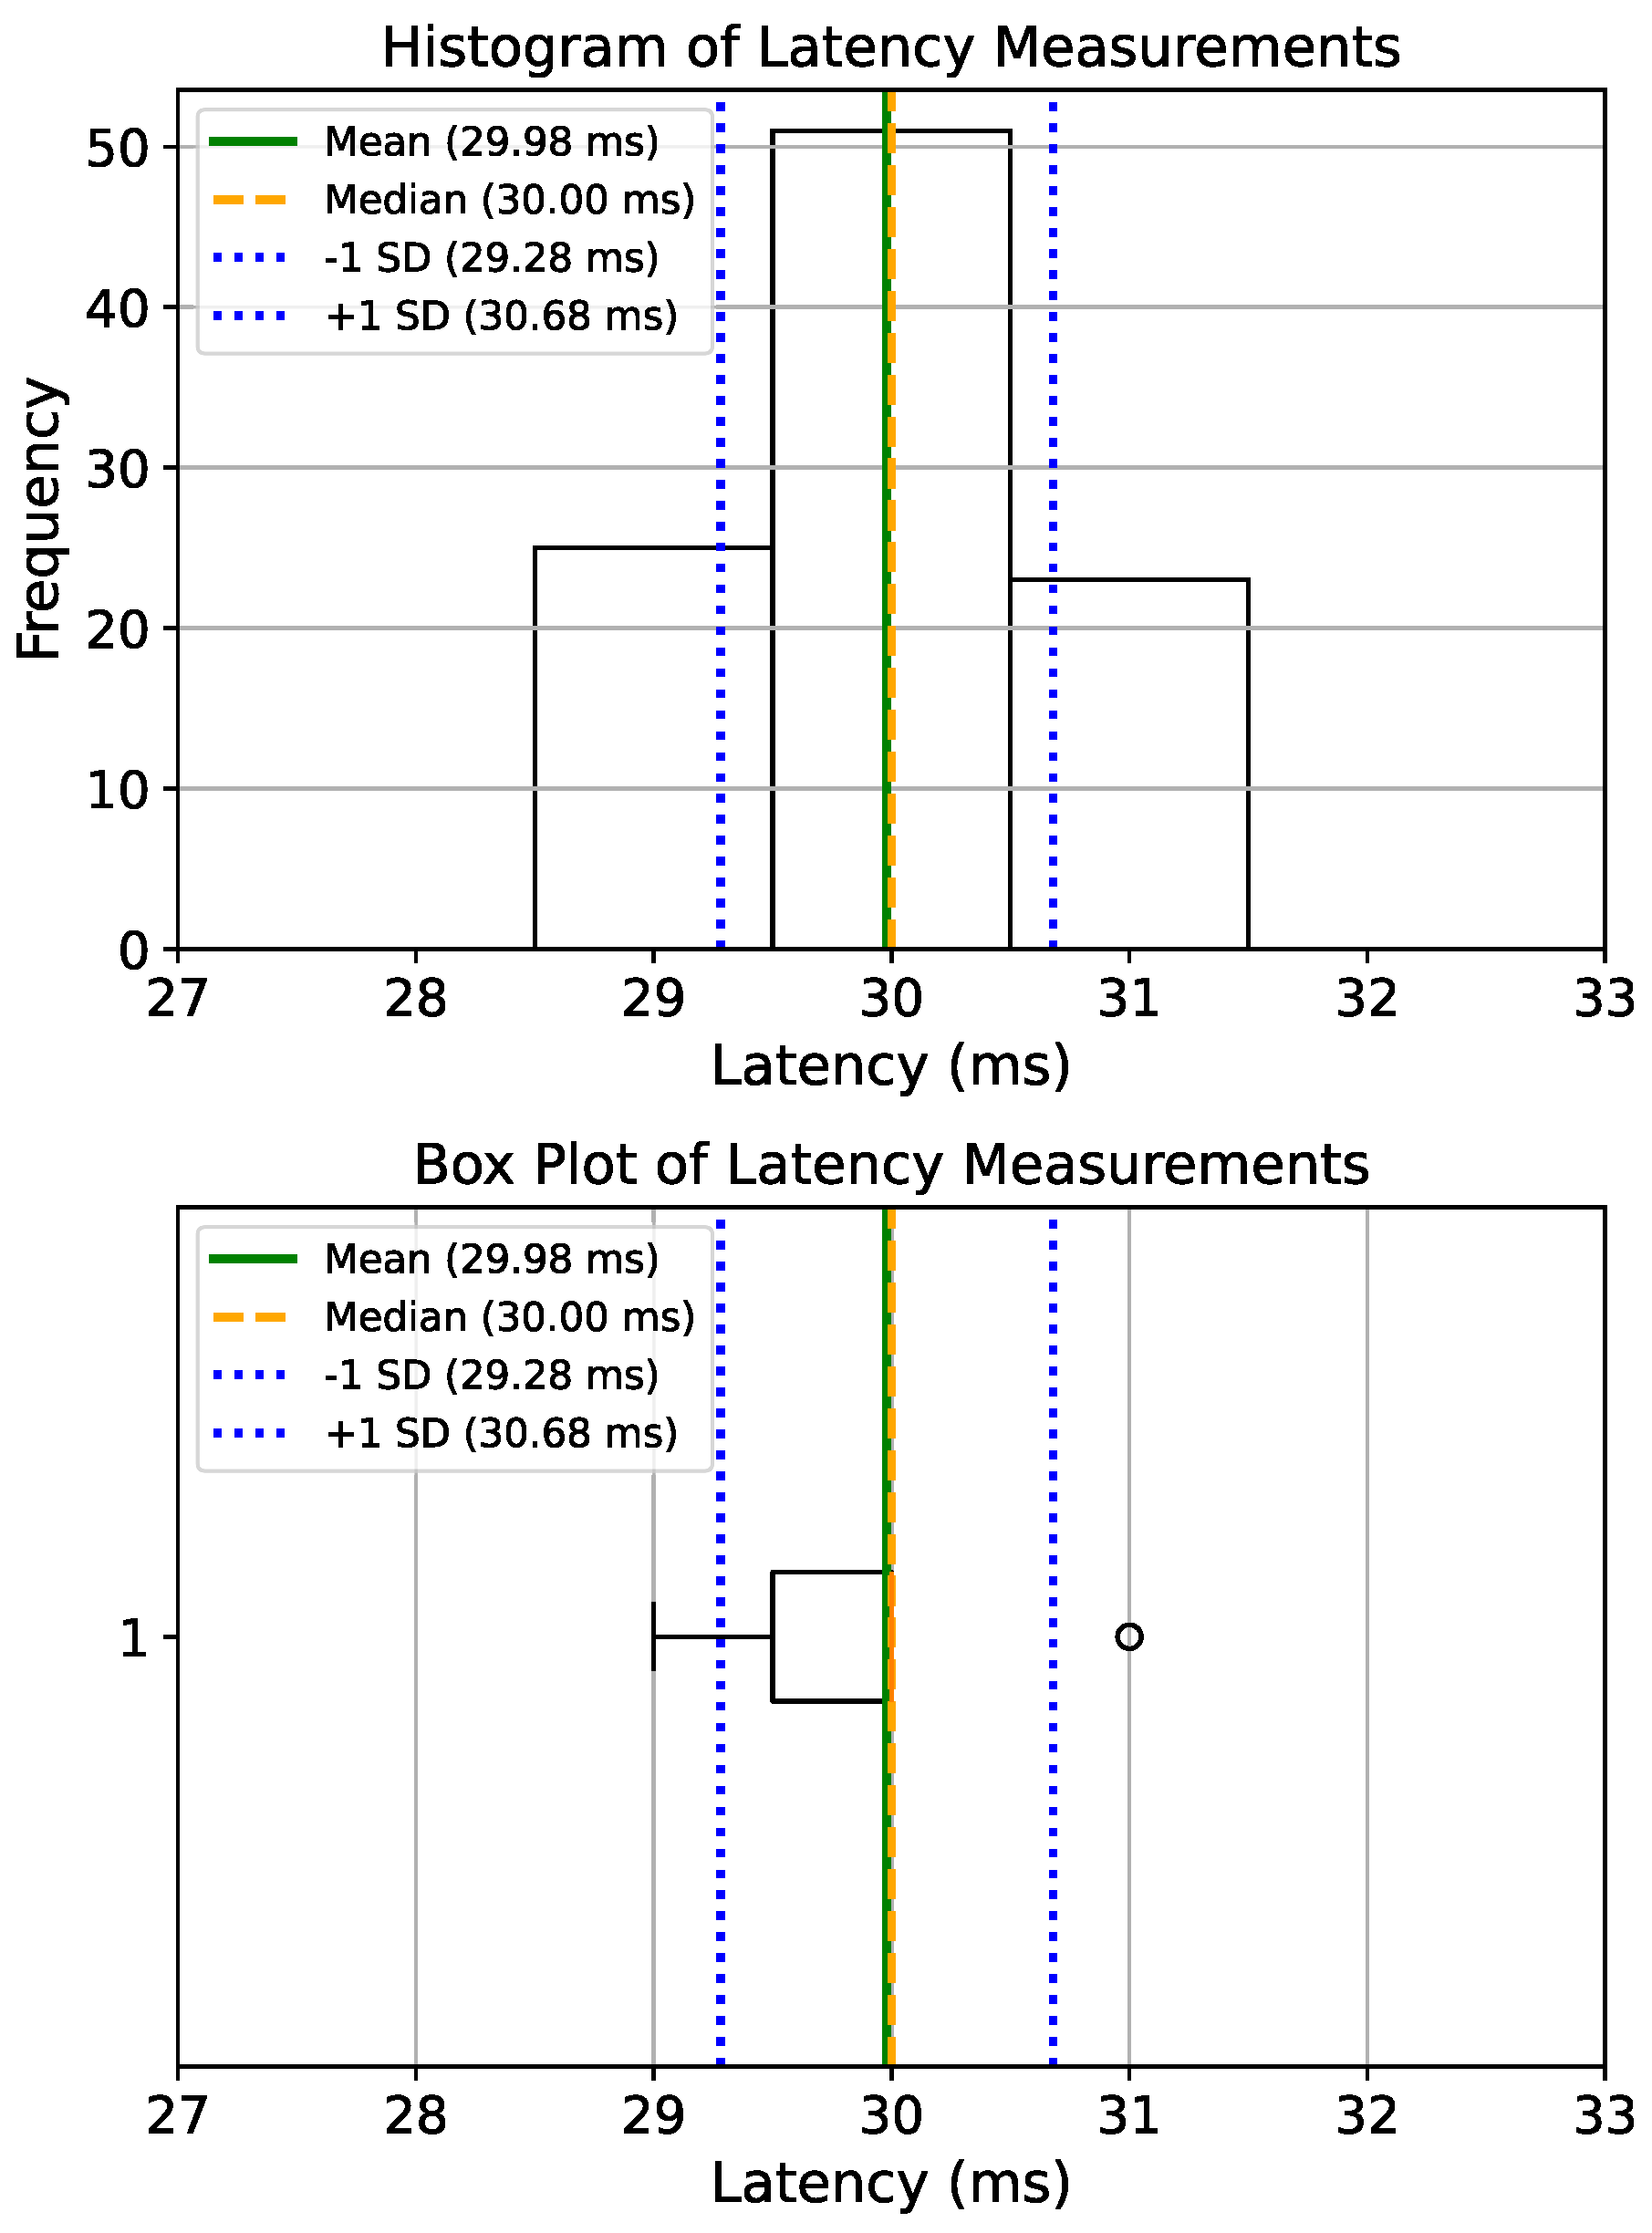
Figure 37, Figure 38, Figure 39, Figure 40, Figure 41 and Figure 42 summarize latency distributions across all nodes. The below sections synthesize these results according to each node.

5.7.1. Glasses Node Results

The JSN-SR04T-2.0 ultrasonic sensor driving the haptic output exhibited a mean latency of 25.97 ms (median = 26 ms, SD = 0.79 ms, CV = 3.04%), tightly constrained between 25–27 ms. A one-sample t-test against the nominal 26 ms reference showed no significant difference ( t = 0.382 , p = 0.703 ).
The ESP32-CAM classification-to-audio pathway displayed longer delays owing to image acquisition and processing overheads, with a mean latency of 488.29 ms (median = 431 ms, SD = 211.63 ms, CV = 43.34%), spanning 201–883 ms. No significant deviation from the 500 ms reference was detected ( t = 0.550 , p = 0.583 ). Importantly, the classification output is designed to enrich the user’s situational awareness rather than support immediate proxemic hazard detection; therefore, while shorter latencies are advantageous, rapid response time is not operationally critical for this pathway.
Together, these results demonstrate a clear trade-off between speed and informational richness: the ultrasonic–haptic pathway provides near-instantaneous warnings, while the camera–audio pathway delivers slower but semantically richer feedback.

5.7.2. Belt Node Results

The Belt node’s dual TFMINI Pro LiDAR sensors driving paired haptic motors achieved sub-25 ms latencies. For the front LiDAR, mean = 22.99 ms (median = 23 ms, SD = 0.51 ms, CV = 2.20%), and for the rear LiDAR, mean = 23.05 ms (median = 23 ms, SD = 0.79 ms, CV = 3.42%). Both one-sample t-tests confirmed no significant differences from the 23 ms reference ( p > 0.52 ).
These nearly identical results confirm that the Belt node produces stable, symmetrical tactile feedback from both forward and rear detection zones, ensuring consistent spatial awareness.

5.7.3. Cane Node

The Cane node’s two TFMINI Pro LiDAR sensors triggered audio buzzers with latencies well below perceptual thresholds. For LiDAR 1, mean = 28.00 ms (median = 28 ms, SD = 0.83 ms, CV = 2.97%), range 27–29 ms; for LiDAR 2, mean = 29.98 ms (median = 30 ms, SD = 0.70 ms, CV = 2.33%), range 29–31 ms. LiDAR 2 showed a small but statistically significant 2 ms increase ( t = 28.159 , p < 0.001 ); however, the difference remains negligible operationally.
Both outputs, therefore, provide real-time auditory cues (<30 ms), maintaining the ETA’s requirement for rapid, synchronized user feedback.

6. Discussion

The results confirm that each ETA node—Glasses, Belt, and Cane—achieved low-latency performance and high measurement accuracy consistent with the system’s design goals. Across all tests, the mean feedback latency for proximity-based sensors remained under 30 ms, satisfying the threshold for real-time interaction. The Glasses node’s ultrasonic–haptic pathway provided near-instantaneous alerts (25.97 ms), while its camera–audio pathway introduced longer response times (≈488 ms) due to image capture and classification delays inherent to embedded vision. The Belt node’s dual LiDAR–haptic channels (≈23 ms) demonstrated symmetrical feedback between front and rear sensors, enhancing situational awareness in both directions. The Cane node achieved similar rapid response, with LiDAR–audio latencies of 28–30 ms, supporting continuous ground-level coverage.
Importantly, the proposed ETA’s obstacle-detection thresholds operate at decimetre-scale boundaries based on Hall’s proxemic framework, and all obstacle-avoidance decisions are governed by these coarse spatial zones rather than millimetre-level deviations. Consequently, small systematic differences—such as a 5–6 mm bias—do not alter feedback timing or system behaviour and have no meaningful impact on user safety.
Table 5 summarizes five representative multi-sensor, multi-modality, and multi-region ETA systems. Reported accuracy values are omitted due to the heterogeneity of experimental methods—such as user-based path tracking, obstacle detection, and object classification—across the selected studies.
This qualitative comparison highlights that, based on Hall’s proxemic framework, the proposed ETA is the only system achieving full spatial coverage across the head, torso, and legs through a unified multi-sensor, multi-modal, and multi-placement configuration. This architecture ensures continuous perception and consistent feedback across proxemic zones, addressing the spatial fragmentation present in earlier designs.
These results demonstrate that the ETA architecture effectively balances responsiveness and perceptual richness through multi-modal pathways. Fast ultrasonic and LiDAR feedback ensure immediate hazard alerts, while slower vision-based cues provide semantic context—mirroring how individuals with visual impairment integrate quick reflexive and higher-order cognitive responses. Compared with single-node or single-modality ETAs in the literature, the tri-node configuration significantly expands field of view and redundancy. Each node functions autonomously, enabling localized perception and feedback even if another node fails, addressing the fragility noted in prior multi-part systems.
From a proxemic perspective, the Glasses, Belt, and Cane nodes correspond to head-, torso-, and ground-level coverage, respectively—mapping directly onto Hall’s personal, near, and far space. This alignment between sensing zones and human perceptual frameworks ensures a coherent flow of environmental information: rapid detection in the immediate personal zone, torso-level redundancy for near-field monitoring, and extended range coverage at the ground plane. Such spatially structured sensing represents a key advancement over existing ETAs, which often lack clear proxemic coordination.
Although the prototype achieved its primary objectives, further work is required to advance toward field deployment and user-based evaluation. Ethical considerations and formal study design are integral to this process. Prior to any trials involving human participants, a pilot study will be conducted under institutional ethical clearance to ensure participant safety, informed consent, and data confidentiality. This preliminary phase will guide the refinement of testing protocols, validate feedback mechanisms, and assess the system’s usability in realistic mobility scenarios.
  • Extended user trials: Evaluate long-term usability, comfort, learning curves, and user adaptation with participants who have VI.
  • Sensor expansion: Incorporate complementary modalities such as radar or thermal imaging to enhance detection robustness under adverse or low-visibility conditions.
  • Hardware optimisation: Miniaturise and consolidate system components to improve wearability, energy efficiency, and commercial feasibility.
  • Adaptive feedback: Develop context-aware feedback mechanisms that dynamically adjust modality, intensity, and timing according to environmental conditions and user preferences.
  • Mobile integration: Offload AI processing and system monitoring tasks to smartphones or cloud-based services to facilitate real-world application.
These directions position the ETA as a scalable research platform for ongoing development within the broader assistive-technology ecosystem, ensuring that future deployments are conducted ethically, responsibly, and in alignment with best practices for human-centred design.

7. Conclusions

This study presented a multi-platform, multi-sensor ETA integrating ultrasonic, LiDAR, and vision-based sensing across distributed nodes—Glasses, Belt, and Cane—aligned with orientation and mobility principles and Hall’s proxemic framework. The experiments confirmed millimetre-level accuracy and sub-30 ms feedback latency across all nodes, establishing reliable real-time operation under controlled conditions.
The Cane node’s dual LiDAR configuration achieved the highest precision ( C V 0.04 % ), while the Belt and Glasses nodes maintained mean detection errors below 1%. Collectively, these results validate the proposed tri-modal ETA as a scalable, low-latency, and context-aware assistive system.
The proposed architecture directly addresses limitations identified in the literature, namely, restricted field of view, reliance on single sensing modalities, and lack of modular resilience. By enabling autonomous operation of each node with wireless interconnection and proxemically informed sensor distribution, the system achieves redundant and complementary spatial coverage. This configuration provides the foundation for future user-centred trials evaluating mobility, comfort, and long-term usability in real-world environments.

Author Contributions

Conceptualization, N.N.; Methodology, N.N.; Software, N.N.; Validation, N.N.; Formal analysis, N.N.; Investigation, N.N.; Resources, N.N.; Data curation, N.N.; Writing—original draft, N.N.; Writing—review & editing, N.N. and M.G.; Visualization, N.N.; Supervision, M.G. All authors have read and agreed to the published version of the manuscript.

Funding

This research received no external funding.

Institutional Review Board Statement

Not applicable.

Informed Consent Statement

Not applicable.

Data Availability Statement

The original contributions presented in this study are included in the article. Further inquiries can be directed to the corresponding authors.

Conflicts of Interest

The authors declare no conflicts of interest.

Abbreviations

The following abbreviations are used in this manuscript:
ETAElectronic Travel Aid
VIVisual Impairment
OMOrientation and Mobility
FoVField of View
MCUMicrocontroller Unit
SBCSingle Board Computer
IMUInertial Measurement Unit
UTUltrasonic Transducer
LiDARLight Detection and Ranging
RGB-DRed–Green–Blue plus Depth camera
CVCoefficient of Variation
SDStandard Deviation
MSMean Square (statistical measure)
YOLOv8You Only Look Once version 8 (object detection algorithm)
ESP32Espressif 32-bit microcontroller family
MPU6050Microelectromechanical Inertial Measurement Unit
TFMINI ProTime-of-Flight Miniature LiDAR sensor

References

  1. World Health Organization. Blindness and Vision Impairment; WHO: Geneva, Switzerland, 2024. [Google Scholar]
  2. Bruce, S.M.; Vargas, C. Teaching object permanence: An action research study. J. Vis. Impair. Blind. 2013, 107, 60–64. [Google Scholar] [CrossRef]
  3. Long, R.; Hill, E.W. Establishing and maintaining orientation for mobility. In Foundations of Orientation and Mobility; American Foundation for the Blind: New York, NY, USA, 1997; Volume 1. [Google Scholar]
  4. Hall, E.T. The Hidden Dimension; Doubleday: Garden City, NY, USA, 1966; Volume 609. [Google Scholar]
  5. Yu, Y.; Shi, Z.; Liu, X.; Tao, X. VisiGlasses: A Smart Assistive Glasses for Visually Impaired. In Proceedings of the ACM Turing Award Celebration Conference-China 2024, Changsha, China, 5–7 July 2024; pp. 244–245. [Google Scholar] [CrossRef]
  6. Almajdoub, R.A.; Shiba, O.S. An Assistant System For Blind To Avoid Obstacles Using Artificial Intelligence Techniques. Int. J. Eng. Inf. Technol. (IJEIT) 2024, 12, 226–238. [Google Scholar] [CrossRef]
  7. Abdulkareem, S.A.; Mohammed, H.I.; Mahdi, A.A. System for Visually Disabled Through Wearables Utilizing Arduino and Ultrasound. J. La Multiapp 2024, 5, 309–321. [Google Scholar] [CrossRef]
  8. Na, Q.; Zhou, H.; Yuan, H.; Gui, M.; Teng, H. Improving Walking Path Generation Through Biped Constraint in Indoor Navigation System for Visually Impaired Individuals. IEEE Trans. Neural Syst. Rehabil. Eng. 2024, 32, 1221–1232. [Google Scholar] [CrossRef] [PubMed]
  9. Chen, Y.; Shen, J.; Sawada, H. A wearable assistive system for the visually impaired using object detection, distance measurement and tactile presentation. Intell. Robot. 2023, 3, 420–435. [Google Scholar] [CrossRef]
  10. Almomani, A.; Alauthman, M.; Malkawi, A.; Shwaihet, H.; Aldigide, B.; Aldabeek, D.; Hamoodeh, K. Smart Shoes Safety System for the Blind People Based on (IoT) Technology. Comput. Mater. Contin. 2023, 76, 415–436. [Google Scholar] [CrossRef]
  11. Kammoun, S.; Bouaziz, R.; Saeed, F.; Qasem, N.; Al-Hadhrami, T. Haptisole: Wearable haptic system in vibrotactile guidance shoes for visually impaired wayfinding. KSII Trans. Internet Inf. Syst. 2023, 17, 3064–3082. [Google Scholar] [CrossRef]
  12. Bouteraa, Y. Smart real time wearable navigation support system for BVIP. Alex. Eng. J. 2023, 62, 223–235. [Google Scholar] [CrossRef]
  13. Katayama, D.; Ishii, K.; Yasukawa, S.; Nishida, Y.; Nakadomari, S. Fall Risk Estimation for Visually Impaired using iPhone with LiDAR. J. Robot. Netw. Artif. Life 2023, 9, 349–357. [Google Scholar] [CrossRef]
  14. Chaudary, B.; Pohjolainen, S.; Aziz, S.; Arhippainen, L.; Pulli, P. Teleguidance-based remote navigation assistance for visually impaired and blind people—Usability and user experience. Virtual Real. 2023, 27, 141–158. [Google Scholar] [CrossRef]
  15. Li, G.; Xu, J.; Li, Z.; Chen, C.; Kan, Z. Sensing and navigation of wearable assistance cognitive systems for the visually impaired. IEEE Trans. Cogn. Dev. Syst. 2022, 15, 122–133. [Google Scholar] [CrossRef]
  16. See, A.R.; Sasing, B.G.; Advincula, W.D. A smartphone-based mobility assistant using depth imaging for visually impaired and blind. Appl. Sci. 2022, 12, 2802. [Google Scholar] [CrossRef]
  17. Suman, S.; Mishra, S.; Sahoo, K.S.; Nayyar, A. Vision navigator: A smart and intelligent obstacle recognition model for visually impaired users. Mob. Inf. Syst. 2022, 2022, 9715891. [Google Scholar] [CrossRef]
  18. Joseph, E.C.; Chigozie, E.C.; Uche, J.I. Prototype Development of Hand Wearable RF Locator with Smart Walking Aid for the Blind. J. Eng. 2022, 19, 173–183. [Google Scholar]
  19. Hao, Y.; Feng, J.; Rizzo, J.; Wang, Y.; Fang, Y. Detect and Approach: Close-Range Navigation Support for People with Blindness and Low Vision. In Proceedings of the European Conference on Computer Vision, Tel Aviv, Israel, 23–27 October 2022; Springer: Cham, Switzerland, 2022; pp. 607–622. [Google Scholar] [CrossRef]
  20. Kilian, J.; Neugebauer, A.; Scherffig, L.; Wahl, S. The unfolding space glove: A wearable spatio-visual to haptic sensory substitution device for blind people. Sensors 2022, 22, 1859. [Google Scholar] [CrossRef] [PubMed]
  21. Chandankhede, P.; Kumar, A. Visually Impaired Aid using Computer Vision to read the obstacles. J. Algebr. Stat. 2022, 13, 4467–4481. [Google Scholar]
  22. Ali A., H.; Rao, S.U.; Ranganath, S.; Ashwin, T.S.; Reddy, G.R.M. A Google Glass Based Real-Time Scene Analysis for the Visually Impaired. IEEE Access 2021, 9, 166351–166369. [Google Scholar] [CrossRef]
  23. Tachiquin, R.; Velázquez, R.; Del-Valle-Soto, C.; Gutiérrez, C.A.; Carrasco, M.; De Fazio, R.; Trujillo-León, A.; Visconti, P.; Vidal-Verdú, F. Wearable urban mobility assistive device for visually impaired pedestrians using a smartphone and a tactile-foot interface. Sensors 2021, 21, 5274. [Google Scholar] [CrossRef]
  24. Jubril, A.M.; Samuel, S.J. A multisensor electronic traveling aid for the visually impaired. Technol. Disabil. 2021, 33, 99–107. [Google Scholar] [CrossRef]
  25. Barontini, F.; Catalano, M.G.; Pallottino, L.; Leporini, B.; Bianchi, M. Integrating Wearable Haptics and Obstacle Avoidance for the Visually Impaired in Indoor Navigation: A User-Centered Approach. IEEE Trans. Haptics 2021, 14, 109–122. [Google Scholar] [CrossRef]
  26. Yang, J.; Yang, Y.; Guo, C.; Zhang, H.; Yin, H.; Yan, W. Design and Implementation of Smart Glasses for the Blind Based on Raspberry Pi. Comput. Knowl. Technol. 2021, 17, 85–87. [Google Scholar]
  27. Hsieh, I.; Cheng, H.; Ke, H.; Chen, H.; Wang, W. A CNN-based wearable assistive system for visually impaired people walking outdoors. Appl. Sci. 2021, 11, 10026. [Google Scholar] [CrossRef]
  28. Romadhon, A.S.; Husein, A.K. Smart Stick For the Blind Using Arduino. J. Phys. Conf. Ser. 2020, 1569, 032088. [Google Scholar] [CrossRef]
  29. Yang, C.; Jung, J.; Kim, J. Development of Obstacle Detection Shoes for Visually Impaired People. Sens. Mater. 2020, 32, 2227–2236. [Google Scholar] [CrossRef]
  30. Messaoudi, M.D.; Menelas, B.J.; Mcheick, H. Autonomous smart white cane navigation system for indoor usage. Technologies 2020, 8, 37. [Google Scholar] [CrossRef]
  31. Hakim, H.; Fadhil, A. Navigation system for visually impaired people based on RGB-D camera and ultrasonic sensor. In Proceedings of the International Conference on Information and Communication Technology, Baghdad, Iraq, 15–16 April 2019; pp. 172–177. [Google Scholar] [CrossRef]
  32. Petsiuk, A.L.; Pearce, J.M. Low-cost open source ultrasound-sensing based navigational support for the visually impaired. Sensors 2019, 19, 3783. [Google Scholar] [CrossRef]
  33. Bai, J.; Liu, Z.; Lin, Y.; Li, Y.; Lian, S.; Liu, D. Wearable travel aid for environment perception and navigation of visually impaired people. Electronics 2019, 8, 697. [Google Scholar] [CrossRef]
  34. Ahmed, A.H. Design of Navigation System for Visually Impaired People. Ph.D. Thesis, Near East University, Nicosia, Cyprus, 2019. [Google Scholar]
  35. Kaur, B.; Bhattacharya, J. Scene perception system for visually impaired based on object detection and classification using multimodal deep convolutional neural network. J. Electron. Imaging 2019, 28, 013031. [Google Scholar] [CrossRef]
  36. Younis, O.; Al-Nuaimy, W.; Rowe, F.; Alomari, M.H. A smart context-aware hazard attention system to help people with peripheral vision loss. Sensors 2019, 19, 1630. [Google Scholar] [CrossRef]
  37. Khan, N.S.; Kundu, S.; Al Ahsan, S.; Sarker, M.; Islam, M.N. An Assistive System of Walking for Visually Impaired. In Proceedings of the 2018 International Conference on Computer, Communication, Chemical, Material and Electronic Engineering (IC4ME2), Rajshahi, Bangladesh, 8–9 February 2018; IEEE: Piscataway, NJ, USA, 2018; pp. 1–4. [Google Scholar] [CrossRef]
  38. Jafri, R.; Khan, M.M. User-centered design of a depth data based obstacle detection and avoidance system for the visually impaired. Hum.-Centric Comput. Inf. Sci. 2018, 8, 1–30. [Google Scholar] [CrossRef]
  39. Katzschmann, R.K.; Araki, B.; Rus, D. Safe local navigation for visually impaired users with a time-of-flight and haptic feedback device. IEEE Trans. Neural Syst. Rehabil. Eng. 2018, 26, 583–593. [Google Scholar] [CrossRef]
  40. Elmannai, W.M.; Elleithy, K.M. A highly accurate and reliable data fusion framework for guiding the visually impaired. IEEE Access 2018, 6, 33029–33054. [Google Scholar] [CrossRef]
  41. Cardillo, E.; Di Mattia, V.; Manfredi, G.; Russo, P.; De Leo, A.; Caddemi, A.; Cerri, G. An electromagnetic sensor prototype to assist visually impaired and blind people in autonomous walking. IEEE Sens. J. 2018, 18, 2568–2576. [Google Scholar] [CrossRef]
  42. Kumar, M.; Kabir, F.; Roy, S. Low Cost Smart Stick for Blind and Partially Sighted People. Int. J. Adv. Eng. Manag. 2017, 2, 65–68. [Google Scholar] [CrossRef]
  43. Buchs, G.; Simon, N.; Maidenbaum, S.; Amedi, A. Waist-up protection for blind individuals using the EyeCane as a primary and secondary mobility aid. Restor. Neurol. Neurosci. 2017, 35, 225–235. [Google Scholar] [CrossRef] [PubMed]
  44. Rao, A.S.; Gubbi, J.; Palaniswami, M.; Wong, E. A Vision-based System to Detect Potholes and Uneven Surfaces for Assisting Blind People. In Proceedings of the 2016 IEEE International Conference on Communications (ICC), Kuala Lumpur, Malaysia, 22–27 May 2016; IEEE: Piscataway, NJ, USA, 2016; pp. 1–6. [Google Scholar] [CrossRef]
  45. Saffoury, R.; Blank, P.; Sessner, J.; Groh, B.H.; Martindale, C.F.; Dorschky, E.; Franke, J.; Eskofier, B.M. Blind Path Obstacle Detector Using Smartphone Camera and Line Laser Emitter. In Proceedings of the 2016 1st International Conference on Technology and Innovation in Sports, Health and Wellbeing (TISHW), Vila Real, Portugal, 1–3 December 2016; IEEE: Piscataway, NJ, USA, 2016; pp. 1–7. [Google Scholar] [CrossRef]
  46. Stoll, C.; Palluel-Germain, R.; Fristot, V.; Pellerin, D.; Alleysson, D.; Graff, C. Navigating from a depth image converted into sound. Appl. Bionics Biomech. 2015, 2015, 543492. [Google Scholar] [CrossRef]
  47. Gao, Y.; Chandrawanshi, R.; Nau, A.C.; Tse, Z.T.H. Wearable virtual white cane network for navigating people with visual impairment. Proc. Inst. Mech. Eng. Part H J. Eng. Med. 2015, 229, 681–688. [Google Scholar] [CrossRef]
  48. Kellman, P.J.; Arterberry, M.E. The Cradle of Knowledge: Development of Perception in Infancy; MIT Press: Cambridge, MA, USA, 2000. [Google Scholar]
  49. Fieandt, K.V.J.v.; Korkala, P.Y.; West, L.J.; Järvinen, E.J. Space Perception. Encyclopædia Britannica. 2017. Available online: https://www.britannica.com/topic/space-perception (accessed on 17 June 2024).
  50. Thinus-Blanc, C.; Gaunet, F. Representation of space in blind persons: Vision as a spatial sense? Psychol. Bull. 1997, 121, 20. [Google Scholar] [CrossRef]
  51. Hersh, M.A. Designing assistive technology to support independent travel for blind and visually impaired people. In Proceedings of the CVHI’09: Conference and Workshop on Assistive Technologies for People with Vision and Hearing Impairments, Wroclaw, Poland, 20–23 April 2009. [Google Scholar]
  52. Hersh, M.; Johnson, M.A. Assistive Technology for Visually Impaired and Blind People; Springer Science & Business Media: Cham, Switzerland, 2010. [Google Scholar] [CrossRef]
  53. Campbell, S.; O’Mahony, N.; Krpalcova, L.; Riordan, D.; Walsh, J.; Murphy, A.; Ryan, C. Foundations of Orientation and Mobility, Volume 1, History and Theory, 3rd ed.; AFB Press, American Foundation for the Blind: New York, NY, USA, 2010. [Google Scholar]
  54. Hollins, M. Understanding Blindness: An Integrative Approach; Lawrence Erlbaum Associates, Inc.: Mahwah, NJ, USA, 1989. [Google Scholar]
  55. Watson, C. The Somatosensory System. In The Mouse Nervous System; Elsevier: Amsterdam, The Netherlands, 2012; pp. 563–570. [Google Scholar]
  56. Buck, L.B.; Bargmann, C. Smell and Taste: The Chemical Senses. Princ. Neural Sci. 2000, 4, 625–647. [Google Scholar]
  57. Pasic, R.; Kuzmanov, I.; Atanasovski, K. ESP-NOW communication protocol with ESP32. J. Univers. Excell. 2021, 6, 53–60. [Google Scholar] [CrossRef]
  58. Postel, J. RFC 768; User Datagram Protocol; Internet Engineering Task Force: Wilmington, DE, USA, 1980. [Google Scholar] [CrossRef]
  59. DFRobot. ESP32-CAM Development Board, SKU: DFR0602. 2025. Available online: https://www.dfrobot.com/product-2047.html (accessed on 22 September 2025).
  60. Makersguides. JSN-SR04T-2.0 Ultrasonic Sensor Module. 2025. Available online: https://makersguides.com/jsn-sr04t-2-0-ultrasonic-sensor/ (accessed on 22 September 2025).
  61. Redmon, J.; Divvala, S.; Girshick, R.; Farhadi, A. You only look once: Unified, real-time object detection. In Proceedings of the IEEE Conference on Computer Vision and Pattern Recognition, Las Vegas, NV, USA, 27–30 June 2016; pp. 779–788. [Google Scholar] [CrossRef]
  62. Jocher, G.; Chaurasia, A.; Stoken, A.; Borovec, J.; Kwon, Y.; Michael, K.; Fang, J.; Zeng, Y.; Wong, C.; Montes, D.; et al. ultralytics/yolov5: V7.0—YOLOv5 SOTA Realtime Instance Segmentation. Zenodo. 2022. Available online: https://zenodo.org/records/7347926 (accessed on 22 September 2025).
  63. Bochkovskiy, A.; Wang, C.Y.; Liao, H.Y.M. YOLOv4: Optimal speed and accuracy of object detection. arXiv 2020, arXiv:2004.10934. [Google Scholar] [CrossRef]
  64. Sohan, M.; Sai Ram, T.; Reddy, R.; Venkata, C. A review on YOLOv8 and its advancements. In Proceedings of the International Conference on Data Intelligence and Cognitive Informatics, Tirunelveli, India, 27–28 June 2024; pp. 529–545. [Google Scholar] [CrossRef]
  65. Lin, T.; Maire, M.; Belongie, S.; Hays, J.; Perona, P.; Ramanan, D.; Dollár, P.; Zitnick, C.L. Microsoft COCO: Common Objects in Context. In Proceedings of the European Conference on Computer Vision, Zurich, Switzerland, 6–12 September 2014; pp. 740–755. [Google Scholar] [CrossRef]
  66. Benewake. TFmini Plus LiDAR Module. SJ-PM-TFmini. 2025. Available online: https://en.benewake.com/TFminiPlus/index.html (accessed on 23 November 2025).
  67. Knoblauch, R.L.; Pietrucha, M.T.; Nitzburg, M. Field Studies of Pedestrian Walking Speed and Start-Up Time. Transp. Res. Rec. J. Transp. Res. Board 1996, 1538, 27–38. [Google Scholar] [CrossRef]
  68. Bohannon, R.W. Comfortable and Maximum Walking Speed of Adults Aged 20–79 Years: Reference Values and Determinants. Age Ageing 1997, 26, 15–19. [Google Scholar] [CrossRef]
  69. Technology, H. L298N Dual H-Bridge Motor Driver; Handson Technology: Gurgaon, India, 2025. [Google Scholar]
  70. Kim, Y.; Moncada-Torres, A.; Furrer, J.; Riesch, M.; Gassert, R. Quantification of long cane usage characteristics with the constant contact technique. Appl. Ergon. 2016, 55, 216–225. [Google Scholar] [CrossRef]
Figure 1. Functional components of an ETA.
Technologies 13 00550 g001
Figure 2. Hall’s extra-personal space defined by the range of human senses radiating outward [4].
Technologies 13 00550 g002
Figure 3. Hardware setup of the AI Processing and Monitoring unit, showing integration of the Raspberry Pi 5 and ESP32 modules.
Technologies 13 00550 g003
Figure 4. User interface for the AI Processing and Monitoring unit, providing real-time system status and visual feedback. The red circle marks objects detected at ground level, while the horizontal red bars indicate detections at waist level and the vertical red bar indicates detections at head height.
Technologies 13 00550 g004
Figure 5. ETA system architecture showing the integration of SBC and MCU components across the three wearable nodes (Glasses, Belt, and Cane) and the central AI Processing and Monitoring unit.
Technologies 13 00550 g005
Figure 6. Wireless communication architecture of the ETA system, illustrating real-time data exchange among the Glasses, Belt, and Cane nodes, and between the ESP32 MCUs and the Raspberry Pi 5 SBC for object classification and system monitoring.
Technologies 13 00550 g006
Figure 7. The ETA Glasses node from multiple viewing angles—front, side, and back—illustrate the spatial arrangement and integration of its hardware components.
Technologies 13 00550 g007
Figure 8. Flowchart of the Glasses node algorithm, showing communication, sensing, and feedback pathways.
Technologies 13 00550 g008
Figure 9. Diagram showing the COCO dataset used for classification along with the selected objects targeted for recognition [65].
Technologies 13 00550 g009
Figure 10. YOLO Lite and Nano model results at different image resolutions.
Technologies 13 00550 g010
Figure 11. The ETA Belt node from multiple viewing angles—front and back illustrate the spatial arrangement and integration of its hardware components.
Technologies 13 00550 g011
Figure 12. Flowchart of the Belt node algorithm, showing sensing, feedback, and inter-node communication processes.
Technologies 13 00550 g012
Figure 13. The ETA Cane node is divided into three sections to clearly illustrate the spatial arrangement and integration of its hardware components for ease of viewing.
Technologies 13 00550 g013
Figure 14. Triangulation-based sensor fusion combining LiDAR range and IMU orientation data for obstacle localization. The illustration shows the Cane directed toward an object, with the IMU-measured tilt angle β , where c denotes the complete distance of the obstacle to the cane pivot, and b represents the required horizontal ground distance between the user and the detected obstacle.
Technologies 13 00550 g014
Figure 15. Triangulation-based sensor fusion combining LiDAR range and IMU orientation data for target ground estimation. The illustration shows the Cane directed toward an object, with the IMU-measured tilt angle β , where c denotes the complete distance of the ground beyond the object to the cane pivot axis point, and h represents the required height of the object in relation to the ground level.
Technologies 13 00550 g015
Figure 16. Flowchart of the Cane node algorithm, illustrating sensing, stereo processing, and auditory feedback.
Technologies 13 00550 g016
Figure 17. Side view of a VI person, highlighting regions of interest for vertical sensor coverage and placement mapped onto Hall’s space model to guide perceptually informed placement.
Technologies 13 00550 g017
Figure 18. Top-down view of a VI person, highlighting regions of interest for vertical sensor coverage and placement mapped onto Hall’s proxemic space model to guide perceptually informed placement.
Technologies 13 00550 g018
Figure 19. Side illustration of the sensor plan overlap, showing individual sensor fields of view mapped onto Hall’s proxemic space model to guide perceptually informed placement.
Technologies 13 00550 g019
Figure 20. Top-down illustration of the sensor plan overlap, showing individual sensor fields of view mapped onto Hall’s proxemic space model to guide perceptually informed placement.
Technologies 13 00550 g020
Figure 21. Multi-node, multi-modal sensor plan illustrating the specific output modalities assigned to each sensor node: Glasses, Belt, and Cane.
Technologies 13 00550 g021
Figure 22. A user shown wearing the Glasses, Belt, and Cane nodes of the ETA, highlighting the compact, fully-wireless, lightweight, unobtrusive design of the components.
Technologies 13 00550 g022
Figure 23. ETA test rig showing (A) the physical build replicating human posture and dimensions, and (B) the graphical user interface (GUI) used for control configuration and real-time display of sensor input.
Technologies 13 00550 g023
Figure 24. ETA test rig hardware configuration: (A) actuating arm assembly replicating pendular cane motion, and (B) drive train and control hardware assembly.
Technologies 13 00550 g024
Figure 25. Dynamic test setup for the Glasses node, with obstacle positioned at head height.
Technologies 13 00550 g025
Figure 26. Measurements of obstacle detection distances (mm) for the Glasses node across 20 trials conducted at slow, medium, and brisk walking speeds.
Technologies 13 00550 g026
Figure 27. Measurements of obstacle detection distances (mm) for the Belt node rear-facing LiDAR sensor across 20 trials conducted at slow, medium, and brisk walking speeds.
Technologies 13 00550 g027
Figure 28. Measurements of obstacle detection distances (mm) for the Cane node TFMINI LiDAR 1 sensor across 20 trials conducted at slow, medium, and brisk walking speeds.
Technologies 13 00550 g028
Figure 29. Distribution of obstacle detection distances (mm) for the Glasses node across 20 trials conducted at slow, medium, and brisk walking speeds.
Technologies 13 00550 g029
Figure 30. Distribution of obstacle detection distances (mm) for the Belt node rear-facing LiDAR sensor across 20 trials conducted at slow, medium, and brisk walking speeds.
Technologies 13 00550 g030
Figure 31. Distribution of obstacle detection distances (mm) for the Cane node TFMINI LiDAR 1 sensor across 20 trials conducted at slow, medium, and brisk walking speeds.
Technologies 13 00550 g031
Figure 32. Glasses node camera static test setup showing (A) the test subject positioned in front of the test rig, (B) successful object classification by the camera system, and (C) the monitoring interface displaying detection information.
Technologies 13 00550 g032
Figure 33. Classification confidence distribution for the Glasses node at 1 m (100 trials).
Technologies 13 00550 g033
Figure 34. Classification confidence distribution for the Glasses node at 2 m (100 trials).
Technologies 13 00550 g034
Figure 35. Classification confidence distribution for the Glasses node at 4 m (100 trials).
Technologies 13 00550 g035
Figure 36. Representative Glasses-node feedback trace showing vibration (blue, 27 ms) and audio output (orange, 388 ms).
Technologies 13 00550 g036
Figure 37. Latency distribution for the Glasses ultrasonic–haptic pathway (100 trials). (Left blue dotted line) −SD, (right blue dotted line) +SD.
Technologies 13 00550 g037
Figure 38. Latency distribution for the Glasses camera–audio pathway (100 trials). (Left blue dotted line) −SD, (right blue dotted line) +SD.
Technologies 13 00550 g038
Figure 39. Latency distribution for Belt front LiDAR–haptic pathway (100 trials). (Left blue dotted line) −SD, (right blue dotted line) +SD.
Technologies 13 00550 g039
Figure 40. Latency distribution for Belt rear LiDAR–haptic pathway (100 trials). (Left blue dotted line) −SD, (right blue dotted line) +SD.
Technologies 13 00550 g040
Figure 41. Latency distribution for Cane LiDAR 1–audio pathway (100 trials). (Left blue dotted line) −SD, (right blue dotted line) +SD.
Technologies 13 00550 g041
Figure 42. Latency distribution for Cane LiDAR 2–audio pathway (100 trials). (Left blue dotted line) −SD, (right blue dotted line) +SD.
Technologies 13 00550 g042
Table 1. Summary of ETA systems categorized by input modality, sensor configuration, and body-part distribution. Rows are ordered by increasing Sum of Sensors, followed by Sum of Distinct Input Modalities, and then by Sum of Distinct Region Placement.
Input Modality TypeSum of SensorsSum of Distinct Input ModalitiesModality Technology DeployedSum of Distinct Region PlacementRegion PlacementETA CountReferences
Proximity11Ultrasonic1Arm1[32]
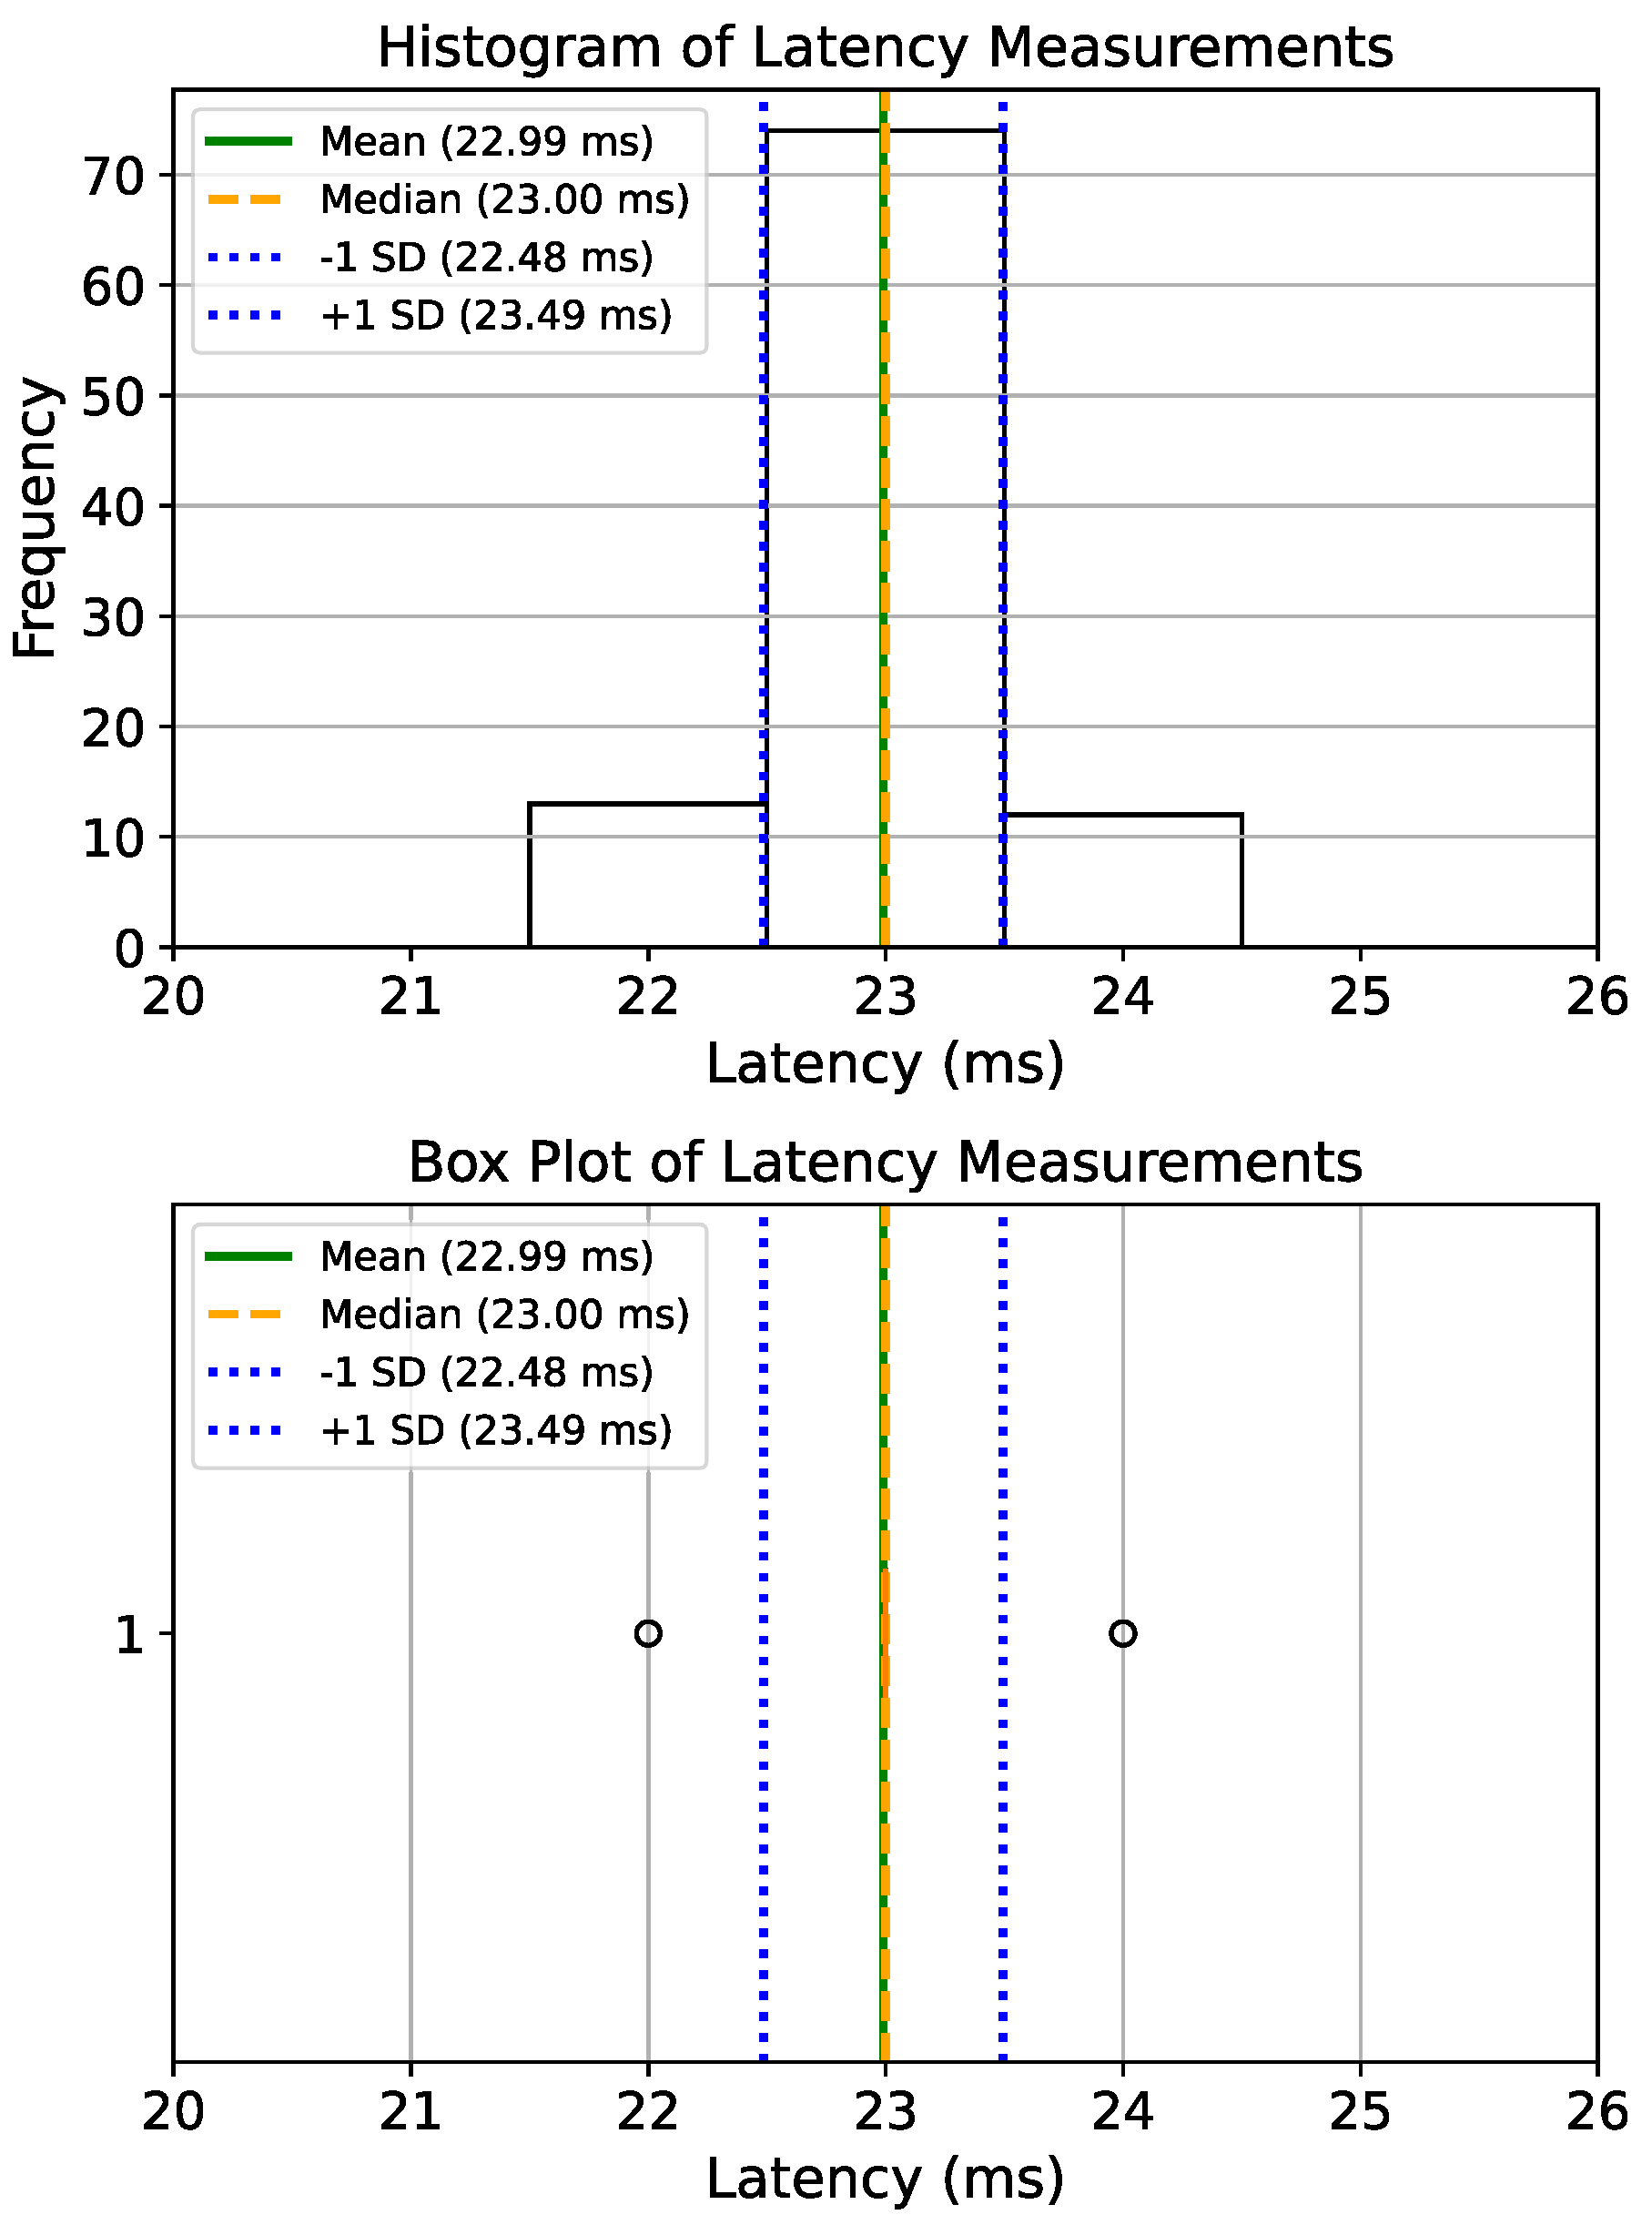
Proximity11LiDAR1Chest1[35]
Proximity11GPS1Foot2[11,23]
Proximity11LiDAR1Hand1[8]
Proximity11Ultrasonic1Hand3[18,28,30]
Proximity11Radar1Hand1[41]
Proximity11Ultrasonic1Waist1[37]
Image11RGBD-Camera1Head3[27,33,36]
Image11RGB-Camera1Head3[5,22,46]
Image11RGBD-Camera1Hand2[20,38]
Image11RGB-Camera1Hand3[21,44,45]
Image11RGB-Stereo Camera1Chest2[9,40]
Image11RGBD-Camera1Chest2[25,26]
Image11RGB-Camera1Chest4[13,14,16,19]
Proximity21Infrared1Hand1[43]
Proximity21Infrared1Foot1[29]
Proximity21Ultrasonic2Hand, Foot1[17]
Proximity21Ultrasonic2Head, Hand1[34]
Proximity22Ultrasonic, Infrared1Hand1[42]
Image, Proximity22RGBD-Camera, Ultrasonic2Head, Leg1[15]
Image, Proximity22RGBD-Camera, Ultrasonic2Hand, Foot1[17]
Image, Proximity22RGB-Camera, Ultrasonic1Head1[31]
Image, Proximity22RGB-Camera, Ultrasonic1Waist1[31]
Proximity31Ultrasonic1Foot1[10]
Proximity32Ultrasonic, Infrared1Head, Hand1[7]
Proximity41Ultrasonic2Head, Hand1[12]
Proximity41Ultrasonic3Waist, Hand, Ankle1[47]
Image, Proximity42RGB-Camera, Ultrasonic2Head, Hand1[6]
Proximity71LiDAR1Waist1[39]
Table 2. Summary of ETA systems grouped by processing hardware and hardware type distribution.
Processing HardwareProcessing Hardware TypeETA CountReferences
Arduino UnoMCU9[6,7,17,18,28,34,37,41,47]
Arduino NanoMCU2[7,32]
ESP32MCU1[30]
Mbed LPC1768MCU1[39]
Infineon XMC4500MCU1[41]
Bespoke MCU DeviceMCU4[23,40,43,45]
Raspberry Pi 4SBC4[12,20,21,26]
Raspberry Pi 3SBC3[24,30,31]
Raspberry Pi ZeroSBC1[9]
NVIDIA Jetson Xavier/NanoSBC3[8,19,27]
Odroid XU4SBC1[35]
NVIDIA Xavier NXSBC1[8]
Raspberry Pi (unspecified)SBC2[9,17]
Linux ComputerComputer/Laptop1[44]
ASUS Laptop/UX310UComputer/Laptop2[25,46]
MacBook LaptopComputer/Laptop1[36]
Google Tango TabletComputer/Laptop1[38]
Samsung Galaxy (A80, S5, S9)Phone3[16,23,45]
OnePlus/Android PhonesPhone3[14,22,33]
iPhone 12 ProPhone1[13]
Not mentioned (Android Mobile Device)Phone5[11,14,29,33,42]
INMO Air2Commercial Glasses1[5]
Moverio BT-200Commercial Glasses1[36]
Google GlassesCommercial Glasses1[22]
Table 3. Summary of ETA systems grouped by output modality and output sensor type distribution.
Modality TypeFeedback TypeETA CountReferences
AuditoryNon-speech8[19,21,27,30,33,34,35,40]
AuditorySpeech15[5,6,10,11,13,18,20,22,23,24,26,29,31,32,38]
TactusPressure & Vibration2[9,43]
TactusVibration5[8,11,20,23,44]
Tactus + AuditoryForce Feedback & Speech1[8]
Tactus + AuditorySpeech & Non-speech2[14,25]
Tactus + AuditoryVibration & Non-speech5[12,14,16,41,47]
Tactus + AuditoryVibration & Speech5[15,28,39,42,46]
Table 4. Dynamic test protocol used to test object detection or classification range of each ETA node (in metres): the rig starting distance for each trial, and corresponding desired accuracy metric bands defined as ± 10 % of the detection range. Trials began 1 m outside each node’s maximum detection distance to ensure an initial non-detection state.
NodeSensorDetection Range (m)Rig Starting Distance (m)Accuracy Band [Min, Max] (m)
BeltLiDAR 1 & 2 (Personal Space)1.02.0[0.9, 1.1]
GlassesImage (Near Space)2.03.0[1.8, 2.2]
GlassesUltrasonic (Near Space)3.04.0[2.7, 3.3]
CaneLiDAR 1 (Near Space)3.04.0[2.7, 3.3]
GlassesImage (Far Space)4.05.0[3.6, 4.4]
Table 5. Comparison of multi-sensor and multi-region Electronic Travel Aid (ETA) systems. A checkmark indicates whether the solution includes sensors that cover the specified region.
ReferenceKey FeaturesDeployed Body Region (s)Field of View (FoV)Spatial Coverage
Forward Rear Head Torso Legs
This StudyMulti-sensor, multi-modal tech., multi-region (LiDAR, Ultrasonic, Vision)Head, Waist, Hand
[15]Multi-sensor, multi-modal tech., multi-region (RGBD, Ultrasonic)Head, Leg
[12]Multi-sensor, multi-region (Ultrasonic)Head, Hand
[39]Multi-sensor (LiDAR)Waist
[47]Multi-region (Ultrasonic)Waist, Hand, Ankle
Disclaimer/Publisher’s Note: The statements, opinions and data contained in all publications are solely those of the individual author(s) and contributor(s) and not of MDPI and/or the editor(s). MDPI and/or the editor(s) disclaim responsibility for any injury to people or property resulting from any ideas, methods, instructions or products referred to in the content.