1. Introduction
Prostate cancer (PCa) is a major global malignancy, ranking as the fourth most common cancer worldwide and the second most prevalent in men, with an estimated 1.4 million new cases annually [
1]. Early and accurate detection of PCa-specific biomarkers is critical to improve patient prognosis, guide clinical decision-making, and enable timely therapeutic intervention [
2]. Currently, prostate-specific antigen (PSA) measurement in blood is the primary screening tool for PCa [
3]. While PSA is sensitive to prostate tissue abnormalities, it is not specific to malignancy; levels can be elevated in benign prostatic hyperplasia (BPH), prostatitis, and other noncancerous conditions [
4]. Consequently, PSA testing can lead to false-positive results, unnecessary biopsies, and patient anxiety, while some early-stage cancers may remain undetected, reflecting limitations in both specificity and sensitivity [
5,
6]. Among emerging candidates, urinary biomarkers, such as non-coding RNAs, have attracted increasing attention due to their noninvasive collection, stability, and high diagnostic potential [
7,
8]. Such biomarkers offer the promise of higher specificity and improved positive and negative predictive values, complementing or potentially surpassing PSA in early and reliable PCa detection [
9].
Among urinary biomarkers, Prostate Cancer Antigen 3 (PCA3) has emerged as a highly promising candidate for the detection of prostate cancer. PCA3 is a long non-coding RNA that exhibits significant overexpression in PCa tissue while remaining minimally expressed in normal or benign prostate cells [
10], with transcript levels reported to be 10–100-fold higher in malignant tissue compared with normal prostate [
11]. Its expression is largely independent of prostate volume, patient age, and pharmacological interventions, enhancing diagnostic specificity and reliability [
12,
13]. PCA3 can be detected in urine, providing a noninvasive and convenient sampling method. Compared with PSA, PCA3 offers higher specificity, reducing false positives caused by benign conditions such as BPH or prostatitis, and improving both positive and negative predictive values. Traditional molecular methods, including reverse transcription polymerase chain reaction (RT-PCR) and transcription-mediated amplification (TMA), provide high sensitivity and specificity but require complex instrumentation, trained personnel, long assay times, and high costs, limiting their utility in point-of-care (POC) or resource-limited settings [
14]. While RT-PCR remains the diagnostic gold standard, the developed biosensor offers a cost-effective alternative, utilizing readily available materials, minimal reagents, and straightforward fabrication steps, while enabling rapid, label-free detection. These features reduce both material and labor costs, making the platform suitable for POC applications and early, accessible, and reliable PCa diagnostics [
15].
The development of sensitive and selective biosensors is crucial for detecting trace biomolecules in biomedical, environmental, and diagnostic applications. Among various transduction mechanisms, surface plasmon resonance (SPR) and quartz crystal microbalance (QCM) are two widely recognized platforms capable of real-time, label-free detection [
16,
17,
18,
19]. SPR operates on the principle of monitoring refractive index changes at a metal-dielectric interface during molecular binding events, offering exceptional sensitivity with detection limits in the femtomolar to picomolar range. Despite its high performance, SPR systems require complex optical components, precise alignment, and temperature control, making them costly and less suitable for portable or POC applications. In contrast, QCM utilizes the piezoelectric effect of quartz to detect minute mass variations through shifts in resonance frequency. Although QCM generally exhibits slightly higher detection limits, typically in the nanomolar to picomolar range, it offers advantages of low cost, operational simplicity, and high robustness. QCM directly measures mass changes without the need for optical instrumentation and can operate in liquid, gas, or vacuum environments [
20]. These attributes, coupled with rapid response and miniaturization potential, make QCM an attractive platform for developing portable biosensors. The fundamental principle governing QCM operation is described by the Sauerbrey equation [
21], which relates the resonance frequency shift to the corresponding mass change on the crystal surface. It is expressed as follows:
where
is the fundamental resonant frequency of the quartz crystal (Hz),
is the frequency shift due to the change in surface (Hz),
is the mass change (g),
is the active electrode surface area of the QCM chip (
),
is the quartz density (
), and
is the shear modulus of quartz (for AT-cut quartz,
, respectively.
Detecting biomarkers in bodily fluids poses challenges due to their low concentration and limited abundance. Employing signal amplification strategies is crucial for accurate detection [
22].
Graphene Oxide (GO)-based biosensors have gained attention for point-of-care applications due to graphene’s unique properties, including substantial surface area, high electrical conductivity, excellent biocompatibility, and ease of production and functionalization [
23,
24,
25,
26]. However, challenges such as the lack of colloidal stability and agglomeration due to strong van der Waals forces remain.
This work aims to improve the suspension stability and dispersibility of nanotechnology-based biosensors by chemically functionalizing GO to introduce carboxyl (-COOH) and hydroxyl (-OH) functional groups. Additionally, we designed a QCM sensor utilizing GO for PCA3 detection. The biosensor electrodes were fabricated by applying GO using a drop-casting method. The GO was chemically treated to enhance its DNA-binding properties. The capture probe, equipped with an amine linker, was immobilized on the GO electrode surface. Resonance frequency measurements were used to quantify PCA3 target detection.
2. Materials and Methods
2.1. Materials and Characterization
A 10 MHz QCM chip and AT-cut quartz crystals were acquired from Novaetech S.r.l. (Pompei, Italy) with a 14 mm diameter (quartz chip), 160 μm thickness, and 6 mm electrode diameter. L-cysteine hydrochloride monohydrate (L-Cys, 1 mM) was purchased from Sigma-Aldrich (St. Louis, MO, USA). Ethanol (99.9%), Hydrogen peroxide (H2O2, 30%), and sulfuric acid (H2SO4, 98%) were purchased from QReC (Auckland, New Zealand). Preparation of EDC-NHS (1:1 EDC:NHS), using 1-ethyl-3-(3-dimethylaminopropyl) carbodiimide (EDC, 1.00 mM) and N-hydroxysuccinimide (NHS, 1.00 mM) were purchased from Sigma-Aldrich. Phosphate-buffered saline (PBS, 1X, pH 7.4) was prepared using sodium chloride (NaCl, 8.01 g), potassium chloride (KCl, 0.20 g), sodium phosphate monobasic dihydrate (NaH2PO4.2H2O, 1.78 g), and potassium phosphate monobasic (KH2PO4, 0.24 g), all of which were purchased from Merck (Darmstadt, Germany). Graphene oxide (GO) solution 0.012 g/mL was acquired from Haydale Technologies (Pathum Thani, Thailand) Company Limited. All reagents and buffers were prepared using deionized (DI) water as the solvent, and all chemicals were of analytical reagent grade. The PCA3 target and the oligonucleotide probe (PCA3 capture probe) used in this work were synthesized by U2Bio (Bangkok, Thailand) Co., Ltd. with 0.10 mM concentration. They have the following sequences:
PCA3 capture probe: NH2-(CH2)6-5′-TTTTTTTCCCAGGGATCTCTGTGCTTCC-3′
(MW. = 8657.7 g/mol)
PCA3 target: 5′-GGAAGCACAGAGATCCCTGGG-3′ (MW. = 6505.1 g/mol).
Characterization techniques: The morphologies were examined field emission scanning electron microscopy (FE-SEM, Carl Zeiss, Aurica, Oberkochen, Germany) combined with energy dispersive X-ray spectroscopy (EDS). Contact mode atomic force microscopy (AFM-Park Systems/XE-120, Suwon, South Korea, scan frequency 0.20 Hz, 512 lines) was used to scan μm2 sample areas. AFM images were analyzed using XEI software (4.3.0.Build5 version, Park Systems) to extract the roughness information from the sample surfaces. X-ray diffraction (XRD, Bruker D2 ADVANCE, Karlsruhe, Germany) were used to analyze, surface area, and structures of the QCM electrode. The Fourier-transform infrared spectroscopy (FT-IR, Bruker/Tensor 27-Hyperion-2000, Ettlingen, Germany) spectra is an analytical technique that uses infrared light to identify chemical bonds and functional groups. QCM sensor chip was put into the sample holder and total light refection from surface was measured in the wavenumber range of 400–4000 cm−1.
2.2. Preparation of QCM Sensor Chip
The QCM chips were cleaned using a freshly prepared piranha solution (H
2SO
4:H
2O
2 = 3:1
v/
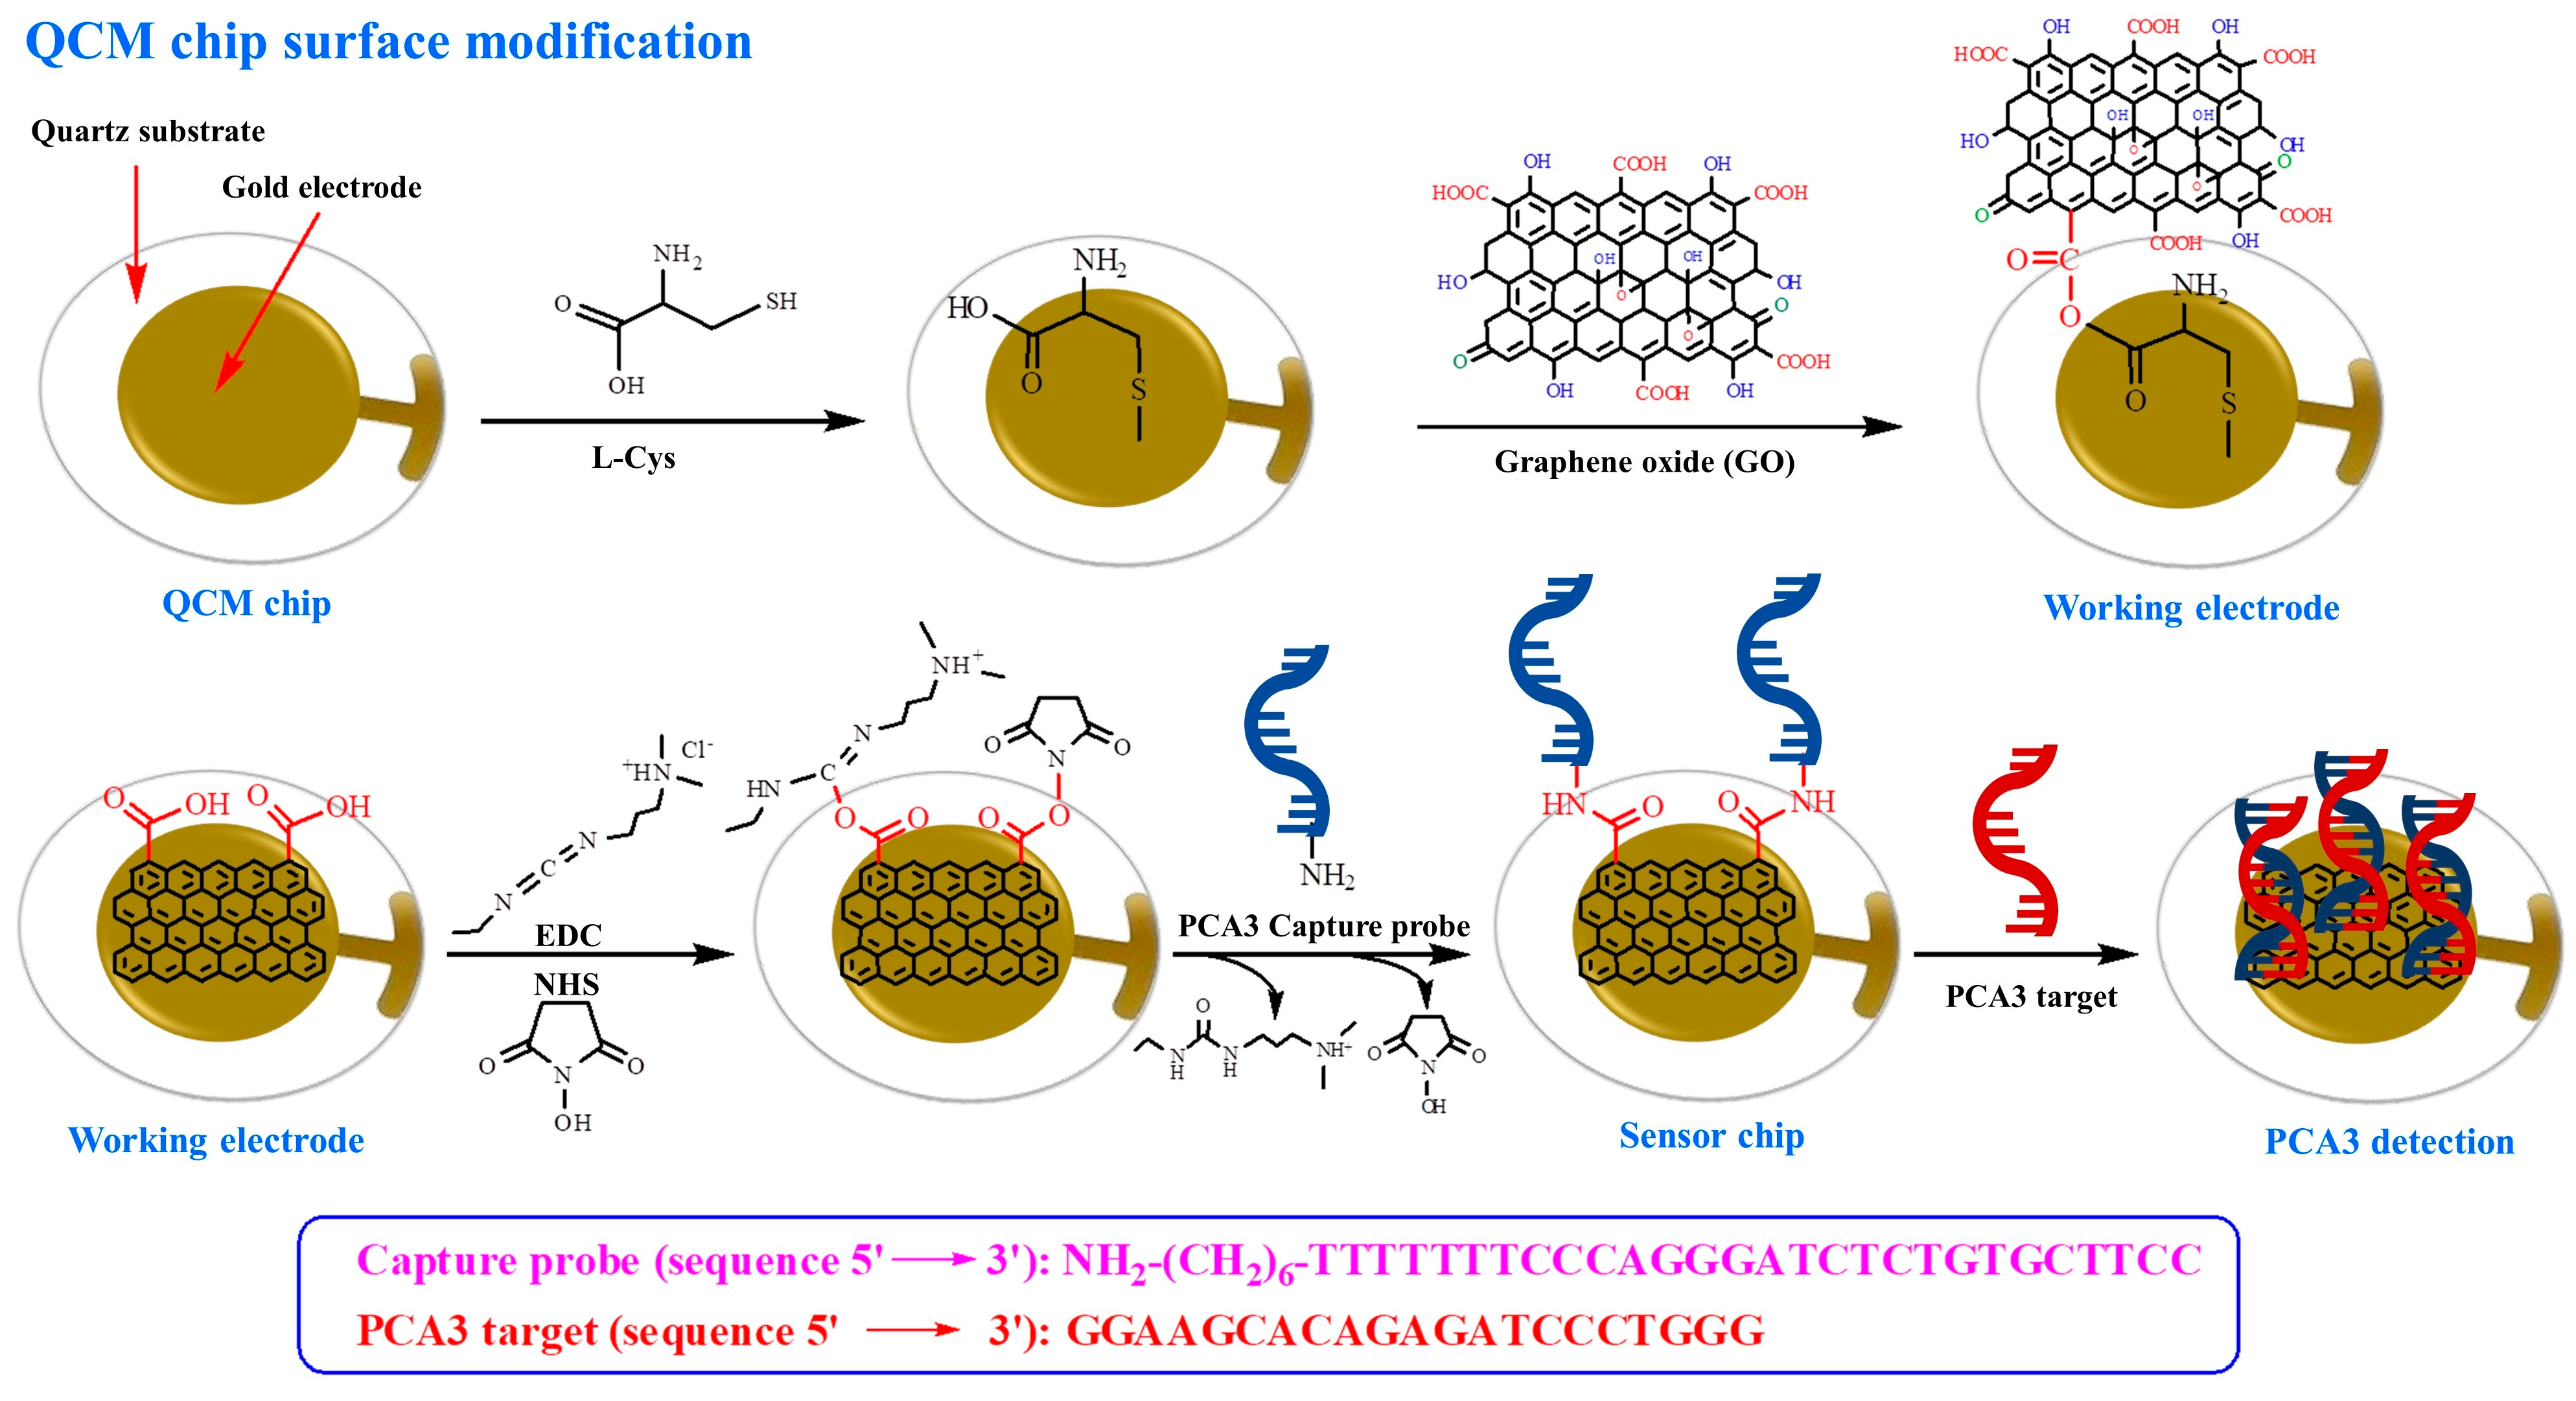
v) for 30 min and thoroughly rinsed with ethanol and DI water before modification. The growth of the L-Cys on the gold electrode was achieved by the sessile drop method, where 10.00 µL of 1 mM L-Cys solution was deposited on the QCM chip surface and incubated for 60 min at 50 °C. The QCM chip was then rinsed using the DI water. Next, the GO solution was diluted to 0.10 mg/mL in DI water and dispersed using an ultrasonic probe (40% amplitude) for 10 min. To prevent thermal degradation, the sample vial was immersed in an ice-water bath, maintaining the temperature below 30 °C during sonication. Subsequently, 10.00 μL of the GO dispersion was deposited on the Au/L-Cys chip and incubated overnight at 50 °C to allow uniform coating. The surfaces were activated using EDC-NHS to enhance the effectiveness of the cross-linking reaction. EDC-NHS 10.00 µL was added to the electrode surface to activate carboxylic group and increase the efficiency of biomarker immobilization. During each step, the QCM chip was washed with DI water to remove unbounded molecules on the gold surface. Then, capture probe solution of 10.00 µL in PBS buffer was incubated on the working electrode for 2 h at room temperature with different capture probe concentrations (0.05–0.50 μM). After the capture probe binding experiment, the sensor surface was rinsed with a PBS buffer solution to remove the unbounded molecules and nonspecific binding, resulting in a sensor chip optimized and ready for detecting the PCA3 target. The schematic representation of the chemical treatment, GO-coated QCM, and biomarker hybridization steps on the gold surface of the QCM sensor is illustrated in
Figure 1.
2.3. Optimization of PCA3 Sensor Chip
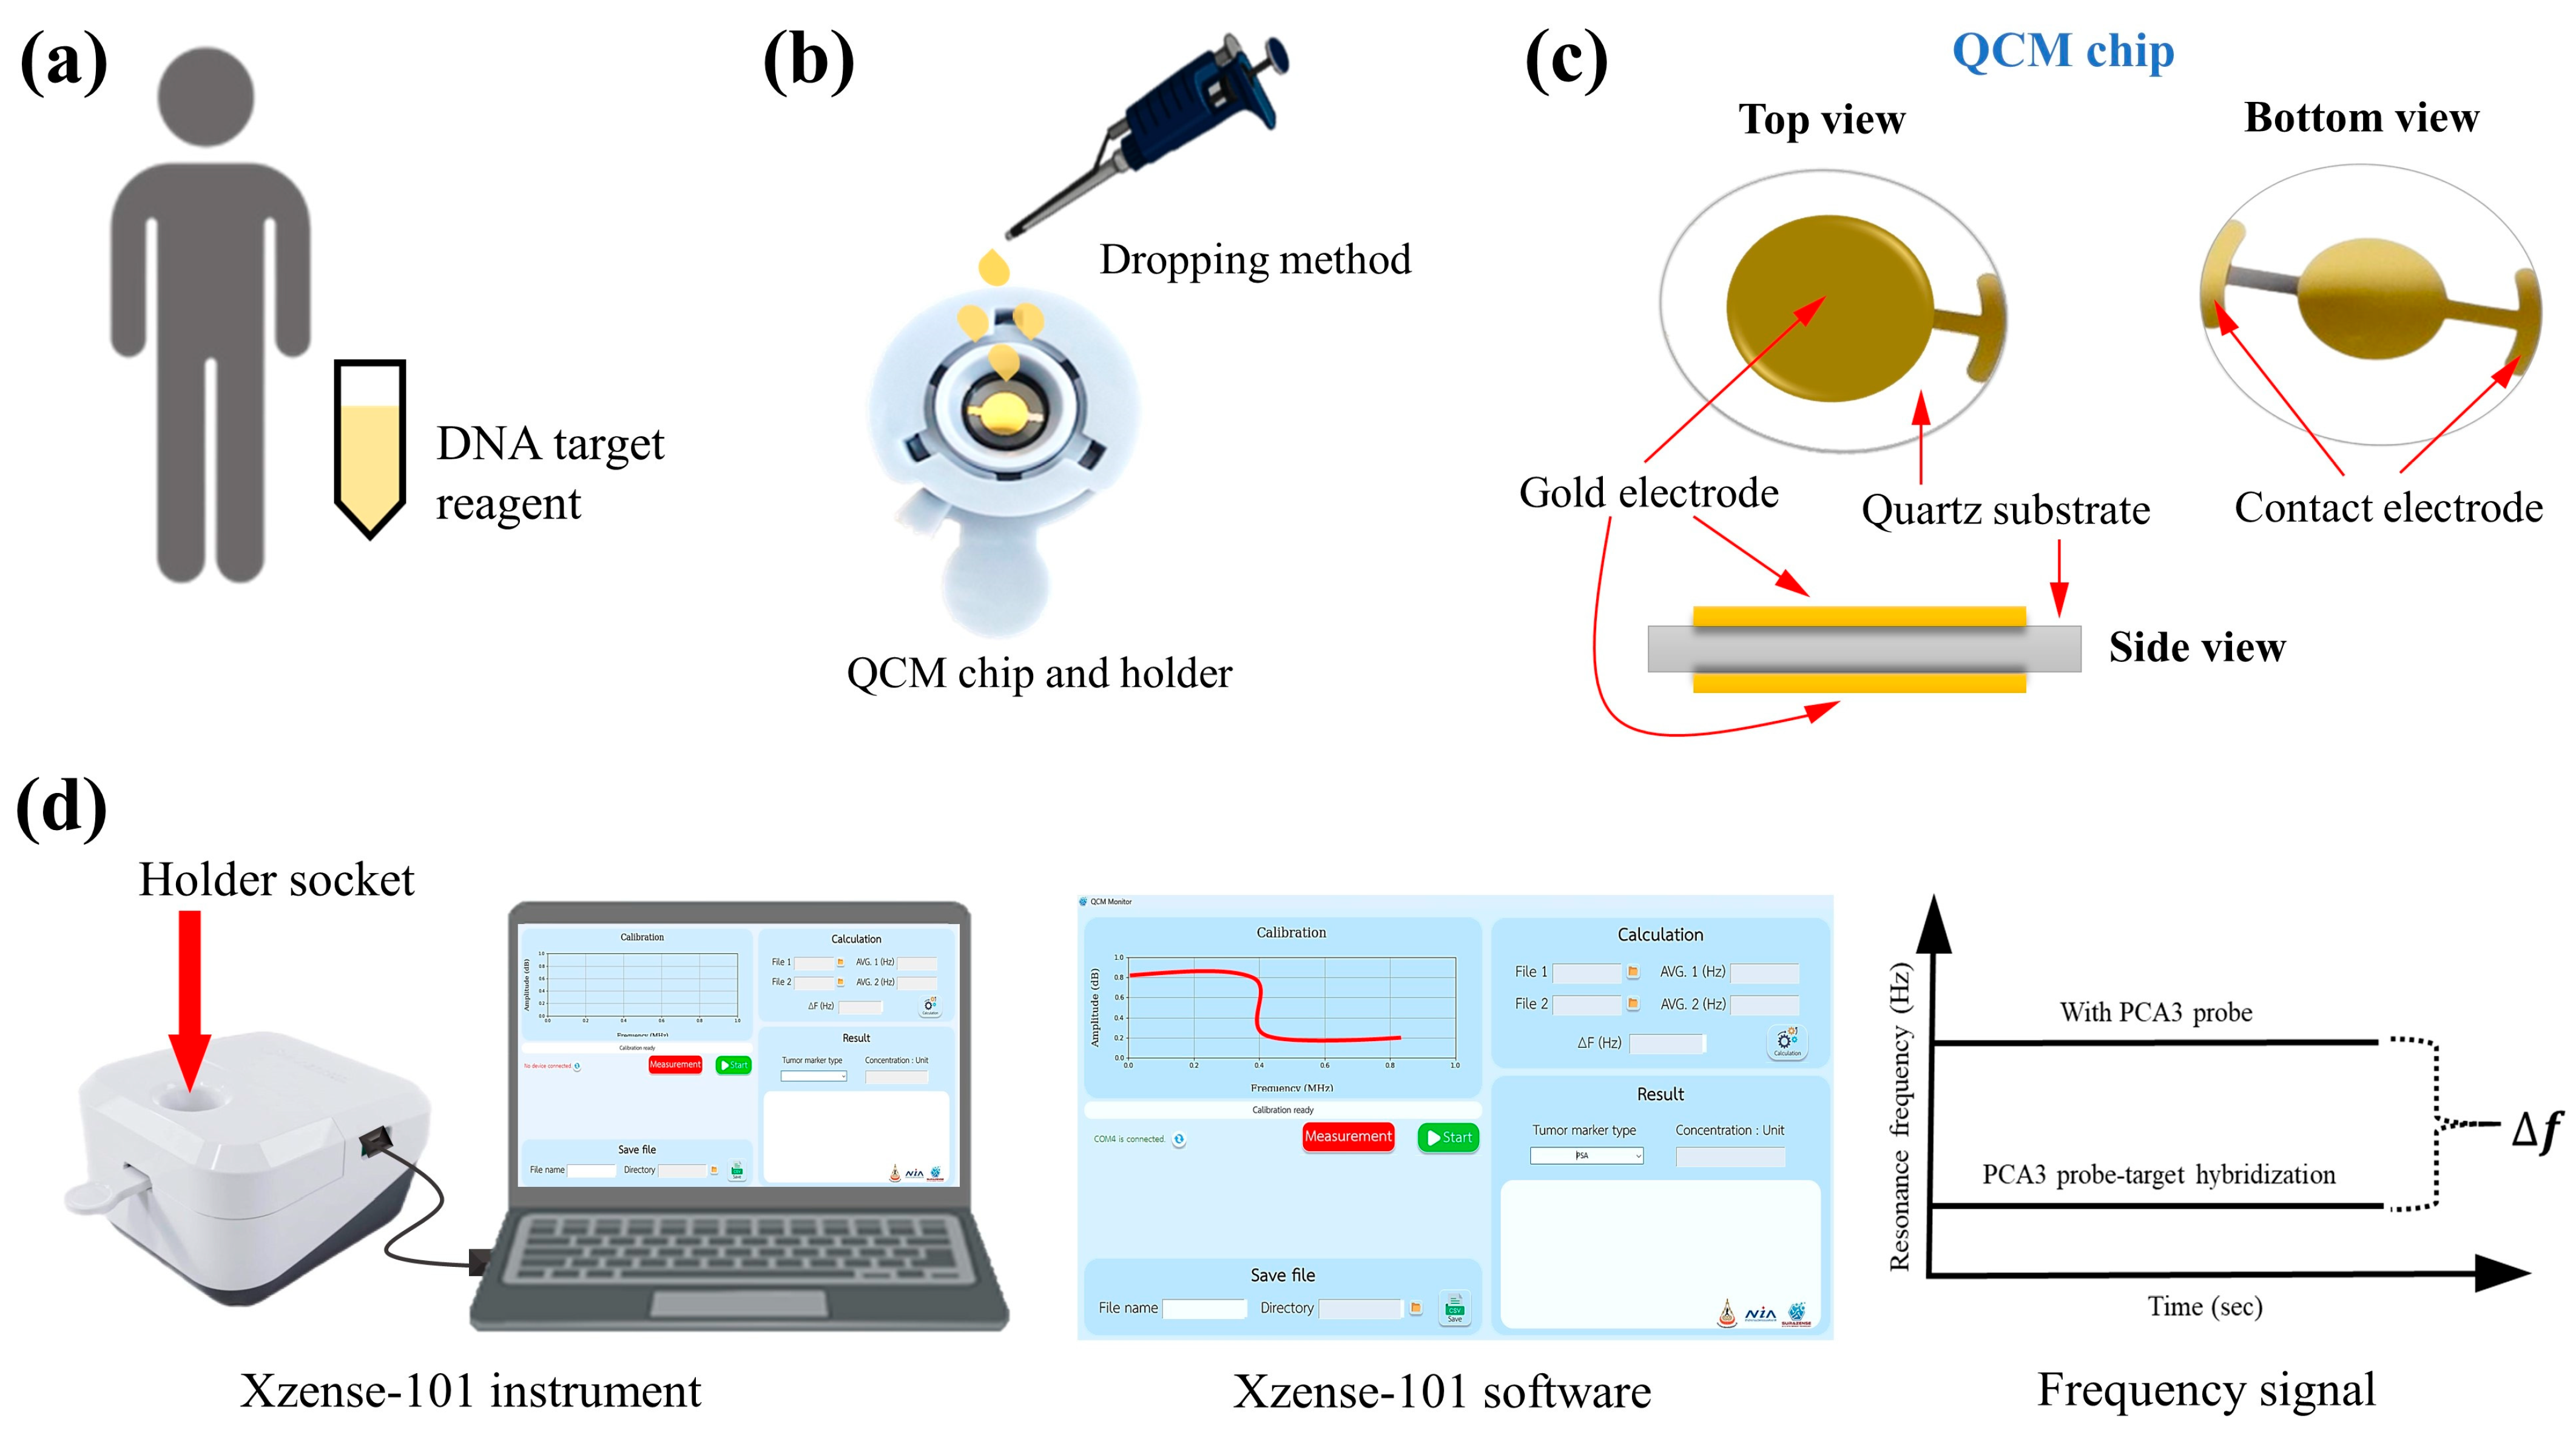
A portable QCM instrument was employed as the biosensing platform. The QCM is an analytical device based on the piezoelectric principle, which measures changes in mass attached to the surface of a vibrating quartz crystal [
27]. The working principle relies on a decrease in resonance frequency upon target molecule binding, where the resonance frequency shift (
) is directly proportional to the mass change (
) on the sensor surface. In operation, an alternating current is applied between two electrodes on the quartz crystal, generating a mechanical oscillation (
Figure 2c). When the capture probe is immobilized on the sensor surface, the subsequent binding of target molecules induces a detectable frequency decrease proportional to the number of binding events. As illustrated in
Figure 2d, a larger
values correspond to higher target concentrations or a greater number of capture probes. In this work, optimized studies were performed on the gold electrode of the QCM sensor chip to achieve maximum biosensing performance. The resonance frequency of the sensor chip was measured before and after target hybridization using a portable QCM analyzer (Xzense-101 biosensor, Surazense (Nakhon Ratchasima, Thailand) Co., Ltd.). The following parameters were optimized:
- (1)
EDC-NHS activation time (30–180 min): A 10.00 µL of EDC-NHS was dropped on the working electrode with GO particles.
- (2)
Capture probe concentrations (0.05–0.50 μM): A 10.00 µL capture probe was dropped onto the EDC-NHS layer of the working electrode.
- (3)
PCA3 target incubation time (10–40 min): A 10.00 µL of 1.00 µM PCA3 target solution in PBS buffer was incubated on the QCM sensor chip.
2.4. Detection of PCA3 Target by Portable QCM Instrument
To detect the PCA3 target using the QCM biosensor Xzense-101 (Nakhon Ratchasima, Thailand), PCA3 target detection followed a similar procedure as described above, including deposition of GO on the QCM surface, activation with EDC-NHS, capture probe immobilization, and injection of the PCA3 target at varying concentrations ranging from 1.00 fM to 1.00 μM. The was recorded after sample injection, followed by PBS solution rinse. Measurements were repeated three times.
The selectivity of PCA3 detection in PBS buffer was evaluated using negative control experiments. These experiments employed several analytes, namely coronavirus disease 2019 (COVID-19), distal-less homeobox 1 (DLX1), and epidermal growth factor receptor (EGFR) each at 1.00 nM concentration. To measure the of negative control, 10.00 μL of each analyte was injected onto QCM sensor chip under similar experimental conditions.
3. Results and Discussion
The gold electrode surface of the QCM chip was initially modified with L-Cys through strong chemisorption between thiol groups and the gold surface (Au-S). L-Cys was selected due to its dual functionality, which bears both thiol and amine/carboxyl groups, allowing for further chemical coupling. Subsequently, GO nanosheet dispersion was deposited onto the L-Cys-modified electrode to construct the working electrode layer, as presented in
Figure 1. The oxygen-containing GO serves as an ideal platform for biofunctionalization due to its abundance of carboxyl and hydroxyl groups. To enable covalent attachment of amine-functionalized biomolecules, the carboxylic acid groups present on GO were activated using EDC and NHS. This EDC/NHS chemistry generates reactive NHS esters, which readily couple with nucleophilic amine groups to form stable amide bonds [
28]. After EDC/NHS activation, the amine-modified PCA3 capture probe reacts with the activated carboxylic acid groups on the GO surface, forming stable amide bonds that bind the probe onto the electrode surface. This surface functionalization strategy enables high-density immobilization of PCA3 capture probes, which is essential for improving detection sensitivity in PCA3 targets.
3.1. Characterizations
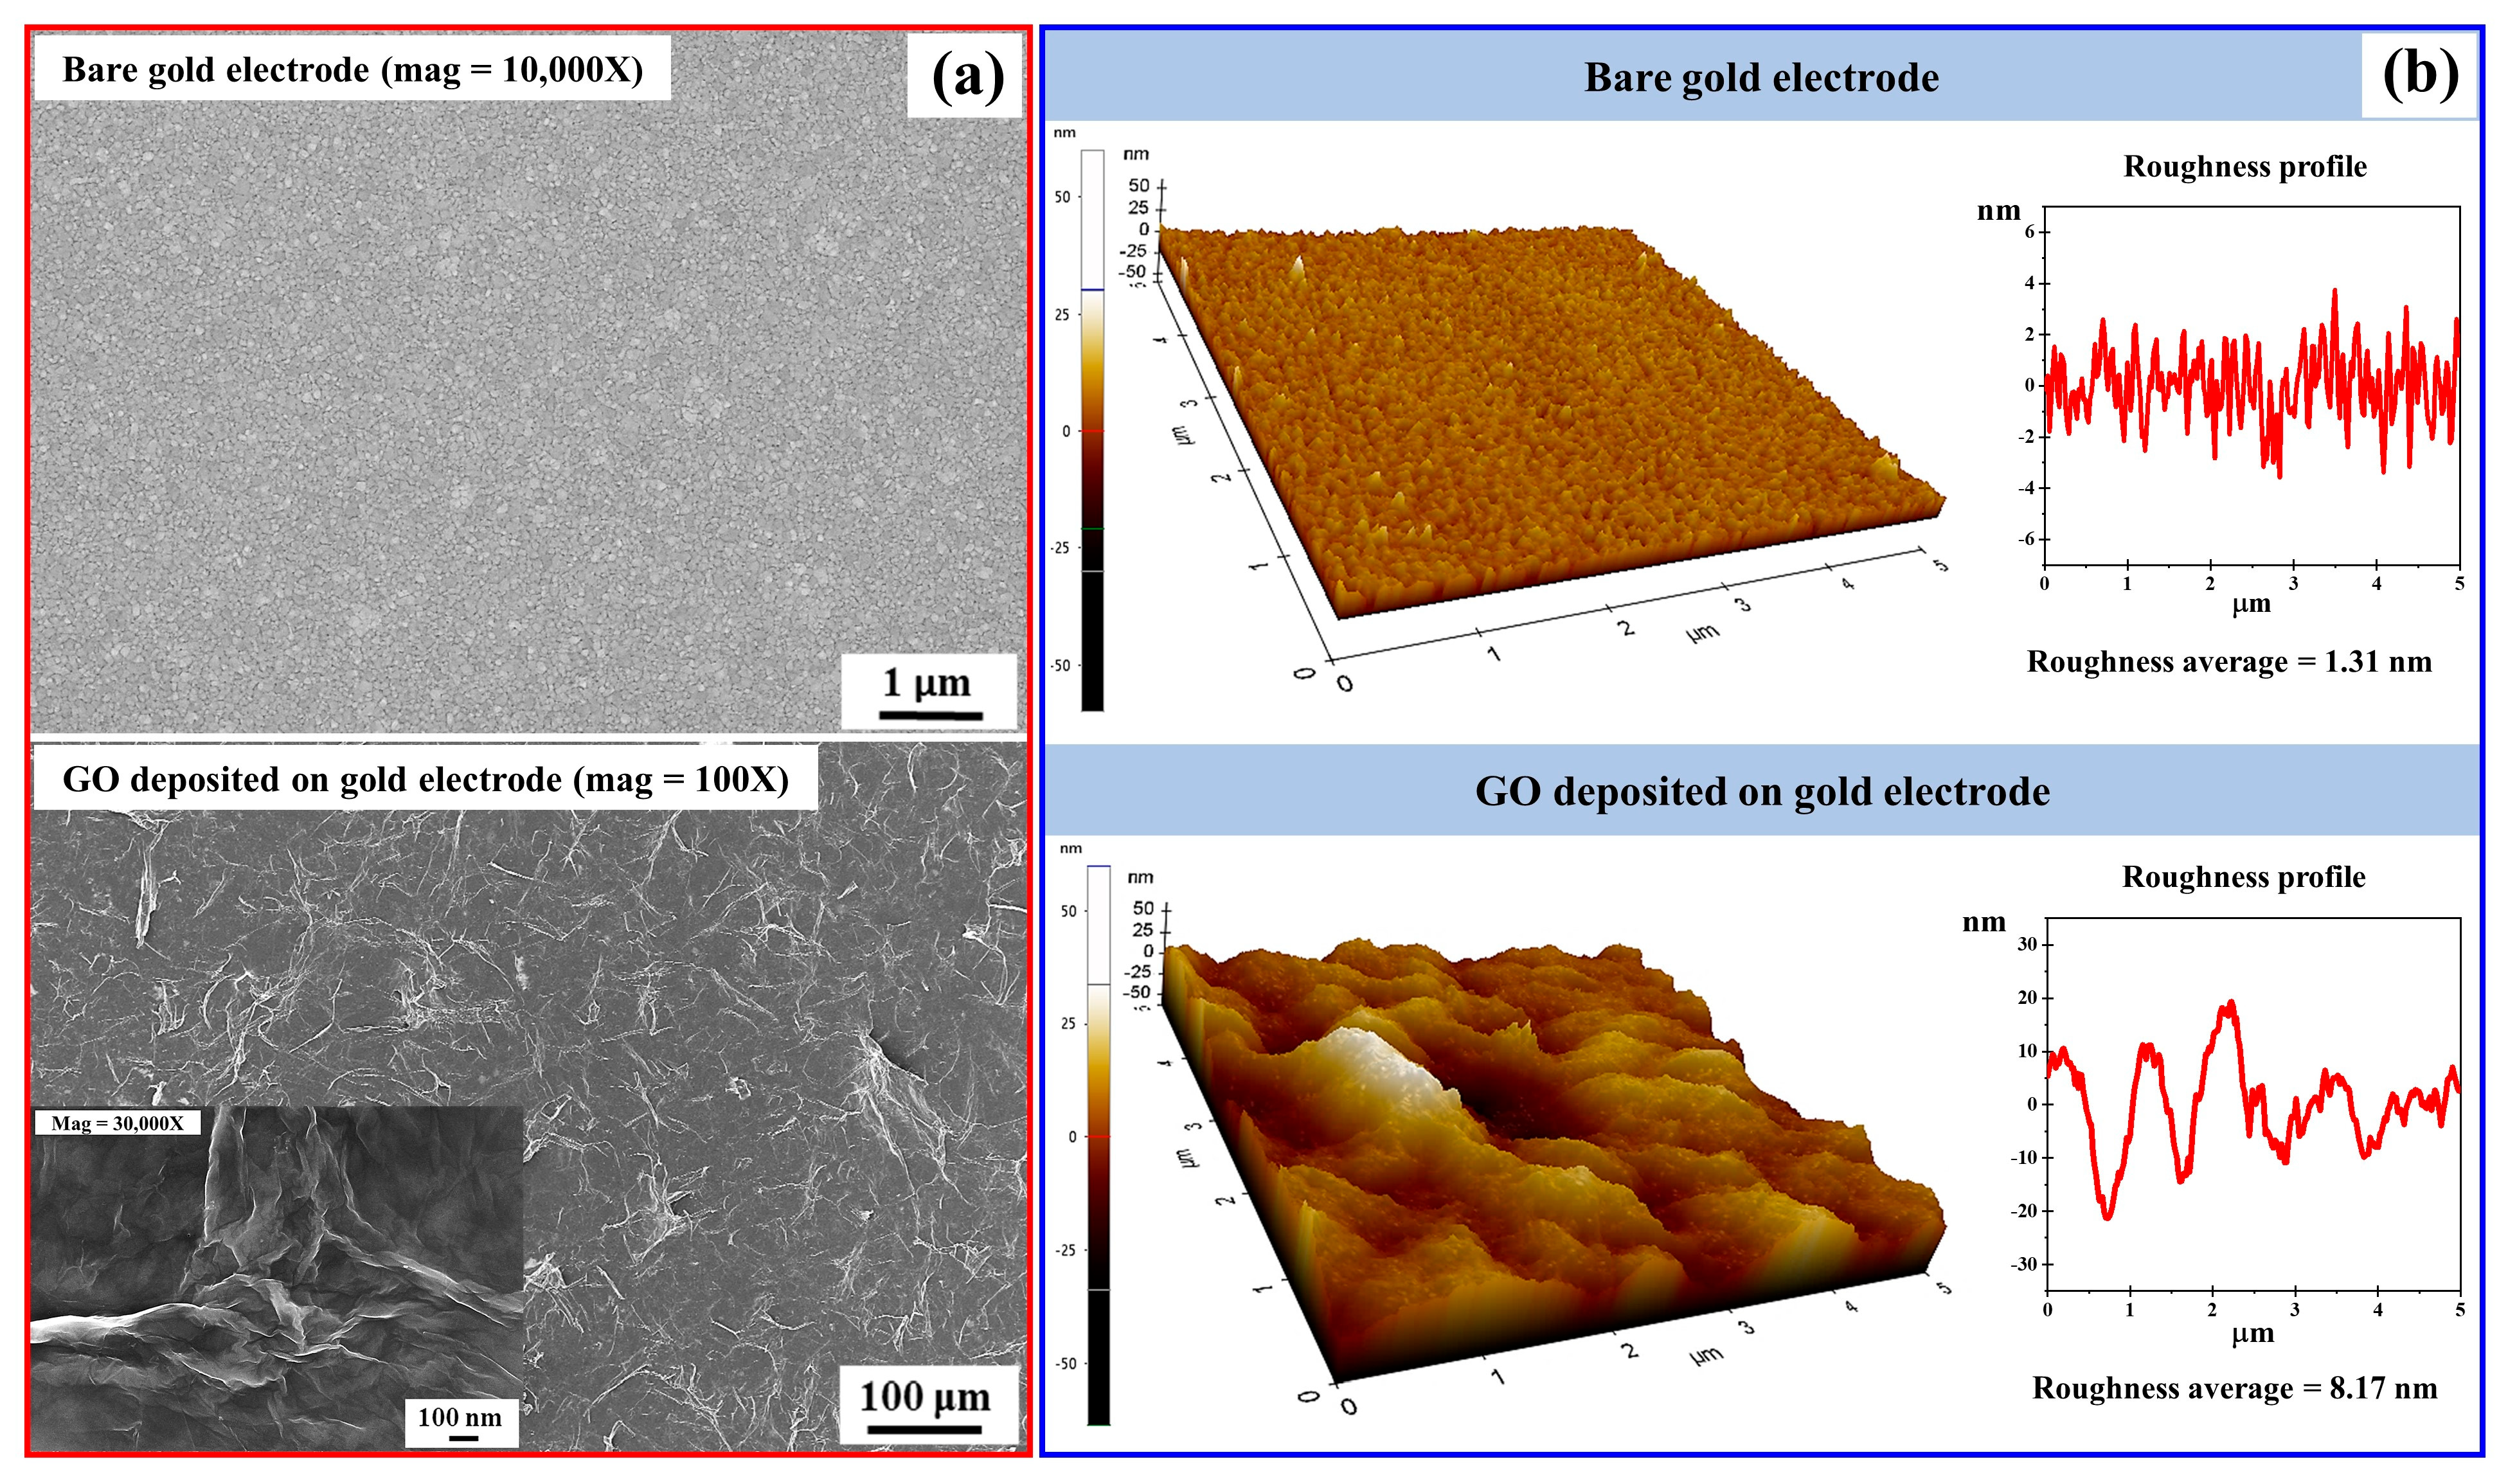
FE-SEM and AFM were employed to characterize the surface morphology of the bare gold electrode and GO-modified electrode. As shown in
Figure 3a, the bare gold electrode exhibited a typical grainy structure. Following GO modification, the surface morphology changed markedly. FE-SEM images revealed a continuous and uniform film of wrinkled, overlapping GO flakes. These features are consistent with exfoliated GO sheets forming a stable film across the electrode surface. The wrinkled morphology enhances the effective surface area and facilitates probe immobilization. AFM analysis provided further confirmation of these surface changes (
Figure 3b). Tapping-mode AFM images showed a smooth topology for the bare gold electrode, whereas the GO-modified electrode displayed a significantly rougher surface. Quantitative analysis revealed an increase in root mean square roughness (
) from 1.31 nm (bare gold electrode) to 8.17 nm after GO deposition. This marked increase reflects the incorporation of GO nanosheets and indicates successful modification. The enhanced roughness provides more binding sites for probe immobilization, thereby improving biosensor performance.
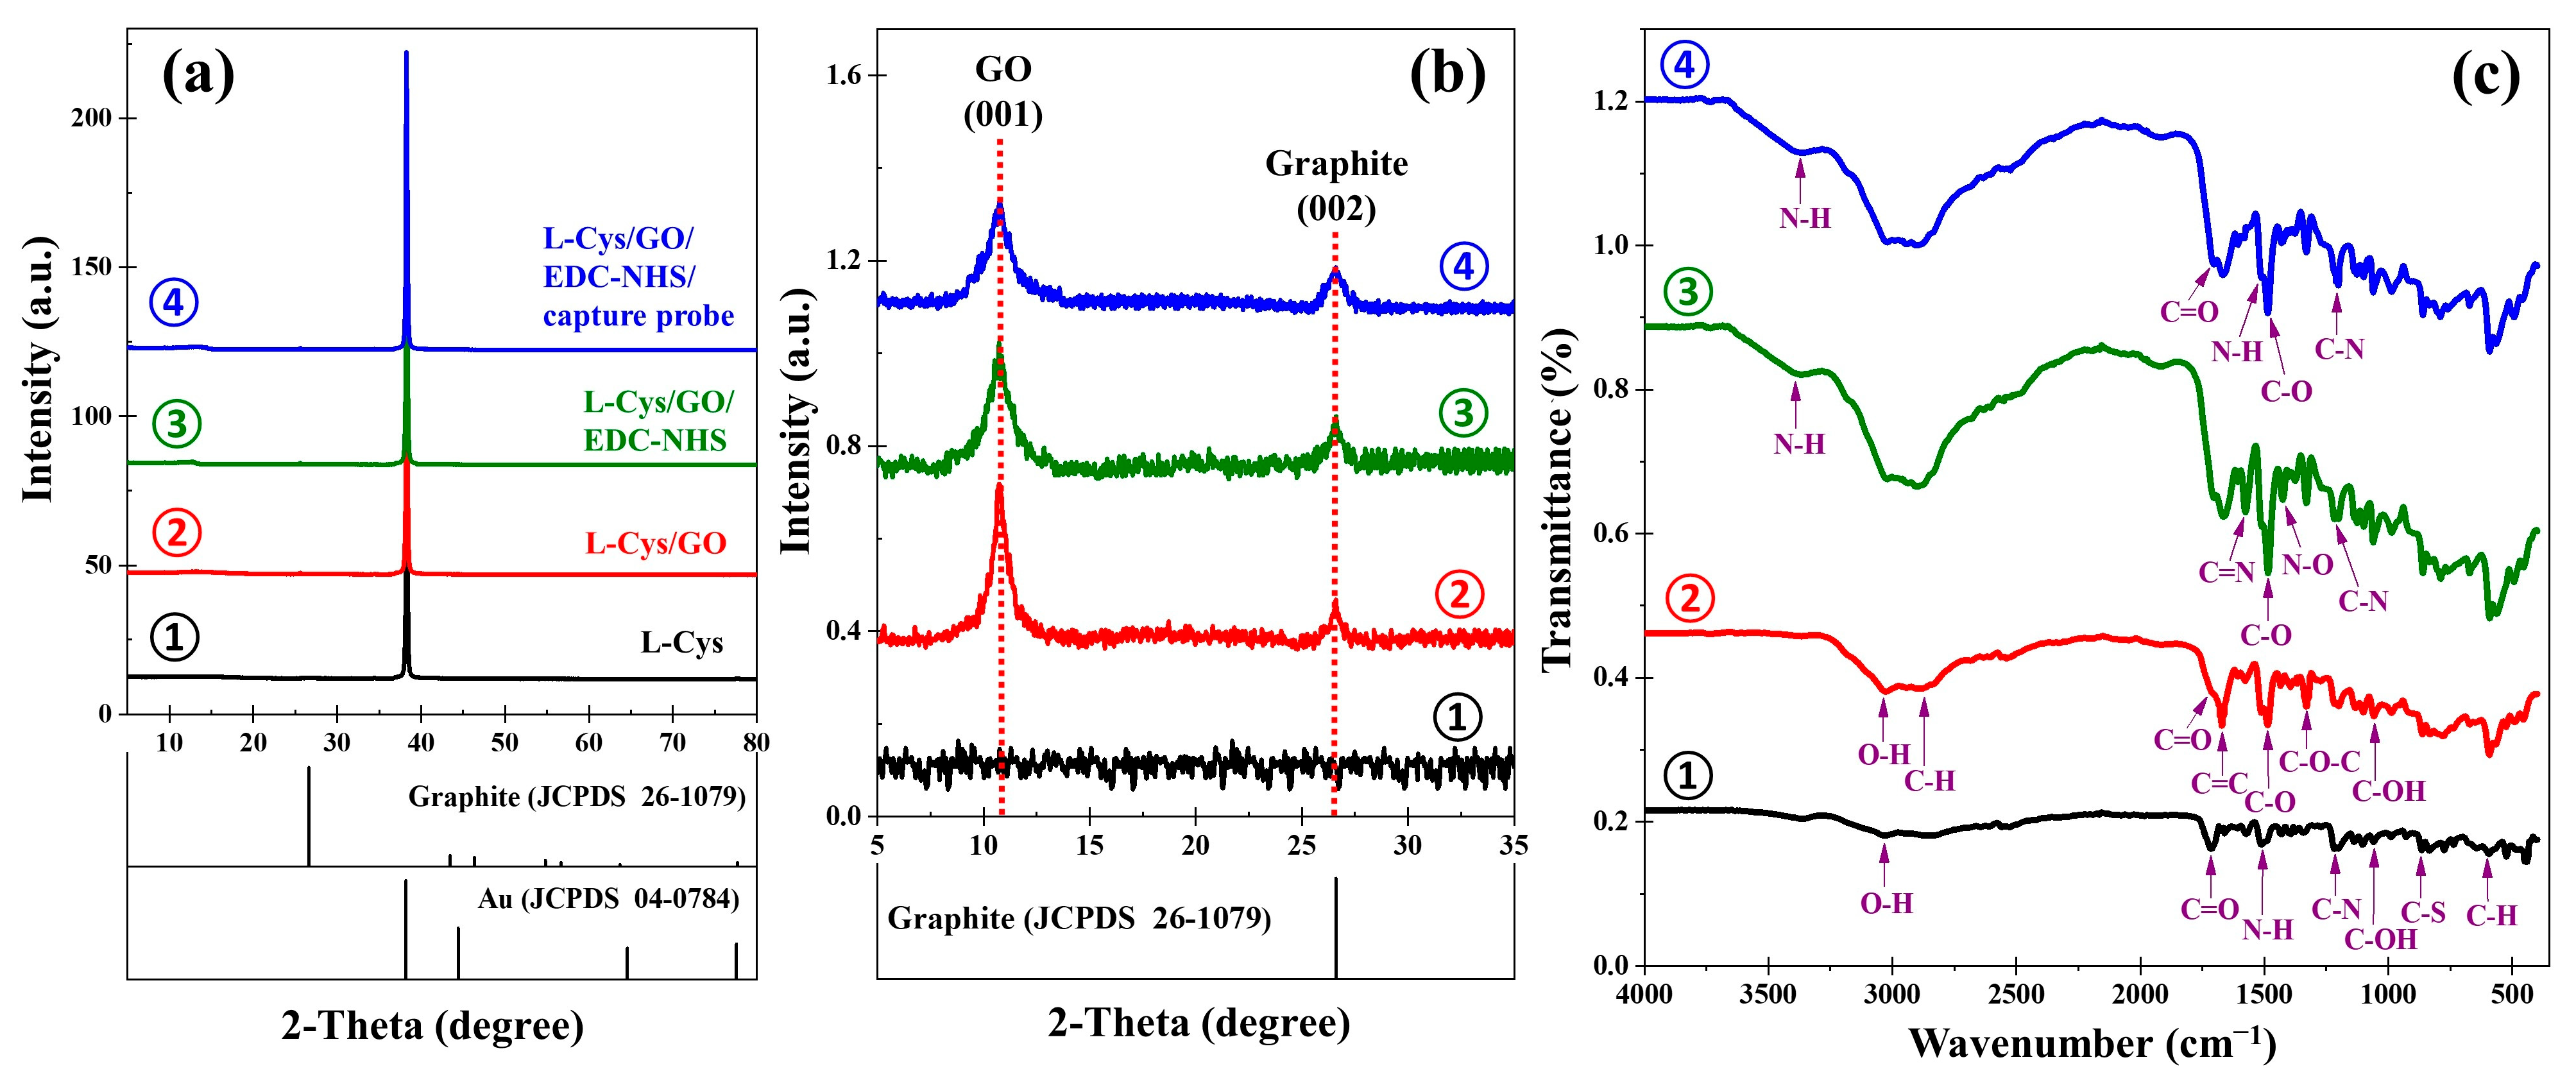
XRD was used to investigate the structural properties of the electrode layers. In
Figure 4a, all samples displayed a dominant peak at 2θ = 38.2°, corresponding to the (111) plane of gold (Au, JCPDS 04-0784). The 2θ region of 5° to 35° revealed additional features attributed to the GO material, as shown in
Figure 4b. A strong peak centered at 2θ = 10.7 was observed, which corresponds to the (001) plane of GO, confirming the successful oxidation and exfoliation of graphite into GO. Additionally, a minor peak observed at 2θ = 26.5°, assigned to the (002) plane of pristine graphite (JCPDS 26-1079), indicating trace amounts of unoxidized graphite. The shift in the diffraction peak toward lower angles is indicative of increased interlayer spacing, consistent with effective functionalization of graphite into GO.
The FT-IR spectrum was employed to monitor the chemical transformations on the sensor surface at each stage of modification, as shown in
Figure 4c. The L-Cys sample exhibited characteristic vibrational bands at 3033 cm
−1, 1714 cm
−1, and 1059 cm
−1, which are assigned to the OH (hydroxyl), C=O, and C–O stretching vibrations of the carboxylic group, respectively; whereas the peaks at 1512 cm
−1, 1202 cm
−1, 835 cm
−1, and 594 cm
−1 correspond to the N–H (bending), C–N (bending), C–S (bending), and C–H (bending) bands, respectively. Moreover, the absence of the S–H stretching band indicates the cleavage of the S–H bond and the subsequent formation of the S–Au bond, thereby confirming the successful immobilization of L-Cys on the gold surface [
20]. Upon GO deposition, new absorption bands appeared, showing strong peaks at 1728 cm
−1 and 1671 cm
−1 assigned to the C=O vibrations carboxylic group and C=C (aromatic) stretching vibrations of aromatic rings. Additionally, the FTIR band observed at 2900 cm
−1 is attributed to the asymmetric and symmetric stretching of CH
2 in GO. A broad peak spanning the range between 3026 cm
−1 emerged, which can be ascribed to the OH stretching vibrations arising from hydroxyl groups and carboxylic groups. The GO spectrum also exhibits bands corresponding to C–O (ester) at 1486 cm
−1, C–O–C (epoxide) at 1333 cm
−1, and C–OH (hydroxyl) at 1058 cm
−1, confirming the presence of oxygen-containing functional groups characteristic of GO [
14,
26]. Following EDC-NHS activation, spectrum shows intense peaks at 1576 cm
−1, 1426 cm
−1, and 3415 cm
−1, which can be attributed to the N–O stretch, C=N stretch, and N–H stretch, as well as C–N (1201 cm
−1) stretch in the amide bond due to the presence of EDC-NHS. These changes reflect successful activation of the carboxylic groups and availability of reactive NHS esters. After immobilization of the PCA3 probe, the C–N bands became more pronounced, while N–O and C=N signals diminished, indicating successful coupling between the amine groups of the capture probe and the carboxylated GO surface. The broad absorption band at 3415 cm
−1 was observed, consistent with N–H stretching of the immobilized amine-rich capture probe. The results confirm the successful covalent coupling of PCA3 probes onto the EDC/NHS-activated GO surface.
The combined FE-SEM, AFM, XRD, and FTIR analyses provide compelling evidence for the successful stepwise functionalization of the QCM sensor chip. The integration of L-Cys and GO nanosheets onto the gold electrode surface enhances the surface area and provides abundant functional groups for probe immobilization. The covalent attachment of PCA3 capture probes via EDC-NHS crosslinking further establishes the platform’s readiness for biosensing applications. The modifications result in improved morphological, structural, and chemical properties, laying the groundwork for high-sensitivity PCA3 detection in prostate cancer diagnostics.
3.2. Optimization Studies
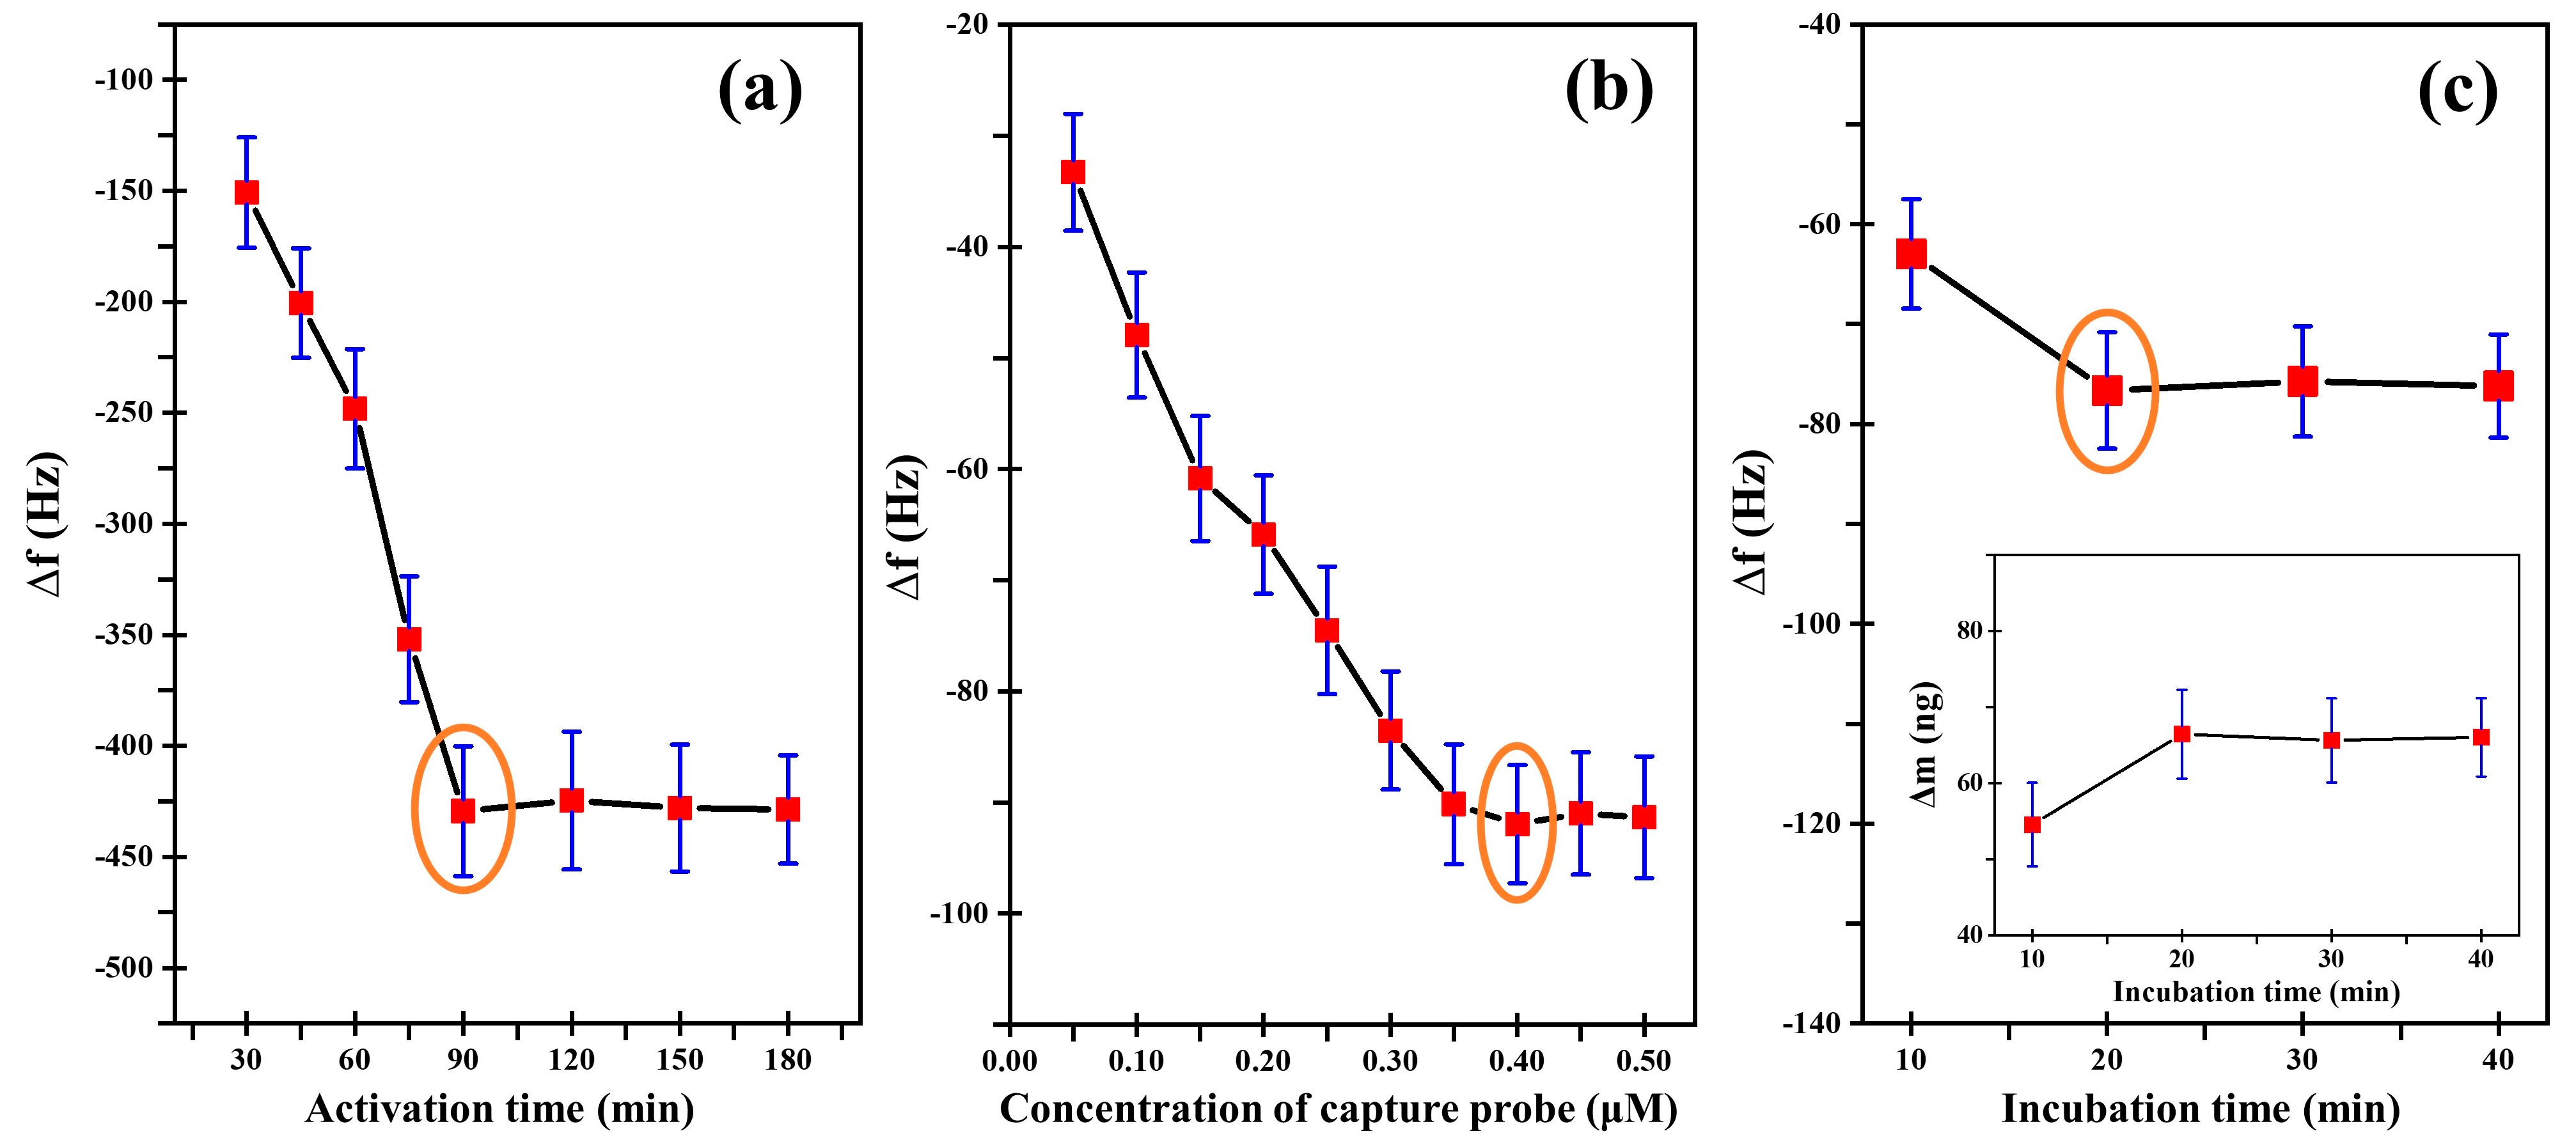
The influence of the activation time of EDC-NHS on the binding of capture probe was investigated.
Figure 5a illustrates the
resulting from the activation of carboxylic acid groups on the gold surface. The influence activation time duration was assessed by evaluating the peak
following the coupling of the activated groups. Activation times ranging from 30 to 180 min were tested, and
values stabilized starting was observed at 90 min. The maximum
was observed at 90 min, indicating optimal cross-linking efficiency. Therefore, an activation time of 90 min was selected as the optimal condition for subsequent layer deposition.
Figure 5b presents the frequency response upon increasing the concentration of the PCA3 capture probe, within the range of 0.05–0.50 μM. An increasingly negative
was observed with increasing probe concentration, which is attributed to the increasing mass on the sensor surface. The
stabilized beyond 0.35 µM, suggesting saturation of available binding sites. Consequently, a capture probe concentration of 0.40 µM was determined to be optimal, yielding the maximum
, and was employed in subsequent experiments.
To evaluate the sensitivity of the QCM biosensor for PCA3 detection, the frequency response of the hybridization between the capture probe (0.40 µM) and the PCA3 target was recorded. The effect of incubation time on target recognition was investigated using a PCA3 target concentration of 1.00 µM over time intervals ranging from 10 to 40 min. As shown in
Figure 5c,
became increasingly negative with incubation time and stabilized at 20 min, indicating completion of the hybridization process. No significant additional frequency change was observed beyond this point. Accordingly, a 20 min incubation was established as the optimal hybridization time. A nanogram-sensitive piezoelectric sensor detects changes in mass per unit area through shifts in its resonant frequency. The inset in
Figure 5c shows the corresponding mass changes (
), calculated using the Sauerbrey equation. At 20 min, the mass change was approximately 66.43 ng, confirming efficient target capture. The QCM sensor chip, functionalized with a 0.40 µM capture probe, consistently demonstrated a frequency shift of approximately −76 Hz upon exposure to 1.00 µM PCA3 target. These results suggest that the EDC-NHS coupling chemistry likely facilitates the covalent immobilization of amine-modified capture probes onto carboxyl-functionalized surfaces through CO–NH linkage. This strategy preserves the bioactivity of the probes by minimizing denaturation and ensuring effective target recognition. Furthermore, the presence of well-dispersed GO layers significantly increases the available surface area, enabling high-density probe immobilization and efficient biomarker detection.
3.3. GO-QCM Biosensor Performance for PCA3 Detection
Under optimized experimental conditions, GO was deposited onto the QCM surface to enhance functional group availability and improve probe immobilization efficiency. The GO-modified surface was subsequently activated with an EDC–NHS solution for 90 min to generate reactive ester intermediates capable of covalently binding amine-terminated capture probes. The optimal concentration of the capture probe was determined to be 0.40 μM, providing an effective balance between surface coverage and hybridization accessibility.
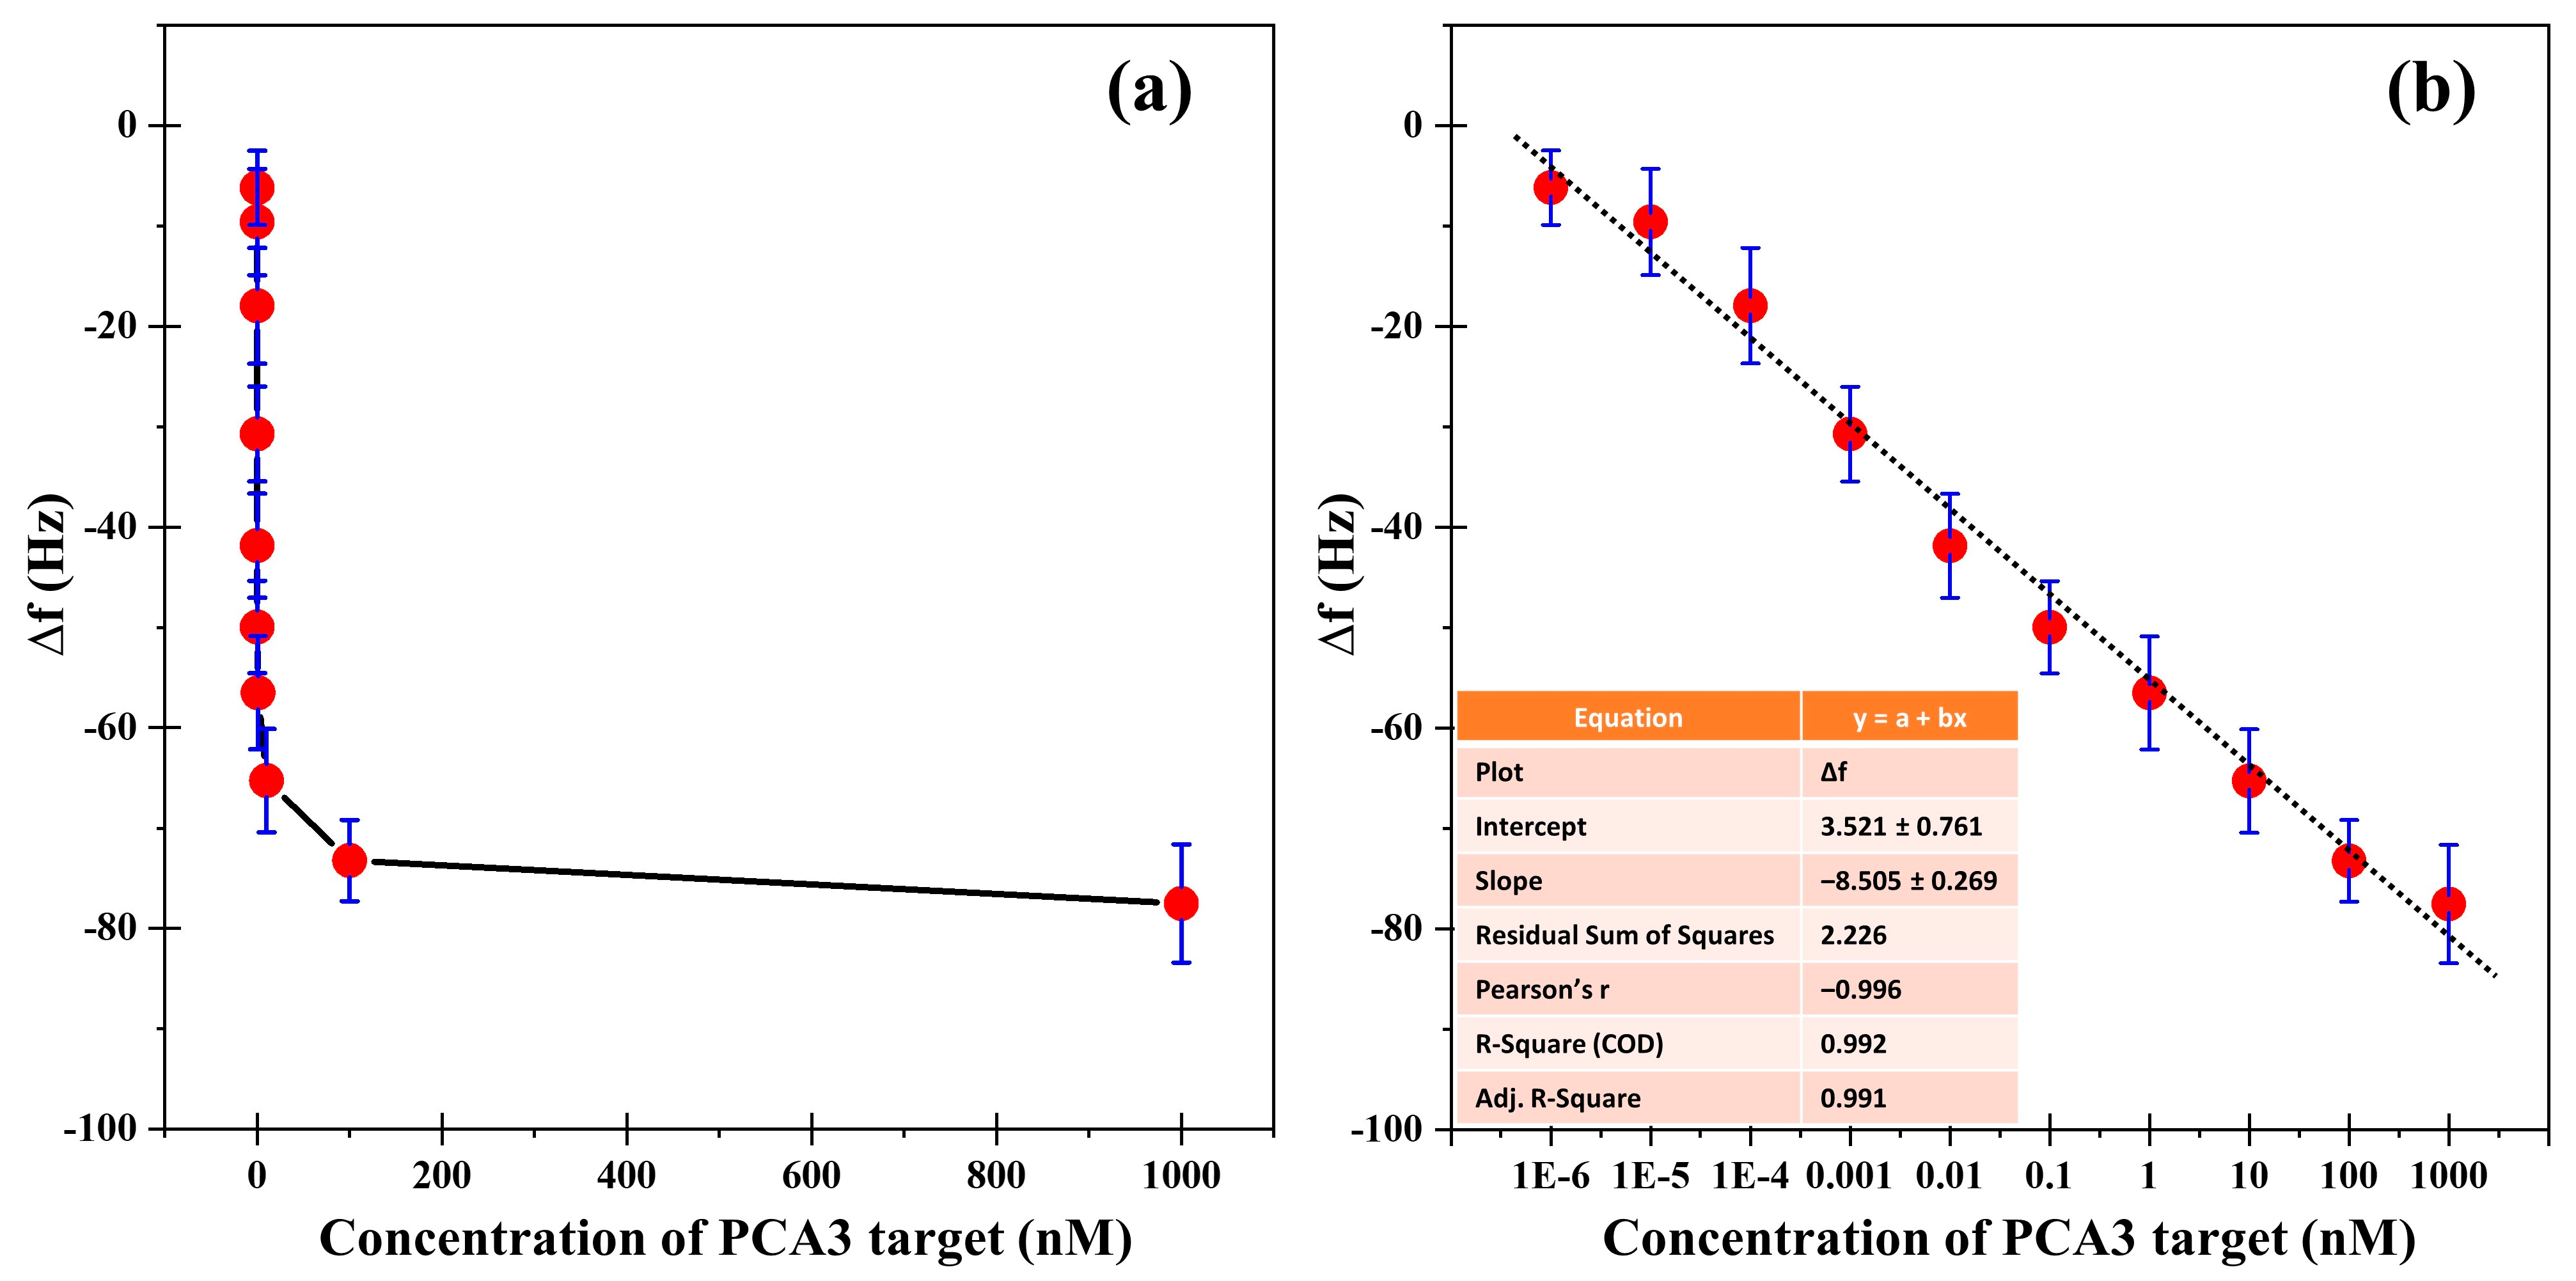
Following immobilization, hybridization experiments were conducted by injecting the PCA3 target across a concentration range from 1.00 fM to 1.00 μM. The
was recorded 20 min after the initial injection, followed by rinsing with PBS to remove unbound analytes. As presented in
Figure 6a, a marked and progressive decrease in frequency was observed with increasing PCA3 concentrations, signifying successful hybridization between the surface-bound capture probe and the complementary target sequence. The magnitude of
increased proportionally with target concentration, indicating efficient molecular recognition and mass loading on the sensor surface. The minimum detectable concentration of PCA3 was found to be 1.00 fM, demonstrating the exceptional sensitivity of the developed biosensor.
These observations highlight the critical role of GO surface functionalization in modulating the QCM response. The extensive surface area and abundant carboxylic groups of GO likely facilitate high-density probe immobilization and promote strong hybridization interactions, thereby enhancing the observed values.
A calibration curve was constructed by plotting
against the logarithm of PCA3 concentration, as shown in
Figure 6b. The resulting data displayed excellent linearity within the range of 1.00 fM to 1.00 μM, with a slope of 8.505 and a standard deviation of 0.761. The limit of detection (
LOD) was calculated according to the equation:
where
denotes the standard deviation and
is the slope of the calibration curve [
29]. The
LOD was determined to be 0.268 nM, confirming the high analytical sensitivity of the GO-QCM biosensing platform. The strong linear correlation (R
2 = 0.992) further verifies the accuracy and quantitative reliability of the system. In comparison with previously reported approaches (see
Table 1), the GO-QCM sensor exhibits competitive performance in terms of detection range, linearity, and precision.
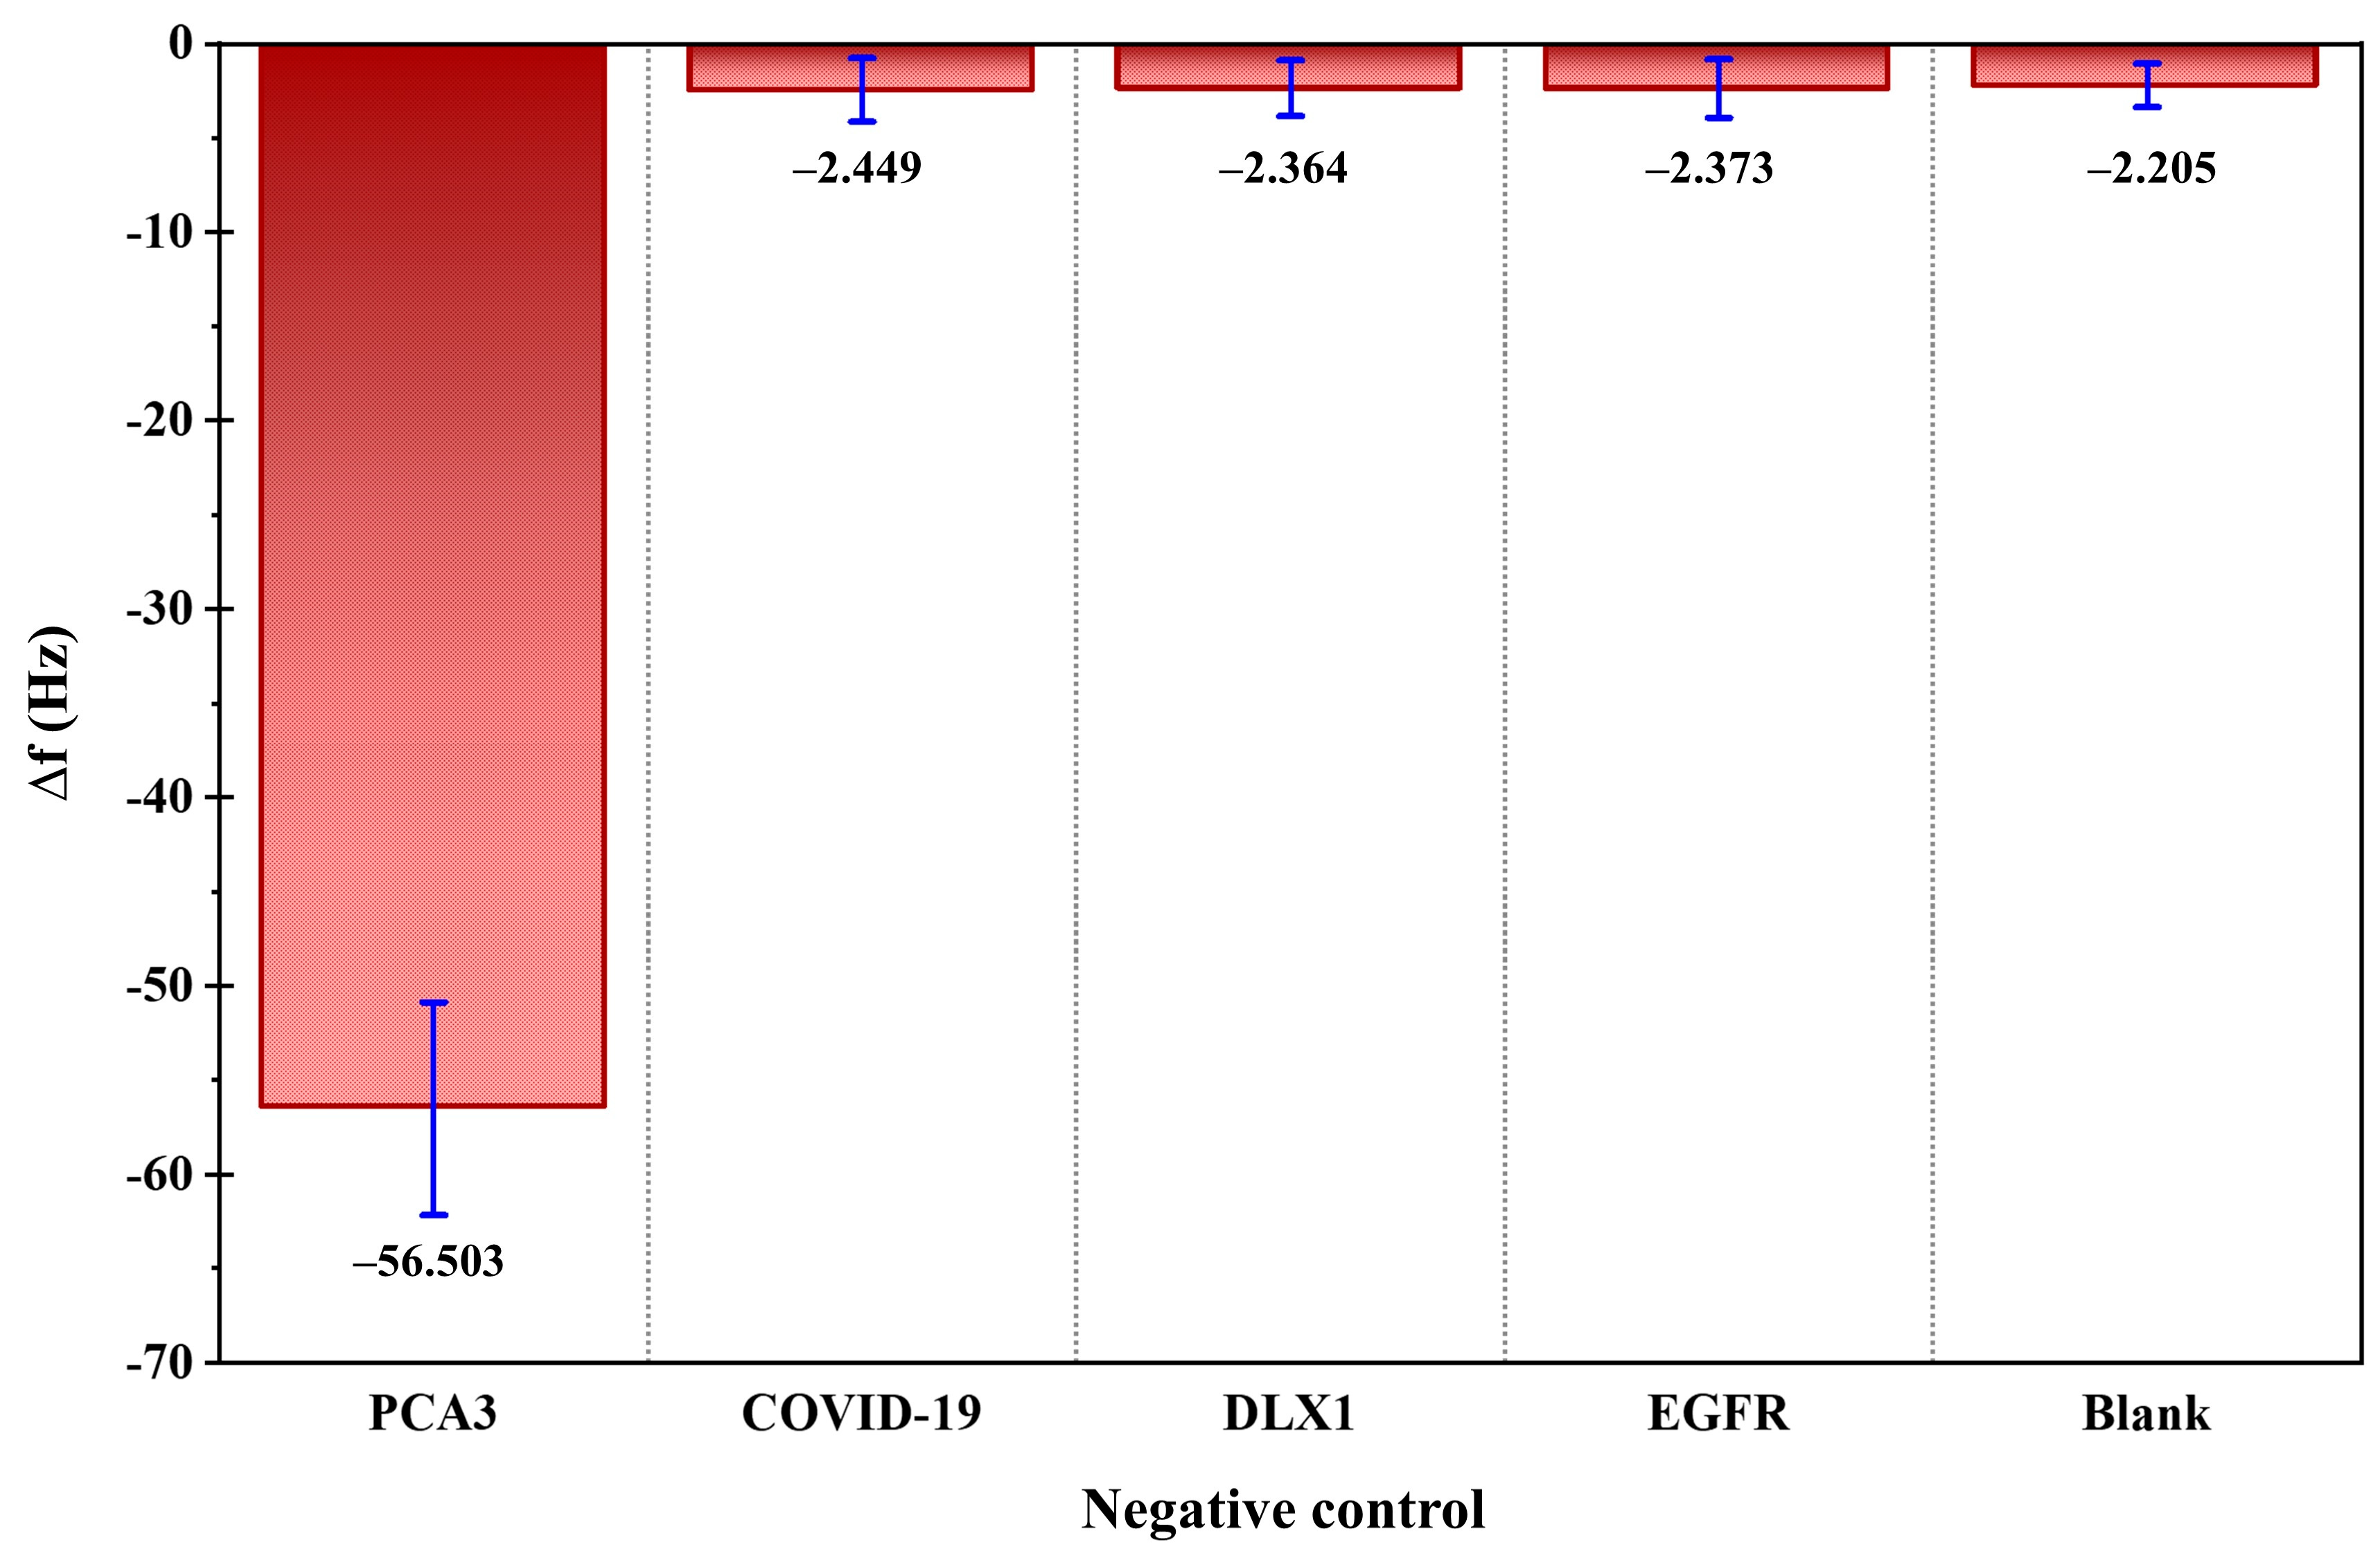
To evaluate the selectivity of the biosensor, control experiments were performed using non-target biomolecules including COVID-19, DLX1, and EGFR, each tested at 1.00 nM. As shown in
Figure 7, the QCM response (
) to these non-specific targets was negligible and close to the blank signal, substantially lower than the response observed for PCA3 even at 1.00 fM. This result confirms the high specificity of the sensor, which is attributed to the strong affinity and sequence complementarity of the immobilized PCA3 probe.
Collectively, these results demonstrate that the GO-functionalized QCM biosensor offers outstanding sensitivity, selectivity, and operational simplicity. Integration with the Xzense-101 QCM platform enables rapid detection within 20 min, underscoring its suitability for point-of-care testing and clinical diagnostics. The superior analytical performance and straightforward fabrication strategy establish this GO-QCM platform as a promising tool for early prostate cancer detection and a versatile analytical platform for biomarker quantification in diverse biomedical applications.
4. Conclusions
A GO-modified QCM biosensor was successfully developed for the sensitive and selective detection of PCA3, an established biomarker associated with prostate cancer. The integration of GO nanoparticles significantly improved the surface area and functional group density of the QCM electrode, enhancing probe immobilization efficiency and molecular recognition capability. Structural characterization by SEM, AFM, and FTIR confirmed successful GO functionalization and uniform film formation on the sensor surface. Systematic optimization of the EDC–NHS activation period, capture probe concentration, and incubation time resulted in reliable and reproducible sensor performance. Under optimized conditions, the biosensor exhibited a wide linear detection range from 1.00 fM to 1.00 μM, with an excellent limit of detection (LOD) of 0.268 nM. The sensor also demonstrated remarkable selectivity, producing negligible frequency shifts in response to non-target analytes such as COVID-19, DLX1, and EGFR, even at high concentrations. This specificity arises from the strong hybridization affinity between the immobilized PCA3 capture probe and its complementary target sequence. The developed GO-QCM biosensor offers a rapid, cost-effective, and label-free analytical platform for early prostate cancer detection. Its low detection limit, high stability, and short response time make it well-suited for point-of-care diagnostic applications. Furthermore, the simple and adaptable fabrication approach provides a versatile foundation for detecting a wide range of nucleic acid biomarkers, extending its potential utility in clinical diagnostics and biomedical research.
