Article

Design and Fabrication of a Compact Evaporator–Absorber Unit with Mechanical Enhancement for LiBr–H2O Vertical Falling-Film Absorption, Part I: Experimental Validation

by
Genis Díaz-Flórez
1,†,
Carlos Alberto Olvera-Olvera
1,*,
Santiago Villagrana-Barraza
1,
Luis Octavio Solís-Sánchez
2,
Héctor A. Guerrero-Osuna
2,
Teodoro Ibarra-Pérez
3,
Ramón Jaramillo-Martínez
3,
Hans C. Correa-Aguado
3 and
Germán Díaz-Flórez
1,*,†
1
Laboratorio de Invenciones Aplicadas a la Industria, Unidad Académica de Ingeniería Eléctrica, Universidad Autónoma de Zacatecas, Zacatecas 98160, Mexico
2
Posgrado en Ingeniería y Tecnología Aplicada, Unidad Académica de Ingeniería Eléctrica, Universidad Autónoma de Zacatecas, Zacatecas 98000, Mexico
3
Unidad Profesional Interdisciplinaria de Ingeniería Campus Zacatecas (UPIIZ), Instituto Politécnico Nacional, Zacatecas 98160, Mexico
*
Authors to whom correspondence should be addressed.
These authors contributed equally to this work.
Technologies 2025, 13(11), 538; https://doi.org/10.3390/technologies13110538 (registering DOI)
Submission received: 22 October 2025 / Revised: 15 November 2025 / Accepted: 16 November 2025 / Published: 19 November 2025
(This article belongs to the Section Manufacturing Technology)

Abstract

Compact, low-power absorption cooling supports decentralized refrigeration needs and is positioned here as a sustainable approach within environmental technologies. This paper presents the design, fabrication, and experimental validation of a compact LiBr–H2O evaporator–absorber, in which a low-energy fan assists in transporting refrigerant vapor from the evaporator to the absorber within a single vertical falling-film vessel. Twelve heat-load phases were tested with the fan OFF/ON, while temperatures, pressures, and flow rates were continuously monitored. The analysis focuses on temperature and pressure separation metrics, as well as a dimensionless separation index. Results show that fan assistance stabilizes thermal and pressure differentials and attenuates oscillations across grouped loads. The most significant benefits are observed at low to intermediate heat inputs, whereas the effect becomes marginal at higher loads, indicating the dominance of natural transport mechanisms. The compact unit remains thermally stable under all tested conditions. These findings indicate that a simple, low-power mechanical enhancement can improve controllability in an integrated evaporator–absorber without complex internal geometries. Protected under a Mexican utility model (IMPI, MX 4573 B), this prototype provides a replicable experimental basis for supporting compact, low-power solutions for sustainable, decentralized cooling in the field of environmental technologies.

1. Introduction

Absorption cooling systems represent one of the most promising alternatives within refrigeration technologies aimed at reducing electricity consumption and mitigating environmental impact. These systems have recently regained attention; however, they still face economic competitiveness challenges when compared to vapor compression refrigeration, particularly in residential or small-scale applications, due to significant initial investment costs [1,2]. Key limitations include slow dynamic response, high installation costs, and relatively low coefficients of performance (COP) [3]. Nevertheless, they remain a focal point of research due to their potential environmental and energy-related advantages [4].
From an economic and energy perspective, several studies [3,4,5] have emphasized the potential of absorption systems to reduce operational electricity demand in cooling applications, thus mitigating concerns related to rising energy prices and promoting energy independence [2,6]. Moreover, their compatibility with renewable sources such as solar [7,8,9,10,11,12], geothermal [13], and biomass [14,15], as well as their ability to recover low-grade waste heat from industrial processes [16,17], reinforces their suitability for sustainable cooling. Environmentally, absorption systems can reduce CO2 emissions associated with conventional fossil-fuel-based electricity generation [18,19], while employing benign refrigerants such as water, in contrast to ozone-depleting CFCs used in traditional vapor compression systems [1,4,20].
Despite these advantages, further progress depends on overcoming efficiency and cost limitations. As highlighted in previous works [1,2,21,22,23], the absorber remains the most critical and cost-intensive component, governing overall system performance and footprint. Enhancing coupled heat and mass transfer in the absorber is a central research objective, as such improvements could reduce the absorber’s surface area and overall system size, making the technology more viable [24]. Within the absorber, refrigerant vapor absorption into liquid solution is exothermic, releasing the heat of absorption, which must be removed promptly to ensure functionality [1,25,26]. Efficient absorption depends on optimized mass transfer (vapor into solution) and heat transfer (removal of heat), often requiring large surface areas or micro-structured surfaces to improve wettability and maximize contact between refrigerant and absorbent.
A conventional absorption system comprises five main components: absorber, generator, condenser, evaporator, and heat exchanger [3,13,21]. In the pursuit of miniaturization and simplification, some researchers [27,28,29,30,31] have integrated the evaporator and absorber into a single compact unit. Such designs feature vertical, parallel, or spiral configurations to extend vapor pathways and enhance absorption, enabling simultaneous evaporation and absorption in confined geometries. However, most existing compact configurations rely solely on passive mechanisms and lack mechanical elements, such as fans or agitators, that could actively enhance vapor–solution interaction, accelerating absorption and improving evaporation rates.
In addition to enabling forced convection of the refrigerant vapor, the present configuration provides several mechanical and operational advantages. The cylindrical body integrates the evaporator and absorber in a single compact vessel, minimizing the overall footprint and facilitating modular installation. The three sections are connected through flanged joints with polymer gaskets, which reduce the number of welded seams and simplify assembly and maintenance. The smooth cylindrical geometry avoids sharp edges or corners and improves vacuum resistance and mechanical safety, while the modular design allows scalable adaptation to different cooling capacities.
In response to this gap, the present work proposes an alternative compact evaporator–absorber design incorporating a low-energy axial fan as a mechanical enhancement element. This fan assists in the transport of refrigerant vapor from the lower (evaporator) to the upper (absorber) section through a controlled intermediate passage, reinforcing vapor–pressure and temperature gradients between thermal zones. Moreover, housing both components within a single vessel reduces system size, enabling compact integration and flexibility installation. The unit employs a vertical falling-film configuration with an H2O–LiBr working pair and is protected under a Mexican utility model (IMPI, MX 4573 B) [32], underscoring its technological originality.
The development of low-cost, compact, and mechanically assisted thermal systems aligns with the increasing demand for decentralized, off-grid, and environmentally sustainable cooling technologies. Devices based on gravity-driven flows, falling films, and minimal mechanical intervention are particularly suited for remote climate control and low-energy food preservation. Within the scope of environmental and future engineering technologies, compact evaporator–absorber units represent a promising pathway. Recent contributions in technologies highlight experimental advances in thermal management, from additive manufacturing for high-performance heat exchangers [33] to elastocaloric and vacuum-assisted concepts [34], reinforcing the interest in practical cooling innovations.
This study presents the design and fabrication of a novel evaporator–absorber unit, evaluated as a standalone module under controlled laboratory conditions, providing detailed experimental data on thermal behavior across multiple heat loads, including temperature, pressure, and flow profiles. In addition, this work experimentally evaluates a compact evaporator–absorber module operating under variable heat loads, with and without mechanical enhancement. Unlike conventional studies based on complete absorption cycles or COP-based assessments, this study focuses on local thermal and pressure separation metrics, providing high-frequency experimental data to characterize controllability within an integrated absorber–evaporator vessel. By reporting subsystem behavior prior to full loop integration, this work establishes a reproducible baseline for future engineering developments in decentralized and small-scale absorption cooling technologies.

2. Materials and Methods

A novel evaporator–absorber unit, developed as part of an absorption refrigeration system, was designed to operate with water (H2O) as the refrigerant and a lithium bromide (LiBr) brine as the absorbent. The unit was constructed at the Autonomous University of Zacatecas (UAZ), Mexico, based on a patented design registered in the Mexican Institute of Industrial Property [32]. One objective of this study is to experimentally evaluate the influence of a low-energy fan on the thermal behavior of the integrated unit under varying heat inputs. Electrical heaters impose twelve discrete thermal-load phases (Qin,1 to Qin,12). For each thermal load level, two operating conditions were tested, fan OFF and fan ON, to analyze the impact on vapor-pressure and temperature gradients between the cold (evaporator) and hot (absorber) sections. This prototype constitutes the integrated evaporator–absorber of an absorption system; the generator and condenser subsystems are not included. Therefore, this manuscript does not claim a nameplate cooling capacity or a system COP, since the prototype comprises only the integrated evaporator–absorber and not a complete system.

2.1. Design of the Evaporator–Absorber Unit and Experimental Setup

The experimental setup used to test the evaporator–absorber unit is shown in Figure 1. A schematic of the whole configuration is provided in Figure 1a, and a photograph of the assembled rig is presented in Figure 1b. The setup comprises the integrated evaporator–absorber module, a DC power supply, a data-acquisition system for temperature, pressure, and flow sensors, a coolant-water tank, a vacuum pump, and a control computer.
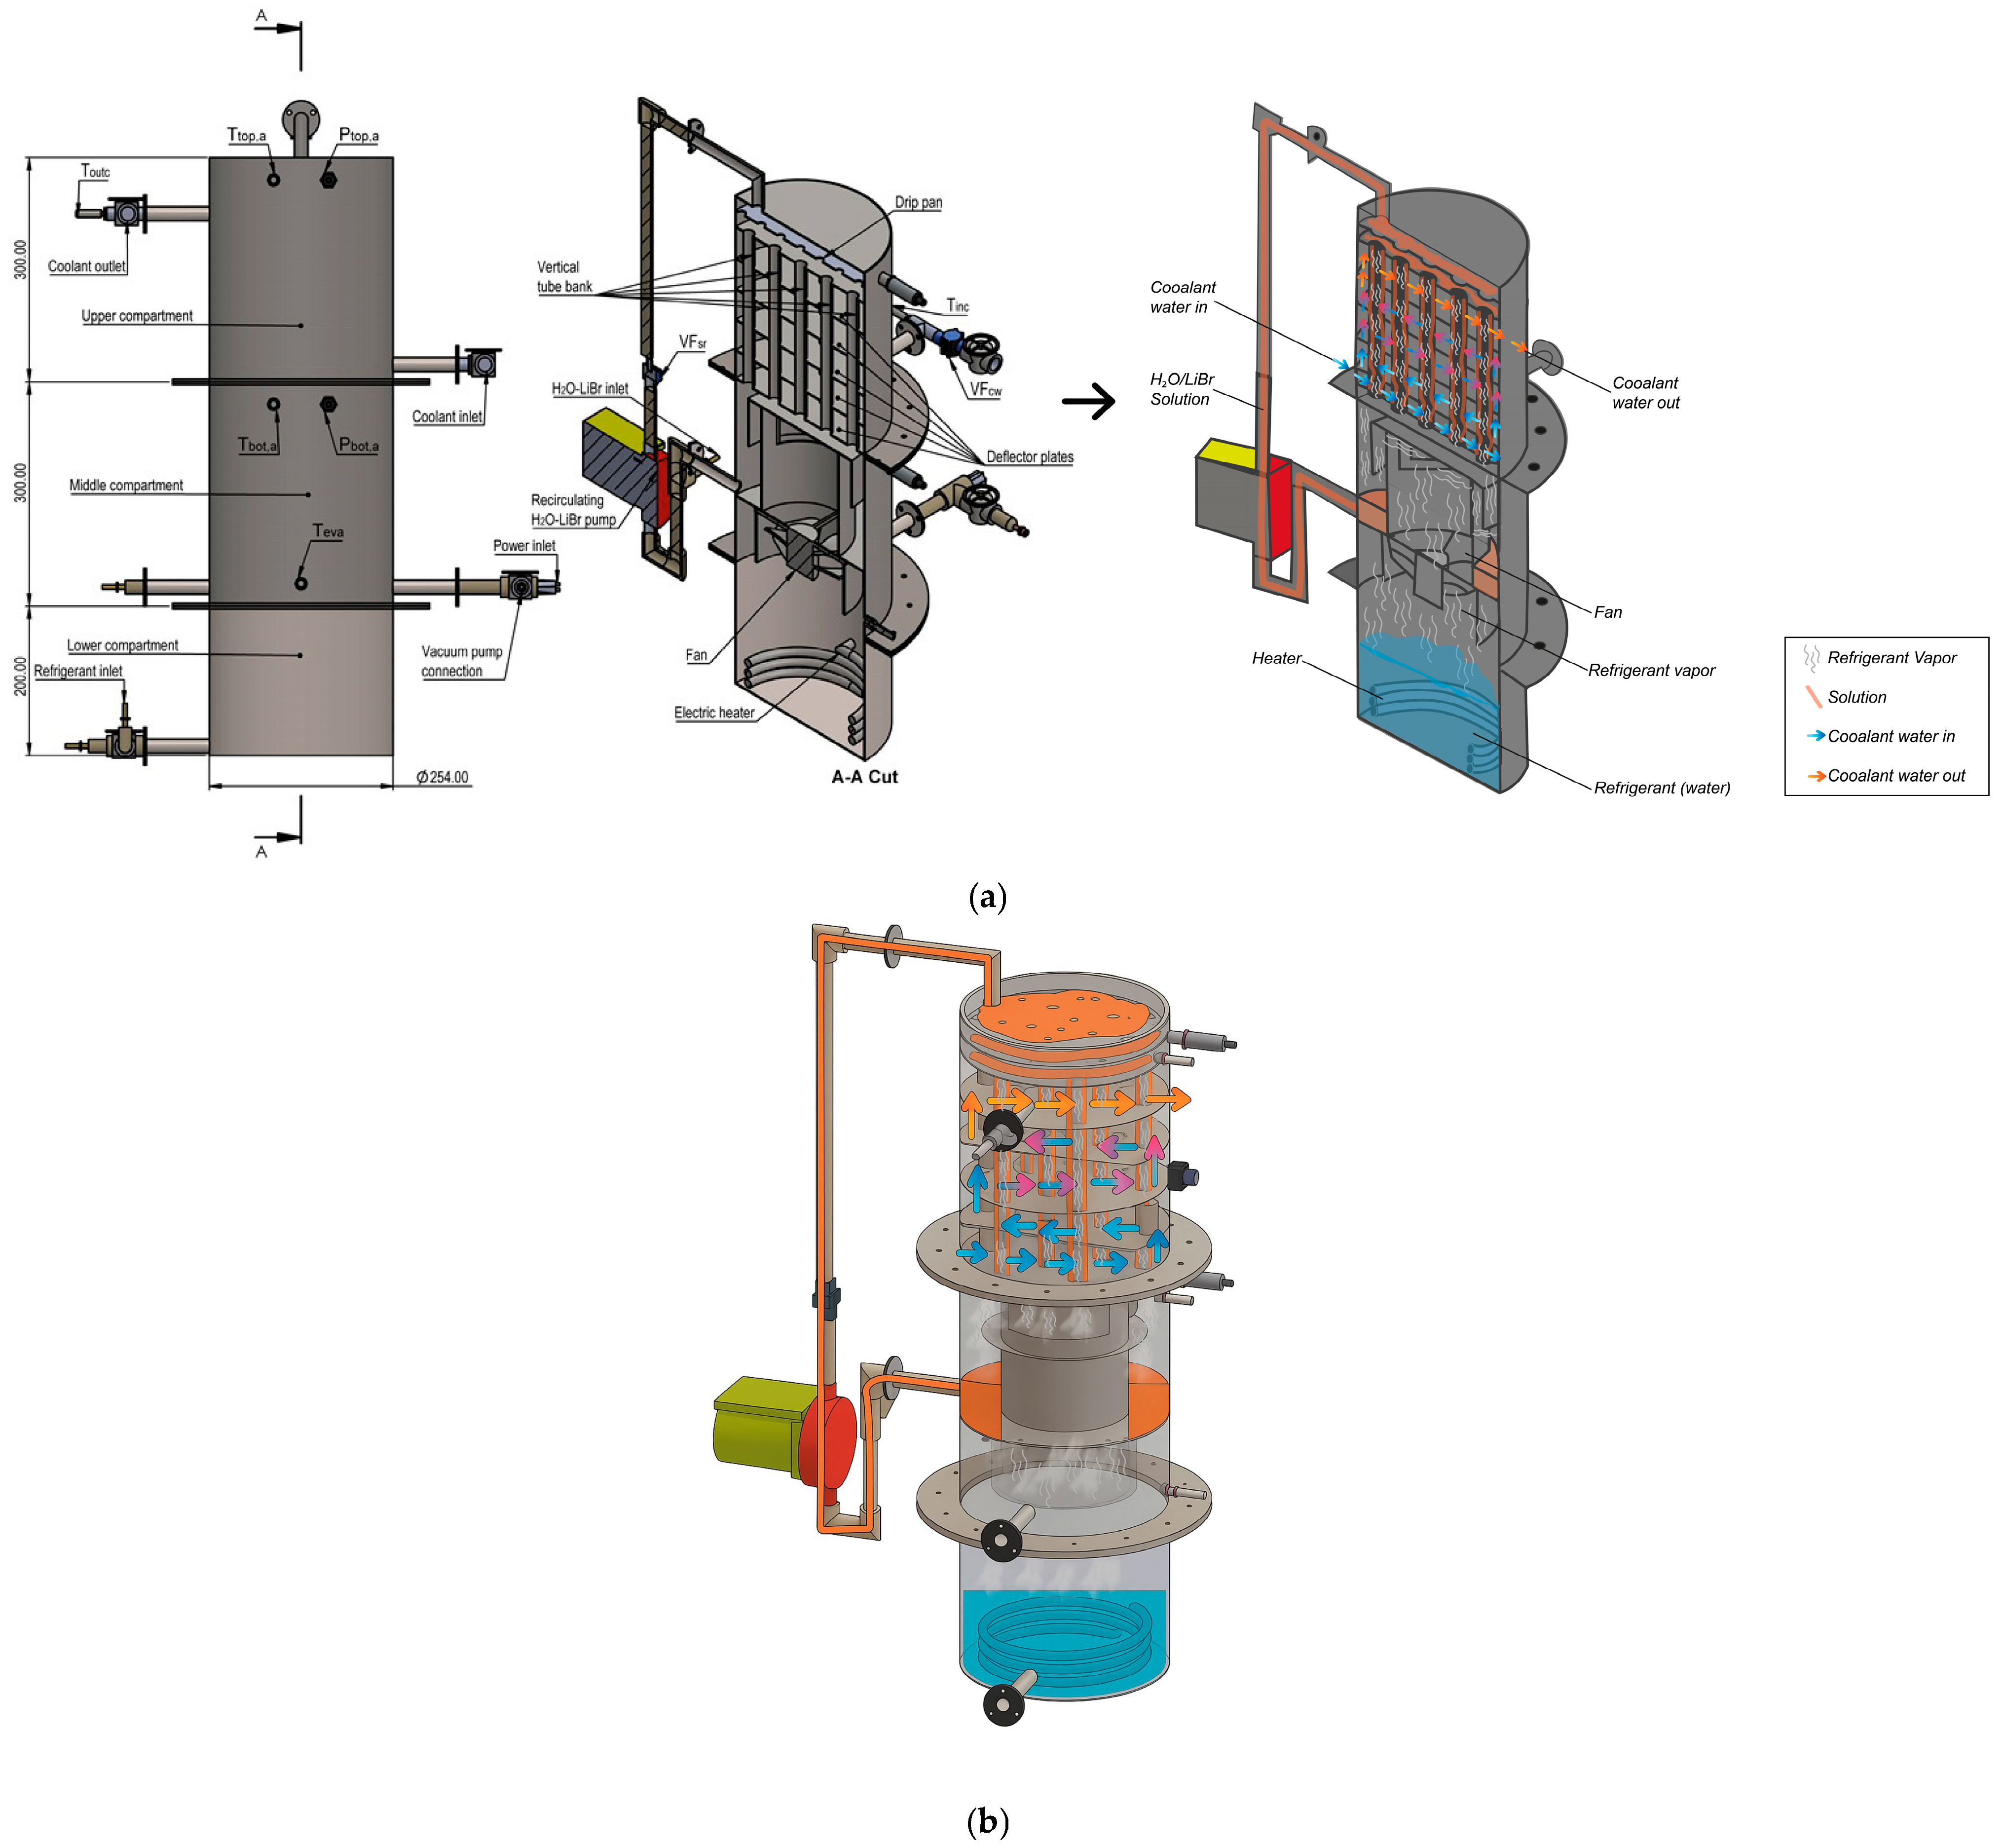
The unit is fabricated from stainless steel and consists of three vertically stacked cylindrical compartments connected by flanged joints (outer diameter: Ø 254 mm):
  • The lower compartment (height: 200 mm) acts as a reservoir for the refrigerant (H2O), where the evaporation process occurs. It includes an H2O inlet and two internal electric heaters used to simulate thermal load by generating refrigerant vapor.
  • The middle compartment (height: 300 mm) acts as a vapor transport chamber and temporary brine reservoir. It contains a 20 W fan, two temperature sensors (Teva and Tbot,a), one pressure sensor (Pbot,a), and a volumetric flow meter (VFsr). It also includes connections for the vacuum pump, brine recirculation loop, and initial loading of the LiBr solution. The middle section facilitates upward vapor movement from the evaporator and prevents cross-contamination between vapor and solution phases.
    An inner cylindrical shell surrounding the fan defines a vertical flow duct so that the refrigerant vapor generated in the lower compartment is drawn upward through this inner shell and discharged toward the upper absorber region.
    The integrated conveyance element is a compact 4-inch inline axial fan (≈100–110 mm outer diameter) housed inside the middle compartment. Fans of this size and rating typically operate at ≈2800 rpm under low static pressure and deliver nominal airflows of the order of 200 CFM (≈350 m3 h−1), consistent with the component in-stalled in the present bench. In this study, the fan was operated at its nominal fixed speed during all OFF/ON transitions, without external modulation.
  • The upper compartment (height: 300 mm) serves as a cross-flow tubular absorber. Internally, it features:
    • A perforated drip pan (2 mm holes) for uniform distribution of the falling film of LiBr solution.
    • A vertical tube bank consisting of 43 stainless steel tubes (12.7 mm OD, 1.25 mm wall thickness, 250 mm height), where refrigerant vapor absorption takes place.
    • On the shell side, coolant water flows across the tubes, directed by deflector plates spaced at 50 mm intervals, covering approximately three-quarters of the compartment’s cross-sectional area.
    • Additional components include a pressure sensor (Ptop,a), temperature sensor (Ttop,a), and connections for coolant water inlet/outlet, where two temperature sensors (Tinc and Toutc) and a flow meter (VFcw) are installed.
The LiBr–H2O solution is recirculated from the middle to the upper compartment by a magnetic-drive centrifugal pump (DC40-2470A Múnich BP-1209, 127 V AC, 120 W, 35 L·min−1, 9.5 m head, manufactured by High Power de Mexico, S.A. de C.V. in Guadalajara, Jalisco, Mexico). The pump lifts the solution to the absorber section, from which it descends by gravity as a falling film in counterflow with the refrigerant vapor. This arrangement guarantees film formation through the drip pan, while the magnetic coupling prevents leakage or air ingress. Its cost and compactness are suitable for small-scale or modular units. Its cost and compactness make it suitable for small-scale or modular absorption units. This experimental configuration corresponds exclusively to the integrated evaporator–absorber subsystem; generator and condenser components are not included in this stage of the study.
The upper compartment houses a vertical tube bank that operates as the absorber. The recirculated LiBr–H2O solution is delivered to a drip pan located directly above the tube inlets. This shallow tray, fitted with calibrated 2 mm orifices, converts the incoming stream into multiple low-velocity jets, which promote homogeneous wetting and form a gravity-driven falling film along the inner walls of the vertical tubes where the refrigerant vapor is absorbed. The corresponding heat of absorption is removed by the cooling water flowing on the shell side, i.e., outside the tube bundle: it enters through the lateral connection, is guided by deflector plates in a zigzag path to sweep the full tube length, and leaves through the outlet at the top of the upper compartment. This arrangement clearly separates the internal solution/vapor interaction from the external cooling-water circuit, as illustrated in Figure 2.
Figure 2 details the internal arrangement and sensor locations. A total of six temperature sensors monitor refrigerant vapor, LiBr solution, coolant water, and ambient air (Omega, model TC-K-NPT-U-72, Norwalk, CT, USA). Specifically, the absorber-region sensors (Ttop,a and Tbot,a) are mounted on the external shell wall of the compartment, providing a reliable measure of the ambient temperature near the falling film without direct immersion. Absolute pressure is measured at the top and bottom of the absorber using Omega PX309-015AI transducers (Omega Engineering, Inc., Norwalk, CT, USA). Flow rates in the recirculation and coolant lines are calculated with YF-S201 Hall-effect sensors (acquired in Zacatecas, Mexico). Signals are wired to OPTO 22 SNAP I/O modules and handled by a SNAP-PAC-R1 controller (OPTO 22, Temecula, CA, USA). The design is protected by a Mexican utility-model patent; full legal details are provided in Section 6. Details on sampling, filtering, ranges, and accuracies are summarized in Section 2.4.

2.2. Operating Cycle and Thermal Load Strategy

The operating cycle begins by evacuating the module with a vacuum pump until the internal pressure is close to 1 kPa (corresponding to a water saturation temperature of ≈6–7 °C). Once this condition is reached, the refrigerant (water) and the absorbent solution (LiBr–H2O) are introduced with an initial concentration of 59.76 wt% (Table 1). Because the internal pressure is low and the refrigerant charge is near ambient temperature (≈24 °C above its saturation temperature at 1 kPa), flash evaporation starts immediately after admission.
Before the test, the vessel was evacuated with a rotary-vane pump (ULVAC GHD-031A, ULVAC, Inc., Chigasaki, Kanagawa, Japan) to ≈1 kPa, verified on both the pump gauge and the internal transducers. Flanged joints with polymer gaskets ensured homogeneous evacuation. No measurable leakage was observed during the 2 h 46 min run, as evidenced by the stable pressure trace.
The LiBr–H2O solution was prepared immediately before testing by dissolving weighed LiBr salt in distilled water. The concentration was determined empirically from the measured masses of LiBr salt and distilled water, using a precision balance and density correlation tables (ρ= 1.724 g·mL−1 at 17.4 °C), which correspond to a mass fraction of 59.7 wt%. The mixture was prepared in a closed container and introduced into the unit within approximately two minutes to minimize ambient moisture absorption. The same solution was used for the entire test sequence, which consisted of a single continuous run with variable heat loads. Although the absorbent concentration gradually decreases as refrigerant vapor is absorbed during operation, its initial composition ensured stable performance throughout the test.
Start-up sequence, the system is then activated in stages. The LiBr recirculation pump is switched ON to establish the falling film in the upper compartment. Then the first thermal-load condition (Qin,1) is applied by energizing the two electric heaters in the lower compartment, with the fan still OFF. Vapor generated in the lower section rises through the middle section and meets the descending LiBr solution in the upper compartment, forming a counter-current configuration. After an observation interval with fan-OFF, the low-power fan is switched ON to assist upward vapor conveyance through the middle section.
The absorption of vapor into the LiBr solution is an exothermic process. The released absorption heat is transferred through the vertical tube bank to the coolant water flowing on the shell side. This heat is then removed from the system by the external cooling loop. The now enriched absorbent solution collects at the bottom of the middle compartment and is pumped back into the upper compartment, completing the cycle.
Subsequent thermal-load conditions (Qin,2 to Qin,12) are applied sequentially during a continuous test of 2 h 46 min 28 s. For each load phase, the unit follows a fixed order: first a fan-OFF sub-period and then a fan-ON sub-period. Dwell times were not enforced to be equal and varied due to the manual operation of the bench and the natural evolution of the process; as a result, the number of samples per sub-period differs across phases. Data are recorded continuously at 1 Hz. In the subsequent analysis (Section 2.3), time series are tagged by load phase and fan state; no steady-state assumption is imposed, and statistics are computed over the tagged intervals (with short guard bands around switch instants to avoid immediate switching transients).
Table 1 summarizes the initial charge conditions used to start the single continuous experiment. From this unique baseline, the unit was driven through twelve sequential thermal-load phases (Qin,1–Qin,12) as listed in Table 2. The selected heater powers span the practical operating range of the installed electric heaters for this lab-scale prototype, including low, intermediate, and near-maximum inputs, as well as three deliberate zero-load phases (Qin,5, Qin,9, Qin,12). This sequence emulates the range of heat inputs expected in small LiBr–H2O systems supplied by low-grade or intermittent sources and provides a controlled envelope to assess the response of the integrated evaporator–absorber.
Operational note. Heater power was adjusted manually via a potentiometer; therefore, thermal inputs did not follow perfectly constant setpoints. Apart from the intentional Q i n 0   W stage, load trajectories fluctuated around nominal values, and reflected realistic, bench-scale operation.
Additional note. This manual adjustment strategy, explicitly reported in Table 2 and Section 2.3, reflects the dynamic nature of real absorption modules. Because the tested evaporator–absorber is an original patented prototype rather than a replication of existing designs, the protocol was intentionally exploratory and oriented to functional validation. The analysis relies on continuously recorded data and dimensionless indicators, ensuring consistent quantitative comparison between fan-OFF and fan-ON conditions despite natural variability.
The continuous test lasted 2 h 46 min 28 s and comprised twelve sequential load phases, including three intentional zero-load baselines (Qin,5; Qin,9; Qin,12). Each phase duration was long enough to capture quasi-steady thermal and pressure behavior after each transition. The consistent enhancement of n across the three baseline points confirmed repeatability within a single run.

2.3. Data Reduction and Derived Metrics ( T , P , n )

Labeling and unequal dwell times. Signals were recorded continuously at 1 Hz and tagged by load phase k     1 , , 12 and fan state s     O F F ,   O N . For each ( k , s ), the analysis defines an interval I k ( s ) comprising all samples in that sub-period. Because the bench was operated manually, heater power and OFF/ON dwell times varied; no steady-state assumption is imposed. Short guard bands (a few seconds) around switching instants are excluded to avoid immediate switching transients. All statistics are computed over the tagged intervals I k ( s ) , allowing unequal N .
Temperature signals. The evaporator temperature is obtained directly from the evaporator sensor and converted to kelvin (calculations in K; reporting in °C):
T e v = T e v a + 273.15 ,
The representative absorber temperature is the arithmetic mean of the top and bottom absorber sensors, also converted to kelvin [35]:
T a b s = T t o p , a + T b o t , a 2 + 273.15 ,
Pressure signals. The absorber absolute pressure is the arithmetic mean of the top and bottom transducers:
P a b s = P t o p , a + P b o t , a 2 ,
Direct evaporator pressure is not measured; it is inferred from the evaporator temperature via a water saturation-pressure correlation (explicit form and coefficients in Appendix A; T in K , P in P a , later reported in k P a ) [36]:
ln P e v = C 1 T e v + C 2 + C 3 T e v + C 4 T e v 2 + C 5 T e v 3 + C 6 ln T e v ,
with P e v then converted to kPa for consistency with P a b s .
Temperature separation:
T = T a b s T e v ,
When reported in °C, T is numerically identical to the value in K.
Pressure separation:
P = P a b s P e v ,
Dimensionless temperature separation index. For each phase and fan state:
n O N = 1 N o n T a b s T e v T a b s ,
n O F F = 1 N o f f T a b s T e v T a b s ,
where
  • Tabs is the temperature in the absorber section;
  • Tev is the evaporator temperature;
  • N O N , N O F F are the number of samples for fan-on and fan-off conditions, respectively.
Filtering and outlier handling. Raw streams are denoised in post-processing using a median window followed by a moving average (Section 2.1); both operate causally on the time series and do not alter the OFF/ON tagging. Outliers due to spurious spikes are removed before computing summary statistics.
Physical meaning and scope of n. The index n quantifies the normalized separation between the hot section (absorber) and the cold section (evaporator) within each loading phase of the single continuous test. It is used as a local indicator for relative fan-OFF/fan-ON comparisons under identical boundary conditions and non-stationary signals. In this work, n is not intended as a global performance metric; system-level quantities such as absorber heat duty (Qabs) or absorption mass flux are intentionally not derived here, as they would require additional assumptions beyond the strictly experimental scope of this subsystem study.
Summary statistics and visualization. For each tagged interval I_k^(s), ΔT, ΔP, and n are summarized by the median and interquartile range (IQR). Percentile-based statistics are robust to unequal OFF/ON dwell times, mild non-stationarity, and occasional spikes, and avoid bias toward longer sub-periods. The phase-resolved median (IQR) values used in the comparison are reported in Section 3.
Units and significant figures. Temperatures for computation are in kelvin; pressures in kPa (after converting P e v from Pa). Reported values use consistent significant figures across OFF/ON comparisons within each phase.
Isolation of the fan effect. To minimize the influence of manual switching and short transients, the fan was continuously operated in an OFF/ON sequence within the same thermal-load phase, so both states shared comparable boundary conditions. For each phase and fan state, statistics (median and IQR) were computed over independently tagged sub-periods, which, combined with percentile-based metrics, allow for consistent comparison between fan-OFF and fan-ON conditions despite unequal dwell times and manual operation. The consistent increase of n observed during the three zero-load phases (Qin,5, Qin,9, Qin,12) confirms that the fan effect is systematic rather than random. A future automated version of the bench will allow fixed dwell times and controlled variable-speed fan tests.
Scope note on performance metrics. Because the bench deliberately excludes the generator and condenser, this paper reports local, directly measured indicators (ΔT, ΔP, n) for relative fan OFF/ON comparisons within the evaporator–absorber. Absorber-side heat/mass balances (e.g., Qabs) are outside the scope of this paper.
Thermal-load phases (Qin,1–Qin,12) correspond to distinct heater power adjustments applied during the single continuous test. After each change, the system was allowed to evolve until temperatures and pressures exhibited stable trends characteristic of that phase; analysis was then performed over the tagged OFF/ON intervals, leading to phase-specific sample sizes (N). Ambient temperature was recorded simultaneously and remained within a narrow band throughout the test (see Supplementary Material), so its influence on the internal temperature differences ΔT is negligible. These defined transitions between heater settings establish the phase grouping used in the subsequent analysis.

2.4. Measurement System and Sensor Accuracies

This subsection summarizes the acquisition settings and measurement accuracies used to compute the Part I metrics ( T , P , n ). Sensor types, models, and locations are described in Section 2.1 and Figure 2. No uncertainty propagation to heat or mass quantities is performed here (that analysis belongs to Part II).
Sampling and filtering. All channels were recorded at 1 Hz (one sample per second). To reduce high-frequency noise and outlier spikes in the raw data, a median-mean morphological filter was applied during post-processing. These operations do not alter the OFF/ON tagging nor the per-phase intervals defined in Section 2.3.
Use in this paper. Temperature and pressure channels feed the definitions of ΔT, ΔP, and n (Section 2.3). Flow channels were logged for monitoring only and are not used to derive heat or mass balances in Part I.
Table 3 lists the measurement ranges and accuracies adopted.

2.5. Uncertainty and Error Propagation for ΔT, ΔP, and n

Measurement uncertainties were estimated using first-order uncertainty propagation (GUM approach) based on the instrument accuracies listed in Table 3. The standard uncertainty of a derived quantity x is denoted u(x), and the expanded uncertainty is given by U(x) = ku(x) with k = 2, corresponding to a confidence level of approximately 95%.

2.5.1. Temperatures and ΔT

The representative absorber temperature is defined by Equation (2). The associated standard uncertainty is,
u T a b s = 1 2 u 2 T t o p , a + u 2 T b o t , a ,
u T = u 2 T a b s + u 2 T e v ,
Expanded uncertainties are reported as U n = 2 u n .

2.5.2. Inferred Evaporator Pressure, Pev

The evaporator pressure Pev is not measured directly. It is inferred from the measured evaporator temperature Tev using the standard saturation-pressure correlation for water given in Equation (4) (coefficients in Appendix A) [34]. This formulation is widely used in absorption-systems analysis and is valid over the temperature range covered in this study.
The standard uncertainty of the inferred evaporator pressure is obtained by linear propagation of the temperature uncertainty through the correlation:
u P e v P s a t T T e v       u T e v   u m o d e l ,
where   u T e v   is the standard uncertainty of the evaporator temperature sensor, umodel represents the contribution associated with the correlation fit error within its validity range, and denotes combination in quadrature.

2.5.3. Absorber Pressure and ΔP

The absorber pressure is defined from Equations (3) and (6), with standard uncertainty, as follows:
u P a b s = 1 2 u 2 P t o p , a + u 2 P b o t , a ,
u P = u 2 P a b s + u 2 P e v ,
The corresponding expanded uncertainties U P = 2 u P are listed in Appendix B (Table A1).

2.5.4. Dimensionless Index, n

For a single sample, the local dimensionless index is defined as, f = T a b s T e v / T a b s = 1 T e v / T a b s . Applying linear uncertainty propagation,
u f = f T e v 2 u 2 T e v + f T a b s 2 u 2 T a b s = 1 T a b s 2 u 2 T e v + T e v T a b s 2 u 2 T a b s ,
The reported index n for each phase and fan condition is the mean f over the corresponding tagged interval. For practical evaluation, u(n) is estimated using the phase-median temperatures of the evaporator and absorber in the above expression.

2.5.5. Reporting

All expanded uncertainties U T ,   U P e v , U P a b s , and U n are compiled phase by phase and for both fan states, in Appendix B (Table A1).
Percentile-based statistics (median and IQR) employed in the main text remain robust against unequal dwell times and mild non-stationarity; the uncertainty analysis presented here complements this robustness by providing quantitative error bounds on the derived quantities.

3. Results

The electrical heaters were adjusted manually, so thermal inputs did not follow perfectly constant setpoints. To facilitate the visualization and interpretation of the results, the thermal loads were grouped based on their magnitudes. For example, Qin,1, Qin,6, and Qin,10 were grouped together since their power values, 219.393 W, 222.478 W, and 223.170 W, respectively, are very close. These constitute Group 1. Similarly:
  • Group 2 includes Qin,2, Qin,7, and Qin,11;
  • Group 3 consists of Qin,3, Qin,4, and Qin,8;
  • Group 4 is formed by Qin,5, Qin,9, and Qin,12.
For each phase, the unit followed a fixed OFF→ON order (Section 2.2 and Section 2.3). Because OFF/ON dwell times differ across phases, quantitative comparisons rely on the phase-level median (IQR) listed in Table 4; Subsequent time graphs provide visual context.
Figure 3 overviews the measured variables; Figure 4 and Figure 5 present ΔT and ΔP by group; Table 4 summarizes per-phase extrema and medians and includes the sample counts.

3.1. Experimental Results and Monitored Variables

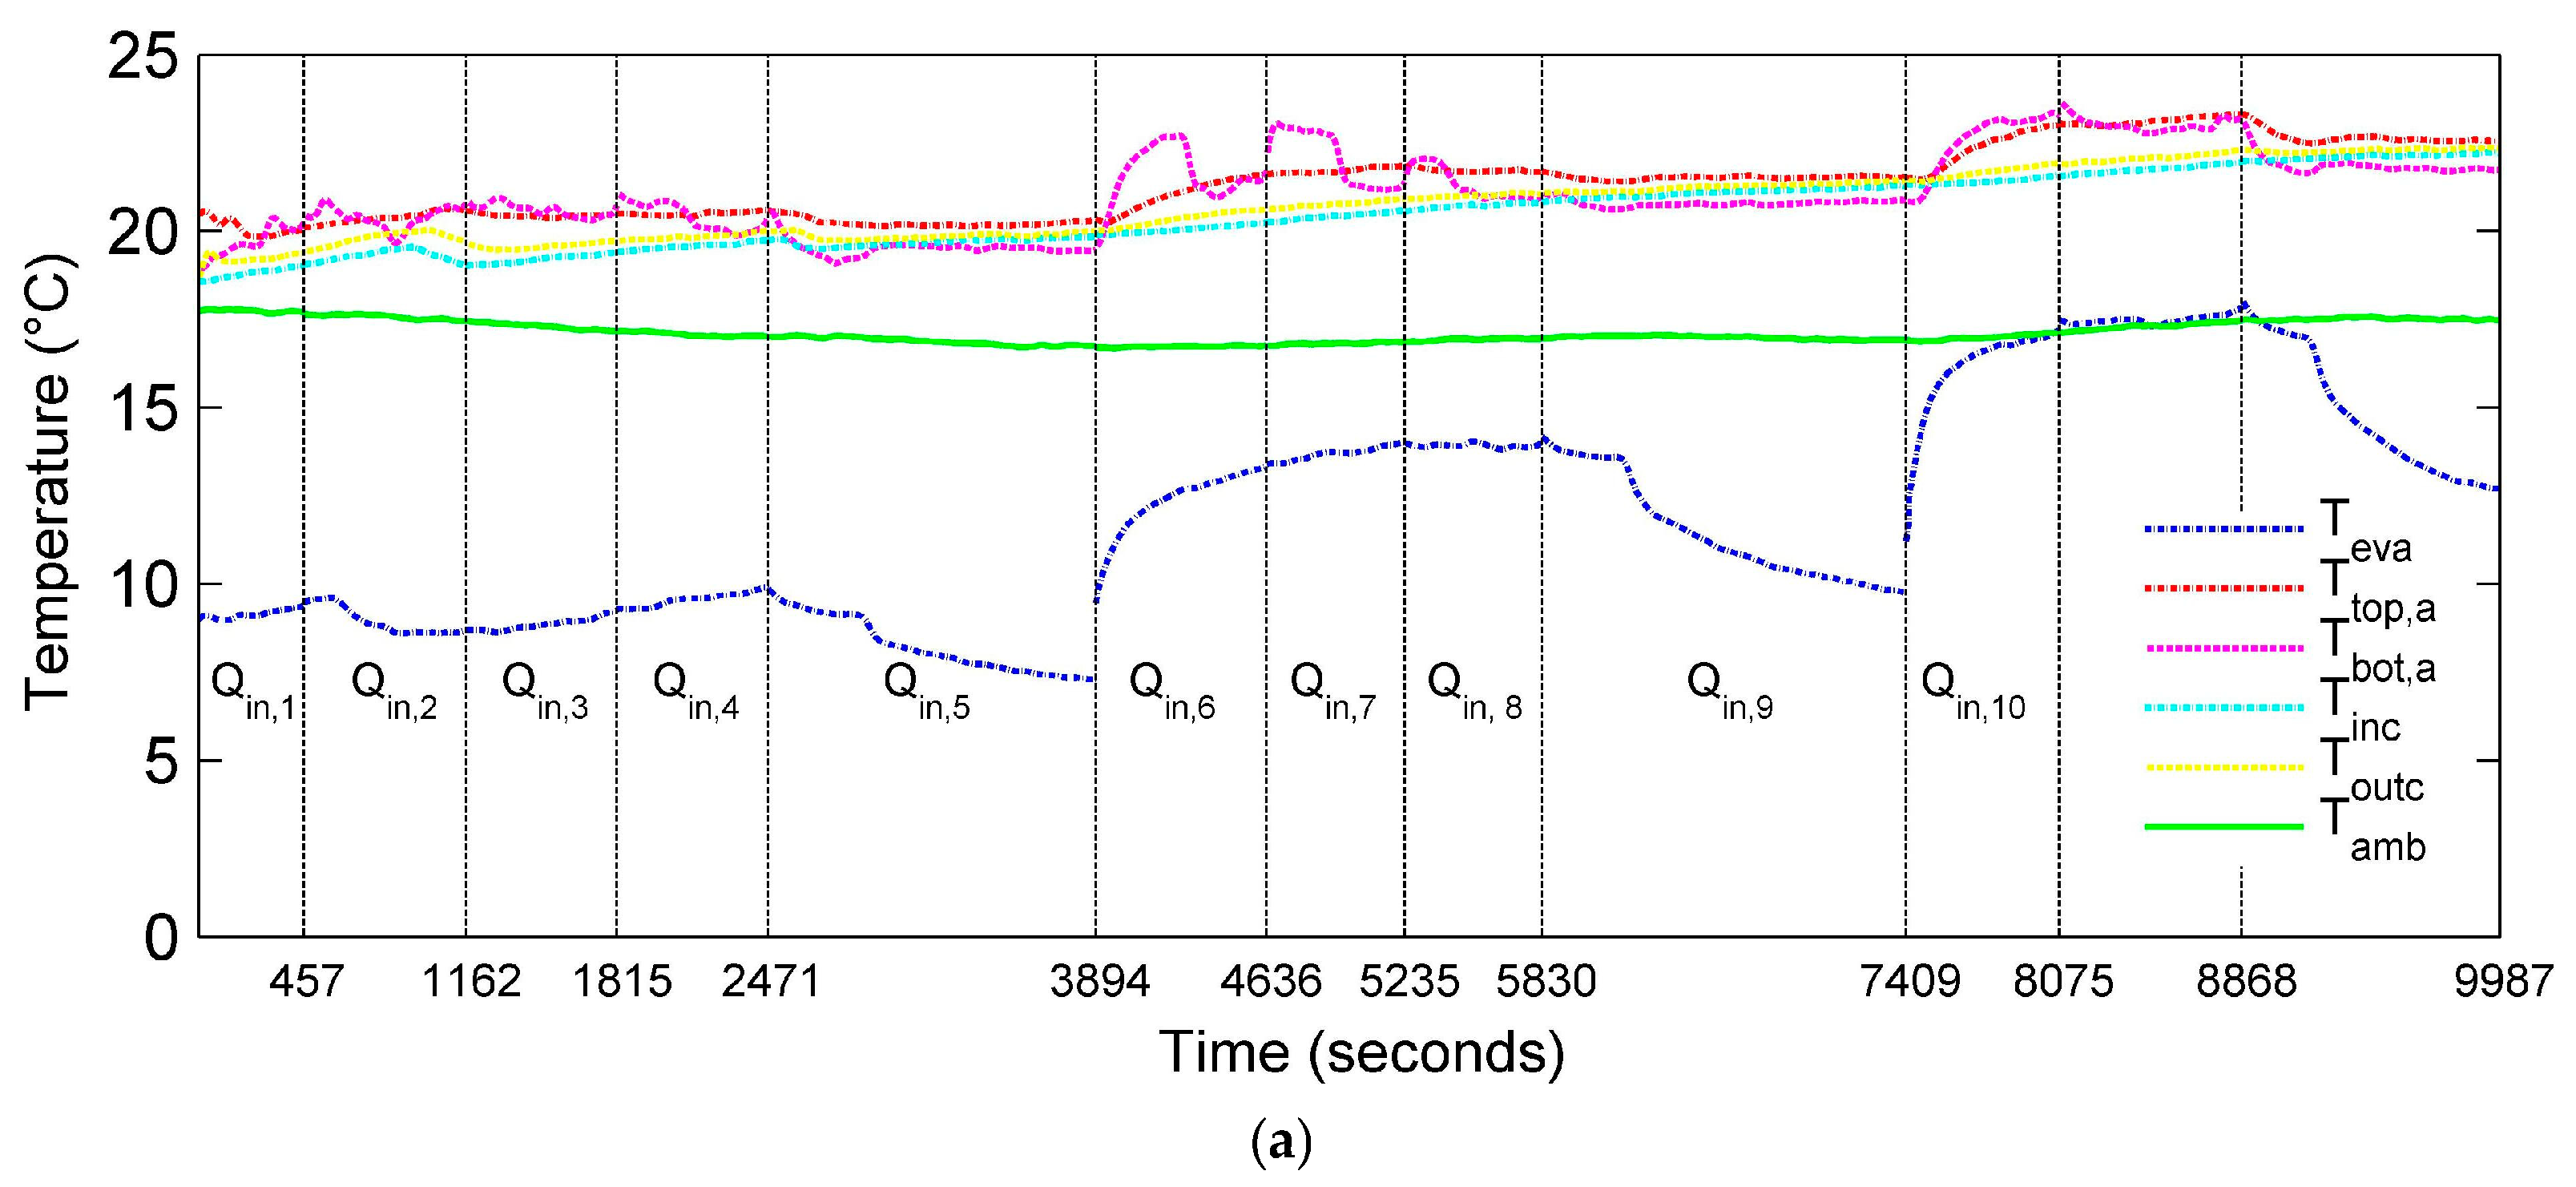
Figure 3 presents the variations in the measured variables during the test of the evaporator–absorber unit operating with an H2O–LiBr working fluid under different thermal loads applied via electric heaters. The vertical dashed lines indicate the duration of each thermal load interval.
Figure 3a illustrates the temperature profiles obtained during the evaporation–absorption test. For the evaporator section (Teva, blue profile), the maximum and minimum recorded temperatures were approximately 18.1 °C and 7.3 °C, respectively, with an average value of 12.0 °C. At the top of the absorber (Ttop,a, red profile), the temperature ranged from 19.8 °C to 23.3 °C, with an average of 21.4 °C. At the bottom of the absorber (Tbot,a, magenta profile), values ranged from 18.9 °C to 23.7 °C, with a mean of 21.1 °C.
The sensor at the coolant water inlet (Tinc, cyan profile) recorded temperatures between 18.6 °C and 22.2 °C, with an average of 20.5 °C. Meanwhile, the outlet temperature (Toutc, yellow profile) varied from 18.6 °C to 21.4 °C, with an average of 20.8 °C. The ambient temperature (Tamb, green profile), corresponding to the room conditions, fluctuated between 16.7 °C and 17.8 °C, with a mean value of 17.1 °C.
Figure 3b shows the pressure profiles measured in the absorber section. The maximum recorded pressure was approximately 2.0 kPa at the top (Ptop,a, red profile), while the minimum was 1.0 kPa at the bottom (Pbot,a, magenta profile). These values reflect the internal dynamic response of the absorber during different operating conditions.
Figure 3c displays the volumetric flow rates of both the coolant water (VFcw, blue profile) and the recirculating H2O–LiBr solution (VFsr, cyan profile). The coolant water flow rate remained nearly constant, ranging from 0.173 L·s−1 to 0.185 L·s−1, with an average of 0.178 L·s−1. In contrast, the brine solution flow exhibited a brief transient increase—starting from 0.023 L·s−1 and stabilizing around 0.073 L·s−1 with an average of 0.067 L·s−1. This initial fluctuation, occurring between Qin,1 and Qin,2, is attributed to incomplete filling of the flow sensor at the beginning of the test.
A detailed phase-by-phase summary of the monitored variables (including ambient temperature), sample counts for each OFF/ON sub-period, and descriptive statistics (min/mean/max) is provided in the Supplementary Material, allowing direct inspection of the dynamic behavior and data consistency across all load phases.
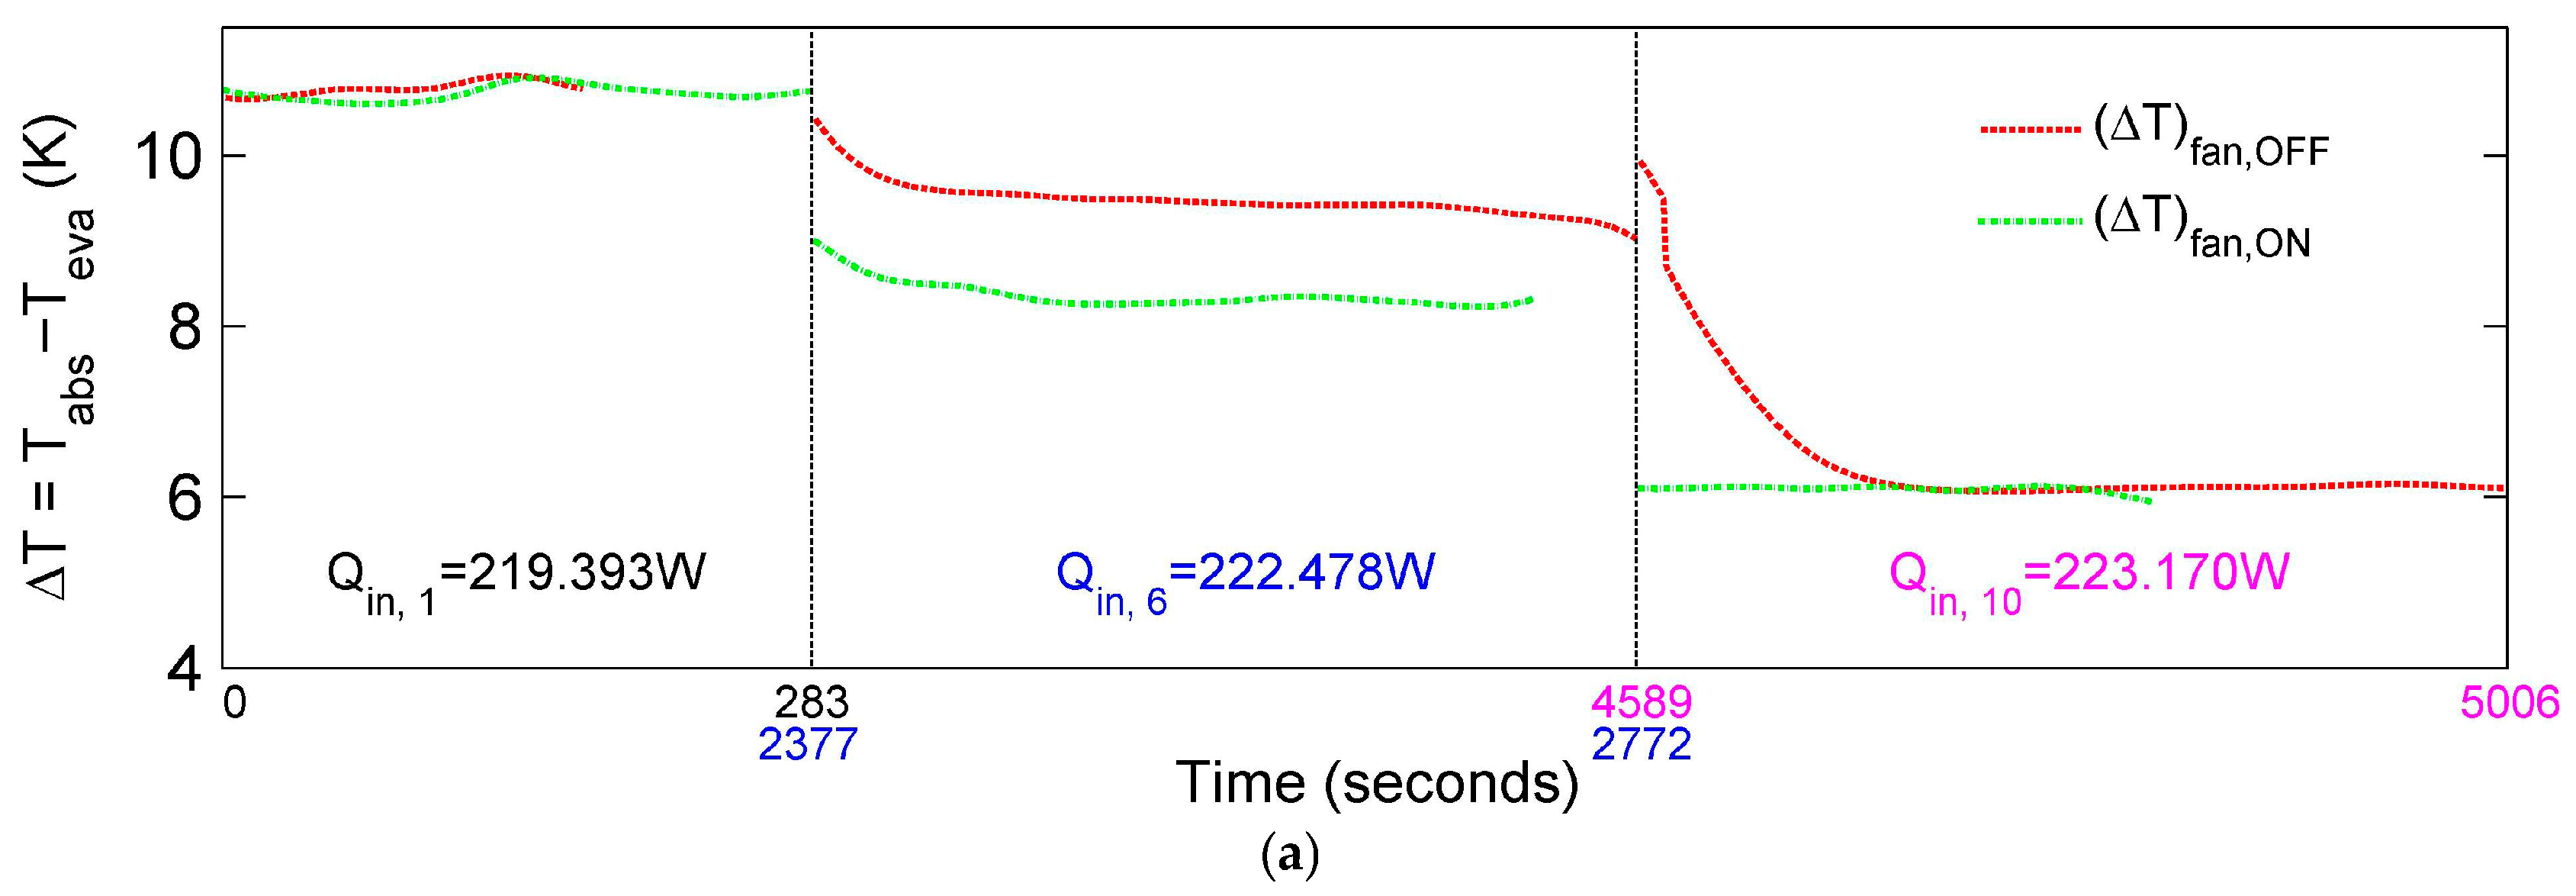
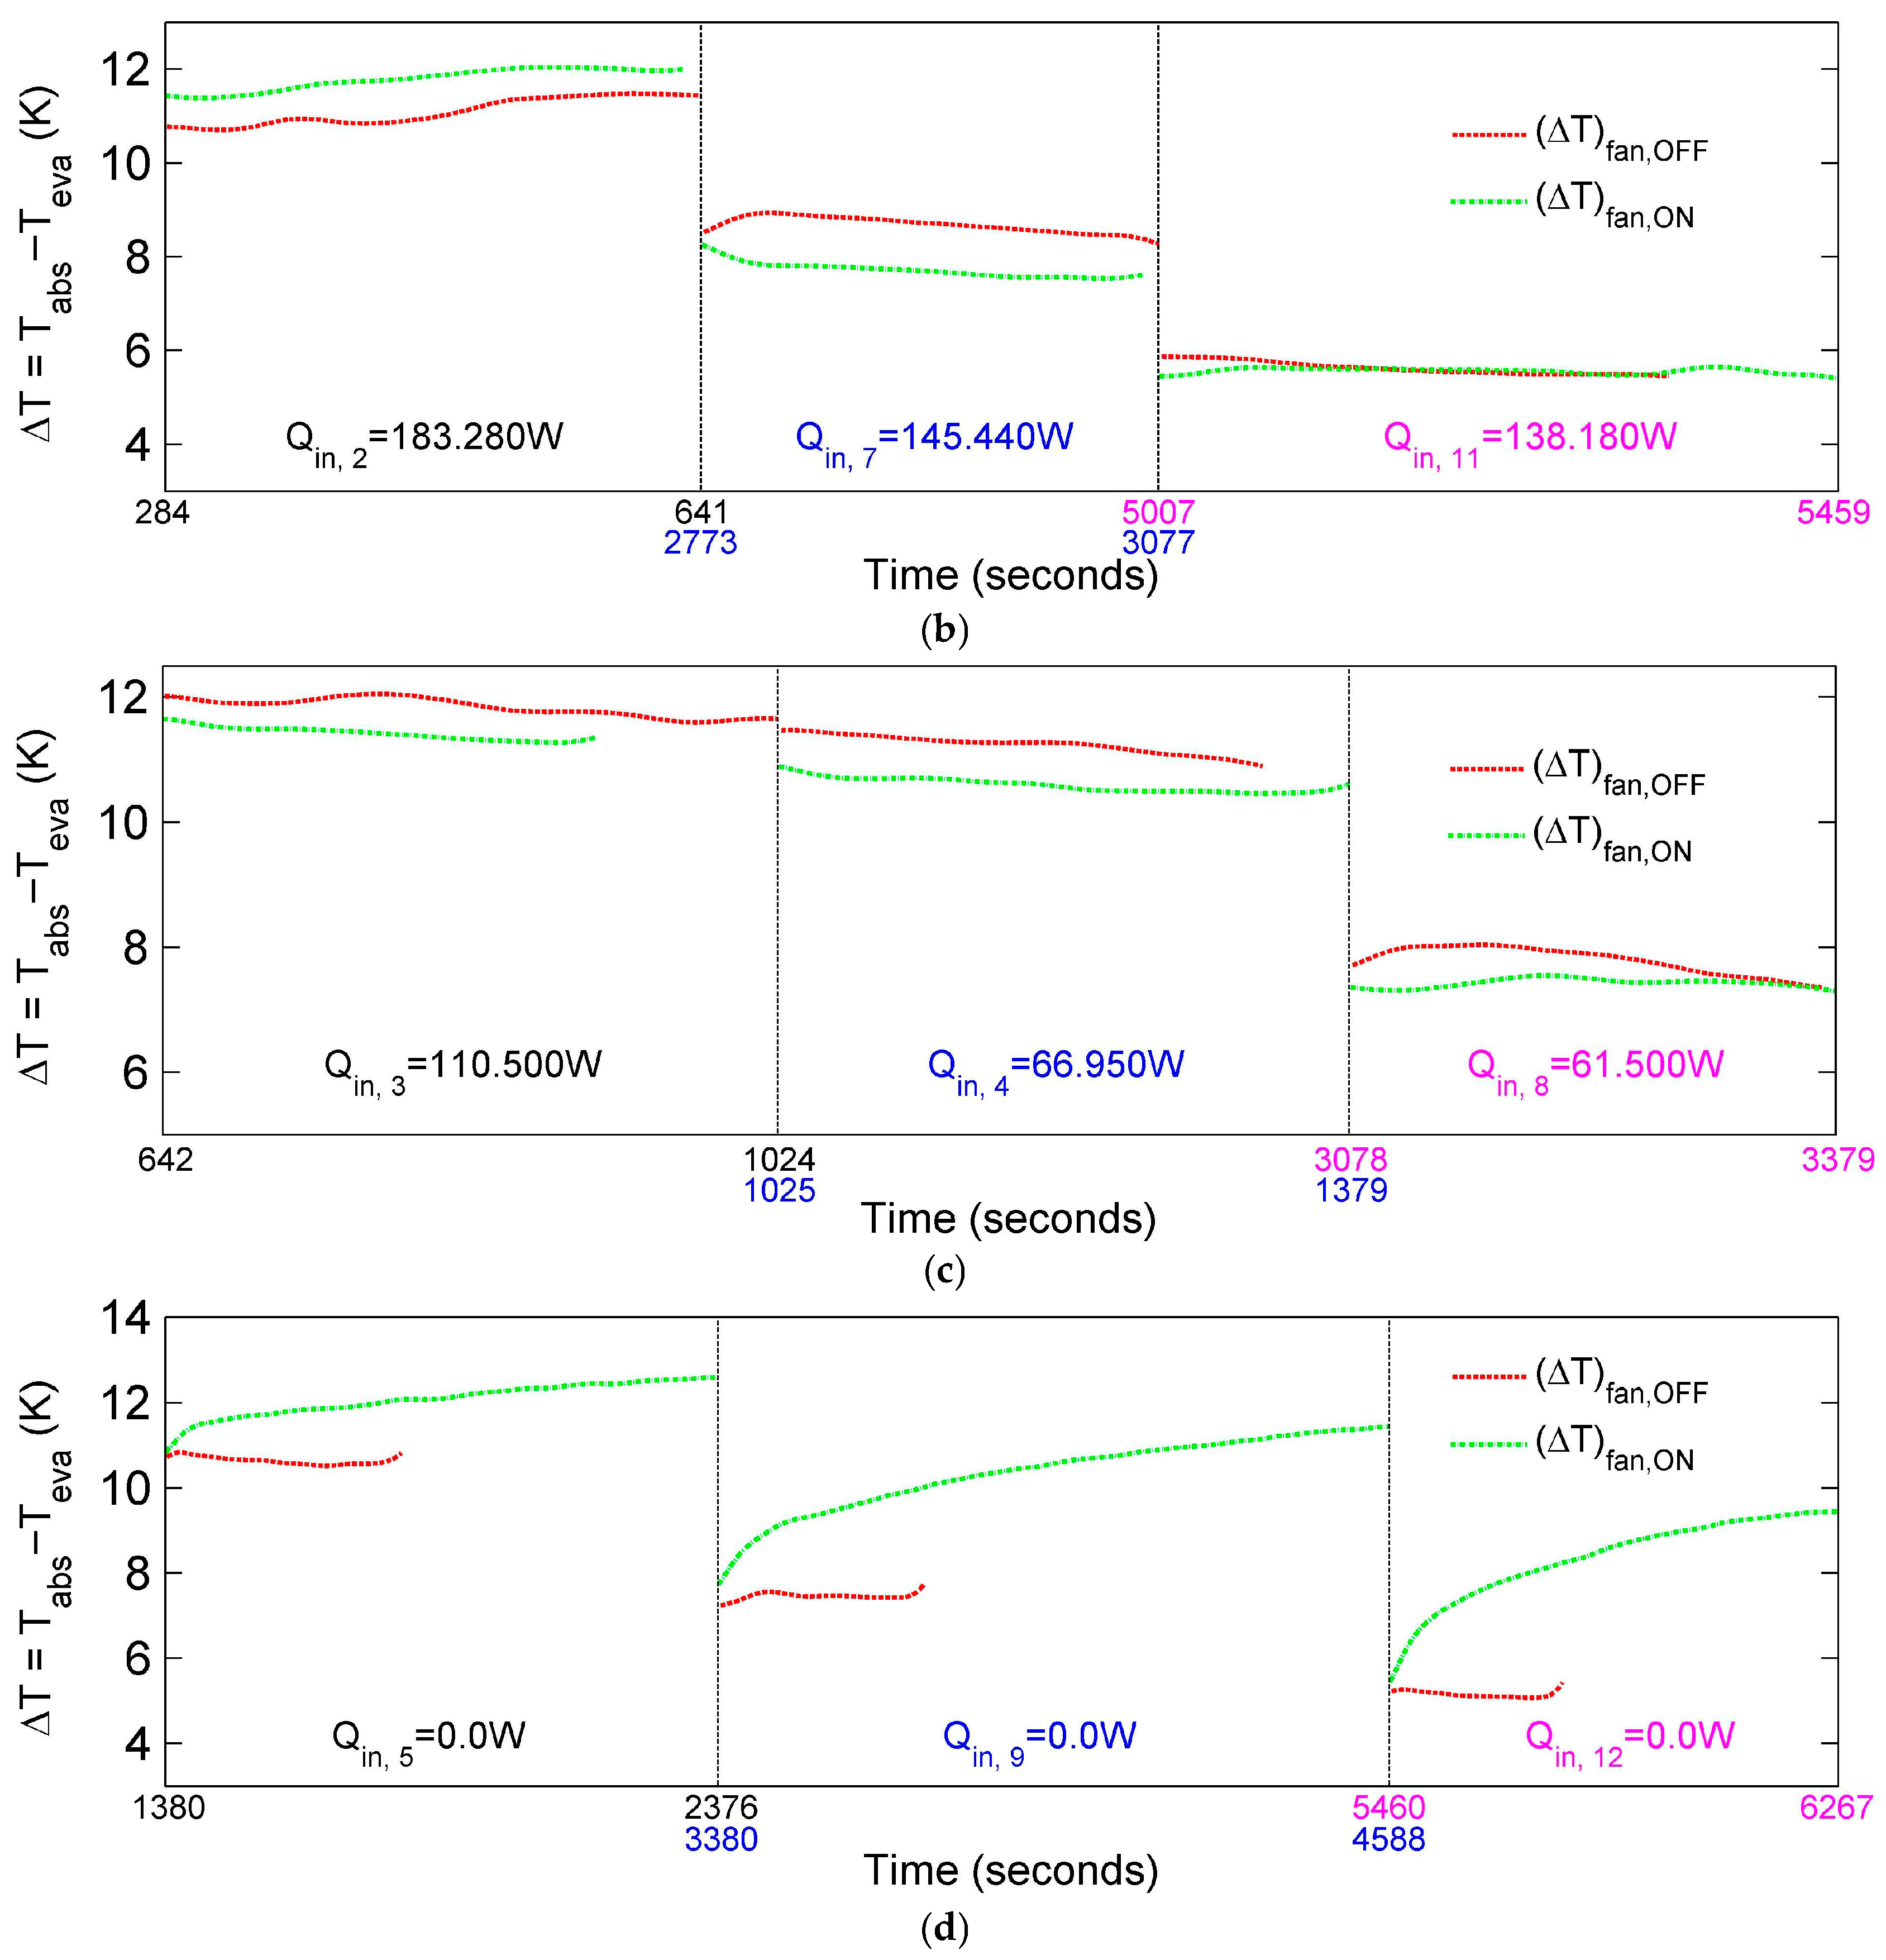
Figure 4 shows the temperature difference ( T ) profiles between the absorber and the evaporator sections under varying thermal load conditions, comparing the system’s response with the extractor fan switched on (green profile) and off (red profile).
In Figure 4a, corresponding to thermal loads Qin,1, Qin,6, and Qin,10, the temperature difference (ΔT) is relatively stable across the fan states. For Qin,1, the average ΔT was 10.8 K with the fan off and 10.7 K with the fan on. At Qin,6, ΔT decreased from 9.5 K (fan off) to 8.4 K (fan on). Similarly, for Qin,10, the difference dropped from 6.5 K (fan off) to 6.1 K (fan on).
Figure 4b,c show consistent behavior across thermal loads Qin,2, Qin,7, Qin,11, and Qin,3, Qin,4, Qin,8. Although the fan effect is present, the ΔT values under both conditions remain close in magnitude.
In contrast, Figure 4d shows a notable increase in ΔT when the fan is on for thermal loads where Qin = 0. For Qin,5, the average ΔT increased by approximately 13.5%, from 10.6 K (fan off) to 12.1 K (fan on). For Qin,9, the increase was 39%, from 7.5 K to 10.4 K, and for Qin,12, the increase reached 62%, from 5.2 K to 8.4 K. These results suggest that in the absence of external thermal loads, the fan contributes significantly to enhancing temperature stratification across the system.
These trends confirm that fan assistance primarily acts as a stabilizing mechanism under low-load regimes rather than as a heat enhancer, reinforcing that the role of mechanical intervention in compact absorbers is not to increase total separation but to preserve it when natural gradients are insufficient.
Figure 5 illustrates the pressure differences between the absorber and evaporator sections under various thermal loads, highlighting the influence of the fan when switched on (green profile) versus off (red profile).
Figure 5a shows the pressure difference profiles (ΔP = Pabs − Pev) for group 1 thermal loads (Qin,1, Qin,6, and Qin,10). For Qin,1, the fan-off curve remains higher than the fan-on curve, with differences of around 0.10 kPa and 0.09 kPa, respectively. Similar patterns are observed for Qin,6 and Qin,10, although the fan’s impact becomes more pronounced as the heat load decreases.
Figure 5b,c, corresponding to groups 2 and 3, display consistent trends. While both profiles remain close, the fan-on condition tends to exhibit slightly lower pressure differences.
In Figure 5d (group 4), which includes cases without applied thermal load (Qin,5, Qin,9, and Qin,12), a notable divergence between fan-off and fan-on conditions is evident. For example, during Qin,9 and Qin,12, the ΔP values under fan-on operation decrease significantly, even reaching negative values, indicating that the calculated vapor pressure exceeds the measured absorber pressure, likely due to reduced refrigerant activity in the absence of heating.
These results confirm that fan operation contributes to lowering the pressure gradient between the evaporator and absorber, particularly under low thermal load or idle conditions.
Additionally, the pressure difference (ΔP) between sections tends to decrease or become negative with fan activation, suggesting that mechanical enhancement through airflow reduces the resistance for vapor transport, especially under no-load conditions. These detailed results reinforce the need to analyze grouped thermal conditions, as done throughout the figures, and establish the foundation for further discussion of the fan’s impact on the performance of the evaporator–absorber unit.
The reduction or inversion of ΔP under fan-ON conditions suggests that forced vapor transport can temporarily override the natural pressure balance, indicating a transitional regime where mechanical extraction competes with passive boiling-driven migration.
Table 4 presents the maximum, minimum, and average differences in temperature (ΔT in K) and pressure (ΔP in kPa) between the evaporator and absorber sections for each thermal load condition, both with the extractor fan turned on and off. These metrics provide a comparative summary of the influence of forced convection on the thermal and pressure gradients within the unit. In general, the ΔT values are higher when the fan is off, especially at lower thermal loads, reflecting a reduced heat transfer rate due to limited airflow. Conversely, specific operating points, particularly those with zero or low thermal input (e.g., Qin,5, Qin,9, and Qin,12), exhibit significantly higher temperatures and lower or even negative pressure differentials when the fan is activated. This indicates that the fan enhances vapor removal from the evaporator, promoting greater absorption at the tube bank.

3.2. Dimensionless Temperature Separation Index (n)

To complement the time-series analysis of Section 3.1, we quantify the relative thermal separation between absorber (hot side) and evaporator (cold side) using the dimensionless temperature separation index ( n ) defined in Equations (7) and (8) as the time-average of the instantaneous normalized temperature difference within each tagged interval I k ( s ) (phase k , state s   O F F ,   O N ). Calculations use kelvin for temperatures; recall ΔT = Tabs − Tev and Tabs = (Ttop,a + Tbot,a)/2.
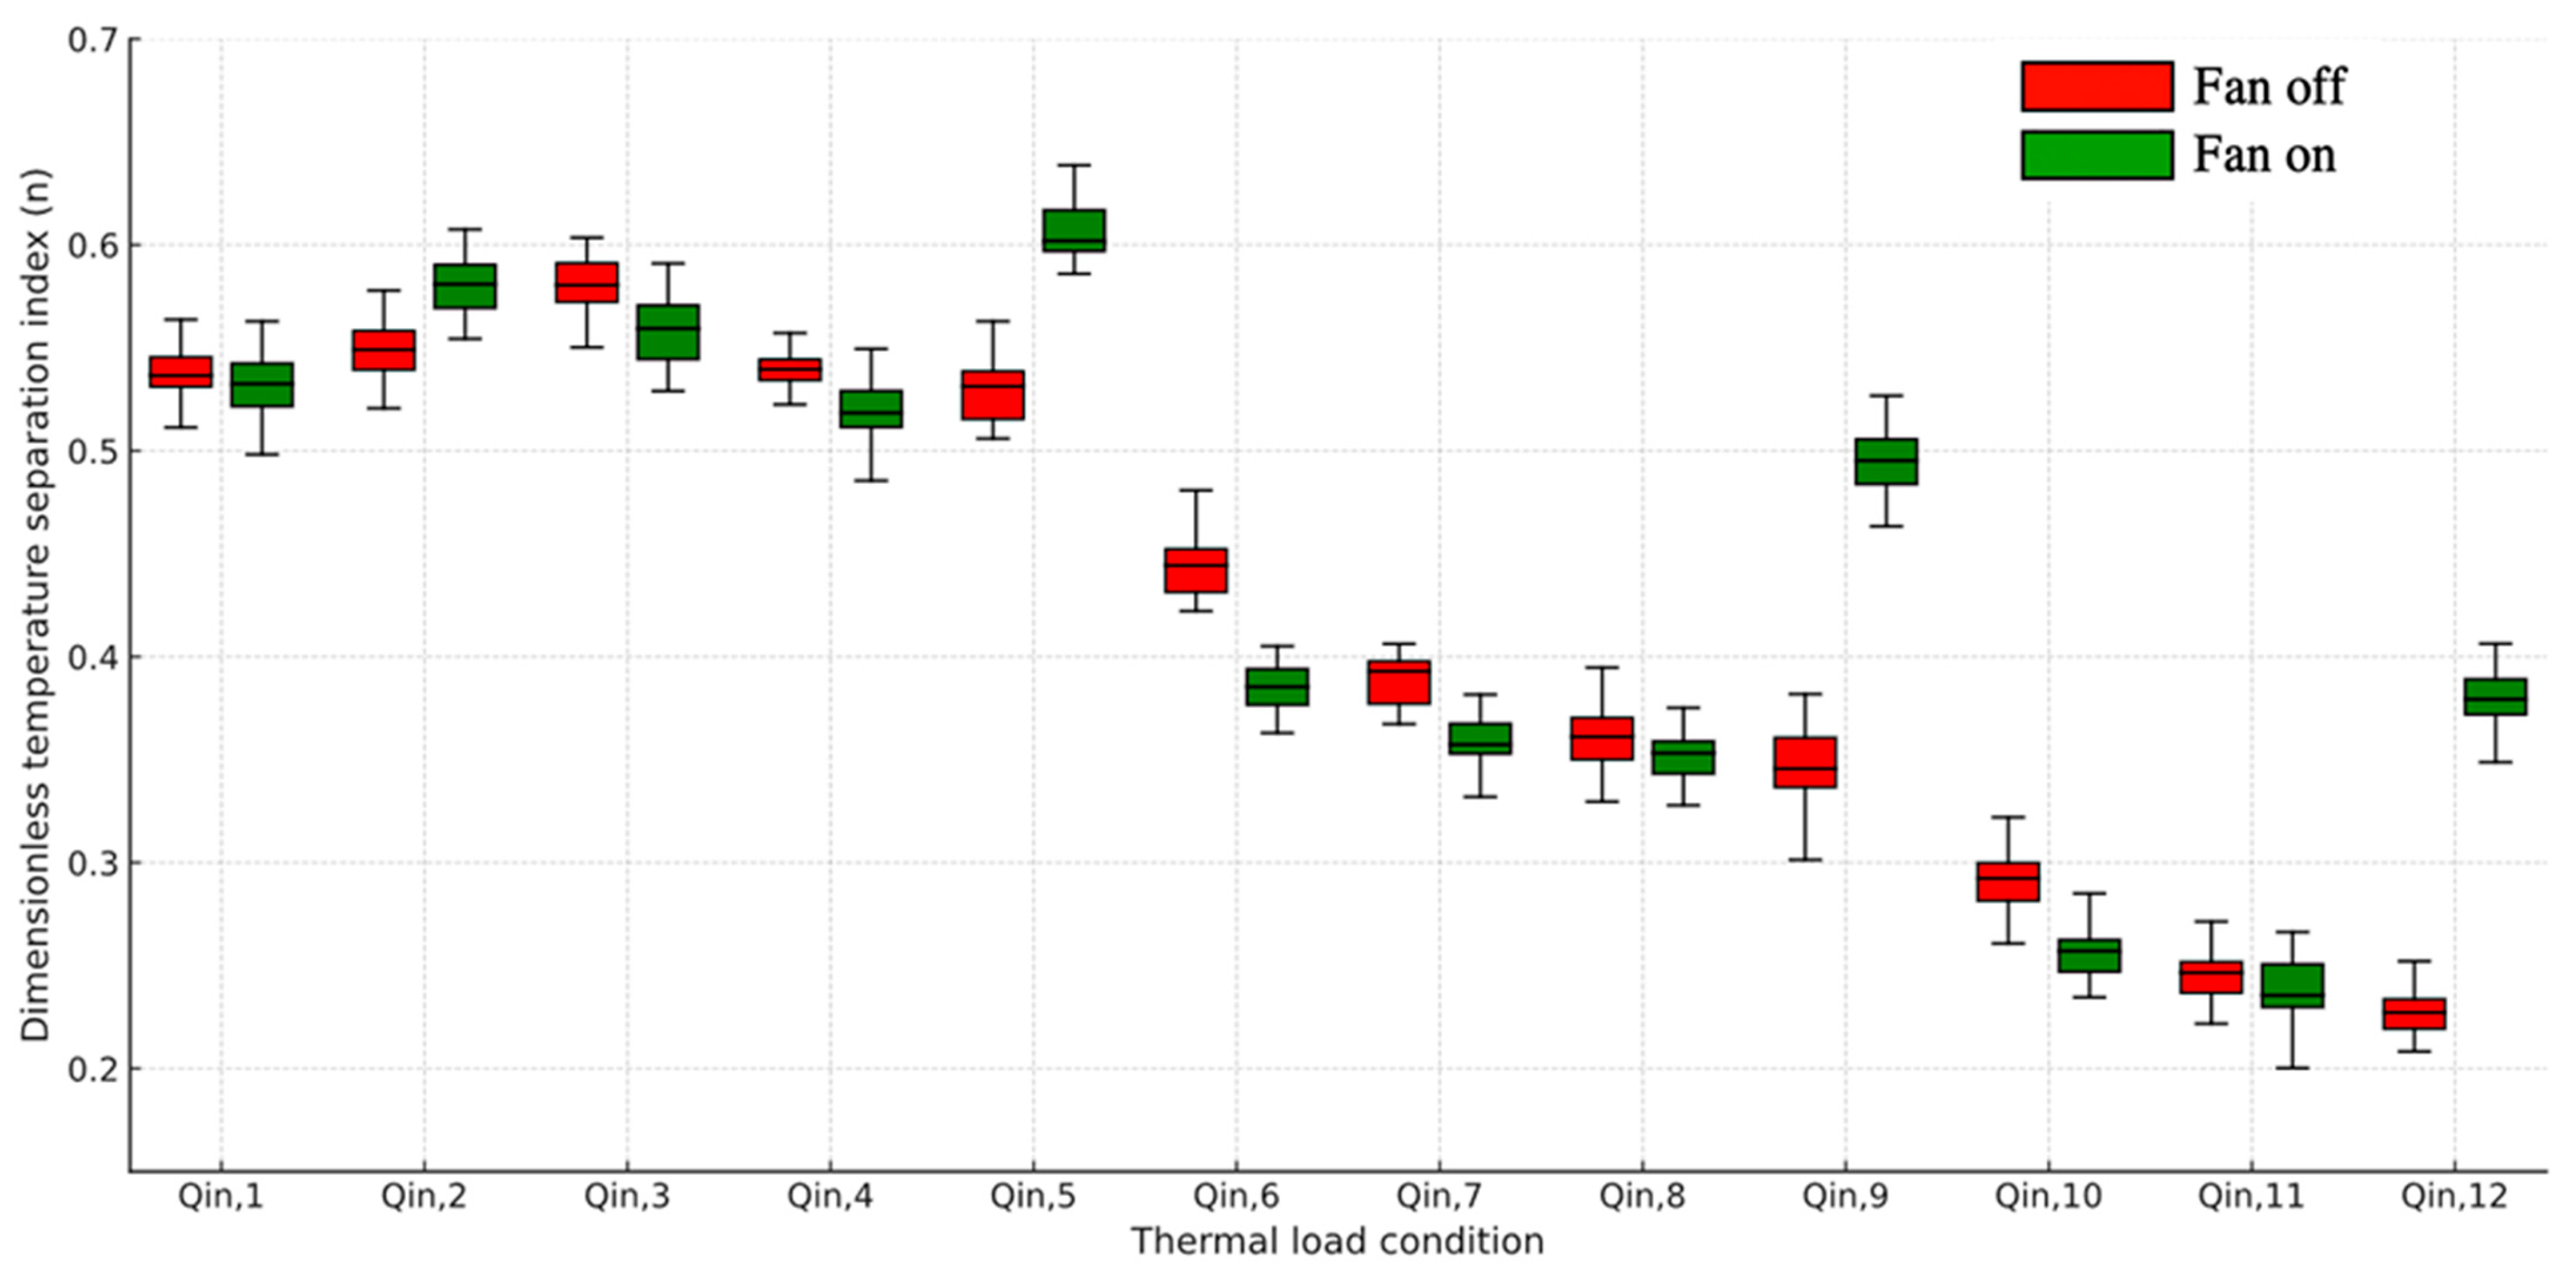
Figure 6 presents the bar graph comparing n values across all twelve thermal loads. Table 5 provides the numerical values for each condition.
The results indicate three distinct behaviors:
  • Under high thermal loads (Qin,1 to Qin,5), n remains relatively high (>0.50), and the influence of the fan is marginal. Natural convection appears sufficient to maintain robust thermal gradients.
  • In medium-to-low thermal loads (Qin,6 to Qin,11), n gradually decreases, indicating reduced thermal separation due to lower energy input. The fan has a stabilizing role, though the improvement is limited.
  • In zero thermal load conditions (Qin,5, Qin,9, Qin,12), the fan contributes significantly to enhancing n . For example, in Qin,12, the index rises from 0.23 to 0.38, a 65% increase, evidencing that forced convection can partially restore thermal stratification in the absence of active heating.
These findings confirm the complementary function of the fan as a thermal stabilizer in low-energy regimes and highlight its minimal impact under high-load conditions, where natural mechanisms already predominate.
Figure 6 shows the comparison of the dimensionless temperature-separation index (n) of the evaporator–absorber unit under each thermal-load condition (Qin,1–Qin,12). Red boxes correspond to fan-OFF operation, and green boxes correspond to fan-ON operation. Each pair of plots represents the statistical distribution of n, illustrating the influence of forced convection on both the median value and the dispersion (IQR). Higher n values indicate a stronger relative thermal gradient between the absorber and evaporator, suggesting more favorable heat-transfer conditions. The fan effect is most evident under low or zero thermal input (e.g., Qin,5; Qin,9; Qin,12), whereas under higher loads, the system maintains stable behavior regardless of fan operation.
Table 5 summarizes the calculated n values across all thermal loads. Under high heat inputs (Qin,1 to Qin,5), the index remains above 0.50 for both modes, indicating stable operation. For lower loads, n is more sensitive to fan activation, with up to 65% improvement observed when no external heating is applied.

4. Discussion

The compact evaporator–absorber unit operated within the temperature and pressure ranges documented in Section 3.1, and the fan’s influence depended strongly on the thermal input. Grouped comparisons revealed that, at high loads, the OFF/ON shift in both ΔT and ΔP was small, indicating that natural transport already maintains the hot–cold separation. At medium to low loads, the fan reduced dispersion and modestly shifted the central tendency of ΔT and ΔP. Under near-zero input (Qin,5, Qin,9, Qin,12), mechanical assistance produced the clearest gains, consistently increasing the dimensionless temperature separation index n (e.g., Qin,12: 0.23→0.38, ≈ + 65%).
Metric intent. Here n, together with ΔT and ΔP, is used strictly as a local indicator of hot–cold separation and driving potential within the integrated evaporator–absorber module. These metrics are constructed from directly measured temperatures and pressures over tagged OFF/ON intervals and are intended for relative comparisons under identical boundary conditions within each load phase. System-level quantities, such as absorber heat duty (Qabs) or absorption mass flux, are intentionally not derived in this work, to maintain a clear distinction between experimental subsystem validation (Part I) and model-based, balance-level performance evaluation (Part II).
The fan promotes vapor conveyance from the evaporator region through the middle compartment towards the tube bank, which (i) alleviates transient vapor holdup, (ii) lowers the absorber-side pressure relative to the saturation-based estimate Pev, and (iii) sustains a larger hot–cold temperature gap when external heating is weak. At high loads, boiling and natural convection dominate, so the incremental benefit of forced flow is smaller. The observed pressure gradient behavior suggests that the fan can induce a mild local suction effect, favoring vapor migration toward the LiBr film and stabilizing the absorber-side conditions, consistent with the systematic OFF/ON changes in ΔP and n.
The integrated evaporator–absorber operated stably within the ranges reported in Section 3.1 and delivered pressure–temperature behavior compatible with typical LiBr–H2O operation, despite its compact, shared-vessel architecture. In other words, miniaturization and mechanical assistance did not penalize the hot–cold separation that the unit must sustain to remain functionally viable.
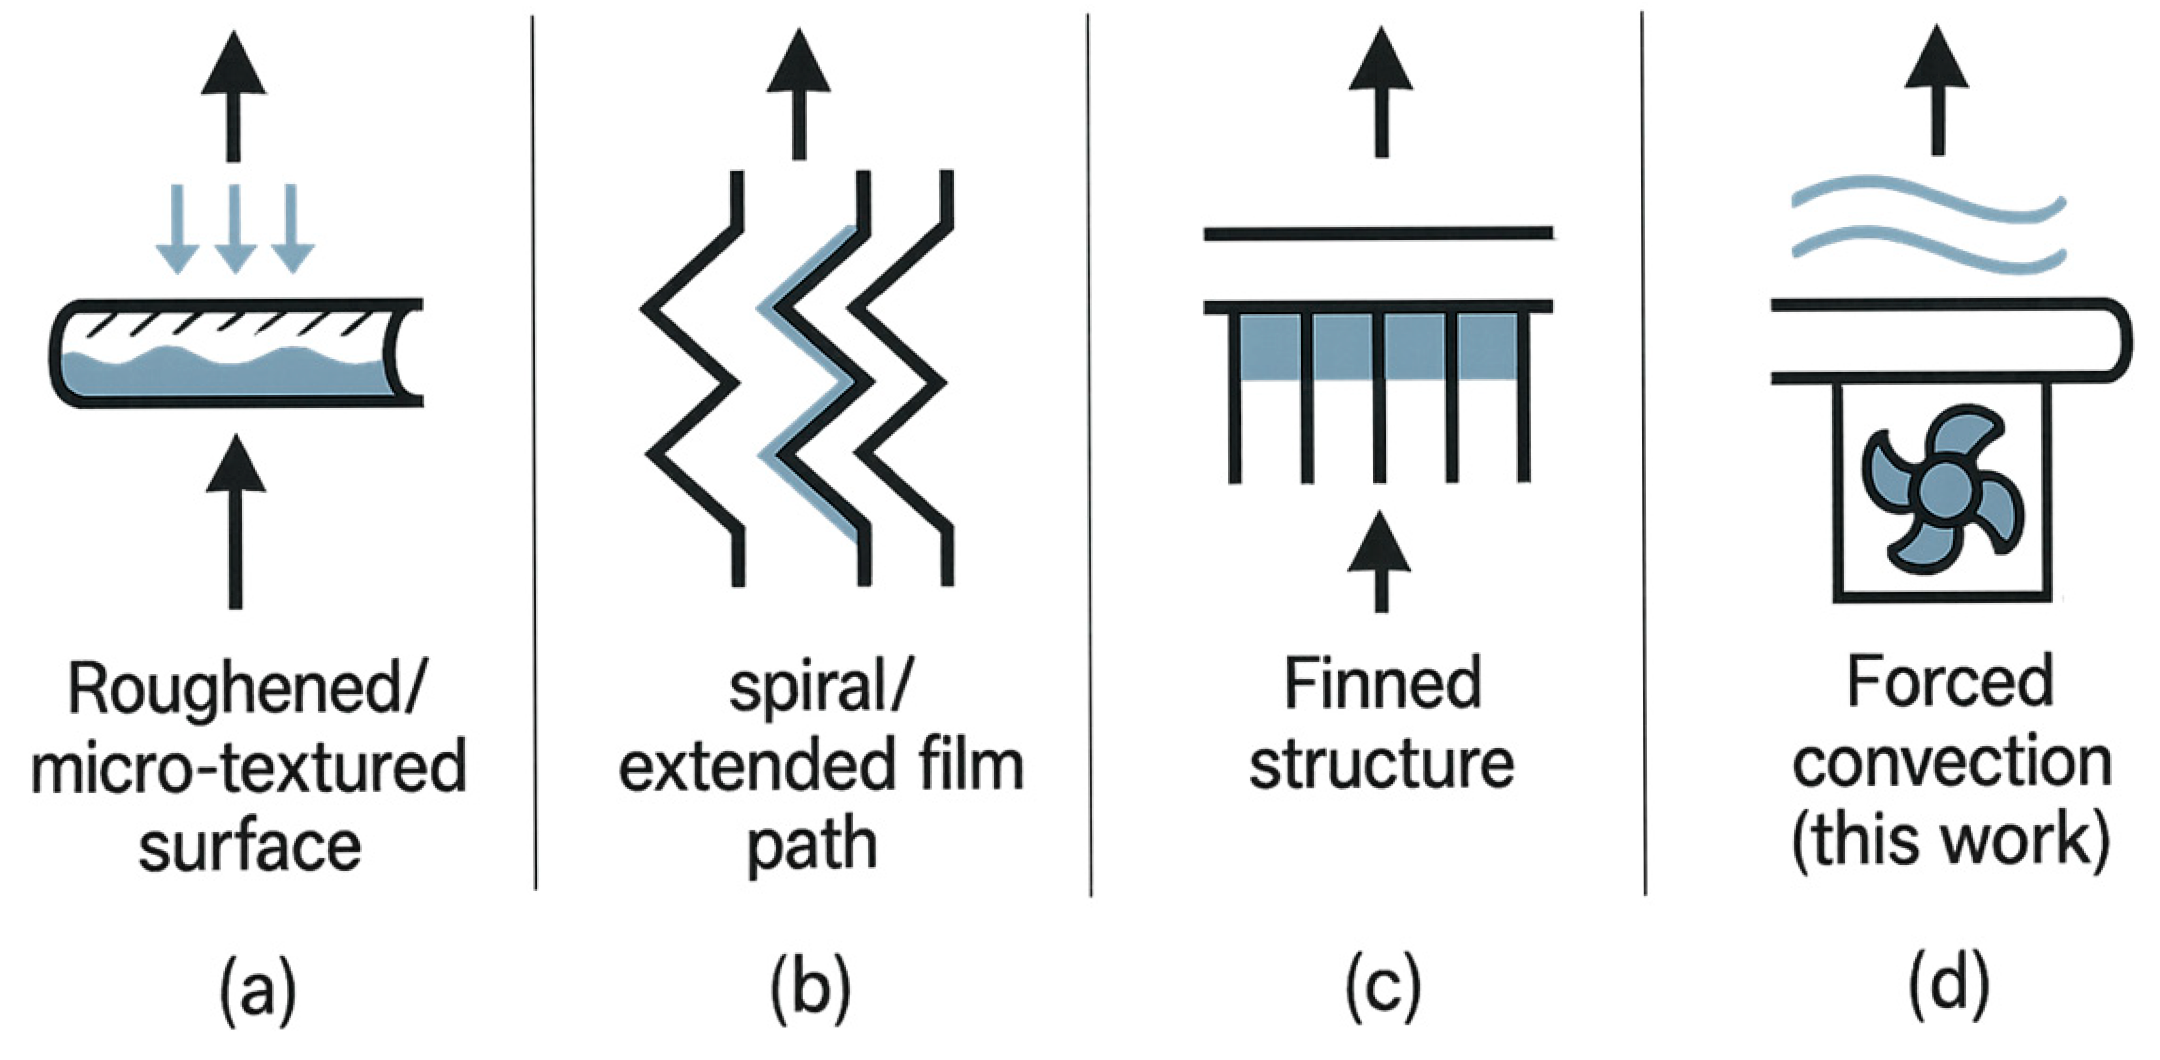
In classical falling-film absorbers, absorption performance is strongly influenced by film thickness, wetting quality, interfacial area, and the temperature difference between solution and cooling medium. Prior studies have shown that tailored surface conditions and geometries—such as micro-structured or roughened tubes, wavy films, finned/re-entrant surfaces, or modified distribution schemes—can enhance local heat and mass transfer by improving wetting and convective removal of absorption heat [35,36,37,38]. Likewise, spiral or extended-path absorbers and compact configurations have been proposed to increase residence time and effective interface area, or to reshape the vapor–liquid contact pattern [39,40,41]. Representative mechanisms are schematically compared in Figure 7. Comprehensive reviews by Amaris et al. [42]. and Sehgal et al. [43]. Highlight these passive and geometric strategies as established routes to intensification in LiBr–H2O absorbers.
The innovation of the present module lies in the compact vertical integration of evaporator and absorber within a single shared vessel, operating under a unified pressure environment and supported by localized vapor guidance inside the common space. The low-power axial fan is a key enabling element of this architecture: instead of modifying the tube surface, it acts on the vapor-side distribution, helping to direct refrigerant vapor toward the tube bank and sustain the internal thermal and pressure gradients, particularly under weak or intermittent heating conditions. This combination, protected under a Mexican utility-model patent, achieves reproducible hot–cold separation in a very small footprint without resorting to complex internal assemblies or multi-component enhancement schemes.
The internal fan operates at a nominal electrical input of 20 W, significantly lower than the heater loads applied in this work (≈60–220 W, Table 2), therefore mechanical assistance does not dominate the subsystem energy balance. Compact axial fans of this class are widely used in small HVAC and electronics cooling systems due to their simple architecture, sealed housings, and long-life bearings. In our prototype, it is the only moving mechanical element, which simplifies maintenance and reduces potential failure points. These attributes support the suitability of the integrated conveyance element for small-scale or miniaturized absorption systems.
Because the cited enhancement studies differ in scale, operating conditions, and reported metrics, only qualitative, comparisons within the same study are appropriate. Table 6 summarizes indicative ranges from selected contributions to provide context—not a strict ranking—alongside the present forced-convection concept. Passive surface or path modifications can yield substantial gains, but often at the cost of more intricate fabrication, tighter tolerances, and potentially more demanding maintenance. In contrast, the proposed mechanically assisted module achieves a robust, low-energy improvement in local separation using a simple, accessible component (a small fan), preserving manufacturability and serviceability. This trade-off between simplicity and performance is desirable for decentralized, low-maintenance LiBr–H2O systems, where robustness, cost, and ease of replication are as critical as peak efficiency.
The present design, protected as a utility model (IMPI, MX 4573 B), is intended not only as a compact operational unit but also as a test platform. The modular architecture enables systematic variation of the upper absorber module (tube count/length, distributor and drip-pan geometry, baffle spacing) to study film hydrodynamics and hot–cold separation under controlled geometric conditions. Beyond LiBr–H2O, the rig can accommodate alternative working pairs, provided that chemical compatibility and corrosion control (including additives, construction materials, sealing, and vacuum integrity) are ensured. For non-pressurized, non-heated parts, replacing stainless steel with corrosion-resistant polymers (e.g., PVDF, PP, PEEK) could reduce cost and simplify fabrication, with associated impacts on thermal behavior to be quantified.
Looking ahead, experimental refinement will focus on more rigorous and repeatable comparisons, including enforcing equal OFF/ON dwell times via automated load control, implementing closed-loop modulation of fan and recirculation flow rates, increasing spatial resolution with additional pressure and temperature taps, and integrating a calibrated calorimetric loop to obtain Qabs and absorption mass flow. These steps will enable direct linkage between the local index n and full thermodynamic performance, which is the focus of the companion Part II. Long-term tests on material durability, fouling, and seal integrity will further assess suitability for real deployments. By releasing core geometric information and a minimal bill of materials, this work aims to provide a reproducible baseline that other groups can adapt and extend, thereby accelerating progress toward compact, efficient, and practical absorption technologies.

5. Conclusions

This work reported the design, fabrication, and experimental validation of a compact evaporator–absorber unit for LiBr–H2O absorption cooling. The core novelty lies in the incorporation of a low-power fan to assist refrigerant-vapor conveyance from the evaporator (cold) to the absorber (hot), thereby sustaining favorable hot–cold separation without resorting to complex internal geometries. Time-series and phase-level analyses over twelve load steps (1 Hz) confirmed that fan assistance has little impact at high thermal loads (those reported in this work), yet significantly improves controllability at low or intermediate loads—narrowing dispersion in ΔT/ΔP and increasing the dimensionless temperature separation index ( n ) by up to ~65%.
The uncertainty analysis confirmed high repeatability and stability of the experimental measurements, with expanded uncertainties below ±0.37 °C for temperature and ±0.8 kPa for pressure, demonstrating the reliability of the data and the robustness of the experimental setup.
From a technological standpoint, the prototype demonstrates that a simple, low-energy mechanical enhancement can deliver relative gains comparable to those obtained with more elaborate passive configurations (such as finned, textured, or ex-tended-path surfaces), while preserving the advantages of a compact, vertically integrated absorber–evaporator. The architecture is scalable and could be suitable for decentralized or off-grid applications such as food preservation and environmentally responsible cooling. Protected under a Mexican utility model (IMPI, MX 4573 B), the device provides a replicable foundation for practical innovation in small-scale absorption technology.
Beyond its engineering contribution, this work establishes a reproducible experimental baseline for future developments. The present findings provide a robust local-indicator framework for the mechanically assisted evaporator–absorber, detailed heat and mass balance, as well as system-level analyses, for this prototype are developed separately to maintain a clear distinction between experimental validation and model-based performance evaluation.
The same compact module can serve as a test platform to evaluate alternative working pairs, adjust absorber geometry (tube count and length, distributor/drip-pan configuration and baffle spacing), and explore material options such as corrosion-resistant polymers, in non-pressurized sections. Future iterations of the device will incorporate direct evaporator-pressure measurement, refined liquid distribution over the tube bank, additional sensors along the absorber height, and extended operation to assess long-term stability and sealing. From a methodological perspective, upcoming studies will automate heater and fan control, enforce fixed OFF/ON dwell times, and repeat loading sequences to isolate transient effects better and further enhance reproducibility. From a performance perspective, the same platform will be used to investigate variable-speed operation of both the fan and the recirculation pump, as well as to compare this forced-convection strategy with other enhancement mechanisms under complete heat/mass-balance evaluation.
Overall, this manuscript (Part I) consolidates the groundwork for a novel, compact, mechanically assisted evaporator–absorber. A companion paper (Part II) will extend these findings through thermodynamic modeling and system-level assessment. In sum, this study contributes both a validated subsystem and a clear pathway toward decentralized, low-carbon absorption cooling technologies.

6. Patents

The experimental prototype evaluated in this study was formally registered as a utility model with the Mexican Institute of Industrial Property (IMPI). The registration was granted under title number MX 4573 B, with the official application code MX/u/2018/000306, and is valid until June 22, 2028. The invention is titled: “Módulo evaporador/absorbedor para sistemas de refrigeración por absorción” (Evaporator/absorber module for absorption refrigeration systems). The module integrates both evaporator and absorber components into a single vertical cylindrical structure and includes a mechanical enhancement system based on a controllable fan and recirculation pump. This configuration allows simultaneous heat and mass transfer processes, while improving vapor transport and system compactness. International Patent Classification (IPC): F25B 17/08; F25B 37/00. Cooperative Patent Classification (CPC): F25B 17/08; F25B 37/00. Official public record link: [https://vidoc.impi.gob.mx/visor?d=MX/2021/44860 (accessed on 15 November 2025)].

Supplementary Materials

The following supporting information can be downloaded at: https://www.mdpi.com/article/10.3390/technologies13110538/s1.

Author Contributions

Conceptualization, G.D.-F. (Genis Díaz Flórez), C.A.O.-O. and G.D.-F. (Germán Díaz Flórez); methodology, S.V.-B., L.O.S.-S. and H.A.G.-O.; formal analysis, T.I.-P., R.J.-M. and H.C.C.-A.; writing—original draft preparation, S.V.-B., L.O.S.-S. and H.A.G.-O.; writing—review and editing, T.I.-P., R.J.-M. and H.C.C.-A.; visualization, G.D.-F. (Germán Díaz Flórez) and G.D.-F. (Germán Díaz Flórez); supervision, C.A.O.-O., S.V.-B. and G.D.-F. (Germán Díaz Flórez); project administration, C.A.O.-O. All authors have read and agreed to the published version of the manuscript.

Funding

This research received no external funding.

Institutional Review Board Statement

Not applicable.

Informed Consent Statement

Not applicable.

Data Availability Statement

The original contributions presented in this study are included in the article/Supplementary Material. Further inquiries can be directed to the corresponding authors.

Acknowledgments

The authors express their gratitude to the Secretariat of Science, humanities, Technology, and Innovation (SECIHTI, its Spanish acronym) for the scholarship (CVU number 1346559) and the Master’s program in Engineering Sciences SEP-SECIHTI-SNP-002842. During the preparation of this manuscript/study, the authors used Deepl Translate, version 1.46.0, for the purpose of text translation, Reverso version 3.8.345 for the purpose of text translation and grammatical review, and Gram-marly, version 14.1232.0, for the purpose of grammatical editing and text correction. The authors have reviewed and edited the output and take full responsibility for the content of this publication.

Conflicts of Interest

The authors declare no conflicts of interest.

Appendix A

The coefficients below correspond to the water vapor saturation-pressure correlation used to infer the evaporator pressure P e v   from the measured temperature T e v (see Equation (4)) [34].
The coefficients C 1 C 6 in Equation (4) are:
C 1 = 5.8002206 × 10 3
C 2 = 1.3914993 × 10 0
C 3 = 4.8640239 × 10 2  
C 4 = 4.1764768 × 10 5
C 5 = 1.4452093 × 10 8
C 6 = 6.5459673 × 10 0
The correlation is valid over the temperature range relevant to the present experiments

Appendix B

Table A1. Expanded uncertainties (k = 2) for derived quantities per thermal-load phase.
Phase Qin,kFanN U   ( T ) [ ° C ] U   ( P e v ) [ k P a ] U   ( P a b s ) [ k P a ] U   ( P ) [ k P a ] U (n)
1Off1740.3674230.0237490.7314310.7318160.001238
1On2840.3674230.0240160.7314310.7318250.001238
2Off3580.3674230.0241940.7314310.7318310.001236
2On3470.3674230.0231870.7314310.7317980.001234
3Off3830.3674230.0233010.7314310.7318020.001234
3On2700.3674230.0236660.7314310.7318140.001235
4Off3010.3674230.0241590.7314310.7318300.001234
4On3550.3674230.0247190.7314310.7318480.001237
5Off4260.3674230.0241580.7314310.7318010.001238
5On9970.3674230.0247190.7314310.7318480.001237
6Off3960.3674230.0239900.7314310.7317980.001236
6On3460.3674230.0231870.7314310.7317990.001234
7Off3050.3674230.0228670.7314310.7317960.001232
7On2940.3674230.0235250.7314310.7317980.001231
8Off2930.3674230.0240130.7314310.7317990.001230
8On3020.3674230.0244050.7314310.7318000.001229
9Off3700.3674230.0238920.7314310.7317980.001228
9On12090.3674230.0241530.7314310.7317990.001226
10Off4180.3674230.0244870.7314310.7317990.001224
10On2480.3674230.0249310.7314310.7318000.001222
11Off3400.3674230.0237110.7314310.7317980.001221
11On4530.3674230.0240050.7314310.7317990.001220
12Off3110.3674230.0243810.7314310.7317990.001218
12On8080.3674230.0248120.7314310.7318000.001216
Note: Expanded uncertainties U (∆T), U (Pev), U (Pabs), U (∆P), U (n) were obtained using the method described in Section 2.5. The results confirm the high repeatability and stability of the measurements: temperature uncertainties remain within approximately ±0.37 °C and pressure uncertainties within approximately ±0.8 kPa across all test phases. The close agreement between fan-OFF and fan-ON conditions further supports the reliability of the experimental setup and the robustness of the comparative analysis.

References

  1. Florides, G.A.; Tassou, S.A.; Kalogirou, S.A.; Wrobel, L.C. Review of solar and low energy cooling technologies for buildings. Renew. Sustain. Energy Rev. 2002, 6, 557–572. [Google Scholar] [CrossRef]
  2. Ochoa, A.A.V.; Dutra, J.C.C.; Henríquez, J.R.G.; Dos Santos, C.A.C. Dynamic study of a single-effect absorption chiller using neural LiBr/H2O. Energy Convers. Manag. 2016, 108, 30–42. [Google Scholar] [CrossRef]
  3. Manohar, H.J.; Saravanan, R.; Renganarayanan, S. Modelling of steam fired double-effect vapour absorption Energy. Energy Convers. Manag. 2006, 47, 2202–2210. [Google Scholar] [CrossRef]
  4. Martínez, J.C.; Martínez, P.J.; Bujerdo, L.A. Development and experimental validation of a simulation model to reproduce the performance of a 17.6 kW LiBr—Water absorption chiller. Renew. Energy 2016, 86, 473–482. [Google Scholar] [CrossRef]
  5. Beausoleil-Morrison, I.; Johnson, G.; Kemery, B.P. The experimental characterization of a lithium bromide–water absorption chiller and the development of a calibrated model. Sol. Energy 2015, 122, 368–381. [Google Scholar] [CrossRef]
  6. Stanciu, C.; Stanciu, D.; Gheorghian, A.T.; Tănase, E.B.; Dobre, C.; Spiroiu, M. Maximum exergetic efficiency operation of a solar powered H2O-LiBr absorption cooling system. Entropy 2017, 19, 676. [Google Scholar] [CrossRef]
  7. Aguilar-Jiménez, J.A.; Velázquez, N.; López-Zavala, R.; González-Uribe, L.A.; Beltrán, R. Simulation of a Solar-Assisted Air-Conditioning System Applied to a Remote School. Appl. Sci. 2019, 9, 3398. [Google Scholar] [CrossRef]
  8. Wang, J.; Yan, R.; Wang, Z.; Zhang, X.; Shi, Z. Thermal performance analysis of an absorption cooling system based on parabolic trough solar collectors. Energies 2018, 11, 2679. [Google Scholar] [CrossRef]
  9. Lin, P.; Wang, R.Z.; Xia, Z.Z. Numerical investigation of a two-stage air-cooled absorption refrigeration system for solar cooling. Renew. Energy 2011, 36, 1401–1412. [Google Scholar] [CrossRef]
  10. Yaxiu, G.; Yuyuan, W.; Xin, K. Experimental research on a new solar pump-free LiBr absorption system with second generator. Sol. Energy 2008, 82, 33–42. [Google Scholar] [CrossRef]
  11. Xu, Z.Y.; Wang, R.Z.; Wang, H.B. Experimental evaluation of a variable effect LiBr—Water absorption chiller designed for high-efficiente solar cooling system. Int. J. Refrig. 2015, 59, 135–143. [Google Scholar] [CrossRef]
  12. Hernández-Magallanes, J.A.; Ibarra-Bahena, J.; Rivera, W.J.; Romero, R.; Gómez-Arias, E.; Dehesa-Carrasco, U.; Espinoza-Ojeda, O.M.; Kozhiparambil Chandran, S. Thermodynamic analysis of a half-effect absorption cooling system powered by low-enthalpy geothermal source. Appl. Sci. 2019, 9, 1220. [Google Scholar] [CrossRef]
  13. Wang, J.J.; Yang, K.; Xu, Z.-L.; Fu, C. Energy and exergy analyses of an integrated CCHP system with biomass air gasification. Appl. Energy 2015, 142, 317–327. [Google Scholar] [CrossRef]
  14. Wang, J.; Yang, Y. Energy, exergy and environmental analysis of a hybrid combined cooling heating and power system utilizing biomass and solar energy. Energy Convers. Manag. 2016, 124, 566–577. [Google Scholar] [CrossRef]
  15. Kalinowski, P.; Hwang, Y.; Radermacher, R.; Al Hashimi, S.; Rodgers, P. Application of waste heat powered absorption refrigeration system to the LNG recovery process. Int. J. Refrig. 2009, 32, 687–694. [Google Scholar] [CrossRef]
  16. Popli, S.; Rodgers, P.; Eveloy, V. Gas turbine efficiency enhancement using waste heat powered absorption chillers in the oil and gas industry. Appl. Therm. Eng. 2013, 50, 918–931. [Google Scholar] [CrossRef]
  17. Sun, J.; Fu, L.; Zhang, S.; Hou, W. A mathematical model with experiments of single effect absorption heat pump using LiBr–H2O. Appl. Therm. Eng. 2010, 30, 2753–2762. [Google Scholar] [CrossRef]
  18. Chua, K.J.; Chou, S.K.; Yang, W.M. Advances in heat pump systems: A review. Appl. Energy 2010, 87, 3611–3624. [Google Scholar] [CrossRef]
  19. Yin, Y.L.; Song, Z.P.; Wang, R.Z.; Zhai, X.Q. Experimental investigation of a mini-type solar absorption cooling system under different cooling modes. Energy Build. 2012, 47, 131–138. [Google Scholar] [CrossRef]
  20. Ibarra-Bahena, J.; Romero, R.J. Performance of Different Experimental Absorber Designs in Absorption Heat Pump Cycle Technologies: A Review. Energies 2014, 7, 751–766. [Google Scholar] [CrossRef]
  21. Álvarez, M.E.; Hernández, J.A.; Bourouis, M. Modelling the performance parameters of a horizontal falling film absorber with aqueous (lithium, potassium, sodium) nitrate solution using artificial neural networks. Energy 2016, 102, 313–323. [Google Scholar] [CrossRef]
  22. Medrano, M.; Bourouis, M.; Coronas, A. Absorption of water vapour in the falling film of water–lithium bromide inside a vertical tube at air-cooling thermal conditions. Int. J. Therm. Sci. 2002, 41, 891–898. [Google Scholar] [CrossRef]
  23. Kiyota, M.; Morioka, I.; Matsuyama, T. Steam absorption into aqueous lithium bromide solution films falling inside vertical pipes. Heat Transf. Asian Res. 2003, 32, 740–752. [Google Scholar] [CrossRef]
  24. Allouhi, A.; Kousksou, T.; Jamil, A.; Bruel, P.; Mourad, Y.; Zeraouli, Y. Solar driven cooling systems: An updated review. Renew. Sustain. Energy Rev. 2015, 44, 159–181. [Google Scholar] [CrossRef]
  25. Ghafoor, A.; Munir, A. Worldwide overview of solar thermal cooling technologies. Renew. Sustain. Energy Rev. 2015, 43, 763–774. [Google Scholar] [CrossRef]
  26. Hassan, M.; El-Sharkawy, I.I.; Harby, K. Study of an innovative combined absorption-adsorption cooling system employing the same evaporator and condenser. Case Stud. Therm. Eng. 2023, 42, 102690. [Google Scholar] [CrossRef]
  27. Zhai, C.; Xu, M.; Liu, Z.; Han, H.; Wu, W. An efficient and compact integrated microchannel membrane-based absorption refrigeration system. Appl. Therm. Eng. 2024, 243, 122574. [Google Scholar] [CrossRef]
  28. Chen, Y.M.; Sun, C.Y. Experimental study on the heat and mass transfer of a combined absorber-evaporator exchanger. Int. J. Heat Mass Transf. 1997, 40, 961–971. [Google Scholar] [CrossRef]
  29. Inoue, S.; Dang, C.; Hihara, E. Development of a compact absorption chiller using hydrophobic flat sheet membrane. In Proceedings of the 17th International Refrigeration and Air Conditioning Conference at Purdue, West Lafayette, IN, USA, 9–12 July 2018. [Google Scholar]
  30. Olvera Olvera, C.A.; Díaz Flórez, G.; Morales Oviedo, E.D.; Gómez Meléndez, D.J.; Araiza Esquivel, M.A.; Espinoza García, G. Módulo Evaporador/Absorbedor para Sistemas de Refrigeración por Absorción. Mexican Utility-Model. Application No. MX/u/2018/000306, 25 January 2021. [Google Scholar]
  31. Choong, Y.H.; Krishnan, M.; Gupta, M. Recent Advances in the 3D Printing of Pure Copper Functional Structures for Thermal Management Devices. Technologies 2023, 11, 141. [Google Scholar] [CrossRef]
  32. LaRocco, J.; Tahmina, Q.; Simonis, J.; Vedati, V. Comparing Elastocaloric Cooling and Desiccant Wheel Dehumidifiers for Atmospheric Water Harvesting. Technologies 2024, 12, 178. [Google Scholar] [CrossRef]
  33. Liu, Y.; Han, X.; Shen, C.; Yao, F.; Zhang, M. Experimental study on the evaporation and condensation heat transfer characteristics of a vapor chamber. Energies 2019, 12, 11. [Google Scholar] [CrossRef]
  34. ASHRAE. Psychrometrics. In ASHRAE Handbook—Fundamentals, SI ed.; Owen, M.S., Ed.; ASHRAE: Atlanta, GA, USA, 2017; pp. 1.1–1.40. [Google Scholar]
  35. Park, C.W.; Cho, H.C.; Kang, Y.T. The effect of heat transfer additive and surface roughness of micro-scale hatched tubes on absorption performance. Int. J. Refrig. 2004, 27, 264–270. [Google Scholar] [CrossRef]
  36. Mortazavi, M.; Nasr Isfahani, R.; Bigham, S.; Moghaddam, S. Absorption characteristics of falling film LiBr solution over a finned structure. Energy 2015, 87, 270–278. [Google Scholar] [CrossRef]
  37. Kim, J.k.; Park, C.W.; Kang, Y.T. The effect of micro-scale surface treatment on heat and mass transfer performance for a falling film H2O/LiBr absorber. Int. J. Refrig. 2003, 26, 575–585. [Google Scholar] [CrossRef]
  38. Zhang, H.; Yin, D.; You, S.; Zheng, W.; Wei, S. Experimental investigation of heat and mass transfer in a LiBr-H2O solution falling film absorber on horizontal tubes: Comprehensive effects of tube types and surfactants. Appl. Therm. Eng. 2019, 146, 203–211. [Google Scholar] [CrossRef]
  39. Goel, N.; Goswami, D.Y. Analysis of a counter-current vapor flow absorber. Int. J. Heat Mass Transf. 2005, 48, 1283–1292. [Google Scholar] [CrossRef]
  40. Hafsia, N.B.; Chaouachi, B.; Gabsi, S. A study of the coupled heat and mass transfer during absorption process in a spiral tubular absorber. Appl. Therm. Eng. 2015, 76, 37–46. [Google Scholar] [CrossRef]
  41. Hafsia, N.B.; Chaouachi, B.; Gabsi, S. Global modeling of heat and mass transfers in spiral tubular absorber of a water–lithium bromide absorption chiller. Appl. Therm. Eng. 2014, 38, 323–332. [Google Scholar]
  42. Amaris, C.; Valles, M.; Bourouis, M. Vapour absorption enhancement using passive techniques for absorption cooling/heating technologies: A review. Appl. Energy 2018, 231, 826–853. [Google Scholar] [CrossRef]
  43. Sehgal, S.; Alvarado, J.L.; Hassan, I.G.; Kadam, S.T. A comprehensive review of recent developments in falling-film, spray, bubble and microchannel absorbers for absorption systems. Renew. Sustain. Energy Rev. 2021, 142, 110807. [Google Scholar] [CrossRef]
  44. Zheng, J.; Castro, J.; Papakokkinos, G.; Assensi, O. Sensitivity study to an absorption system performance considering heat and mass transfer enhancements. In Proceedings of the 19th International Refrigeration and Air Conditioning Conference at Purdue, West Lafayette, IN, USA, 10–14 July 2022. [Google Scholar]
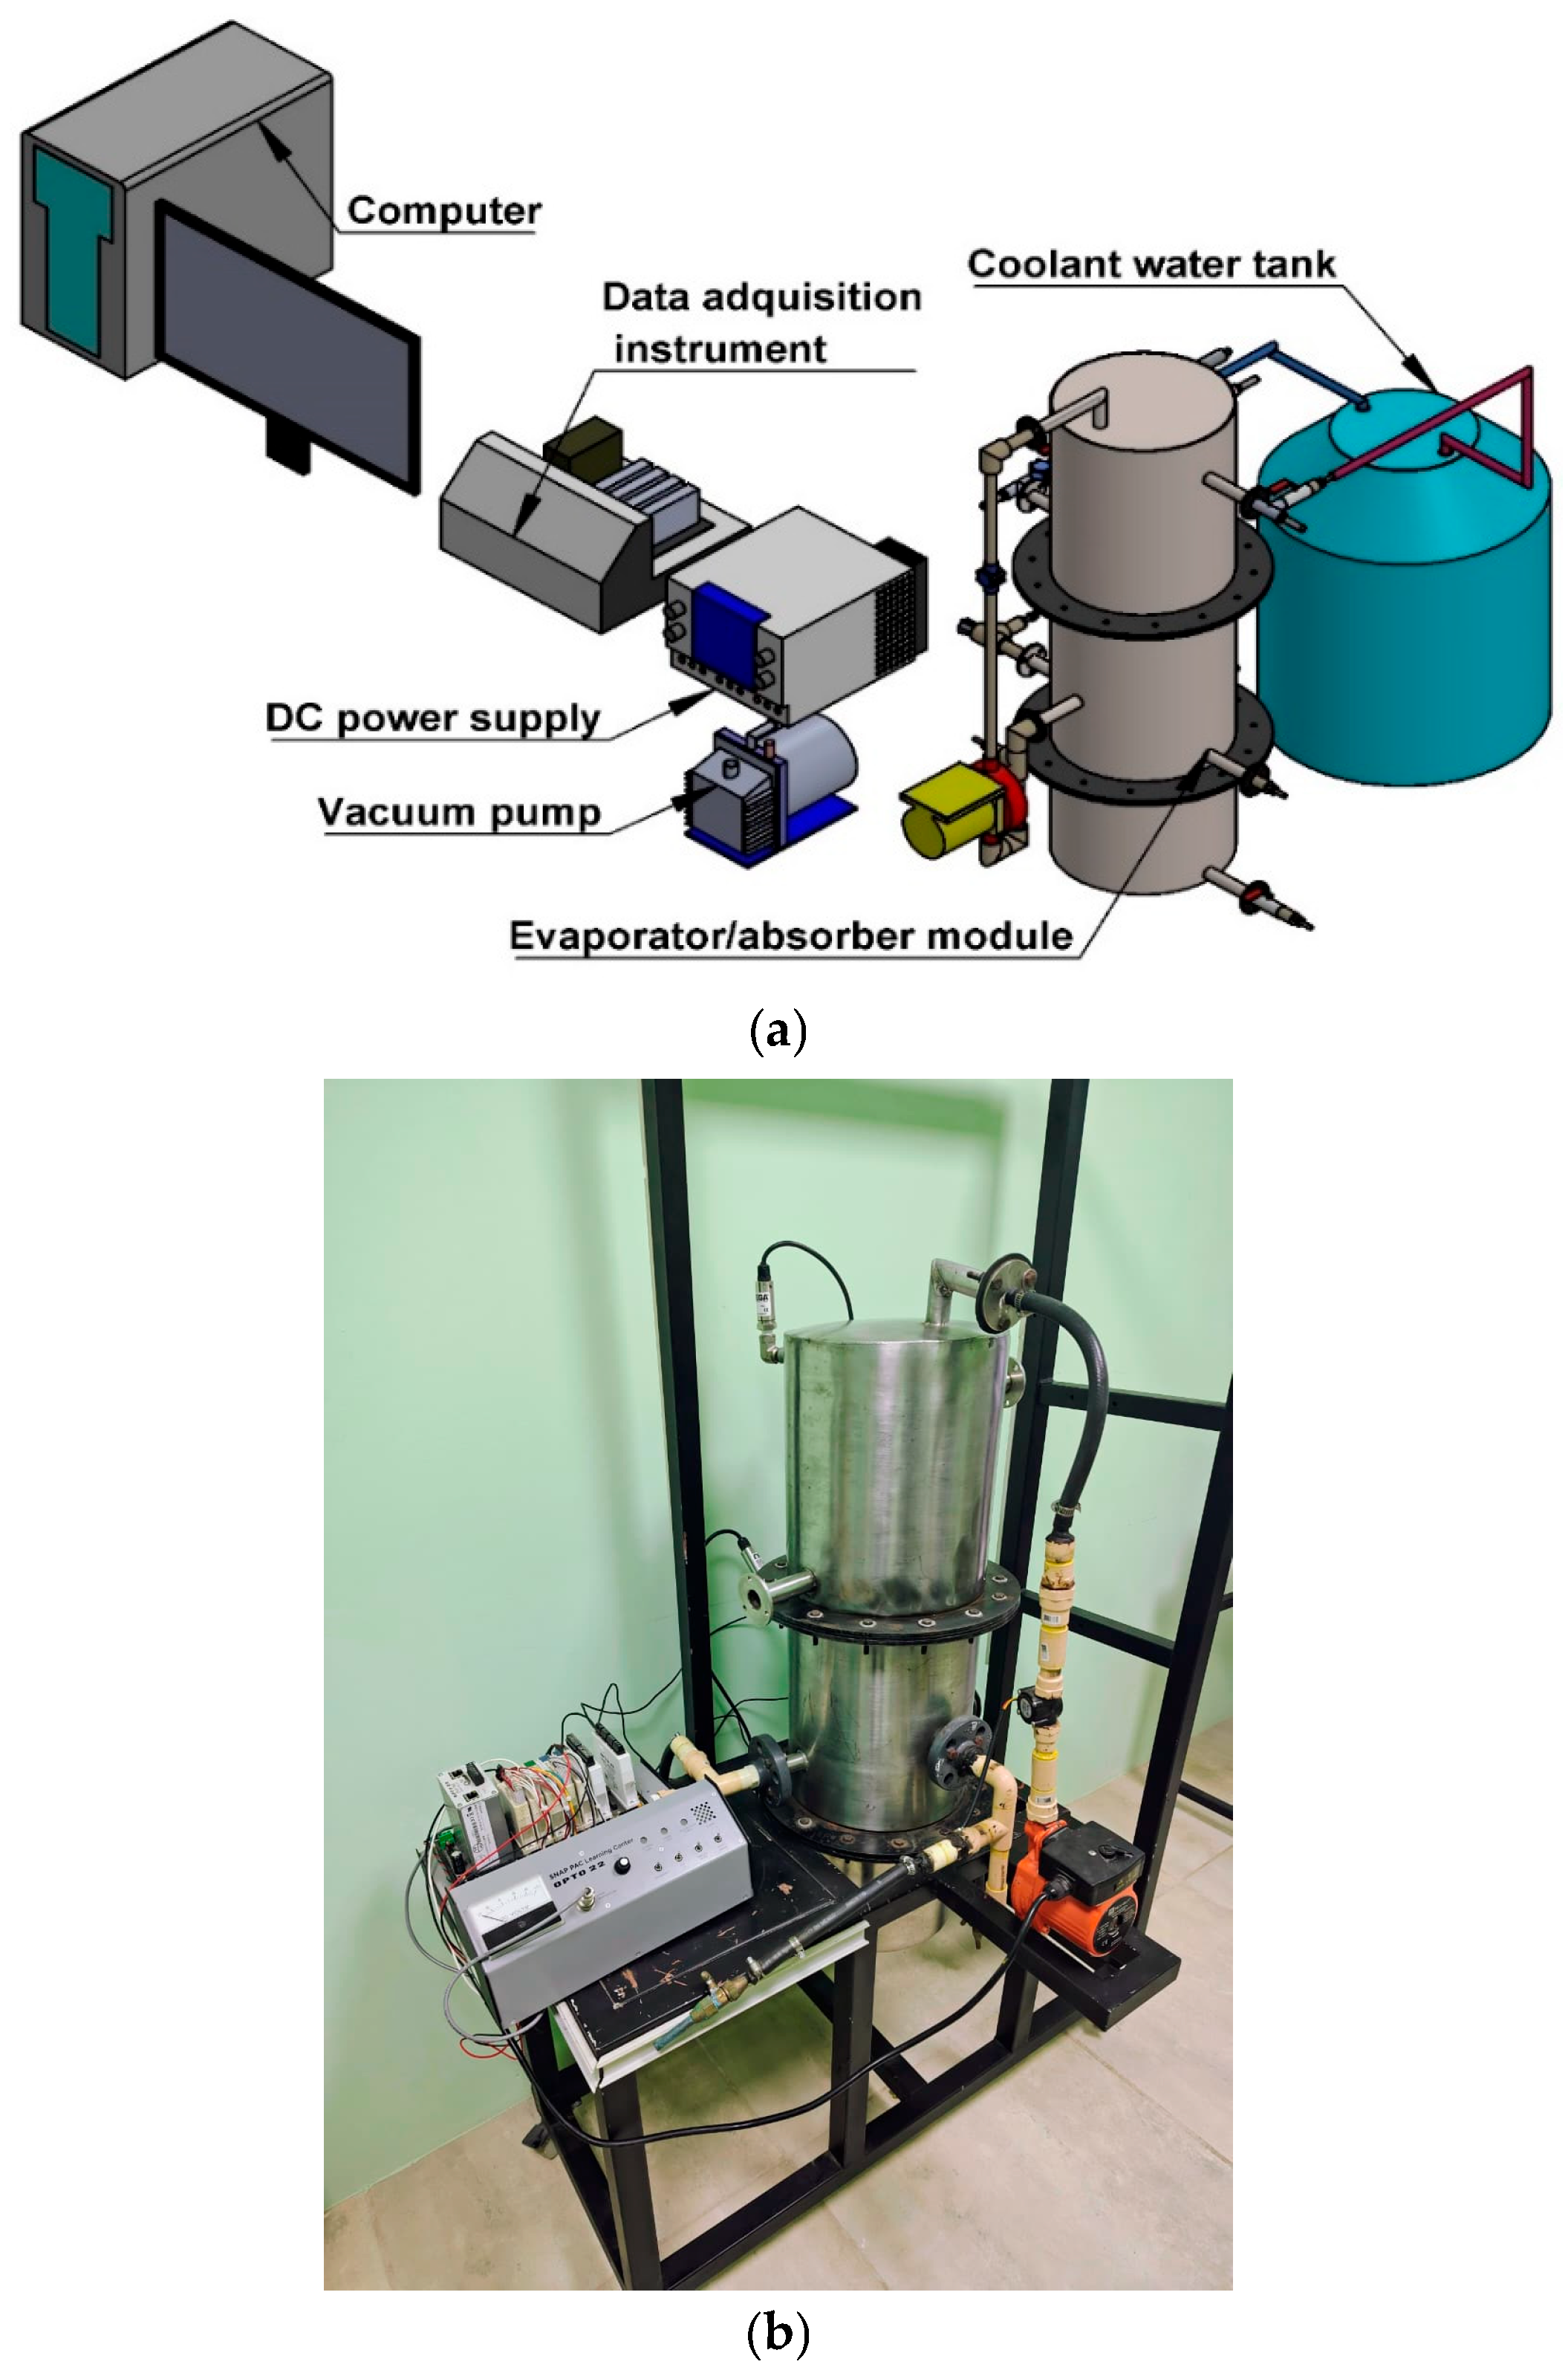
Figure 1. Experimental system for validation testing of the evaporator–absorber unit: (a) Schematic diagram of the test bench and components; (b) Photograph of the assembled experimental rig.
Technologies 13 00538 g001
Figure 2. Structural design and operating principle of the compact evaporator–absorber unit. (a) Isometric view with labeled A–A sectional cut and main ports. (b) Translucent 3D rendering showing in-ternal components. Both parts show: (i) liquid refrigerant (water) pooled and heated in the lower compartment, (ii) forced conveyance of refrigerant vapor through the inner cylindrical duct in the middle compartment by the fan, (iii) recirculation of the LiBr–H2O solution from the middle to the upper compartment and its distribution through the drip pan to form a falling film along the vertical absorber tubes where the vapor is absorbed, and (iv) cooling water circulating outside the tube bank on the shell side, guided by deflector plates to sweep the tube surfaces and remove the heat of absorption.
Technologies 13 00538 g002
Figure 3. Time histories of the measured variables in the evaporator–absorber unit over time. (a) Evaporator temperature (Teva), absorber top temperature (Ttop,a), absorber bottom temperature (Tbot,a), coolant water inlet temperature (Tinc), coolant water outlet temperature (Toutc), and ambient temperature (Tamb); (b) Absorber top pressure (Ptop,a) and bottom pressure (Pbot,a); (c) Recirculating solution volumetric flow rate (VFsr) and coolant water flow rate (VFcw). Dashed vertical lines mark load-phase boundaries. Data sampled at 1 Hz.
Technologies 13 00538 g003aTechnologies 13 00538 g003b
Figure 4. Temporal evolution of the temperature differences (ΔT = Tabs − Tev) between the absorber and evaporator sections, under fan-OFF (red) and fan-ON (green) conditions. (a) Group 1: Qin,1, Qin,6, Qin,10; (b) Group 2: Qin,2, Qin,7, Qin,11; (c) Group 3: Qin,3, Qin,4, Qin,8; (d) Group 4: Qin,5, Qin,9, Qin,12. Trace lengths within a phase may differ because OFF/ON dwell times were not enforced to be equal (due to manual operation).
Technologies 13 00538 g004aTechnologies 13 00538 g004b
Figure 5. Temporal evolution of the pressure difference (ΔP = Pabs − Pev) between the absorber (measured) and evaporator (calculated) sections under different thermal loads and fan conditions. (a) Group 1: Qin,1, Qin,6, Qin,10; (b) Group 2: Qin,2, Qin,7, Qin,11; (c) Group 3: Qin,3, Qin,4, Qin,8; (d) Group 4: Qin,5, Qin,9, Qin,12. Vertical dashed lines delimit phases. Unequal OFF/ON dwell times lead to traces of different lengths.
Technologies 13 00538 g005aTechnologies 13 00538 g005b
Figure 6. Box-plot comparison of the dimensionless temperature separation index (n) of the evaporator–absorber unit under each thermal load. Each pair of plots represents the statistical distribution of n for fan-OFF and fan-ON conditions, illustrating the influence of forced convection on both the median value and the statistical dispersion (IQR). Higher n values indicate a stronger relative thermal gradient between the absorber and evaporator, suggesting more favorable conditions for heat transfer. The effect of fan activation is most evident under low or zero thermal input (e.g., Qin,5; Qin,9; Qin,12), while under higher loads the system maintains stable behavior regardless of fan operation.
Technologies 13 00538 g006
Figure 7. Schematic comparison of representative enhancement mechanisms in LiBr–H2O absorption systems: (a) roughened or micro-structured surfaces, (b) extended or spiral film paths, (c) finned or otherwise enhanced tubes, and (d) internal forced convection in the integrated evaporator–absorber (this work). All approaches aim to increase interfacial area, residence time, and/or convective removal of absorption heat, thereby strengthening the effective driving forces for absorption.
Technologies 13 00538 g007
Table 1. Initial operating and charge conditions of the evaporator–absorber unit for the single continuous test.
ParameterValue
Inlet concentration of solution (wt % of LiBr–H2O)59.76
Inlet mass of the refrigerant (g)1553
Inlet mass of the solution (g)3208
Table 2. Thermal load conditions and sample counts during the single continuous test. The heater powers Qin,k were selected to span low, intermediate, high, and zero input levels representative of small-scale LiBr–H2O applications, enabling systematic evaluation of the module response under varying loads.
QinValue (W) Samples   ( N )
Fan OFFFan ON
Qin,1219.393174284
Qin,2183.280358347
Qin,3110.500383270
Qin,466.950301355
Qin,50426997
Qin,6222.478396346
Qin,7145.440305294
Qin,861.500293302
Qin,903701209
Qin,10223.170418248
Qin,11138.180340453
Qin,120311808
Notes: (a) Sampling frequency, f s = 1   H z ; (b) Reported Q i n values are electrical power of the heaters over each phase; loads were manually adjusted and therefore not strictly constant (except the intentional Q i n 0   W stage). (c) Operating order per phase: Fan OFF → Fan ON (manual switching). (d) Samples, N equals the number of data points retained per sub-period; dwell times were not forced to match. Short guard bands around switching instants are excluded; see Section 2.3.
Table 3. Measurement ranges and accuracies used in Part I.
Measured VariableRangeAccuracy (±)Unit
Temperature (T)Test operating range0.3°C
Pressure (P)0–103.441% of FSkPa
Flow rate (coolant water)0.0167–0.510% L s 1
Voltage/current (heaters)Per device0.5%
Notes: FS = full scale. Properties such as ρ and c p are not invoked in Part I; they will be considered in Part II together with an uncertainty-propagation analysis.
Table 4. Summary of temperature and pressure differentials between evaporator and absorber under all thermal load conditions with fan ON and OFF. The overbar denotes the median over the tagged interval. N O F F and N O N are the numbers of 1-Hz samples retained per sub-period (dwell times were not enforced to be equal).
QinFan OffFan On
T m a x T m i n T ¯ (IQR) P m a x P m i n P ¯   ( I Q R ) T m a x T m i n T ¯ (IQR) P m a x P m i n P ¯
Qin,110.9410.6710.79 (0.12)0.100.090.1010.9110.6110.71 (0.12)0.100.080.09
Qin,211.4810.7110.98 (0.56)0.090.080.0812.0411.3911.84 (0.40)0.090.080.08
Qin,312.0511.5911.89 (0.24)0.090.080.0911.6511.2811.42 (0.17)0.10.090.09
Qin,411.4710.8911.29 (0.26)0.090.090.0910.8910.4610.57 (0.21)0.090.080.08
Qin,510.8310.5210.63 (0.14)0.090.080.0812.5810.8312.10 (0.58)0.080.020.04
Qin,610.469.029.46 (0.15)0.080.060.079.008.238.31 (0.14)0.070.060.06
Qin,78.948.278.69 (0.29)0.080.060.078.267.547.72 (0.34)0.070.070.07
Qin,88.047.367.86 (0.40)0.080.070.077.547.297.44 (0.10)0.080.060.07
Qin,97.737.247.46 (0.05)0.080.060.0811.447.7410.58 (1.23)0.07−0.05−0.01
Qin,109.966.076.13 (0.14)0.080.010.076.135.946.11 (0.03)0.080.070.07
Qin,115.875.465.58 (0.23)0.090.080.085.655.405.59 (0.10)0.090.070.07
Qin,125.445.075.13 (0.11)0.100.080.099.445.468.63 (1.39)0.08−0.04−0.01
Table 5. Dimensionless temperature separation index (n) for each thermal load (Qin,1 to Qin,12), calculated from the temperature difference between absorber and evaporator under fan-off and fan-on conditions. The index reflects the relative thermal separation and is used to compare the system’s thermal performance with and without mechanical enhancement.
Thermal Load Dimensionless   Index   Without   Fan   ( n f a n , o f f ) Dimensionless   Index   with   Fan   ( n f a n , o n ) * Relative Improvement (%)
Qin,10.540.53−1.9
Qin,20.550.585.5
Qin,30.580.56−3.4
Qin,40.540.52−3.7
Qin,50.530.6115.1
Qin,60.440.39−11.4
Qin,70.390.36−7.7
Qin,80.360.35−2.8
Qin,90.350.4940.0
Qin,100.290.26−10.3
Qin,110.240.240.0
Qin,120.230.3865.2
* Relative improvement for this study is computed as i m p r o v e m e n t   ( % ) = n o n n o f f n o f f × 100 . For instance, at Qin,12, this yield (0.38 − 0.23)/0.23 × 100 = 65.2%, representing the relative enhancement n under fan-assisted operation. On average, fan assisted operation yielded a net positive gain of approximately +7% across all load phases. ** Note: n is a bounded, dimensionless indicator for relative OFF/ON comparison within the same phase; it is not a direct proxy for COP or absolute absorption capacity. System-level balances are reported separately.
Table 6. Qualitative overview of enhancement strategies in LiBr–H2O absorption systems. Examples are indicative; metrics and operating conditions differ across sources, so only within-study comparisons are meaningful.
Study/SourceEnhancement MechanismDescription/Reported Effect *
Kim & Kang [37]Wavy/structured filmsWavy-laminar falling films enhance contact and promote higher mass-transfer coefficients compared with flat films.
Park et al. [35]Roughened/hatched tubesMicro-structured tube surfaces and additives increase wetting and interfacial area, improving local absorption rates versus smooth tubes.
Mortazavi et al. [36]Finned structureFinned surfaces on vertical tubes increase effective area and external gradient, yielding higher absorption and heat-transfer coefficients than plain tubes
Goel & Goswami [39]Compact counterflow designsCompact falling-film absorber and counter-current configurations to intensify absorption in small footprints
Hafsia et al. [41]Spiral/extended pathsSpiral tubular absorber providing extended Flow path and compact configuration; model predicts improved utilization of driving potentials
Zheng et al. [44]Hybrid enhancementSensitivity analysis showing that combining enhanced surfaces and improved flow distribution can lead to significant performance gains, depending on configuration
This studyInternal forced convectionSmall integrated fan promoting vapor conveyance and stabilizing hot–cold separation; under near zero load, n increases from 0.23 to 0.38 (≈+65%) between fan-OFF and fan-ON
* Reported effects are described qualitatively based on the cited works; absolute percentages are not directly comparable across studies due to differences in metrics, geometries, and conditions.
Disclaimer/Publisher’s Note: The statements, opinions and data contained in all publications are solely those of the individual author(s) and contributor(s) and not of MDPI and/or the editor(s). MDPI and/or the editor(s) disclaim responsibility for any injury to people or property resulting from any ideas, methods, instructions or products referred to in the content.