1. Introduction
Traffic congestion has become a significant challenge today, prompting extensive analysis and discussion as experts seek customized solutions for different settings. The impacts of heavy traffic extend beyond simple delays—it is a recognized threat to both environmental health and personal well-being. Increased vehicle emissions pollute the air and increase the risks of respiratory issues and other health concerns [
1]. The constant stop-and-go of congested roads also eats up time, disrupts routines, and drives up fuel costs, adding to both personal expenses and global emissions. Tackling these issues calls for a strategic approach that combines policy reform, infrastructure upgrades, and innovative technology to reduce congestion and its far-reaching effects on society. In the last fifty years, various systems have been developed to address the growing complexity of urban traffic, now commonly grouped under the concept of Urban Traffic Management and Control (UTMC). Among the most notable are the UK’s SCOOT (Split Cycle Offset Optimization Technique), introduced in 1973; Toronto’s UTOPIA (Urban Traffic Optimization by Integrated Automation) from 1984; and Australia’s SCATS (Sydney Coordinated Adaptive Traffic System) and the widely used TRANSYT (Traffic Network Study Tool) [
2]. Each of these solutions plays a crucial role in improving traffic flow and reducing congestion across cities globally.
According to the INRIX 2024 Global Traffic Scorecard, traffic congestion in the United States led to drivers losing an average of 43 h in 2024—equivalent to a full work week—resulting in a loss of approximately USD 771 per driver in lost time and productivity. Nationwide, this amounted to over four billion hours lost, costing the U.S. economy an estimated USD 74 billion. Major urban centers like New York City and Chicago topped the list, with drivers in each city losing 102 h annually due to congestion, incurring individual costs of approximately USD 1826. Los Angeles followed closely, with drivers losing 88 h and facing costs around USD 1575. These figures underscore the significant economic and environmental impacts of traffic congestion, including wasted fuel, increased vehicle operating costs, and elevated emissions during idling and stop-and-go traffic [
3]. Such data highlights the urgent need to address the economic ramifications of traffic congestion and its pollution effects.
In recent years, European countries have increasingly shifted toward electric vehicles (EVs) to reduce the emissions of pollutants such as CO2, CO, and NOX from the transportation sector. EVs produce no direct tailpipe emissions, which significantly contributes to meeting stricter European standards like Euro 6 and the forthcoming Euro 7 regulations. This transition is strongly supported by initiatives such as the European Green Deal and various national incentives that aim to phase out new petrol and diesel vehicles by 2035. However, the overall environmental impact of EVs depends on the energy mix used for electricity generation. Therefore, reducing the carbon intensity of power sources alongside increased EV adoption is essential for achieving meaningful reductions in vehicular pollution across Europe.
The rapid rise in vehicle numbers worldwide, particularly in urban environments, has significantly increased greenhouse gas emissions, especially those of carbon dioxide (CO2), intensifying the pressing issue of global warming. A considerable portion of CO2 emissions is generated through frequent acceleration and deceleration and traffic congestion. The relationship between vehicle emissions and driving behavior is clear; more frequent accelerations and decelerations lead to higher CO2 output. To curb these emissions, it is crucial to limit the number of stops made by vehicles. This is because vehicles tend to emit substantial CO2 when they slow down to a stop and again when they accelerate back to a normal speed. By optimizing traffic flow and reducing the frequency of stops, urban areas can effectively lower vehicle emissions and improve air quality.
To combat pollution stemming from traffic, a new vehicle emission standard known as Euro 7/VII was introduced at the end of 2022. This standard imposes significantly stricter requirements on vehicle manufacturers to reduce harmful emissions. In addition, the European Union has set an ambitious goal for Europe to become the first climate-neutral continent by 2050. As part of this transition, there is a target for the full implementation of the Euro 7 standards by 2035, which reflects the European Union’s commitment to sustainable transportation and environmental protection [
4].
In recent years, transport policies across Europe have increasingly emphasized the role of individual driver behavior in shaping traffic efficiency, road safety, and environmental impact. With private vehicles accounting for a significant share of urban emissions and congestion, authorities are shifting focus from large-scale industrial sources to everyday driving patterns. This includes promoting eco-driving habits, implementing stricter emission inspections, encouraging the adoption of low-emission vehicles, and introducing urban access regulations. As private individuals have become the primary contributors to traffic-related pollution, their choices and behaviors now play a central role in achieving broader sustainability and safety goals.
The rise in blockchain technology has led to its adoption across various sectors, including digital identity [
5], financial transactions [
6], and marketing [
7]. This technology excels in maintaining a permanent and immutable record of transactions, known as a ledger, on a distributed network. By doing so, it creates a decentralized, secure environment that eliminates the need for trust among participants. The integrity of the blockchain system is rooted in its design, which operates independently of any central authority or the credibility of individual users. A key feature of blockchain is the smart contract, an automated software tool that facilitates and enforces agreements between parties. Smart contracts execute predefined actions automatically once certain conditions are fulfilled, enhancing efficiency and reducing the potential for disputes. This innovative approach to agreements is transforming how transactions and contracts are managed across numerous applications.
Blockchain technology is increasingly applied in traffic analysis and air quality monitoring due to its secure and efficient nature. Systems like STRICTs (Smart Emission Cap Restrictive and Carbon Permit Trading System) have been developed to manage and trade vehicle usage according to carbon emission limits. These systems automate the auditing process for carbon emissions and impose penalties for any violations without the need for third-party intermediaries. Furthermore, STRICTs leverage a decentralized approach to ensure the transparent and trustworthy trading of carbon permits about the application of blockchain in environmental management and traffic systems [
8].
Simultaneously, the concept of gamification can be effectively applied in the analysis of traffic and its environmental impact. This approach has shown success across various industries, with mobility emerging as a particularly effective domain. By implementing game-based incentive systems, cities can enhance public awareness and promote positive behavioral changes towards sustainable transportation while simultaneously collecting detailed data on individuals’ daily travel patterns. These gamified systems allow for the comprehensive tracking of movement, providing insights into how people navigate urban environments, be it via public transportation, cycling, walking, or utilizing shared services like car and bike rentals [
9]. This rich dataset stands in stark contrast to the often limited or fragmented data typically available to city planners. By analyzing this information, transportation officials can better understand mobility trends and develop informed policies. The applications of gamification in traffic monitoring range from encouraging eco-friendly driving behaviors to analyzing daily transport choices made by individuals.
This paper introduces a monitoring solution aimed at improving road traffic safety and regulating emissions, focused on blockchain and the concept of gamification. In
Section 2, some background on blockchain architecture is provided; in
Section 3, the proposed system is described; and in
Section 4, the results and discussion are presented, followed by conclusions and future perspectives in
Section 5.
2. Background
A blockchain network operates as a decentralized, distributed peer-to-peer (P2P) system where nodes communicate and exchange information without relying on a central authority. Trust within the network is maintained through consensus mechanisms and cryptographic techniques. Data is structured into a sequence of blocks, each linked to the previous one using hashing functions. Before a new block can be added, it must be validated by all participating nodes to achieve consensus. Blockchain technology is valued for its key advantages—immutability and data security—which have driven its widespread adoption. In 2014, the Ethereum platform was introduced, expanding the blockchain ecosystem by enabling smart contracts—self-executing programs that are deployed, verified, and executed within the network [
10].
Transactions on the Ethereum blockchain can be initiated either externally or by smart contracts, introducing programmable functions to the blockchain [
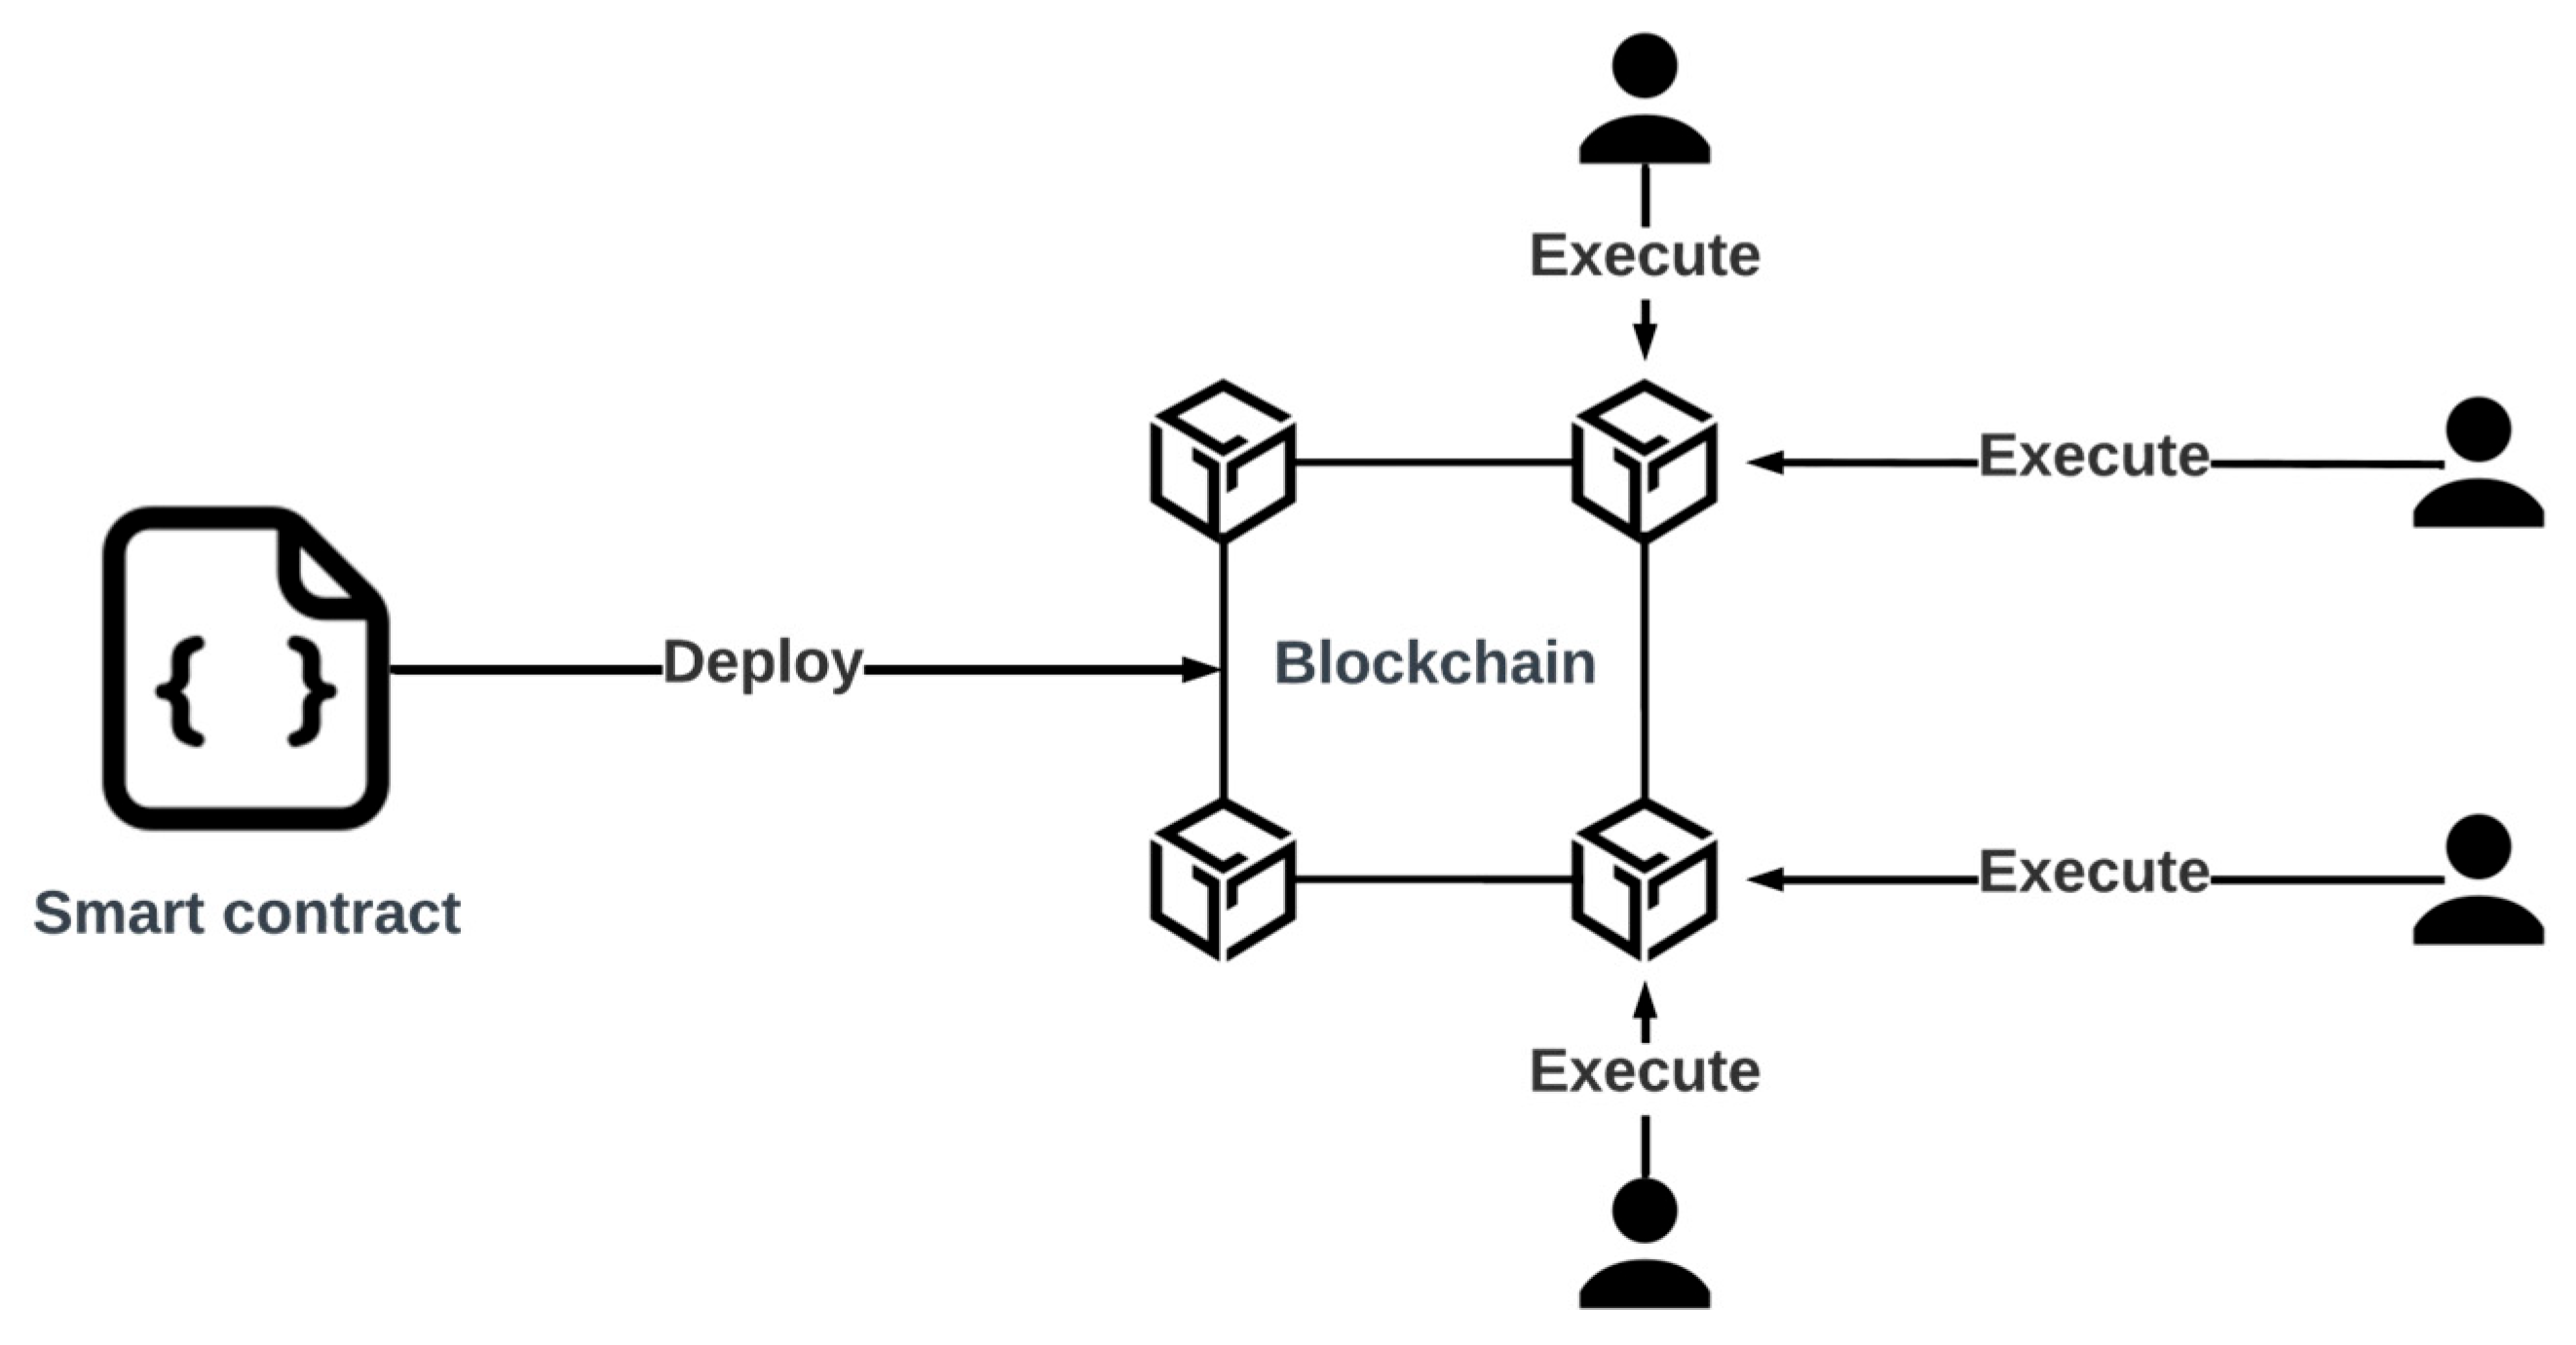
10]. Smart contracts are recorded and verified on the blockchain (
Figure 1), and once deployed, their code remains immutable, ensuring that the original conditions are upheld in all future executions. Similarly to real-world contracts, a smart contract is established between two parties and is executed when a predefined event occurs, such as reaching a deadline or achieving a specific target value. The architecture and applications of blockchain smart contracts are further explored in [
11].
A smart contract has two key attributes: value and state [
11]. Once deployed, users can interact with the contract by calling its functions. These interactions can either query the contract’s state (read operations) or modify it (write operations).
In Ethereum, it is essential to distinguish between these two types of functions. Read operations are executed locally without involving the network, as they simply access the current state of the blockchain. Since they do not require validation by other nodes, these calls are processed instantly and do not incur gas fees.
On the other hand, write operations can modify the contract’s state and must be validated by the entire network to reach consensus. Because these transactions require computational resources from all participating nodes, they incur gas fees, which are determined based on the complexity of the operation and the amount of data being processed [
5]. These transactions are included in newly mined blocks, and once a block is added to the blockchain, the updated contract state becomes part of the distributed ledger.
In private blockchain networks, the gas limit and fees can be adjusted to minimize these issues. Additionally, for specific applications, a semi-decentralized (permissioned) blockchain could be an alternative, where gas costs are covered by one or more trusted nodes. This paper proposes such a network topology as a potential solution.
3. Proposed Solution
3.1. Overview and Blockchain Smart Contract
The proposed solution is presented in
Figure 2. The core component of this study is a smartphone application that connects with the vehicle via the OBD-II interface (using Bluetooth or WiFi). This connection enables the retrieval of specific parameter IDs (PIDs), which are essential for analyzing driving behavior, estimating fuel efficiency, and assessing emissions. The collected OBD-II parameters (PIDs) are listed in
Table 1, with all measurements obtained through OBD-II Service 01—Show Current Data.
The OBD-II data is correlated with location information using the smartphone GPS module and is transmitted to a blockchain smart contract deployed on a private Ethereum network. Ethereum was selected for this work primarily due to its mature and widely adopted smart contract functionality, which offers a flexible and programmable platform for managing and securing vehicle telemetry data. Its robust developer ecosystem and extensive tooling facilitate the efficient development and deployment of decentralized applications. Additionally, Ethereum’s private network capabilities allow for controlled access and enhanced privacy, making it well-suited for handling sensitive data such as OBD-II and location information. Compared to other blockchain platforms, Ethereum strikes a good balance between security, flexibility, and ease of integration, which aligns with the objectives of this study.
The proposed system implements a gamification-based blockchain framework aimed at enhancing road traffic safety and monitoring vehicle emissions. The platform integrates game theory principles with a blockchain reward mechanism, where drivers accumulate points based on eco-driving and safe driving behaviors. These points are managed through an Ethereum smart contract, which ensures transparency and immutability in data recording and reward allocation. The design also includes a future extension in which the accumulated points can be converted into an ERC-20 token. This approach helps people stay involved by focusing on encouragement instead of penalties. It builds a more motivating and lasting way to take part in urban mobility.
The Ethereum private network used in this study was deployed on three nodes using Docker containers. The private network was deployed using the Geth tool version 1.15 and the proof-of-stake consensus method. The structure of the smart contract is presented in
Figure 3.
By leveraging the properties of blockchain technologies, especially the immutability of the validated blocks, the system can generate a trusted set of localized road traffic data which can be used to employ regulations, define low- or zero-emission areas, and better estimate the impact of road traffic pollution on the overall air quality in urban areas.
The application uses location data in order to query specific public APIs for localized speed limit and air quality measurements. This information is used to determine the driving style (speeding) and to assess the impact of the drive on air quality. In this work, the Universal air quality index (AQI) was used as a reference. The Universal AQI covers the following pollutants: carbon monoxide (CO), Nitrogen dioxide (NO
2), Ozone (O
3), Sulfur dioxide (SO
2), and particulate matters PM2.5 and PM10. The values for the Universal AQI are shown in
Table 2.
The air quality index is influenced by not only road traffic but also industries, households, weather, etc. AQI information is presented to the driver, informing them that their route will cross areas of high/low quality air.
3.2. Gamification Component
The gamification aspect of this study renders blockchain a suitable choice, as network tokens can be leveraged to create an ERC-20 coin. This digital asset can serve multiple purposes, including rewards for positive behavior, penalties for infractions, or even as a payment method for accessing geofenced areas, parking, and other services.
In the proposed solution, the gamification system calculates a score that is added to or deducted from the user’s profile after each driving session. The algorithm begins by analyzing the vehicle’s speed in relation to the speed limit. Points are then awarded or subtracted based on the following equation:
where
is the difference between the vehicle speed and the speed limit.
The driving of the vehicle at suboptimal engine speeds (rpms) can be evaluated through gear changes. Using the vehicle specifications, the vehicle speed, and the engine speed, we can estimate the current gear. First, the tire circumference (in meters) must be determined:
Next, the tire revolutions per minute (RPM) is computed using the following formula:
The gear ratio between the engine speed (RPM) and the tire RPM is determined using the following equation:
where
is obtained from the technical specifications of the vehicle.
The value is compared to the vehicle gear ratios to determine the current gear. The recommended gear for the current engine speed is computed using the following formula:
where
represents the ideal engine speed for gear shifting, and
represents the decrease in RPMs when the gear is changed. For the test vehicle, the values for
and
are 1750 rpm and 1250 rpm, respectively.
The points for suboptimal gear changes, which are equivalent to suboptimal engine speeds, are computed using the following formula:
The air quality index is used as a weight in the computation of the final points, where
represents the number of points obtained based on the current speed and speed limit,
is the number of points for suboptimal gear changes, and
is the sum of these two.
Finally, the score is weighted against the computed average AQI along the route. The average AQI is computed from publicly available information from the base stations closest to the actual location of the vehicle.
3.3. Estimation of Emissions
To estimate the emissions of CO2, CO, and NOx, three different methods were applied based on the parameters obtained through the OBD-II device. The following sections will explain these methods, including the calculation process and the parameters used.
3.3.1. METHOD 1: Driving Distance Method (Fuel-Based Emission Estimation)
This method estimates emissions based on the amount of fuel consumed per kilometer traveled, using standard emission factors. In order to estimate emissions, the fuel rate (FR) and speed values were extracted from the OBD-II parameters. The amount of fuel consumed per hour was measured in liters per hour (L/h). This is typically obtained from the vehicle’s onboard diagnostic (OBD) system.
Since the fuel rate is given in L/h, we convert it to liters per second (L/s):
where
represents fuel consumption per second, and 3600 is the number of seconds in an hour.
In the second phase, the fuel consumed per kilometer is calculated based on the following formula [
12]:
where
represents the fuel consumed per kilometer; T is the time interval, in seconds;
is the vehicle speed in km/h; and
is the speed in km/s.
In the final stage, using the fuel-based emission factors, the following equations can be applied [
12]:
where
= 2.3 g/L, and
.
3.3.2. METHOD 2: The IPCC Method (Based on the Carbon Mass Balance Approach)
The Intergovernmental Panel on Climate Change (IPCC) provides comprehensive guidelines for national greenhouse gas (GHG) inventories. These guidelines are crucial for countries to accurately estimate and report their GHG emissions and removals. This method estimates emissions using fuel density, carbon content, oxidation efficiency, and the molar ratios of carbon and CO2.
In order to estimate emissions, first, fuel density (ρ) is used to determine the fuel mass in kg based on the following formula [
13]:
where
represents the fuel mass in kg,
is the fuel consumed per km in L/km, and
= 0.74 kg/L is the density of petrol.
Next, the carbon content contribution can be calculated [
13]:
where
represents the carbon mass in kg, and
is the carbon fraction of the fuel.
Based on the carbon fraction of the fuel, the amount of oxidized carbon can be computed with the following equation [
13]:
where
is the oxidation factor.
The atomic mass ratio of
to carbon is 44/12 = 3.67, and the emission of
can be calculated with the following formula [
13]:
Similar,
is formed due to incomplete combustion, and the emissions can be calculated in the following way [
13]:
where 28/12 is the molecular weight of CO to C.
For
emissions, a standard factor is used [
13]:
3.3.3. METHOD 3: Chemical Reaction Method (Stoichiometric Combustion Analysis)
The chemical reaction method is a fundamental approach for estimating CO2 emissions based on the stoichiometric combustion of fuel. This method assumes that the fuel burns completely with the exact amount of oxygen required, without any excess air or unburned fuel. This method estimates vehicle emissions, primarily those of CO2, but it can be extended to CO and NOx emissions, based on data obtained from the mass air flow (MAF) sensor. The process is focused on estimating emissions based on the air–fuel ratio (14.7:1) and the relationship between the fuel mass burned and the emissions produced.
First, the fuel mass flow rate (dF) needs to be determined. The mass air flow (MAF) sensor measures the amount of air entering the engine, in grams per second (g/s). In gasoline engines, the air/fuel ratio is controlled by the engine’s Electronic Control Unit (ECU) and is typically maintained at 14.7:1, meaning that for every 14.7 parts of air, there is 1 part of fuel.
To estimate fuel consumption, we first calculate the fuel mass flow rate (dF) [
14]:
where
is the fuel mass flow rate,
represents the mass air flow, and 14.7 is the stoichiometric air–fuel ratio for gasoline engines.
Once the fuel mass flow rate is known, the total fuel consumption over a period of time can be calculated [
14]:
where
is the total fuel consumption in grams,
is the time interval between measurements, and
is the number of time intervals.
CO
2 emissions can be estimated based on the chemical reaction for the complete combustion of octane (C
8H
18), which is the primary component of gasoline [
14]:
From this reaction, each mole of fuel (C8H18) produces 8 moles of CO2. To calculate the mass of CO2 produced, we use the following process.
The ratio of carbon in the fuel to the mass of CO
2 can be derived from the molecular masses of carbon and CO
2. Using the atomic masses of the elements, C = 12.0107 g/mol, H = 1.00794 g/mol, and the molar mass of CO
2 = 44.0095 g/mol, the carbon-to-CO
2 mass ratio (P) is as follows [
14]:
The mass of CO
2 produced is directly related to the mass of fuel burned. The formula for CO
2 mass (
) is as follows [
14]:
where
is the mass of CO
2 emitted,
= 44.0095 g/mol, and
is 12.0107 g/mol.
Thus, the mass of CO
2 produced per second is as follows [
14]:
Finally, to calculate the total CO
2 emissions (
) over time, we obtain the sum of the CO
2 mass over the measurement intervals (
) [
14]:
where
is the total CO
2 emissions in grams, and m is the mass of CO
2 emitted per interval.
Similarly, to determine the emissions for CO and NOx, the following formulas can be used [
14]:
where 0.085 for
takes into account that carbon may not fully oxidize to
and some
(carbon monoxide) may be produced, and 0.0015 is the empirical coefficient used for
estimation.
4. Results and Discussion
The effectiveness of the proposed solution was evaluated using a 2022 Ford Kuga equipped with a 1.5 L petrol engine, featuring a CO
2 emission rate of 148.95 g/km as per the WLTP standard [
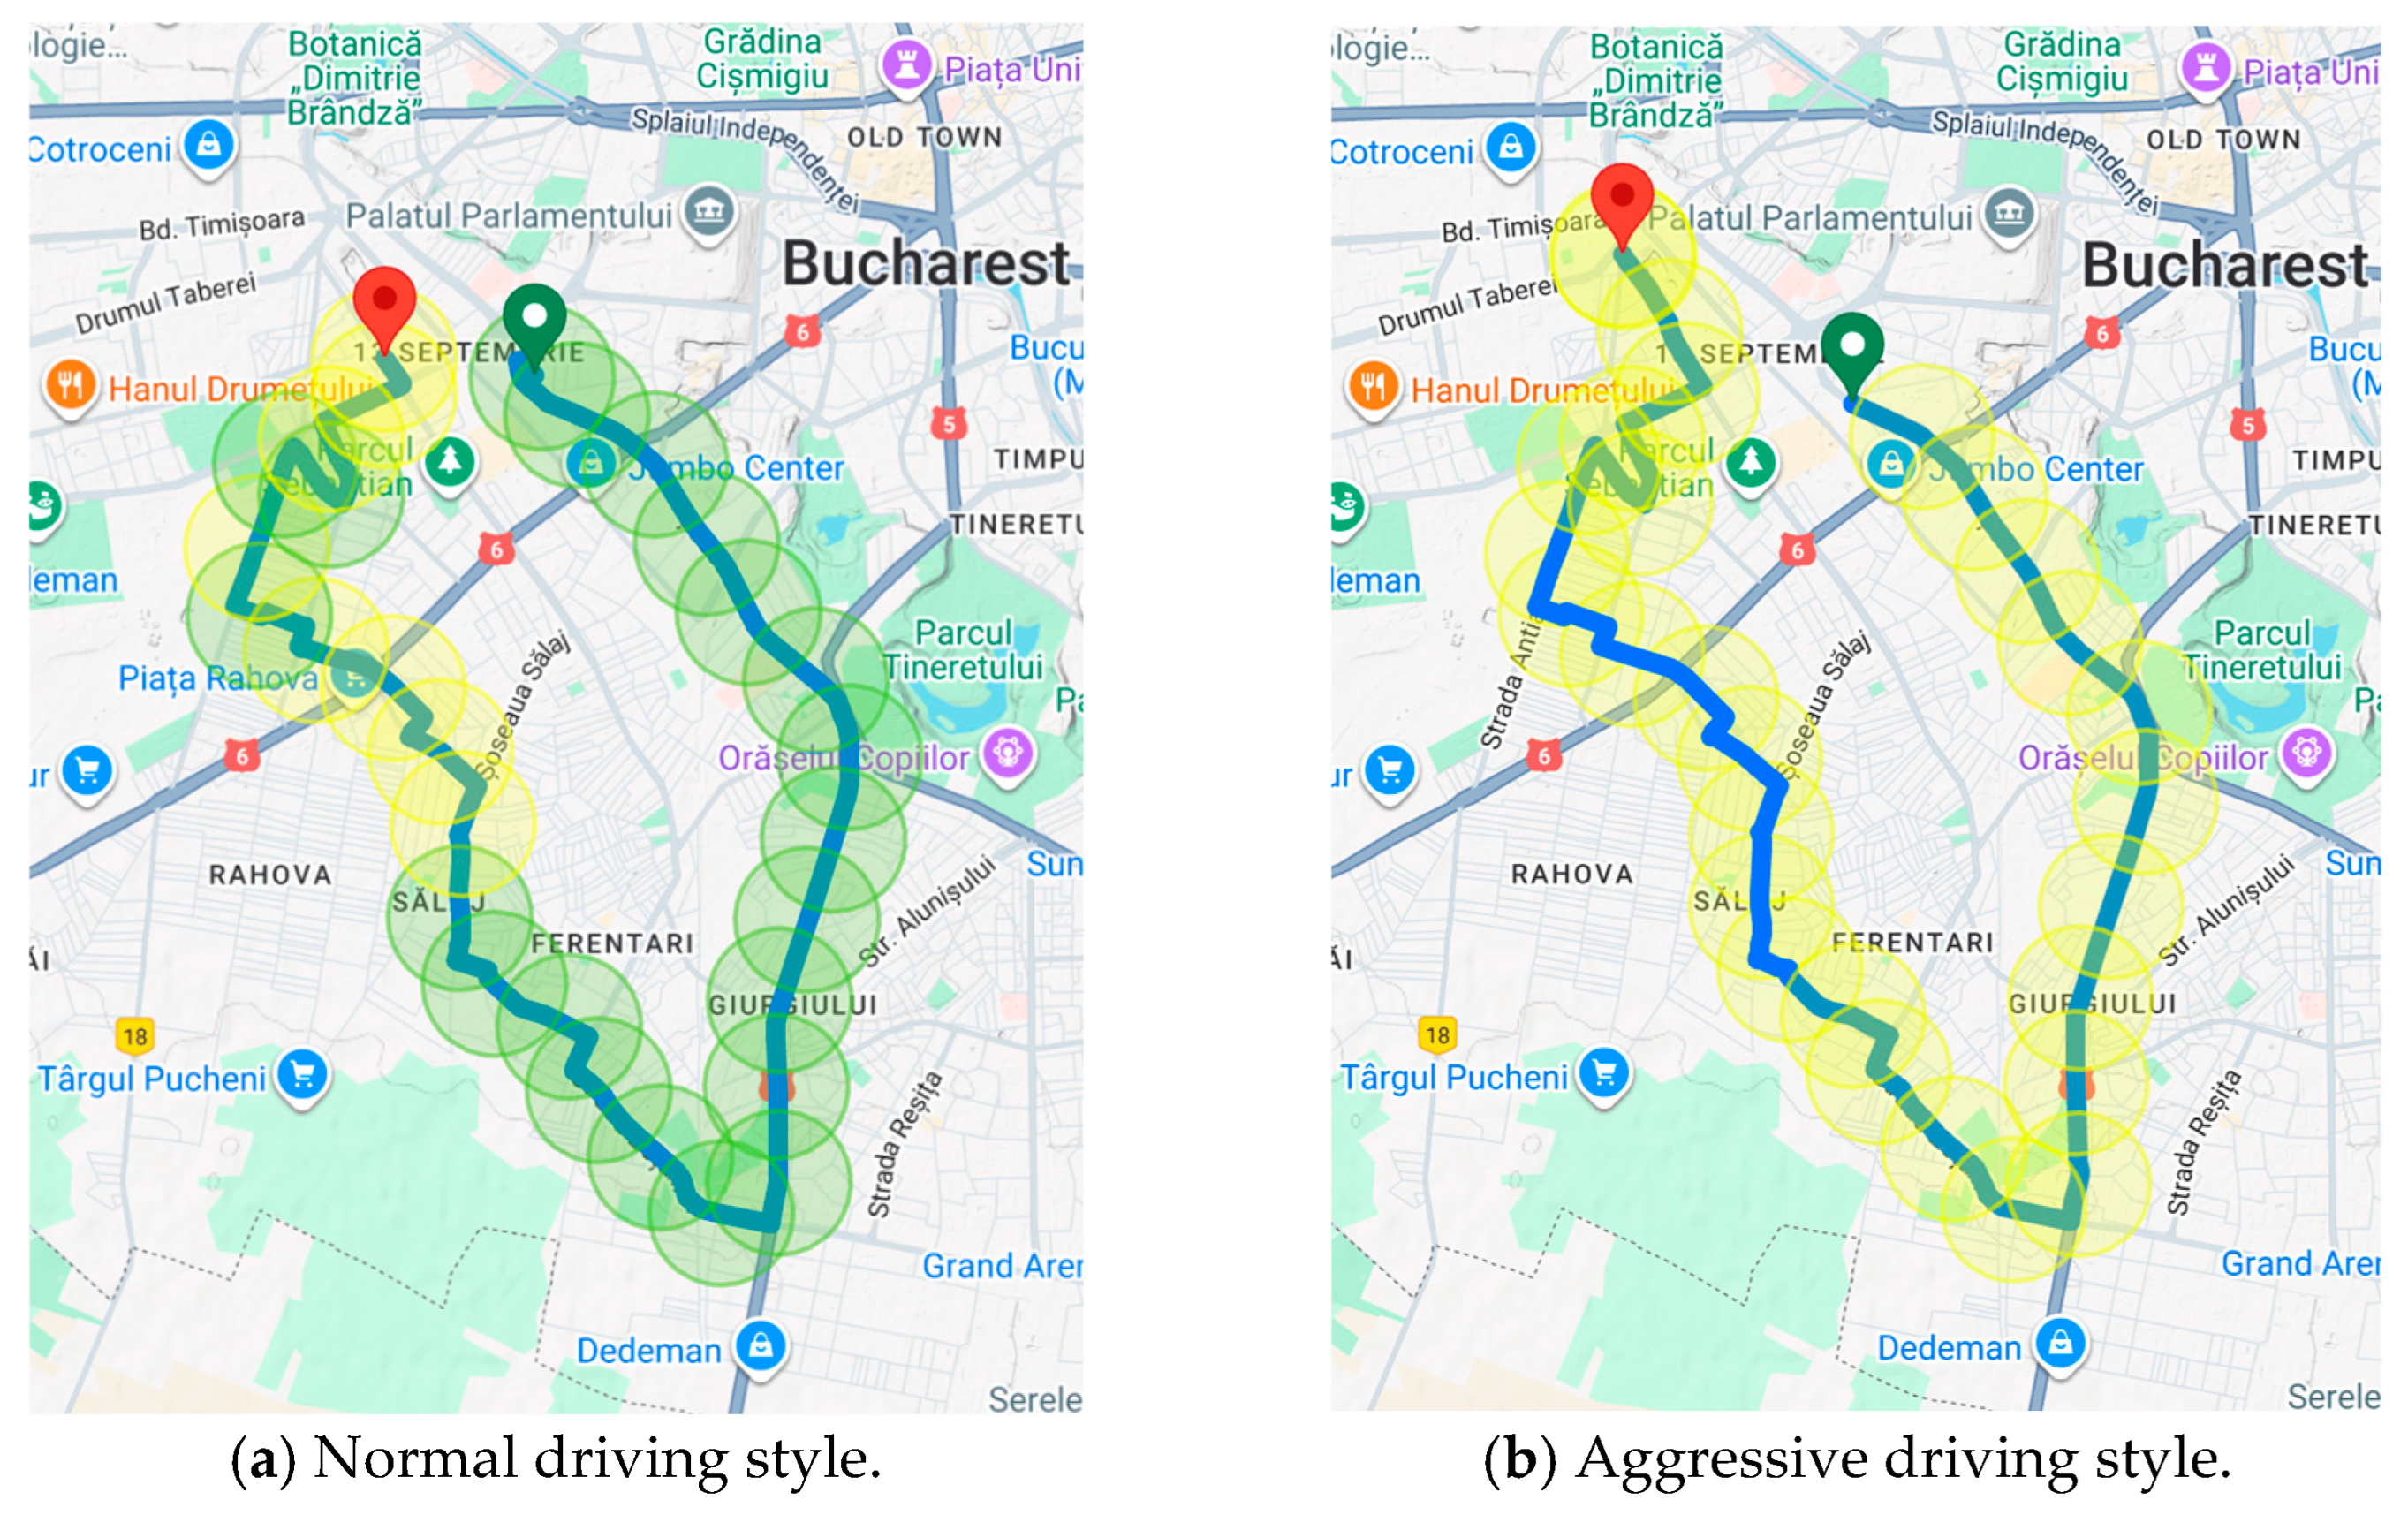
15]. To test and validate the system, multiple driving sessions were carried out under comparable route and traffic conditions (
Figure 4). The tests were conducted in Bucharest, Romania. The AQI was obtained using the Google Air Quality API, and the speed limits were obtained using the Azure Maps API. An overview of the two drives is presented in
Table 3.
From the data in
Table 3, we can compute the average fuel rate/100 km for the two driving sessions, using the following equations:
Using the above equations and the values in
Table 3, we obtain a fuel consumption of 0.985 L and an average fuel rate/100 km of 7.28% for the normal driving style, while for the aggressive driving style, we obtain a fuel consumption of 1.422 L and an average fuel rate/100 km of 10.19%. Since the average fuel rate (L/h) from the OBD-II device is not continuously monitored, these results are estimates and can vary based on the polling frequency, but we can still notice a significant increase in fuel consumption for the more aggressive driving style. The average fuel consumption reported by the onboard computer was 7.5% for the normal driving session and 11.1% for the aggressive driving session.
The engine parameters and location information were queried by the smartphone application at a rate of 10 measurements/minute.
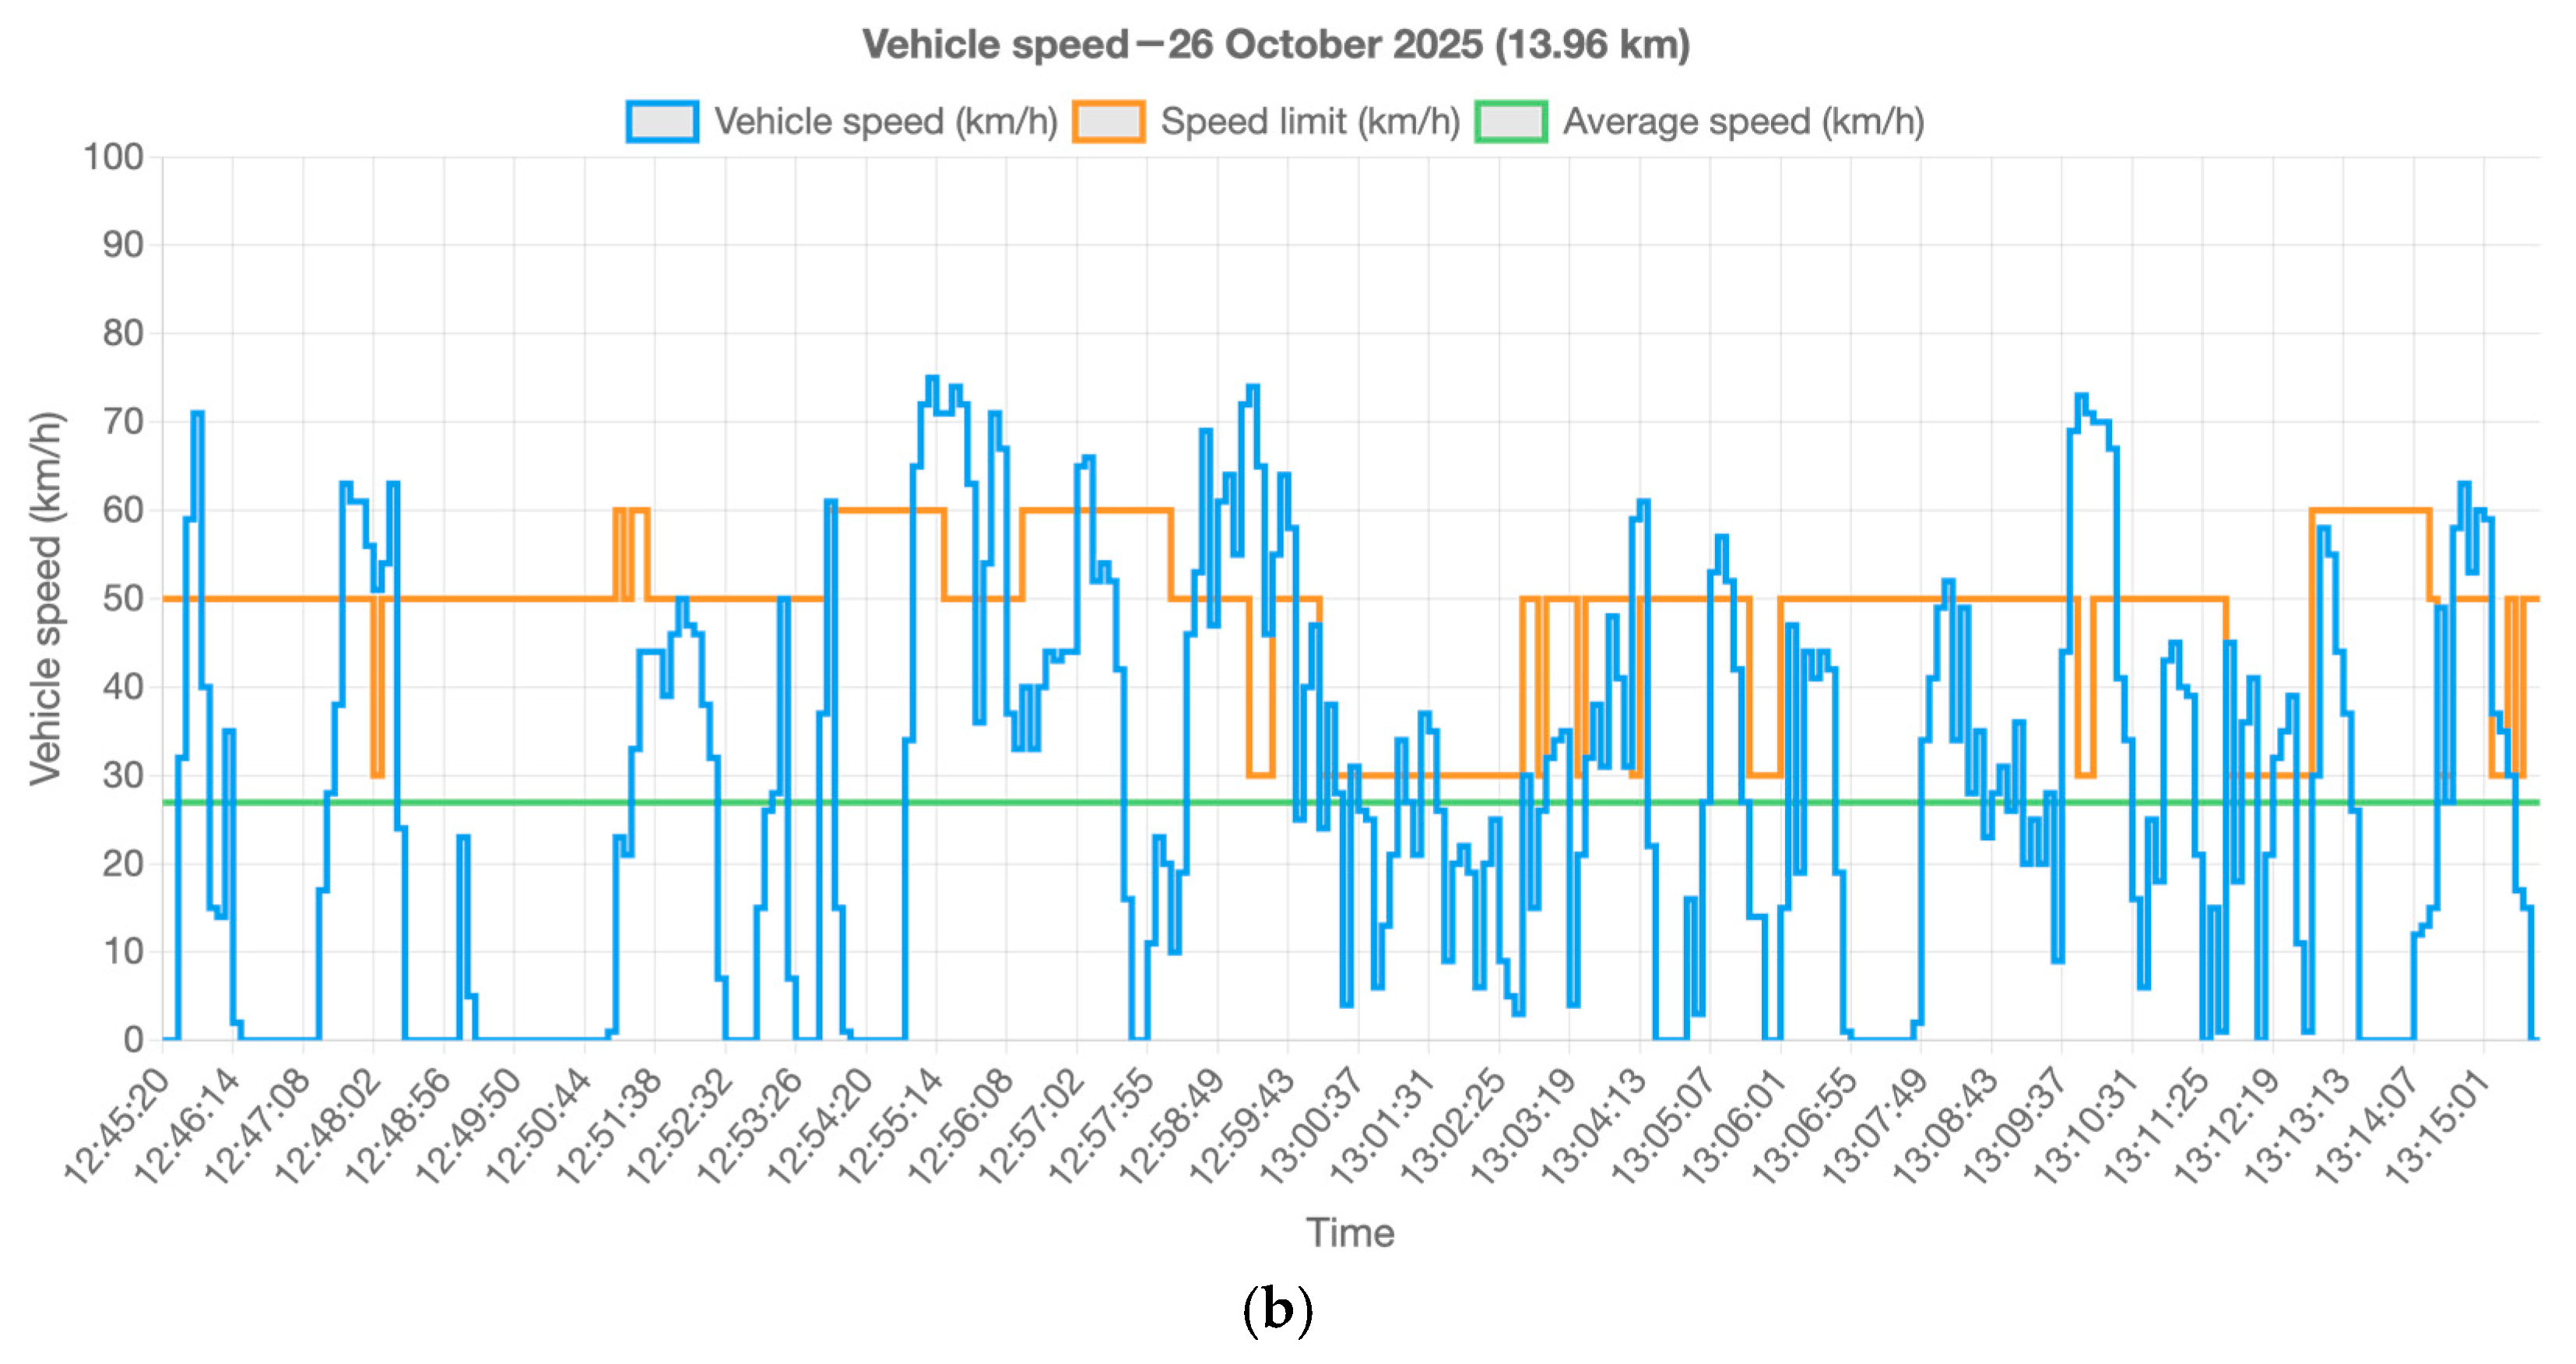
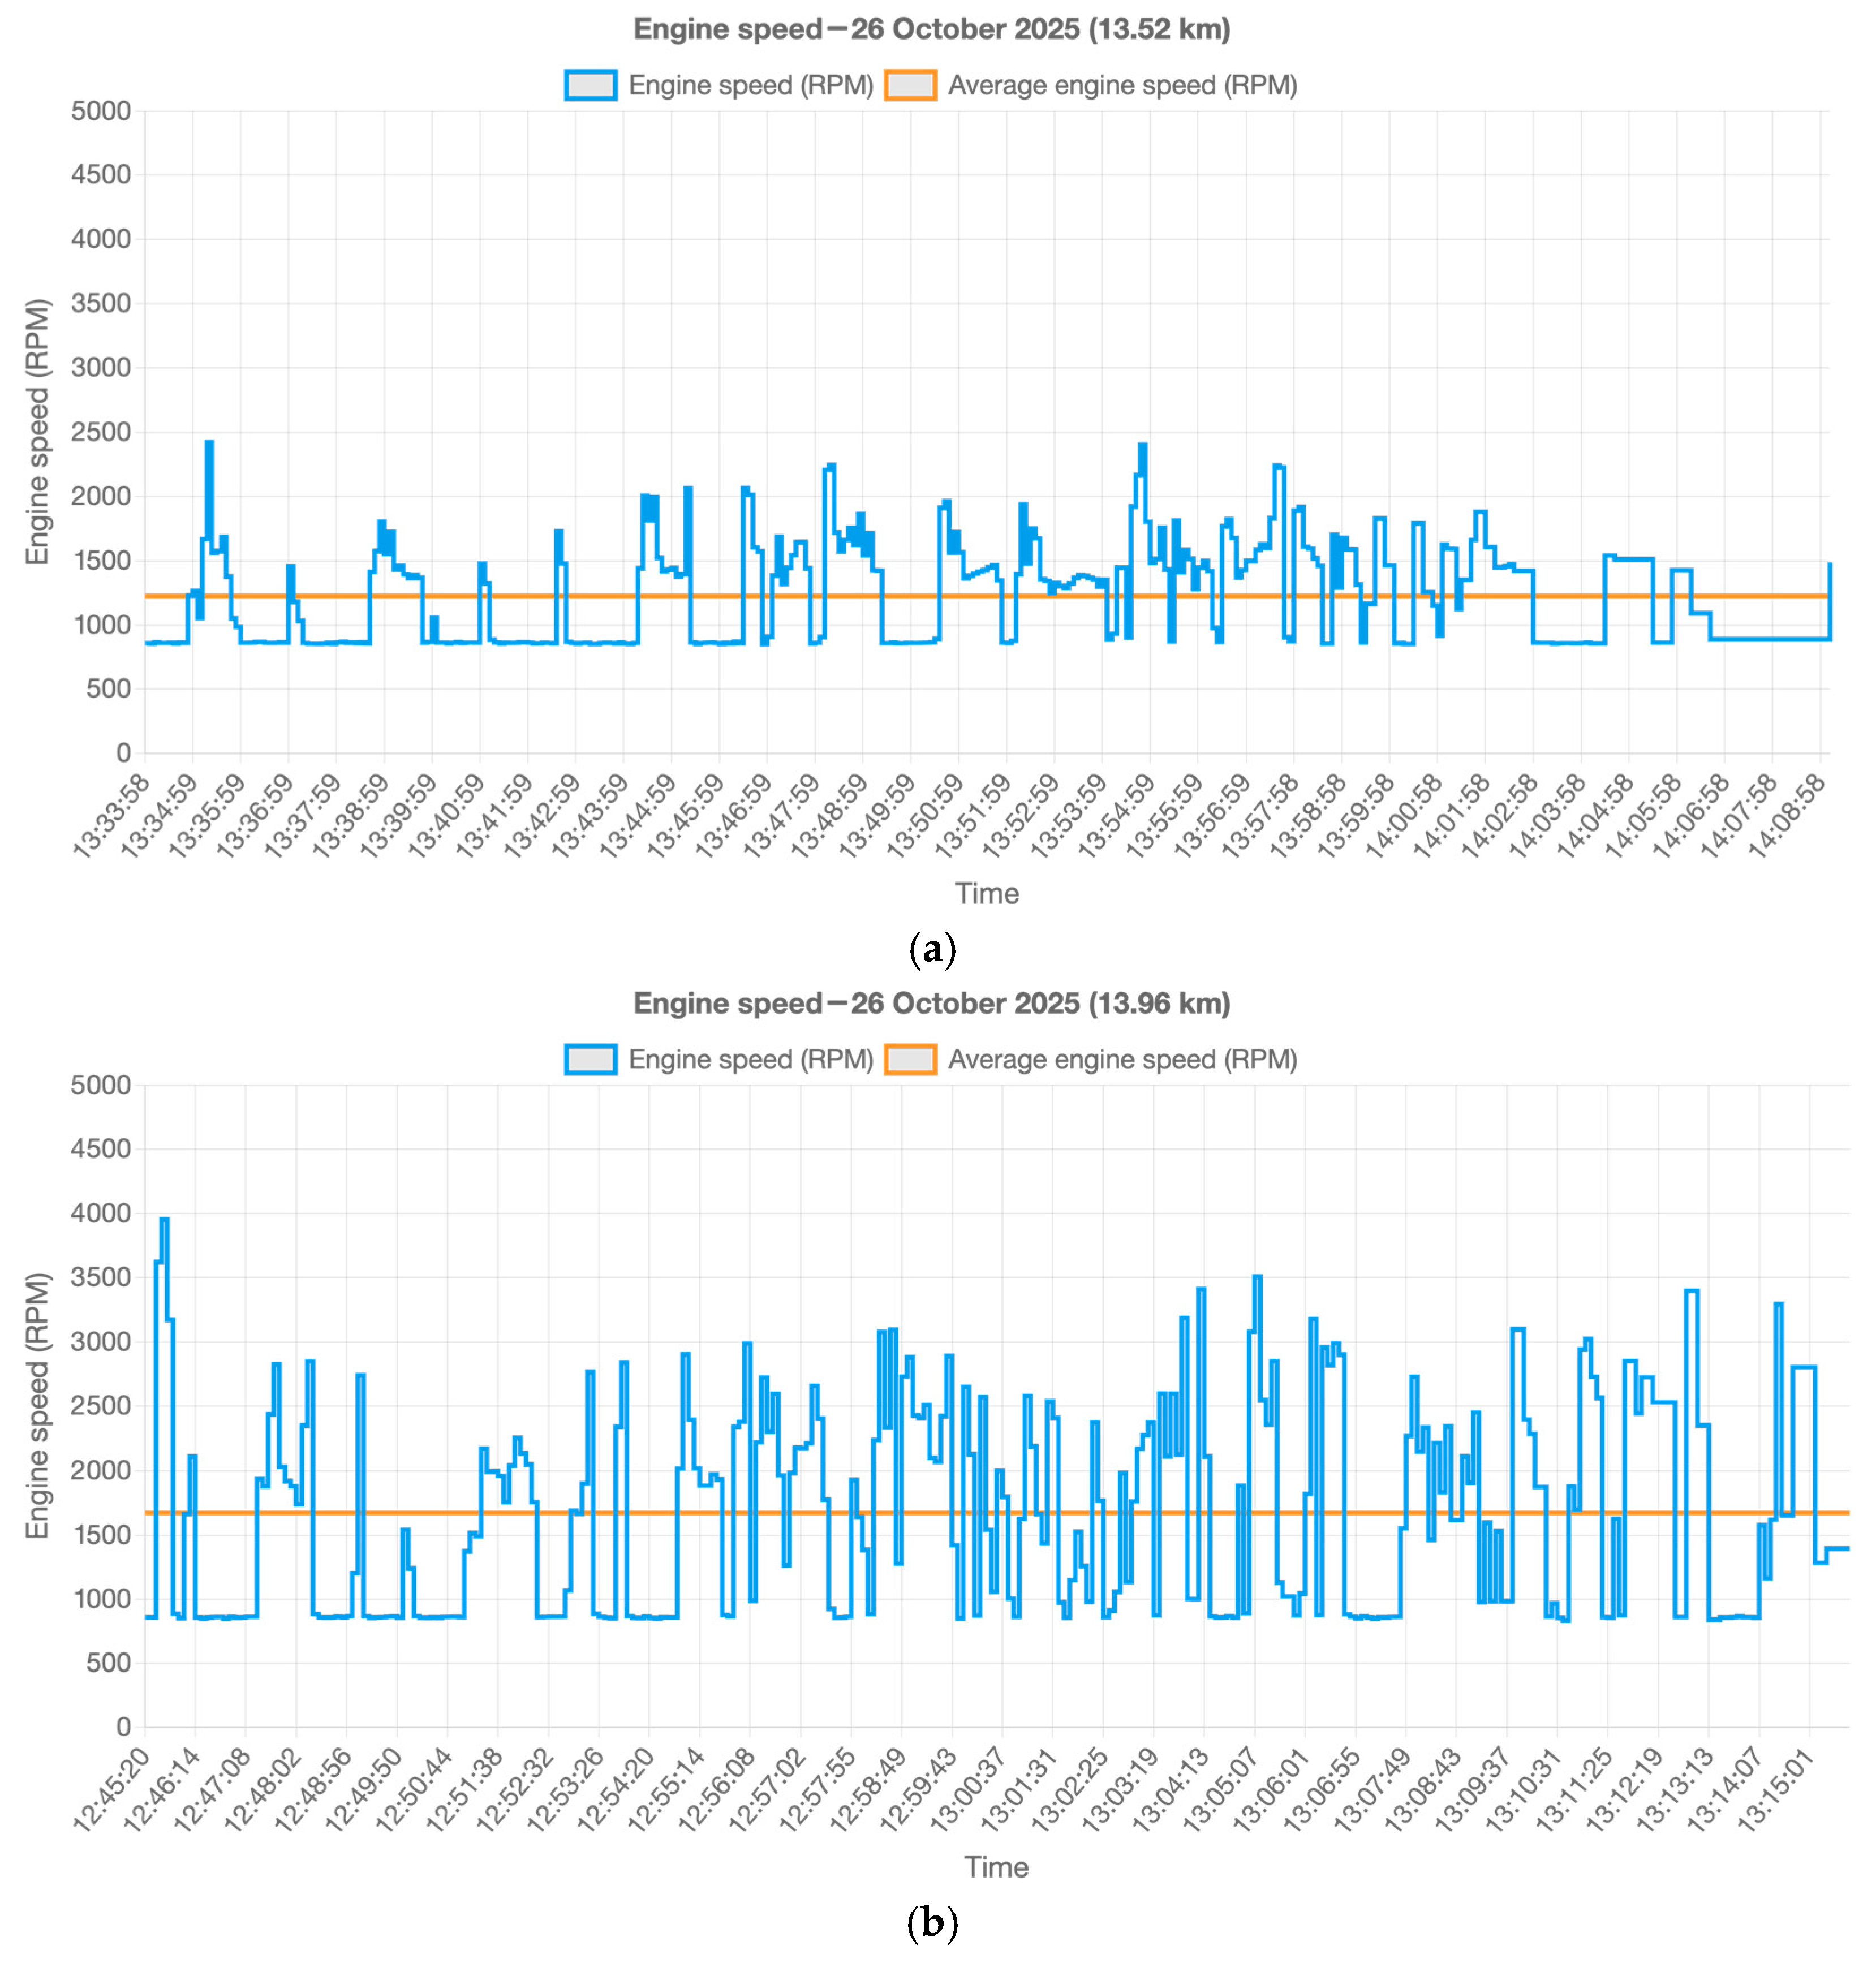
Figure 5 and
Figure 6 show the vehicle speed and the engine speed for the two driving sessions. The start/stop feature of the vehicle was turned off for the experiment, which can be seen in
Figure 6. It can also be noted that in the case of the aggressive driving session, the speed limit was exceeded on multiple occasions.
The test vehicle is equipped with tires with a size of 225/65R17, resulting in a tire circumference of 2.275 m. The gear ratios are presented in
Table 4, and the gear changes for the driving sessions are shown in
Figure 7.
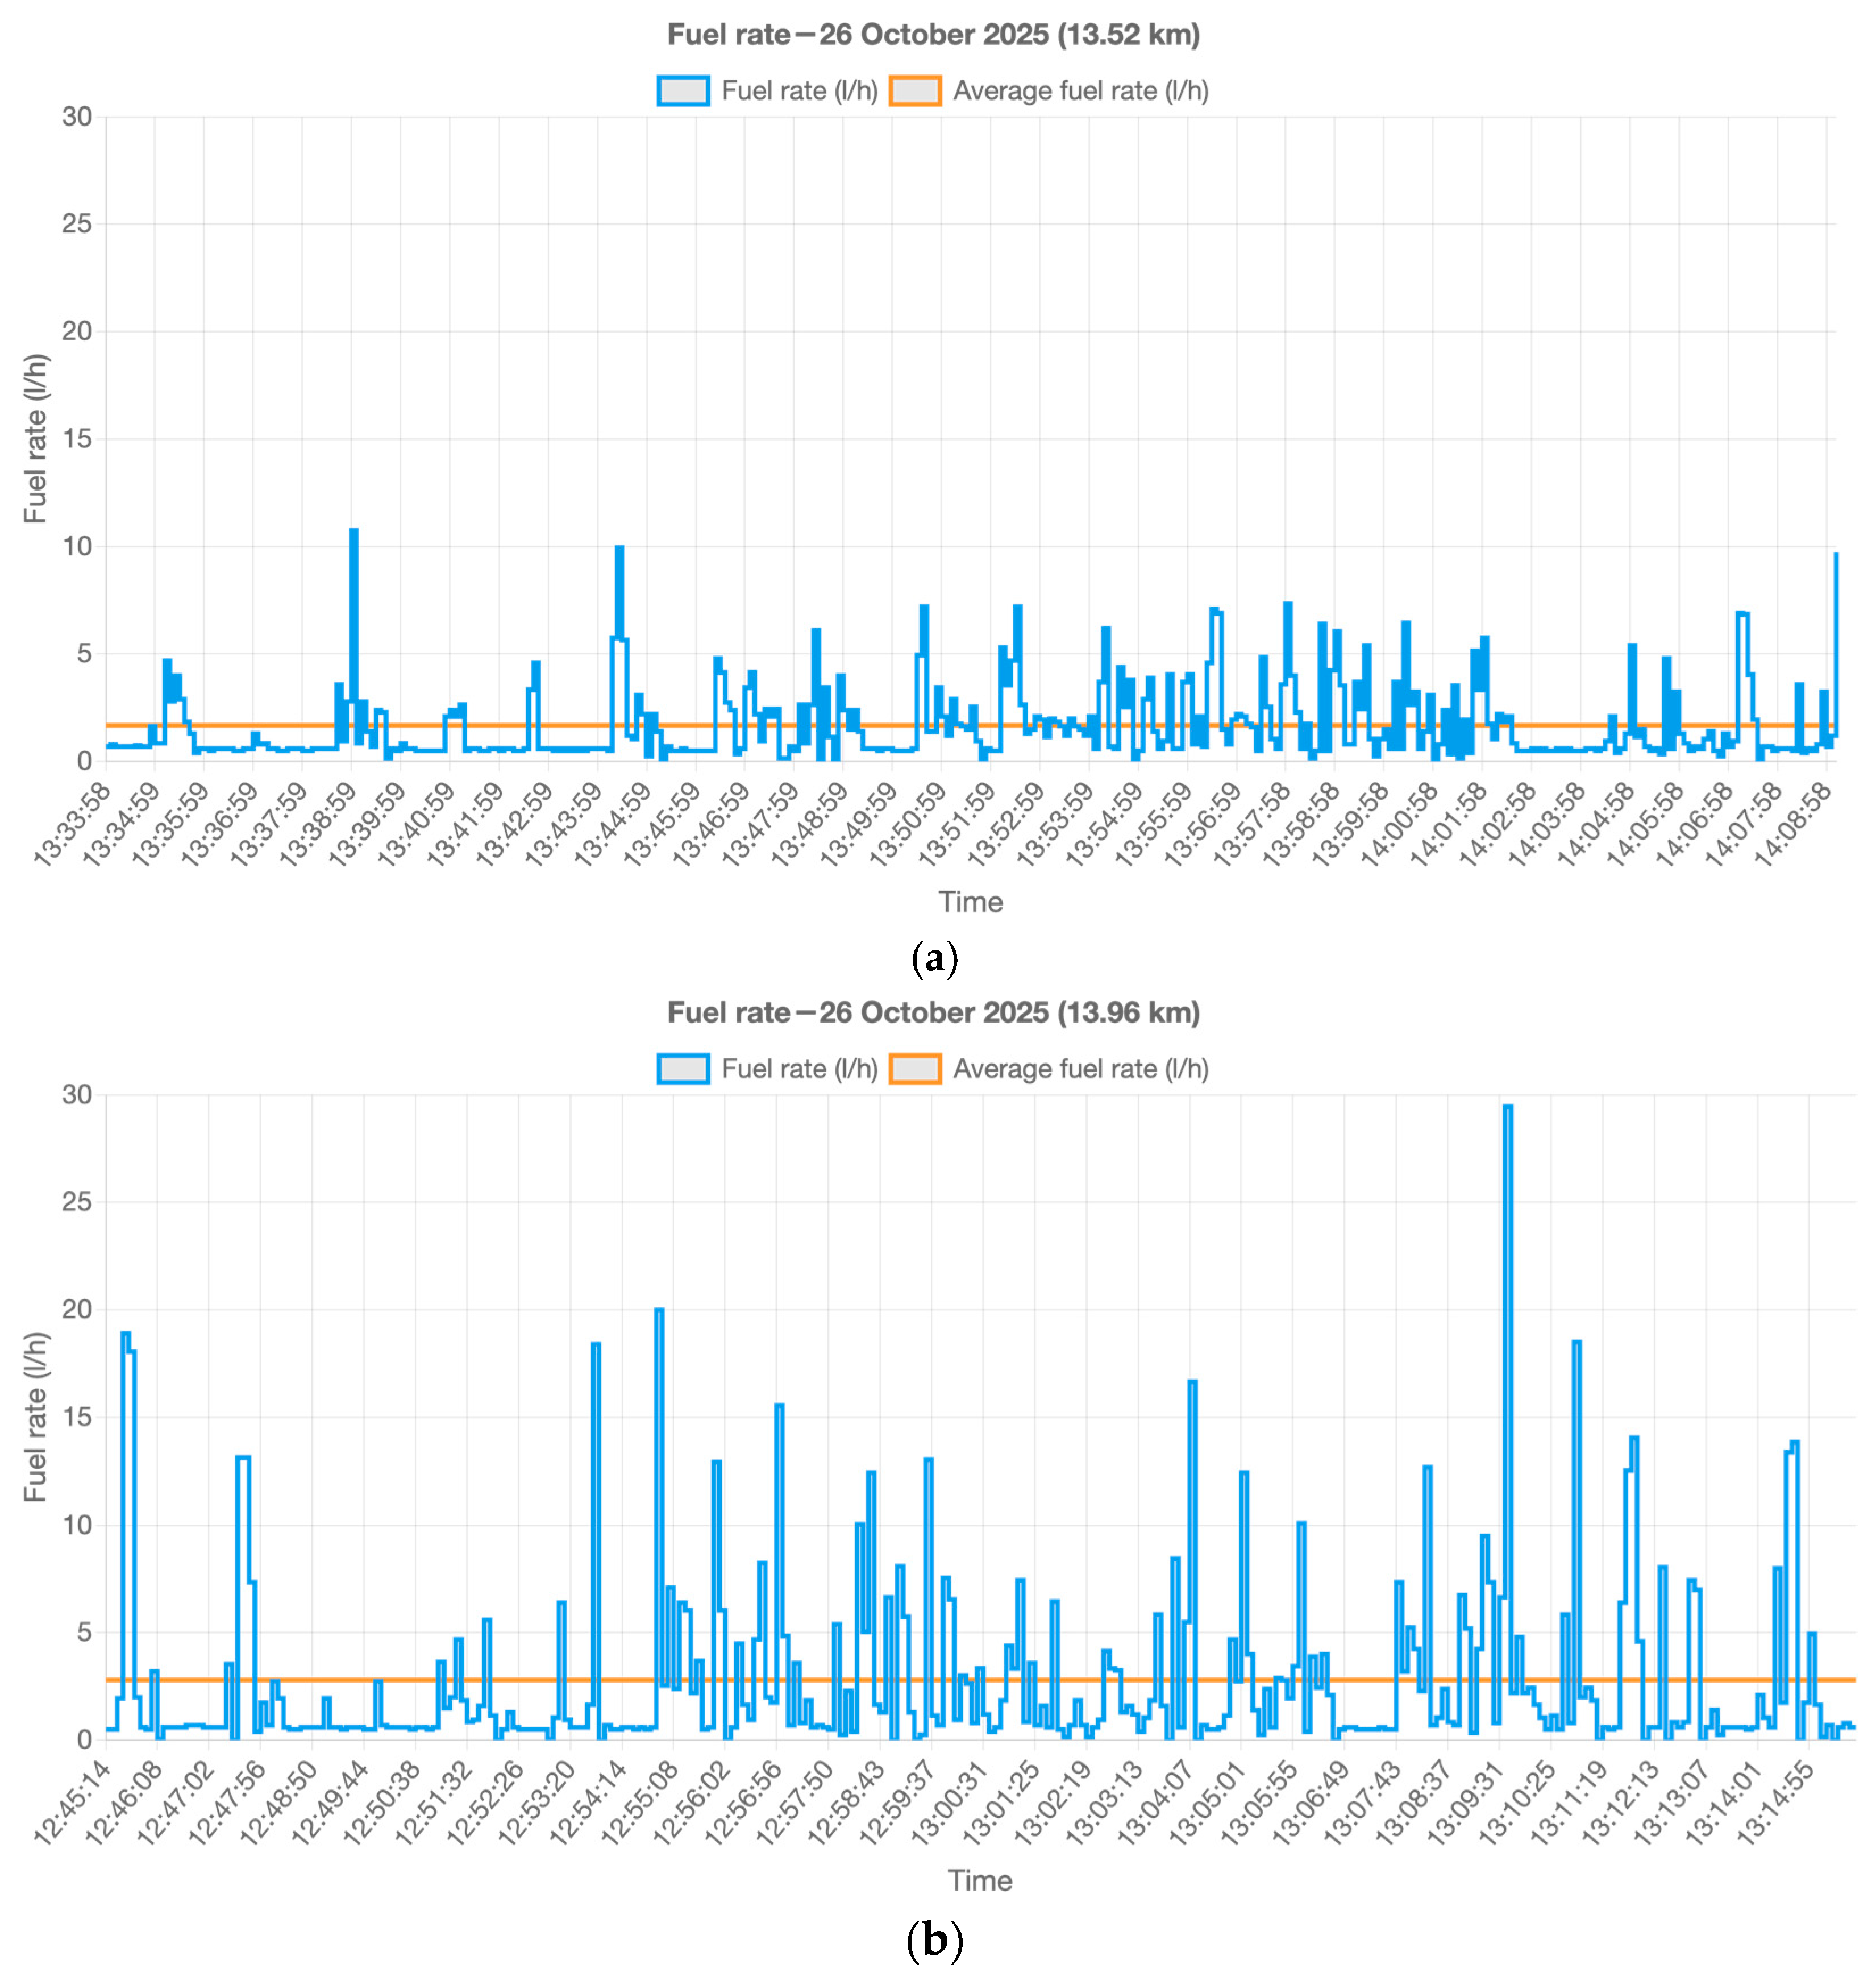
Figure 8 shows the instant fuel rate at each measuring interval. Due to the limitations of the OBD-II device with respect to the frequency of querying the data, the fuel rate may not be accurate, as sudden bursts of acceleration may happen between measuring intervals. It can be seen, however, that the number of bursts and the values of the peaks are much higher for the aggressive driving style, which is to be expected, especially for petrol-powered vehicles.
The results for the estimation of emissions are presented in
Table 5 and
Table 6.
Based on the results, it can be concluded that the chemical reaction method is the best one for estimating emissions, followed by the IPCC method and the driving distance method. In the estimation of emissions using the driving distance method, the IPCC method, and the chemical reaction method, the analysis accounted for the variability in key input parameters, including fuel consumption data, emission factors, and combustion efficiency. To quantify the associated uncertainty, standard deviations were calculated for each pollutant based on the range of values obtained across the methods. The resulting standard deviations were ±13.8 g/km for CO
2, ±0.47 g/km for CO, and ±0.02 g/km for NOx. These statistical measures offer a clearer representation of the reliability of and variability in the estimated values, contributing to a more robust interpretation of the results presented in
Table 5 and
Table 6.
The data presented in
Table 3,
Table 5 and
Table 6, and
Figure 6,
Figure 7 and
Figure 8 indicate a significant increase in fuel consumption, with minimal impact on the total time required to complete the route or the average speed of each driving session. This is primarily due to the nature of urban driving, particularly in large cities, where frequent stops at traffic lights, pedestrian crossings, and lane merges are necessary. Additionally, factors such as traffic incidents, construction, or other disruptions can slow down movement. As a result, short bursts of speed and rapid acceleration do not considerably reduce travel time but pose a high risk of serious accidents.
Using the collected data, the points for each session were calculated based on the entire algorithm of the gamification component that was described in
Section 3.2. The final score for the aggressive driving style is −210.98 points, while the normal driving style attained 219.73 points.
5. Conclusions
This work presents a proof-of-concept gamification blockchain solution designed to enhance road traffic safety and to monitor emissions in order to improve the urban driving experience by leveraging game theory and blockchain-based rewards in the form of points. These points are calculated by an Ethereum smart contract. In the next development phase, we aim to introduce the ability to convert these points into an ERC-20 token, which could be used for alternative transport solutions such as public transportation tickets, bike rentals, parking, or access to geofenced areas when needed. This approach shifts the system from a penalty-based model to a positive reinforcement mechanism, making participation more appealing.
The proposed solution is tailored specifically for urban environments, where increasing driver awareness is crucial. By providing feedback on driving behavior, it highlights the impact of an individual’s driving style on road safety, air quality, and travel time. The gamification process penalizes speeding and erratic driving, often leading to negative points for unsafe behavior.
Besides the analysis of the driving style, in this paper, we discuss different methods for emission estimation, using OBD-II data. A comparative analysis of three methods is presented, with the best results being obtained by the chemical reaction method. Before the estimation of emissions is integrated into the proposed solution, the results will first be validated by using emission sensors.
As a decentralized system, blockchain introduces security concerns, particularly regarding location monitoring. To address this, we plan to implement an opt-in mechanism for sharing location data with the smart contract. Users who choose not to share their location will still have access to their route summary, while their detailed location data will be stored locally on their device. The opt-in mechanism will be integrated at the application level, prompting users with clear consent options during initial setup and before any data is transmitted. When enabled, location data will be anonymized and encrypted on the client side before being sent to the blockchain. Only aggregated or hashed representations of location data will be recorded on-chain to prevent the reverse-engineering of individual routes. Furthermore, users will retain full control over data retention and deletion, ensuring compliance with privacy regulations such as GDPR. All data transmissions will occur over secure, encrypted channels (e.g., HTTPS with TLS 1.3), and local storage will utilize device-level encryption to protect data at rest.
The primary advantage of this solution for road traffic safety and emission monitoring is its ability to generate a trusted, high-quality dataset of traffic information, enriched with detailed parameters and location insights. This dataset could be used to train AI models for traffic analysis and prediction, as well as driving style recommendations, thus contributing to smarter urban mobility solutions. Using blockchain for data storage provides the necessary mechanism for a token-based reward system in the form of incentives for safe driving, which can be redeemed in various forms (for example, free parking or reduced public transport fares), to encourage alternative means of transport and reduce emissions.
The system being developed holds real promise for a wide range of users by turning vehicle data and driving habits into meaningful insights. Traffic authorities could use the combined scores to fine-tune how they manage road flow and ease congestion. Urban planners might tap into this data to spot areas with high pollution and make smarter decisions about where to invest in infrastructure. On the business side, companies like insurance firms could use anonymized driving patterns to create personalized policies or reward safe driving through incentive programs. These examples show how the system could play a key role in shaping safer streets, cleaner air, and more efficient transportation in our cities.
