Abstract
The removal of primer from aircraft skin epoxy resin primer plates was investigated by using an adaptive hydraulically controlled polishing tool in conjunction with an industrial robot. This study examined the effects of several key process parameters—grinding force, rotational speed, feed speed, and abrasive grit size—on primer removal depth and surface roughness. Through both single-factor analysis and response surface methodology (RSM), the variation patterns of removal depth and surface roughness with respect to these parameters were elucidated. RSM was employed to develop regression models for the primer removal depth and removal rate. The relative errors of these regression models were found to be within 8%, while the maximum relative error of the backpropagation neural network prediction model for surface roughness Ra is 9.5%. These models exhibit high accuracy in predicting the material removal depth, material removal depth rate, and surface roughness of the primer plates. The optimal parameters for the adaptive hydraulically controlled polishing tool were identified as flows: a polishing force of 20 N, a feed speed of 40 mm·s−1, a rotational speed of 2000 rpm, and 80-grit sandpaper. Under these conditions, the maximum removal depth reaches 27.5 µm, the highest removal rate is 5.501 µm·s−1, and the surface roughness Ra is 1.897 µm.
1. Introduction
Aircraft are routinely exposed to extreme environmental conditions during flight, including extreme temperatures (both high and low), intense radiation, and hypersonic airflow, which can significantly impact the aircraft’s performance and durability. Consequently, the types and properties of coatings applied to the aircraft skin play a critical role in determining the aircraft’s service life [1]. The typical thickness of aircraft skin ranges from 2 to 4 mm, while civil aviation manufacturers such as Boeing and Airbus generally specify that the total thickness of the coating system must not exceed 200 µm. Within this system, the primer layer typically measures 20 to 30 µm. Among the various coatings, aircraft skin epoxy primer functions as a vital underlayer in the overall coating system [2]. Aircraft skin coatings are multifunctional and can be categorized into three primary types based on their specific functions: (1) The decorative layer, which displays visual identifiers such as aviation logos and registration numbers while also enhancing aerodynamic performance; (2) The functional layer, primarily designed to provide corrosion resistance [3], oxidation resistance [4], ultraviolet protection, anti-icing capabilities [5], lightning strike resistance [6], wear resistance, and stealth performance (for military aircraft); (3) The base layer, typically composed of aluminum or carbon fiber, which mainly provides structural support and mechanical strength to the airframe. Among these materials, aluminum alloys are the predominant choice for aircraft base structures due to their favorable strength-to-weight ratio, superior fatigue resistance, and cost-effectiveness [7,8,9].
The service environment of aircraft is complex and dynamic, causing the aircraft’s paint layer to suffer significant wear and damage over extended flight durations. To ensure both structural safety and flight performance, partial or complete removal of the composite coating from the aircraft skin is necessary [10]. Current methods for removing aircraft skin coating include manual paint stripping, mechanical paint stripping, chemical paint stripping, and laser paint stripping [11,12,13]. Among these, manual grinding and paint stripping offer flexibility; however, the quality and efficiency of the process are heavily dependent on the operator’s skill and experience. Chemical paint stripping, while more efficient than manual methods, involves the use of highly polluting chemicals, which are incompatible with increasingly stringent environmental regulations [14,15]. Laser paint stripping, an advanced aviation technology, has emerged as a promising solution. Hu et al. [16] investigated the use of an infrared nanosecond pulse laser for paint layer stripping, adjusting the laser energy density to evaluate its impact on the skin structure and wear performance, with favorable results. Despite such advancements, the laser stripping process is divided into three distinct stages and still faces notable limitations, including reduced effectiveness on certain coating materials and the high cost of required equipment.
Given the labor intensity, environmental concerns, and cost-effectiveness issues associated with aircraft paint stripping, this study proposes developing an automated mechanical paint removal method, aiming to achieve an efficient and sustainable solution for aircraft coating removal. Compared to other paint removal methods, automated grinding and polishing offers significant advantages in aircraft maintenance, particularly in terms of efficiency, precision, and cost control [17]. Traditionally, pneumatic automatic grinding has been employed; however, challenges in controlling the pneumatic grinding force often lead to a reduced grinding precision [18]. Vladareanu et al. [19] addressed the problem of hybrid force-position control in robotic grinding by applying the principles of linear and nonlinear attractive points, along with a network of attractive curves, to generate position and force parameters. Chen et al. [20] developed a decoupled robotic grinding system consisting of an industrial robot and an end effector for robotic grinding of curved parts, which substantially reduced the grinding depth errors. Zhang et al. [21] demonstrated, through adaptive control and force modeling of a flexible grinding head, that controlling the grinding force could indirectly regulate both the material removal rate and grinding quality. Xu et al. [22] integrated a hybrid stiffness mechanism, developed a comprehensive model, and optimized parameters to maximize the constant force stroke by addressing the force overshoot problem during the contact phase of the robot end effector. Senthilkumar et al. [23] applied response surface methodology to simultaneously optimize multiple processing parameters, including flank wear, material removal rate, and surface roughness. Xie et al. [24] optimized process parameters such as polishing force, feed speed, and rotational speed, and established a surface roughness prediction model to enhance the surface quality of robot-polished mold steel. Yang et al. [25] proposed a novel surface roughness prediction model, VSG-FC, which integrates genetic algorithm-driven virtual sample generation (GA-VSG) and genetic programming-driven feature construction (GP-PC) to overcome data scarcity and achieve accurate surface roughness predictions. Shan et al. [26] developed a prediction model for material removal rate using mathematical regression models and neural networks, which were optimized via genetic algorithm (GA) to improve model accuracy. This model converted material removal rate into material removal depth per unit time and area, based on the mass difference before and after removal.
The constant-force polishing tool, based on electro-hydraulic actuator technology, offers stable polishing force control and adaptive flexible end-contact capabilities. The system integrates a servo motor, hydraulic pump, micro oil tank, hydraulic valve assembly, sensing elements, and a controller, enabling high-precision control of robotic mechanical motion through the conversion of electrical drive to hydraulic energy. This configuration allows seamless switching between “force” and “position” control modes, making it suitable for various application scenarios, including grinding, polishing, and deburring.
This study employs an adaptive hydraulically controlled polishing tool to investigate the grinding performance of Al2024 aluminum alloy plates coated with epoxy primer. The influence of various process factors on removal depth and surface roughness was examined via single-factor experiments [27], and the concept of material removal depth rate was introduced to align with industrial requirements [28]. Prediction models for three response variables were developed using response surface methodology, followed by the application of a BP neural network to optimize surface roughness, thereby achieving comprehensive optimization of process parameters.
2. Materials and Methods
The test material employed in this study was an Al2024 aluminum alloy flat plate coated with epoxy primer, with dimensions of 300 mm × 200 mm × 3 mm. The robotic grinding and polishing setup, as shown in Figure 1, comprised an eight-axis KUKA KR20 robot, an adaptive grinding and polishing (AGP) tool (Model: AGP1A-750, Shanghai Saiwider Robot Co., Ltd., Shanghai, China), a grinding disc, and sandpaper. The eight-axis KUKA KR20 robot consists of a six-axis manipulator with two additional axes, featuring a maximum load capacity of 20 kg, which enables flexible grinding and polishing across all regions of the aircraft skin. The AGP tool has a maximum rotational speed of 5500 rpm, a spindle radial floating range of 0–20 mm with a resolution of 0.01 mm, and an adjustable grinding force range of 5–120 N with a resolution of 1 N. A sandpaper disc with a diameter of 51 mm (or 2 inches) and corresponding 3M 775L sandpaper were selected. And the latter is composed of triangular ceramic alumina abrasive, which maintains sharpness, provides strong cutting force, and ensures consistent grinding performance.
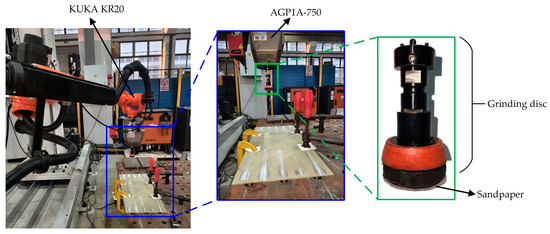
Figure 1.
Photo of robotic grinding and polishing setup.
The AGP tool was mounted on the sixth axis of the KR20 robot. The feed speed was regulated by the KR20 robot, while the rotational speed and grinding force were regulated by the AGP tool. The sandpaper disc was attached to the spindle end of the AGP, with sandpaper affixed to its surface. Surface roughness Ra was measured using a JITAI810 surface roughness tester (Beijing Jitai Keyi Testing Equipment Co., Ltd., Beijing, China), which offers a measurement range of 0.005–16 µm and a resolution of 0.001 µm. When measuring the surface roughness Ra, the JITAI 810 tester employs a Gaussian (GAUSS) filter, with a measurement speed of 1 mm·s−1. The cutoff length is identical to the sampling length, both being 2.5 mm. The measurement length (also known as the evaluation length) is 12.5 mm, which is exactly 5 times the sampling length. The coating removal depth was determined using a TT260 coating thickness gauge (Beijing Shidai Chuanghe Technology Co., Ltd., Beijing, China), with a measurement range of 0–1250 µm and a resolution of 0.1 µm.
During the experiment, the width direction of the experiment plate was designated as the feed direction for the grinding path. Along this width direction, the plate was divided into 5 grinding regions of 200 mm × 50 mm with a 10 mm interval. For measurements, the centerline of each region served as the measurement path. The coating thickness and surface roughness Ra were measured at 50 mm, 100 mm, and 150 mm along the grinding feed direction, respectively. Each measurement was repeated 5 times, and the average value was adopted as the valid result, with error bars representing one standard deviation.
A 0-level test was conducted to establish the baseline parameters for the single-factor experiments. The 0-level test conditions were set as follows: a grinding force of 15 N, a feed speed of 60 mm·s−1, a rotational speed of 1500 rpm, and a 180-grit sandpaper. The single-factor test scheme for grinding and polishing the epoxy primer plate was summarized in Table 1. Based on the results of the single-factor test, the effects of the key process parameters on material removal depth and surface quality were analyzed.

Table 1.
Single-factor experimental scheme for grinding and polishing epoxy primer plates.
In industrial grinding applications, the efficiency of grinding and polishing processes is of critical importance. To quantitatively evaluate this aspect, this study introduces the concept of material removal depth rate (MDR), defined as the removal depth of the sample after a single complete grinding cycle divided by the grinding time. can be further expressed as the material removal depth per unit time and unit length, with the corresponding conversion relationship given as follows:
where represents material removal depth rate, represents material removal depth, represents the robot’s feed speed, and L is the grinding length.
The analysis of the initial experimental design indicated that the quadratic effects of grinding process parameters play an important role in both material removal depth and surface roughness. Therefore, considering the interaction and quadratic effects among process parameters, a response surface methodology (RSM) experimental scheme was developed using the Central Composite Design (CCD). The factors considered included grinding force, feed speed, rotational speed, and abrasive size, while the response variables were material removal depth, material removal depth rate, and surface roughness.
The coded levels of RSM factors are shown in Table 2. With the number of test factors m = 4, the distance between the axial points and the center point was determined as γ = 2. For clarity and convenience, both the RSM experimental design and the corresponding analysis of the RSM results are consolidated in Table 3.
Table 2.
Coded levels of RSM factors for epoxy primer samples.
Table 3.
Response surface test scheme and results for epoxy primer samples.
The experimental design outlined in Table 3 comprises 16 factorial point experiments, 8 axial point experiments, and 6 center point experiments. Center point experiments serve two main purposes: first, to estimate experimental errors with a particular focus on pure errors, and second, to validate the stability of the model near the center point. In a typical CCD experiment, 3 center point experiments are conventionally employed. However, in this study, 6 center point experiments were conducted to achieve two key objectives. On one hand, it improves the accuracy of error estimation and reduces the impact of random fluctuations in an individual experiment; on the other hand, it enhances the robustness of the model. This ensures that the subsequent regression-based model, incorporating both quadratic terms and interaction terms, exhibits more stable predictive performance across the entire factor space.
3. Results and Analysis
3.1. Results and Analysis of Single-Factor Tests
3.1.1. Influence of Grinding Force on Material Removal Depth and Surface Roughness
The influence of grinding force on material removal depth MD and surface roughness Ra is illustrated in Figure 2. As the grinding force increases, the removal depth exhibits an overall upward trend, whereas the surface roughness first decreases and then increases. Specifically, when the grinding force increases from 5 N to 25 N, the removal depth increases from 5.2 µm to 16.7 µm.
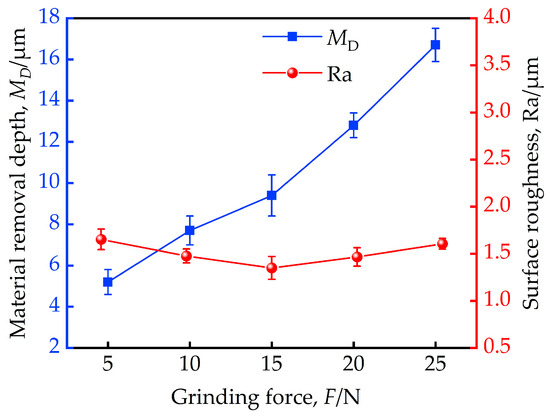
Figure 2.
Influence of grinding force on material removal depth and surface roughness.
In the elastic grinding and polishing material removal model, Preston’s empirical formula is widely adopted [29], with its equation expressed as:
where denotes the material removal depth at point (x, y) within a given interval dt; dt represents the grinding residence time; kp is the correction coefficient of the equation, which depends on factors such as workpiece material, tool material, abrasive type, temperature, robot operating conditions; p(x, y, t) is the force at the grinding contact point (x, y, t); and is the relative speed between the contact point (x, y, t) and the workpiece surface.
Vertical sandpaper grinding involves circular flexible contact, which conforms to Hertz contact theory, with the force distribution approximated by the semi-ellipsoidal law. Given the relatively small grinding force, the resulting deformation is minimal, allowing the contact area to be regarded as a circle, as illustrated in Figure 3a [30]. Accordingly, the grinding force at time t for point A(x, y) can be expressed as:
where R is the radius of grinding disc.
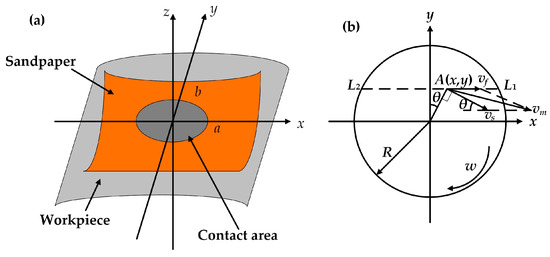
Figure 3.
Schematic diagram of (a) the contact area between sandpaper and workpiece, and (b) composition of speed vectors.
In Figure 3b, since , according to the composition of speed vectors, the relative speed can be expressed as:
Therefore, the total material removal depth at point A(x, y) can be expressed as the summation of material removal depths contributed by all micro-elements along segment L1L2, such that [31]:
where is the robot’s feed speed, n is the rotational speed, and is the grinding force.
Equation (5) demonstrates the trend observed in Figure 1, indicating that the material removal depth increases with the grinding force F.
Figure 1 also shows that as the grinding force increases from 5 N to 15 N, the surface roughness Ra of the sample decreases from 1.653 µm to 1.350 µm; however, when the grinding force increases from 15 N to 20 N, the surface roughness Ra rises from 1.350 µm to 1.606 µm. This behavior is attributed to the fact that the increased grinding force enlarges the cutting depth of abrasive grains, causing more pronounced scratches on the workpiece surface and consequently reducing surface quality. Moreover, higher grinding force generates increased cutting heat. Since the coating material is an epoxy resin primer—and resin-based materials exhibit strong adhesiveness [32]—the elevated cutting temperature promotes adhesion of the paint layer to both the workpiece surface and the sandpaper. This adhesion degrades the workpiece’s surface quality and impairs the sandpaper’s grinding performance.
3.1.2. Influence of Feed Speed on Material Removal Depth and Surface Roughness
The influence of the robot’s feed speed on material removal depth and surface roughness is illustrated in Figure 4.
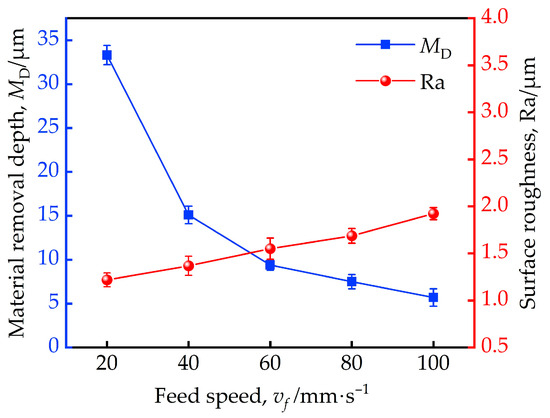
Figure 4.
Influence of feed speed on material removal depth and surface roughness.
As shown in Figure 4, when the robot’s feed speed increases from 20 mm·s−1 to 100 mm·s−1, the material removal depth decreases from 33.3 µm to 5.7 µm, while the surface roughness Ra increases from 1.219 µm to 1.924 µm, exhibiting an upward trend. According to Equation (5), this phenomenon can be explained as follows. With the increase in feed speed , the grinding time per unit length of the workpiece is reduced, which decreases the number of interactions between abrasives and weakens the cutting effect, thereby lowering the material removal depth. Additionally, the shortened contact time between each abrasive grain and the workpiece intensifies the sliding and plowing actions on the workpiece surface, leading to an increase in surface roughness.
3.1.3. Influence of Rotational Speed on Material Removal Depth and Surface Roughness
The effect of the grinding disc’s rotational speed on material removal depth and surface roughness is presented in Figure 5.
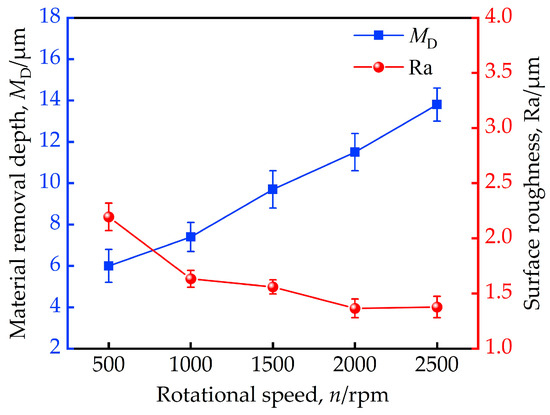
Figure 5.
Influence of rotational speed on material removal depth and surface roughness.
As observed from Figure 5, increasing the rotational speed from 500 rpm to 2500 rpm results in an increase in material removal depth from 6 µm to 13.8 µm. With regard to surface roughness Ra, it decreases from 1.663 µm to 1.365 µm as the rotational speed increases from 500 rpm to 2000 rpm. Upon reaching 2500 rpm, the surface roughness Ra experiences a slight increase to 1.377 µm, which remains within the range of the error bars. As outlined in Equation (5), the increase in rotational speed enhances the material removal depth. This is because, with the robot’s feed speed remaining constant, a higher rotational speed increases the number of abrasive grains interacting with the workpiece per unit time, thereby increasing the material removal depth. Additionally, the more frequent abrasive interactions reduce the residence time of each grain, minimizing the height of grooves formed by plowing and improving surface finish. However, as indicated by Equation (4), further increases in rotational speed significantly raise the relative speed vm, which in turn elevates the workpiece surface temperature. This can cause the epoxy primer to adhere to both the sandpaper and the workpiece, degrading the surface quality. Consequently, to maintain optimal surface finish, the rotational speed for grinding the paint layer should not exceed 2000 rpm.
3.1.4. Influence of Grit Size on Material Removal Depth and Surface Roughness
The influence of grit size on material removal depth and surface roughness is depicted in Figure 6.
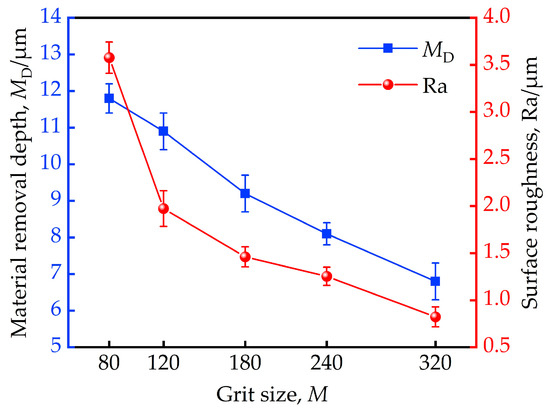
Figure 6.
Influence of grit size on material removal depth and surface roughness.
As illustrated in Figure 5, when the sandpaper grit size increases from 80 to 320, the material removal depth decreases from 11.8 µm to 6.8 µm, while surface roughness Ra decreases significantly from 3.577 µm to 0.823 µm. With the finer abrasive grit, the abrasive grains on the sandpaper have smaller diameters and heights, which reduces their penetration depth into the workpiece and weakens the sliding and plowing effects. As a result, both the material removal depth and surface roughness decrease, leading to the improved surface quality. Notably, when the grit size increases from 80 to 120, the material removal depth decreases slightly from 11.8 µm to 10.9 µm, whereas the surface roughness Ra is substantially reduced from 3.577 µm to 1.974 µm. This indicates a significant improvement in surface finish with minimal loss in material removal.
3.2. Results and Analysis of Response Surface Methodology
The response surface methodology results for epoxy primer samples are displayed in Table 3.
Design-Expert 13.0 was employed to carry out regression analysis on the experimental data presented in Table 3. Given the influence of interaction and coupling effects between factors, a quadratic regression model was adopted in this study [33]:
where represents the response variables, specifically , , and Ra; , , , and denote the constant term, linear coefficient of each factor, interaction coefficient between factors, and quadratic coefficient of each factor, respectively; and stand for the independent factors, i.e., one of the factors A, B, C, D.
The credibility of the regression model was verified through the multiple correlation coefficient R2 and analysis of variance [34,35]. The outcomes of material removal depth are compiled in Table 4 and Table 5.
Table 4.
Variance and correlation coefficients of material removal depth based on response surface regression.
Table 5.
Variance and correlation coefficients of material removal depth rate based on response surface regression.
A higher F-value, lower p-value, and R2 value closer to 1 indicate greater model accuracy [36]. Specifically, a p-value < 0.05 denotes statistical significance, a p-value < 0.01 indicates higher significance, and an R2 > 0.9 suggests a reliable regression equation. As shown in Table 4, both R2 and of the material removal depth prediction model exceed 0.9, confirming the model’s significance. However, a considerable discrepancy between and R2 indicated the presence of some redundant terms, which were subsequently eliminated. Specifically, the p-values of terms A, B, C, D, AC, and CD, as well as quadratic terms A2 and B2, were less than 0.05, while the p-values of interaction terms AB and BC were between 0.05 and 0.1, warranting their retention in the model. Therefore, the terms AD, BD, C2, and D2 were removed. The response surface prediction regression equation for material removal depth obtained using Design-Expert 13.0 is as follows:
In the analysis of variance for the refined model, the values are as follows: R2 = 0.9774, = 0.9654, and = 0.9349. Although R2 shows a slight decrease and exhibits a minor increase, the increases substantially. This indicates that the reliability and predictive accuracy of the model have been significantly improved after the elimination of redundant terms.
In addition, the F-values presented in Table 4 reflect the relative influence of each factor on the material removal depth, with the ranking as B > A > B2 > C > AC > D > A2 > CD. Correspondingly, the factors affect the material removal depth in the following order: feed speed > force > quadratic term of feed speed > rotational speed > interaction between force and rotational speed > quadratic term of force > sandpaper grit size > interaction between rotational speed and sandpaper grit size. The interactions between feed speed and force, as well as between force and rotational speed, exhibit only minor effects on the material removal depth. Meanwhile the interaction between feed speed and sandpaper grit size has the least influence, and the interaction between force and sandpaper grit size has a negligible influence on the material removal depth.
The outcomes of material removal depth rate are shown in Table 5.
Both R2 and of the material removal depth rate prediction model exceed 0.9, indicating that the model is significant, although is relatively low. Using the same optimization approach as described previously, the terms AD, BC, BD, C2, and D2 were eliminated. The refined model yields R2 = 0.9475, = 0.9239, and = 0.8622, with the difference between and R2 remaining below 0.1, confirming the model’s reliability. The response surface regression equation for material removal depth rate obtained using Design-Expert 13.0 is expressed as follows:
The F-values presented in Table 5 reflect the relative influence of each factor on the material removal depth rate, ranked as A > C > D > AC > A2 > B > CD > B2 > AB, Accordingly, the factors affect removal depth rate in the following order: grinding force > rotational speed > sandpaper grit size > interaction between force and rotational speed > quadratic term of force > feed speed > interaction between rotational speed and sandpaper grit size > quadratic term of feed speed > interaction between force and feed speed. The interactions between force and sandpaper grit size, between feed speed and rotational speed, and between feed speed and sandpaper grit size exhibit negligible influence on the material removal depth rate and therefore can be disregarded.
The response surface regression model for surface roughness was analyzed using the same methodology. The analysis indicates that the p-value of the optimized model is 0.0002, confirming its statistical significance. However, the coefficients of determination—R2 = 0.8333, = 0.7986, and = 0.7051—are all below 0.9, indicating that the model lacks sufficient reliability for accurate prediction.
Given the poor performance of the surface roughness regression model, if only the maximum material removal depth and maximum material removal rate are taken as optimization objectives, the optimal process parameters obtained by Design Expert 13.0 are as follows: a grinding force of 25 N, a feed rate of 40 mm·s−1, a rotational speed of 2500 rpm, and an 80# sandpaper grit size.
3.3. BP Neural Network Prediction Model for Surface Roughness and Removal Depth
Given the limited predictive accuracy of the surface roughness regression model established via response surface methodology, a BP neural network was adopted to predict surface roughness Ra and material removal depth . Since the construction of a BP neural network requires a substantial dataset, 25 groups of experimental data, as presented in Table 6, were incorporated into the response surface test data results.
Table 6.
Additional experimental data for establishing BP neural network.
The BP neural network is a multilayer feedforward neural network trained by the error backpropagation algorithm, consisting of an input layer, a hidden layer, and an output layer [37]. The number of nodes in the hidden layer has an impact on the prediction accuracy and is typically determined by the following empirical formula [38]:
where N is the number of hidden layer nodes; p is the number of input layer nodes, q is the number of output layer nodes, and a is a constant ranging from 1 to 10.
In this study, the BP neural network model was implemented using MATLAB 2024b and configured with a three-layer structure. The transfer functions from the input layer to the hidden layer and from the hidden layer to the output layer are both set as tansig, and the training algorithm adopted is trainlm. The input layer contained four nodes, representing the grinding force F, feed speed , rotational speed n, and sandpaper grit size M, respectively. The output layer included two nodes, corresponding to surface roughness Ra and material removal depth MD. According to Equation (9), the number of hidden layer nodes N is considered within the range of 3–12. Optimal performance was achieved when N = 7. The network was trained for 1000 iterations, with a learning rate of 0.01 and a minimum training error target of 0.00001.
From the 30 CCD experimental sets, 23 were randomly selected, with the constraint that they include exactly 3 randomly chosen center point experiments. Furthermore, 17 were randomly selected from the 25 supplementary experiments. These 40 groups collectively form the training set. The remaining 15 groups—consisting of 7 from the CCD experiments and 8 from the supplementary experiments—make up the test set.
The training results indicate that the coefficient of determination R2 is 0.9315 for surface roughness Ra and 0.9650 for material removal depth. Figure 7 presents the error plots for both surface roughness Ra and material removal depth , where both relative errors are less than 9.5%, and they are well within the acceptable range. This indicates a strong consistency between the BP model’s predicted and experimental values. These results confirm that the established BP neural network model possesses high predictive accuracy and stability.
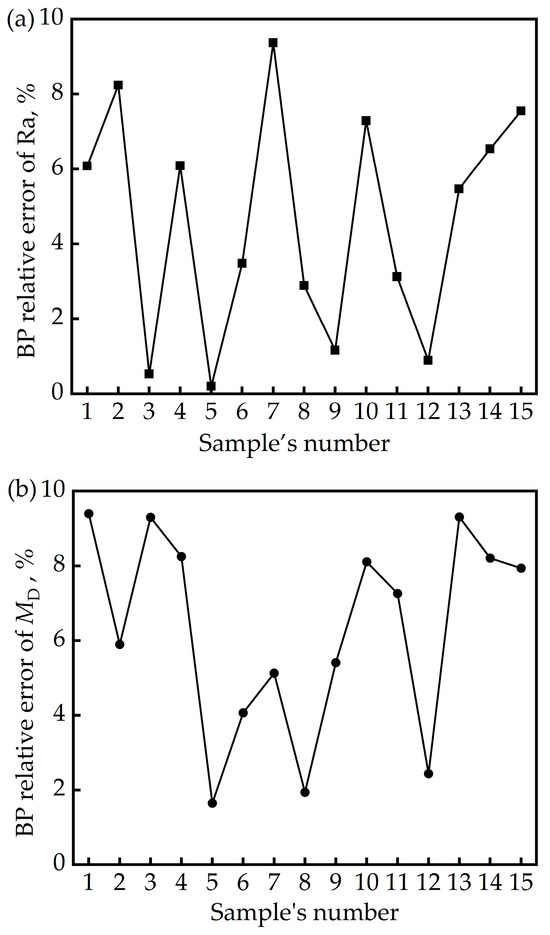
Figure 7.
Error diagrams of BP neural network model prediction results: (a) surface roughness; (b) material removal depth.
For the prediction of material removal depth, the BP neural network model yields an R2 value of 0.9650, which is slightly lower than that of the regression model (R2 = 0.9815). In contrast, for surface roughness prediction, the BP neural network achieves an R2 value of 0.9315, which is substantially higher than that of the regression model (R2 = 0.8719). These results indicate that the BP neural network model exhibits superior predictive performance for surface roughness, whereas its performance in predicting material removal depth is comparable to that of the regression model.
To further validate the model accuracy of models and obtain the optimal process parameters, experiments were performed using the optimal parameters initially determined by maximizing both material removal depth and material removal rate (i.e., a grinding force of 25 N, a feed rate of 40 mm·s−1, a rotational speed of 2500 rpm, and a sandpaper grit size of 80). However, the experimental results indicated that excessive primer layer adhesion on the sandpaper surface led to poor durability, allowing only one grinding cycle. Consequently, to enhance sandpaper lifespan, the grinding process parameters were further reduced. After multiple iterative tests, a revised parameter set (grinding force: 20 N, feed rate: 40 mm·s−1, rotational speed: 2000 rpm, sandpaper grit size: 80) was selected. This revised set, together with 4 additional random process parameter sets as specified in Table 7, was adopted for subsequent experiments. The experimental results were compared with the corresponding predictions from models, as shown in Table 8.
Table 7.
Process parameters used for model prediction and test verification.
Table 8.
Comparison between model predicted values and test values.
As shown in Table 8, the maximum relative error of the material removal depth rate regression model is 7.9%, and that of the removal depth regression model is 7.4%, both of which are below 8%. The maximum relative error of the surface roughness Ra predicted by the BP neural network model is 9.5%, indicating that the established models can reliably predict the material removal depth rate, material removal depth, and surface roughness. For material removal depth, the maximum relative error of the regression model is 7.4%, compared to 10.0% for the BP neural network model, showing a certain discrepancy. Nevertheless, when comparing the predicted material removal depth values under the five different grinding process parameters, the two models exhibit comparable accuracy, with the regression model performing slightly better. Therefore, the regression model is suitable for predicting the material removal depth and material removal depth rate, while the BP neural network model is more appropriate for predicting the surface roughness.
Additionally, from the standpoint of primer layer removal efficiency, W1 in Table 8 corresponds to the experimental results under the optimal process parameters (F = 20 N, = 40 mm·s−1, n = 2000 rpm, M = 80). Specifically, this parameter set yields a maximum material removal depth of 27.5 µm, a maximum removal rate is 5.501 µm·s−1, and a corresponding surface roughness Ra is 1.897 µm.
4. Conclusions
- (1)
- The study reveals that the material removal depth of the sample increases with the elevation in grinding force, whereas the surface roughness first decreases and then increases. As the feed speed rises, the material removal depth declines rapidly, with the rate of decrease slowing down significantly when exceeding 60 mm·s−1. In contrast, the surface roughness shows a consistent upward trend. An increase in the rotational speed enhances the material removal depth while gradually reducing surface roughness. Moreover, finer abrasives lead to a pronounced reduction in both material removal depth and surface roughness, highlighting their significant influence on surface quality.
- (2)
- Owing to the inherent adhesiveness of resin materials, the surface quality of the ground workpiece is impaired, and the material removal depth is reduced. The optimal process parameters were identified as F = 20 N, = 40 mm·s−1, n = 2000 rpm, and M = 80. Under these conditions, the maximum material removal depth is 27.5 µm, the maximum material removal depth rate is 5.501 µm·s−1, and the corresponding surface roughness Ra is 1.897 µm.
- (3)
- The maximum relative errors of the material removal depth rate and material removal depth regression models are both below 8%, and the maximum relative error of the surface roughness Ra predicted by the BP neural network model is less than 9.5%. These results indicate that the established models can reliably predict material removal depth rate, material removal depth, and surface roughness. Although the regression model for material removal depth exhibits slightly better accuracy than the BP neural network model, the maximum relative errors of both models remain below 10%, confirming their overall predictive reliability.
Author Contributions
Conceptualization, X.W. and H.Z.; methodology, D.S. and H.Z.; formal analysis, X.W. and W.Y.; validation, X.W. and W.Y.; investigation, D.S. and W.Y.; data curation, W.Y.; writing—original draft preparation, X.W.; writing—review and editing, D.S.; supervision, D.S. and H.Z. All authors have read and agreed to the published version of the manuscript.
Funding
This research was partially supported by the National Natural Science Foundation of China (No. 51975165).
Data Availability Statement
Data are contained within the article.
Acknowledgments
The authors would like to express special thanks to Haikui Liu for his assistance in providing the experimental site and suggesting experimental methods for this study.
Conflicts of Interest
Author D.S. was employed by the Weifang Ranyue Intelligent Technology Co., Ltd. The remaining authors declare that the research was conducted in the absence of any commercial or financial relationships that could be construed as a potential conflict of interest.
References
- Yang, G.Y.; Liu, Y.; Liu, L.; Xiong, W.; Deng, L.M.; Zhao, S.N. Mechanism and technology of laser adaptive cleaning for aircraft skin multilayer coatings of Airbus A320. J. Manuf. Process. 2025, 135, 230–239. [Google Scholar] [CrossRef]
- Kurc, K.; Burghardt, A.; Muszyńska, M.; Pietru, P.; Szybicki, D. Measurements of geometrical quantities and selection of parameters in the robotic grinding process of an aircraft engine. Electronics 2024, 13, 4077. [Google Scholar] [CrossRef]
- Cestino, E.; Catapano, J.; Galvano, F.; Felis, A.; Zuccala, S.; Martilla, V.; Sapienza, V.; Chesta, L. Effectiveness of nanotechnology treatments in composite aircraft applications. Appl. Sci. 2024, 14, 1721. [Google Scholar] [CrossRef]
- Sun, X.; Pan, R.; Xu, J.Y.; Zhang, S.Y.; Zhou, T.S.; Shi, Y.; Liu, W.J.; Chen, P.; Chen, S.J. Enhanced superhydrophobicity of acrylic polyurethane coatings by femtosecond laser ablation. Prog. Org. Coat. 2024, 197, 108874. [Google Scholar] [CrossRef]
- Yang, L.C.; Li, Y.; Huan, D.J.; Yang, Y.F.; Wang, J.X.; Zhu, C.L. An icephobic for aircraft anti-icing system. J. Mater. Sci. 2023, 58, 16322–16335. [Google Scholar] [CrossRef]
- Parten, C.; Subeshan, B.; Asmatulu, R. Highly conductive and durable nanocomposite hard coatings of carbon fiber reinforced thermoplastic composites against lightning strikes. Discov. Nano 2024, 19, 97. [Google Scholar] [CrossRef] [PubMed]
- Li, J.X.; Yang, J.J.; Liu, J.X.; Chen, H.; Duan, Y.F.; Pan, X.J. Research on laser cleaning technology for aircraft skin surface paint layer. Materials 2024, 17, 2414. [Google Scholar] [CrossRef]
- Selvan, T.R.; Raja, P.V.; Mangal, P.; Mohan, N.; Bhowmik, S. Recycling technology of epoxy glass fiber and epoxy carbon fiber composites used in aerospace vehicles. J. Compos. Mater. 2021, 55, 3281–3292. [Google Scholar] [CrossRef]
- Zhao, Y.Y.; Lu, W.Z.; Zhu, Y.S.; Zuo, D.W. Pretreatment of aircraft carbon fiber-reinforced plastic skin by plastic abrasive jet machining. J. Adhes. Sci. Technol. 2023, 37, 2378–2400. [Google Scholar] [CrossRef]
- Yang, L.C.; Li, Y.; Huan, D.J.; Zhu, C.L. An anti-icing coating with superhydrophobic and photothermal properties for aircraft icing protection system. Colloids Surf. A Physicochem. Eng. Asp. 2025, 709, 136150. [Google Scholar] [CrossRef]
- Membrives, C.Z.; Tamarit, P.; Fernandez, A.L.; Barreneche, C. Chemical procedures for paint removal in used thermoplastics for revalorization as a raw material in the automotive industry. Adv. Polym. Technol. 2025, 11, 8477994. [Google Scholar] [CrossRef]
- Yang, W.F.; Li, G.; Qian, Z.R.; Cao, Y.; Lin, D.H.; Li, S.L.; Zheng, X.; Zhu, D.H.; Xie, M.Y.; Yang, Y.K. Research on online monitoring of aircraft skin laser paint removal thickness using standard curve method and PCA-SVR based on LIBS. Anal. Methods 2024, 44, 2340–2348. [Google Scholar]
- Li, Y.H.; Li, J.Y.; Dong, H.; Zhang, W.; Jin, G.Y. Simulation and experimental study on continuous wave fiber laser removal of epoxy resin paint film on the surface of 6061 aluminum alloy. Photonics 2024, 11, 82. [Google Scholar] [CrossRef]
- Bodrova, I. Models of decision support for aircraft maintenance related to repainting process. Reliab. Stat. Transp. Commun. 2022, 410, 99–109. [Google Scholar]
- Arcari, A.; Anderson, R.M.; Hangarter, C.M.; Leez, E.B.; Policastro, S.A. Tensile properties of aircraft coating systems and applied strain modeling. Coatings 2024, 14, 91. [Google Scholar] [CrossRef]
- Hu, Y.; Li, Q.; Yang, W.F.; Li, S.L.; Tan, D.Q.; Tan, T.; Zhang, H. Influence of laser paint stripping on microstructure and wear performance of 2024-T3 aluminum alloy aircraft skin. Appl. Phys. A 2025, 131, 193. [Google Scholar] [CrossRef]
- Song, H.Y.; Ye, R.F.; Xie, M. Research on complex surface grinding path planning of grinding robot based on NX and Tecnomatix. Int. J. Adv. Manuf. Technol. 2024, 133, 1961–1971. [Google Scholar] [CrossRef]
- Li, R.Z.; Wang, Z.P.; Yan, J.H. Multi-objective optimization of the process parameters of a grinding robot using LSTM-MLP-NSGAII. Machines 2023, 11, 882. [Google Scholar] [CrossRef]
- Vladareanu, V.; Smarandache, F.; Vladareanu, L. Extension hybrid force-position robot control in higher dimensions. Appl. Mech. Mater. 2013, 2466, 260–269. [Google Scholar] [CrossRef]
- Chen, H.Q.; Yang, J.X.; Ding, H. Robotic compliant grinding of curved parts based on a designed active force-controlled end-effector with optimized series elastic component. Robot. Comput. Integr. Manuf. 2024, 86, 102646. [Google Scholar] [CrossRef]
- Zhang, H.Y.; Li, L.; Zhao, J.B.; Zhao, J.C.; Gong, Y.D. Theoretical investigation and implementation of nonlinear material removal depth strategy for robot automatic grinding aviation blade. J. Manuf. Process. 2022, 74, 441–455. [Google Scholar] [CrossRef]
- Xu, D.; Mo, H.J.; Zhong, Z.G.; Yin, L.R. Investigation of a parallel contact force robotic end-effector for thin-Walled parts grinding and deburring with uncertain position. Precis. Eng. 2025, 96, 587–599. [Google Scholar] [CrossRef]
- Senthilkumar, N.; Tamizharasan, T.; Gobikannan, S. Application of response surface methodology and firefly algorithm for optimizing multiple responses in turning AISI 1045 steel. Arab. J. Sci. Eng. 2014, 39, 8015–8030. [Google Scholar] [CrossRef]
- Xie, Y.H.; Chang, G.S.; Yang, J.X.; Zhao, M.Y.; Li, J. Process optimization of robotic polishing for mold steel based on response surface method. Machines 2025, 10, 283. [Google Scholar] [CrossRef]
- Yang, D.P.; Ding, S.G.; Pan, L.F.; Xu, Y. VSG-FC: A combined virtual sample generation and feature construction model for effective prediction of surface roughness in polishing processes. Micromachines 2025, 16, 622. [Google Scholar] [CrossRef]
- Shan, K.; Zhang, L.Y.; Tan, B.; Zhang, Y.S.; Li, W.H.; Li, X.H.; Wen, X.J. Prediction model for material removal rate of TC4 titanium alloy processed by vertical vibratory finishing. Coatings 2025, 15, 286. [Google Scholar] [CrossRef]
- Li, J.; Guan, Y.S.; Bi, H.; He, Z.Y.; Wu, W.Q.; Hu, H.; Li, D.C.; Wu, W.H.; Li, J.; Zhang, T. Predictive surface roughness model for robotic polishing considering initial surface quality. Int. J. Adv. Manuf. Technol. 2025, 137, 2729–2741. [Google Scholar] [CrossRef]
- Zheng, G.; Chen, K.Y.; Zhang, X.J.; Zhang, X. Theoretical modeling and experimental research on the depth of radial material removal for flexible grinding. Int. J. Adv. Manuf. Technol. 2021, 116, 3355–3365. [Google Scholar] [CrossRef]
- Adam, H.; Mateusz, H.; Marcin, L.; Jedrzej, B. The quality of surgical instrument surfaces machined with robotic belt grinding. Materials 2023, 16, 630. [Google Scholar] [CrossRef] [PubMed]
- Shi, D.Q.; Zeng, X.Y.W.; Wang, X.H.; Zhang, H.J. Parameter optimization and surface roughness prediction for the robotic adaptive hydraulic polishing of NAK80 mold steel. Processes 2025, 13, 991. [Google Scholar] [CrossRef]
- Zheng, Q.J.; Xiao, J.L.; Wang, C.; Liu, H.T.; Huang, T. A robotic polishing parameter optimization method considering time-varying wear. Int. J. Adv. Manuf. Technol. 2022, 121, 6723–6738. [Google Scholar] [CrossRef]
- Liu, B.T.; Zhu, G.Y.; Ding, P.J. The research progress of epoxy resin coating in building waterproof. Adv. Mater. Res. 2013, 233, 1779–1782. [Google Scholar] [CrossRef]
- Bucher, C. Metamodels of optimal quality for stochastic structural optimization. Probabilistic Eng. Mech. 2018, 54, 131–137. [Google Scholar] [CrossRef]
- Zhao, S.Y.; Chen, L.; Huang, Y.C. ADAS simulation result dataset processing based on improved BP neural network. Data 2024, 9, 11. [Google Scholar] [CrossRef]
- Abdullah, M.F.; Zulkifli, R.; Moria, H.; Najm, A.S.; Harun, Z.; Abdullah, S.; Ghopa, W.A.W.; Sulaiman, N.H. Assessment of TiO2 nanoconcentration and twin impingement jet of heat transfer enhancement—A statistical approach using response surface methodology. Energies 2021, 14, 595. [Google Scholar] [CrossRef]
- Ji, X.; Wang, Z.F.; Zhang, H.B.; Wang, X.F.; Huo, J.Y.; Zhang, T.H. Optimization design and characterization of slag cementitious composites containing carbide slag and desulfurized gypsum based on response surface methodology. J. Build. Eng. 2023, 77, 107441. [Google Scholar] [CrossRef]
- Chen, J.; Huang, S.J. Evaluation model of green supply chain cooperation credit based on BP neural network. Neural Comput. Appl. 2021, 33, 1007–1015. [Google Scholar] [CrossRef]
- Ji, X.; Zhang, H.H.; Han, S.Y. A merging approach for hole identification with the NMM and WOA-BP cooperative neural network in heat conduction problem. Eng. Anal. Bound. Elem. 2024, 169, 106042. [Google Scholar] [CrossRef]


Disclaimer/Publisher’s Note: The statements, opinions and data contained in all publications are solely those of the individual author(s) and contributor(s) and not of MDPI and/or the editor(s). MDPI and/or the editor(s) disclaim responsibility for any injury to people or property resulting from any ideas, methods, instructions or products referred to in the content. |
© 2025 by the authors. Licensee MDPI, Basel, Switzerland. This article is an open access article distributed under the terms and conditions of the Creative Commons Attribution (CC BY) license (https://creativecommons.org/licenses/by/4.0/).