Abstract
The emergence of mobile private networks (MPNs) has enabled tailored communication solutions for industries, enterprises, and specialized applications, fostering improved control, security, and flexibility. With the rapid advancements in software-defined radio (SDR) platforms, implementing MPNs using cost-effective and versatile hardware has become increasingly feasible. Analyzing the radio coverage of such networks is critical for optimizing performance, ensuring reliable connectivity, and addressing site-specific challenges in deployment. This paper investigates the radio coverage of a 4G MPN implemented using as radio front-end an SDR platform from the Universal Software Radio Peripheral (USRP) family and the srsRAN-4G open-source software suite. Using the HTZ Communication software as simulation tool and field-test measurements performed using an off-the-shelf mobile phone as user equipment (UE), an analysis is made to evaluate the accuracy of various propagation models in predicting network coverage, in several different frequency bands. The results provide valuable insights into the design and deployment of MPNs, highlighting the importance of accurate coverage estimation in achieving robust and efficient network operation.
1. Introduction
Together with the ever-increasing requirements regarding high speed and low latency connectivity, mobile data traffic is projected to reach 303 EB per month in 2030 [1]. Moreover, an estimated 5.5 billion people are online in 2024, representing 68 per cent of the global population [2].
Most of this traffic is carried out using the infrastructure of public mobile network operators. However, recently, the traditional method of deploying proprietary software and hardware for various layers of mobile communication networks has been challenged by the emergence of software-defined radio (SDR) platforms and open-source software suites. This shift enables the implementation of mobile private networks (MPNs) [3,4] across diverse sectors such as transportation, manufacturing, logistics, agriculture, and education. MPNs offer significant advantages over commercial cellular networks, including enhanced control, privacy, and flexibility.
1.1. Related Work
Several existing works are dedicated to different aspects concerning radio coverage in mobile networks. The authors of [5] propose an automation of the radio planning process of 5G networks in urban scenarios by developing a software solution capable of collecting data from a real map and extracting 3D terrain and buildings height information. In [6], the propagation mechanisms of 5G signals are examined, combined with experimental data obtained by installing 5G antennas in port scenarios, to analyze the 5G coverage within ports. A dataset consisting of simulated power levels in an environment for a given set of transmitter locations was used in [7] for performing experiments with various machine learning models, to estimate the power values for the given transmitter placement. The authors of [8] investigate NR coverage enhancement and perform a comprehensive analysis on the coverage enhancement solutions, performing link level simulations for the coverage enhancement solutions for the Physical Uplink Shared Channel (PUSCH).
Indoor coverage is also a topic which is addressed in several articles. For example, in [9], the influence of different types of antennas on the radio coverage inside and outside trains is investigated. Based on measurements using an actual Long-Term Evolution (LTE) network, a portable test transmitter and different configurations of antennas and receivers in the 2.4, 2.6 and 5.7 GHz frequency bands, the authors propose an initial model for the propagation incurred using a relay-based communication system for fourth generation (4G) network in railways. A framework for predicting indoor radio wave coverage in buildings is proposed in [10]. Physical and dielectric parameters of the construction elements were used as input to a 3D radio wave propagation ray-tracing model, to predict the received signal level at any location within the computational volume. In [11], based on the results of extensive ray-tracing simulations conducted in a typical office building for the 3.3–3.4 GHz frequency band, an optimal deployment of transmitters is presented, for meeting the requirement for the reference signal received power of the synchronization signal.
However, there are very few papers analyzing aspects regarding radio coverage in the case of mobile private networks. The authors of [12] developed an LTE network testbed using an SDR platform and evaluated an algorithm for predicting the quality of the link between the Evolved Node B (eNB) and the User Equipment (UE). An approach for maximizing cell coverage and capacity in a private LTE network by optimizing power allocation and resource blocks (RB) is proposed in [13]. The suggested method decomposes the cell into sub-cells and uses either a genetic algorithm, or a waterfilling based algorithm, for optimal resource distribution in each sub-cell. The objective of the study presented in [14] was to design a private 5G network which should cover an area of 35 km2, using a planning method depending on capacity and coverage at a carrier frequency of 2300 MHz and 40 MHz bandwidth to obtain the best number of gNodeBs. For the same area, in [15], a comparative study when using 4 × 4 Multiple Input Multiple Output (MIMO) and 8 × 8 MIMO antennas is performed, concluding that higher data rates, fewer necessary sites and better reference signal received power (RSRP) and SINR values are obtained for the 8 × 8 MIMO case.
1.2. Problem Formulation
An accurate radio coverage estimation for mobile private networks is critical for optimizing their performance, ensuring reliable connectivity, and addressing site-specific challenges in deployment. Therefore, the aim of the current paper is to identify optimum approaches for obtaining such estimations. For performing such an investigation, a 4G MPN was implemented, using as radio front-end an SDR platform from the Universal Software Radio Peripheral (USRP) family (Ettus Research Ltd., Austin, TX, USA) and the srsRAN-4G 23.11 open-source software suite. The performance of different propagation models in accurately estimating the radio coverage was evaluated using the HTZ Communication software as simulation tool, based also on field-test measurements performed using an off-the-shelf mobile phone as user equipment (UE), in several different frequency bands. The results obtained provide valuable insights into the design and deployment of MPNs. The research presented in the current paper represents a first step towards the creation of a framework for the optimization of propagation models in the context of MPN coverage estimation. We intend to carry on such investigations using different hardware setups for the MPN implementation and over different environments, in order to be able to extrapolate the results obtained to a wider category of scenarios.
1.3. Contributions and Organization
The current paper is an extension of our previous work, published in the volume of an international conference [16]. The key contributions of the paper can be summarized as follows:
- We reviewed the existing state-of-the-art concerning mobile private networks and their radio coverage.
- We implemented a 4G MPN using the USRP B210 SDR (Ettus Research Ltd., Austin, TX, USA) as radio front-end and an open-source software suite (srsRAN 4G 23.11) and extended its range using an external power amplifier.
- We estimated the radio coverage for the deployed network using the HTZ Communications 2024.3 radio network planning and optimization software [17] and different propagation models, both empirical and deterministic, for three different frequency bands (700 MHz, 1800 MHz, and 2600 MHz).
- We performed field measurements for each of the above-mentioned frequency ranges and compared them with the obtained estimations, as validation step.
- We discussed the obtained results and highlighted that the best correlation between the estimated and the measured coverage was obtained using the ITU-R 1225 propagation model.
The following sections of the paper are structured as follows. Section 2 presents the different propagation models which were used for obtaining estimations of the radio coverage of the implemented MPN. Details regarding the equipment used for deploying the mobile private network, the configuration parameters for the hardware and software components and the surroundings of the area where the measurement campaign was conducted are described in Section 3. The results obtained by means of estimating the radio coverage and comparing it with field-test measurements are included and commented on in Section 4. The paper is concluded in Section 5, where future research directions are also described.
2. Propagation Models Suitable for Radio Coverage Estimation in Case of Mobile Communication Networks
In this section, we selected seven propagation models suitable for providing radio coverage estimations in several different frequency bands standardized for 4G MPNs (700 MHz, 1800 MHz, 2600 MHz). For illustrating the most important aspects involved in their design, we included paragraphs detailing their typical application areas, advantages and drawbacks. All these propagation models are available in the HTZ Communications radio planning software, which was used for computing the coverage maps which will be presented in Section 4.
2.1. The ITU-R 1225 Propagation Model
The ITU-R 1225 propagation model [18] provides recommendations for evaluating technologies used for radio transmission in case of IMT-2000. It is designed to assess the performance of various radio transmission technologies across different environments. This model operates at frequencies commonly used for mobile communications, specifically within the IMT-2000 band, which includes the ranges of 1885–2025 MHz and 2110–2200 MHz.
The model incorporates several mathematical formulas to calculate key parameters such as path loss, signal strength, and coverage area. These calculations consider factors like distance, frequency, and environmental conditions. The ITU-R 1225 model is a hybrid, combining empirical data with theoretical analysis.
The ITU-R 1225 model has some limitations compared to other propagation models. For example, it may not be as accurate in highly urbanized areas with complex building structures or in environments with significant foliage. Compared to other propagation models, the ITU-R 1225 model’s hybrid nature makes it versatile and useful for a wide range of scenarios. However, this also means it may not be as specialized or precise as models tailored for specific environments or use cases.
2.2. The ITU-R P.528-3 Propagation Model
The ITU-R P.528-3 propagation model [19] is intended to estimate basic transmission loss for aeronautical and satellite communications. It functions within the frequency range of 125 MHz to 20 GHz. This model is derived from the IF77 model [20], which computes the median basic transmission loss and includes variations due to factors like precipitation, scintillation, gaseous absorption, multipath, long-term fading, and time percentages.
From a mathematical perspective, the model employs specific formulas to calculate transmission loss. These formulas consider the distance between the transmitter and receiver, the operating frequency, and environmental conditions. The model generates propagation curves that can be used to predict the service range for a desired signal at various time percentages.
The ITU-R P.528-3 model is especially beneficial for aeronautical and satellite communication links, which have distinct characteristics compared to terrestrial systems. It aids in conducting frequency sharing studies, which are essential given the current scarcity of frequency spectrum.
2.3. The ITU-R 2001-4 Propagation Model
The ITU-R P.2001-4 propagation model [21] is a flexible and all-encompassing model crafted for terrestrial propagation within the frequency range of 30 MHz to 50 GHz. This model excels in predicting signal behavior across a vast range of distances, from a few kilometers to several thousand kilometers. It integrates various propagation mechanisms, such as line-of-sight, diffraction, and ducting, making it adaptable to different environments and conditions.
The model employs several mathematical formulas to determine the basic transmission loss. One of the primary equations is the total path loss, which amalgamates free-space loss, diffraction loss, and troposcatter loss. Additionally, the model incorporates specific adjustments for varying terrains and atmospheric conditions, ensuring precise predictions across diverse scenarios.
In practical applications, the ITU-R P.2001-4 model is utilized in the planning and optimization of communication systems, including mobile networks and broadcasting services. It aids engineers in determining the optimal placement of antennas and predicting coverage areas. However, it has certain limitations compared to other models. For example, while it offers a broad range of applicability, it may not be as accurate for very short distances or highly specific environments as some specialized models.
In very complex urban environments, with dense and varied building structures, the model can introduce significant errors in calculating transmission losses. This is due to the difficulty of accurately modeling the effects of multiple reflections and diffractions that occur in such environments.
Although the model offers a wide range of applicability, it may not be as accurate for very specific environments or particular conditions compared to specialized models. For example, in environments with dense vegetation or areas with very varied terrain, other propagation models may provide more accurate results.
2.4. The ITU-R 1546-6 Propagation Model
The ITU-R 1546-6 model [22] is designed for point-to-area predictions in case of terrestrial services, considering the frequency range from 30 MHz to 4 GHz. This model is primarily used for predicting radio propagation over land, sea, and mixed paths up to 1000 km in length, with effective transmitting antenna heights less than 3000 m. The model is based on empirical data and provides field-strength curves as functions of distance, antenna height, frequency, and percentage time.
The mathematical calculations in this model involve interpolation and extrapolation from these field-strength curves, with corrections for terrain clearance and terminal clutter obstructions. The model is particularly useful for tropospheric radio circuits and is widely adopted due to its comprehensive approach to various environmental conditions.
Compared to other propagation models, ITU-R 1546-6 is versatile and can be applied to a broad range of scenarios. However, it may not be as specialized or precise as models tailored for specific environments or use cases. For example, it might not be as accurate in highly urbanized areas with complex building structures or in environments with significant foliage.
2.5. The ITU-R 525/526-11 Propagation Model
The ITU-R 525/526-11 radio propagation model [23], also known as the diffraction model, is designed to evaluate the effect of diffraction on the received field strength. This model is applicable to different obstacle types and various path geometries, including a spherical earth surface or irregular terrain with different kinds of obstacles. It operates across a wide range of frequencies, making it versatile for various radiocommunication services.
The model uses several mathematical formulas to calculate field strengths over diffraction paths. These calculations consider factors such as the angle of diffraction, radius of curvature, and height of obstacles. The key formula involves Fresnel ellipsoids, which subdivide the space between two points into a family of ellipsoids, helping to evaluate the geometrical parameters situated in the vertical plane of the path.
In terms of usage, the ITU-R 525/526-11 propagation model is employed to provide engineering information for the calculation of field strengths over diffraction paths. It is particularly useful in scenarios where the transmission path includes obstacles that cause diffraction. However, it has some limitations compared to other propagation models. For instance, it may not be as accurate in highly urbanized areas with complex building structures or in environments with significant foliage.
Compared to other propagation models, the ITU-R 525/526-11 propagation model focuses on diffraction, making it suitable for certain scenarios, but it may not be as versatile as models that combine empirical data. The ITU-R 525/526-11 propagation model, also known as the diffraction model, uses several mathematical formulas to calculate the field strength over diffraction paths. The key formula involves Fresnel ellipsoids and Fresnel zones. These ellipsoids subdivide the space between two points into a family of ellipsoids, helping to evaluate the geometrical parameters situated in the vertical plane of the path.
2.6. The M.2412 UMa Propagation Model
The M.2412 UMa (Urban Macro) propagation model [24] is designed for evaluating radio interface for IMT-2020 technologies, focusing on urban macrocell environments. This model is applicable for frequencies below and above 6 GHz, making it versatile for various 5G applications. The general characteristics include its ability to predict path loss in urban areas with high buildings and dense infrastructure.
The model uses different equations for frequencies below and above 6 GHz. For frequencies below 6 GHz, the path loss is calculated using Equation (1).
where (PL) is the path loss in dB, (d) is the distance in meters, and (f) is the frequency in GHz. For frequencies above 6 GHz, the model incorporates additional factors to account for higher frequency propagation characteristics.
The M.2412 UMa model is a deterministic approach, utilizing specific environmental parameters to forecast signal behavior. It is particularly beneficial for the planning and optimization of urban macrocell networks, delivering precise predictions for signal coverage and quality.
When compared to other propagation models, the M.2412 UMa model provides more accurate predictions for urban settings, especially at higher frequencies. However, it may face limitations in rural or suburban areas where different propagation characteristics are prevalent.
In conclusion, the M.2412 UMa propagation model is a comprehensive tool for assessing and planning urban macrocell networks. It supports a broad range of frequencies and offers detailed path loss predictions based on specific environmental factors. Its application is crucial for optimizing 5G networks in densely populated urban areas.
2.7. The ITU-R 452-14 Propagation Model
The ITU-R 452-14 model [25] is employed to predict interference between terrestrial stations operating at frequencies above 0.1 GHz. This model is particularly beneficial for evaluating microwave interference and is well-regarded for its comprehensive consideration of various environmental factors. It operates effectively within the frequency range of 0.1 GHz to several GHz, making it suitable for a wide array of radio communication services.
The model combines empirical data with mathematical computations to provide accurate predictions. The primary mathematical formulas involve interpolation and extrapolation from field-strength curves, with adjustments for terrain clearance and terminal clutter obstructions. These calculations help determine path loss and field strength over different distances and environmental conditions.
ITU-R 452-14 is a tropospheric propagation model, meaning it takes into account the effects of the troposphere on radio wave propagation. It is particularly useful for long-distance communication links and can accommodate various types of terrain and obstacles. However, it may not be as precise in highly urbanized areas with complex building structures or in environments with significant foliage.
Compared to other propagation models like ITU-R 1546-6, which is used for point-to-area predictions, ITU-R 452-14 is more specialized for point-to-point interference evaluation. It provides a more detailed analysis of interference effects and is better suited for scenarios where precise interference prediction is crucial.
In summary, the ITU-R 452-14 propagation model is a dependable tool for predicting microwave interference, offering detailed and accurate predictions across a wide range of frequencies and environmental conditions.
2.8. Conclusion
To summarize, the most important aspects regarding the different propagation models presented in this section are included in Table 1. It can be noticed that all the selected models cover the three frequency bands that are targeted in the simulations and measurements described in the paper (700 MHz, 1800 MHz, and 2600 MHz) and are suitable for performing radio coverage estimations for the implemented MPN, which will be detailed in Section 3.

Table 1.
Propagation models used for estimating the coverage of the analyzed mobile private network.
3. Details Regarding the Implementation of a Mobile Private Network Using SDR Platforms
This section gives details regarding the way in which the mobile private network, which will be analyzed in the subsequent sections, was implemented. In order to have the flexibility offered by the software-defined radio concept, one SDR platform from the USRP family (USRP B210) [26] was used as hardware, while the software environment was based on the open-source srsRAN-4G suite [27].
Figure 1 shows the block diagram for the MPN which was deployed. The core and radio access parts of the MPN were implemented using the srsepc and srsenb software modules from the srsRAN 4G open-source software suite, running on a host PC using as operating system Ubuntu 20.04. The RF frontend of the MPN was represented by the USRP B210 platform. The connection between the host PC and the RF frontend was made by means of a USB 3.0 connection, providing enough throughput for a 10 MHz instantaneous RF bandwidth (50 Physical Resource Blocks (PRBs)).
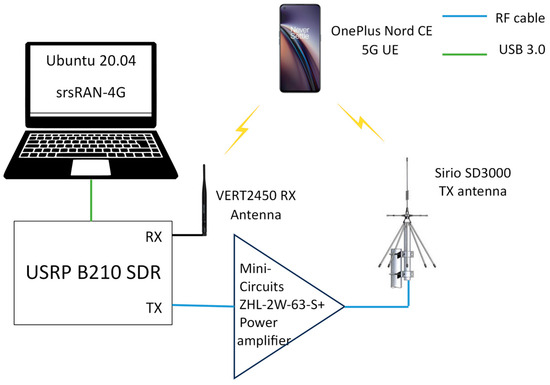
Figure 1.
Block diagram of the deployed mobile private network.
To extend the network’s coverage by using a higher transmit power, a dedicated power amplifier (Mini-Circuits ZHL-2W-63-S+ [28], Mini-Circuits, Farmingdale, NY, USA) was placed between the transmit port of the USRP platform and the transmit antenna. A Sirio SD-3000 wideband discone antenna [29] (Sirio Antenne, Bertinoro, Italy) was used for transmission, while an Ettus Research VERT2450 dipole antenna [30] (Ettus Research, Austin, TX, USA) served as receive antenna. A commercial OnePlus Nord CE 5G mobile phone (OnePlus Science and Technology Park, Guangzhou, China) served as User Equipment (UE). SysmoISIM-SJA2 programmable SIM cards [31] (Sysmocom, Berlin, Germany) were used for registering the UE into the implemented MPN.
For performing the experiments, the MPN was installed in Constanta, Romania, in the Nautical Base from the Maritime University of Constanta. This area was selected as one of the goals of this research was to analyze the radio coverage of the mobile private network in the presence of several containers, similar to those used in maritime transport, which aligns with the topic of the Solid-B5G project [32] that financed this paper. The coordinates of the MPN transmit antenna are latitude 44°13’00.21” N and longitude 28°37’07.29” E. Figure 2 provides a satellite view of the region where the MPN was installed and where the field measurements were performed, captured using Google Earth Pro, along with a picture of the surroundings.
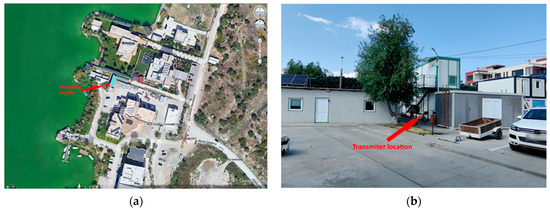
Figure 2.
Images of the region where the mobile private network was deployed: (a) satellite view; (b) picture of the surroundings.
In order to obtain the results detailed in Section 4, a methodology including two different steps was used. The first one involves the HTZ Communications 2024.3 software [17], which offers advanced radio network planning and optimization capabilities, and was used to estimate the radio coverage for the implemented MPN. As the map of the Constanta Maritime University’s Nautical Base area was not including in the building clutter some of the containers located next to the MPN location, they were manually added in the map. The resolution of the map was 1 m. In the second step, to be able to validate the above-mentioned estimations, field measurements were performed using a commercial-off-the-shelf (COTS) mobile terminal as UE. The G-MoN Pro 1.8.6 Android application [33] was used for capturing log files containing information regarding the received signal level. A comparison between the measured signal level and the one extracted from the different coverage estimations was performed, the obtained results being detailed and commented on in Section 4.
In should be mentioned that the approach proposed and described above offers significant advantages, but also several drawbacks. The advantages are related to the fact that in the implemented MPN, knowledge and control of the most important network parameters are straightforward, facilitating the testing procedure. As drawbacks, considering the fact that the SDR platform used as RF front-end is not a calibrated device, the RF output power has to be verified using a reference equipment. The value that was considered for performing the coverage estimations (−5 dBm) was measured using a spectrum analyzer. Moreover, although a power amplifier was included in the proposed experimental setup, the transmitting power level that was obtained is far below the one used in commercial mobile networks. As such, the area that can be covered by the implemented MPN is not very large and the route that could be followed for performing the measurements was only covering a limited part of the coverage footprint. Regarding the commercial mobile phones that were used for performing the measurements, we tested several different devices and obtained quite similar results, deciding in the end to mention the device that presented the most stable behavior. Although the results discussed in the current paper are based on a single measurement route for each of the analyzed frequency bands, we intend in the future to conduct multiple measurements, in order to increase the relevance of the obtained results.
4. Results and Discussion
In this section, radio coverage estimations performed using as software the HTZ Communications solution are presented and compared with the field measurements. Seven different propagation models, described in Section 2, were used to estimate the mobile private network’s radio coverage. For the coverage maps which were obtained, we considered a receiver antenna height of 1.2 m, a signal reception threshold of −127 dBm, and we calculated for a range of 300 m around the transmitter location. The MPN was configured to transmit in three different frequency bands, corresponding to LTE Bands 3 (1800 MHz), 7 (2600 MHz) and 28 (700 MHz).
Table 2 details the parameters used for configuring the radio access part of the MPN which was implemented.
Table 2.
Configuration parameters for the implemented mobile private network.
4.1. Coverage Analysis for the 2600 MHz Frequency Band
Figure 3 presents the coverage of the implemented MPN, estimated for the 2600 MHz frequency band (LTE Band 7, Downlink EARFCN 3350), using the seven propagation models described in Section 2. The captures are obtained from the HTZ Communications radio planning software, which was used for calculating the losses depending on the characteristics of the terrain where the MPN was installed. It can be noticed that the most optimistic coverages, indicated by the most extended area for which RSRP values over the threshold of −127 dBm are estimated, are obtained for the ITU-R 1225, ITU-R 528-3 and ITU-R 1546-6 propagation models. The most pessimistic of the seven models, estimating the smallest coverage footprint, is the M.2412 UMa propagation model.
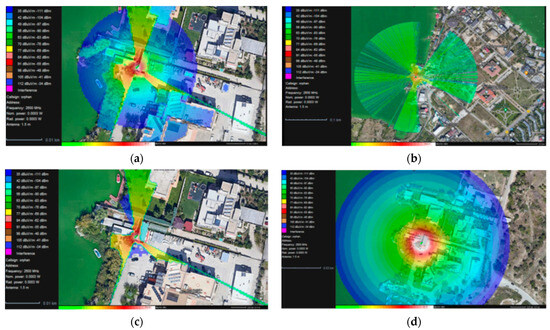
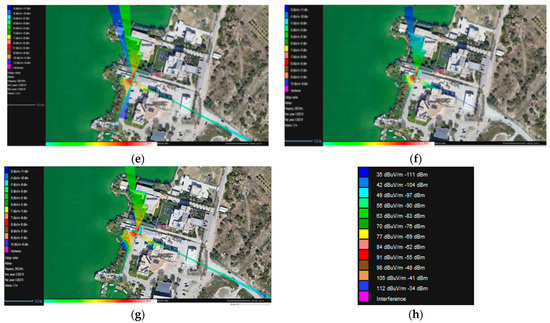
Figure 3.
Estimated coverage for the MPN on the 2600 MHz frequency using as propagation model: (a) ITU-R 1225; (b) ITU-R 528-3; (c) ITU-R P.2001-4; (d) ITU-R 1546-6; (e) ITU-R 525/526-11; (f) M.2412 UMa; (g) ITU-R 452-14. Subfigure (h) represents a detailed legend of the colors corresponding to the different received signal levels.
To validate the estimations obtained from the HTZ Communications program, field test measurements were also conducted around the location where the MPN was installed. As previously mentioned, the measurements were made using, as UE, a COTS mobile phone. The G-Mon Pro 1.8.6 Android application, running on the mobile phone, allowed the recording of a log file, containing network statistics including the RSRP value which at a refresh interval of 1 s. Figure 4 shows a Google Earth Pro capture of the route which was followed for performing these measurements. The different colors with which the dots indicating the UE locations are represented indicate different ranges of the received RSRP at the UE.
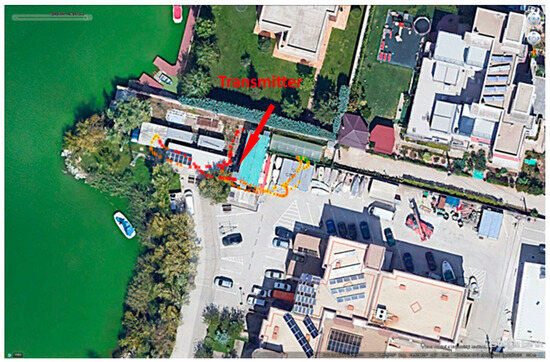
Figure 4.
Route used for conducting measurements on the 2600 MHz frequency band, visualized in Google Earth Pro. The different color dots represent different received signal levels, obtained along the route.
The obtained measurement data was imported in the HTZ Communications software, which has an option of graphically representing the correlation between the coverage estimated using a certain propagation model and the experimental data. Figure 5 shows these correlation results, for the route described in Figure 4. The X axis corresponds to the route that was followed, while the Y axis represents the RPSP value. The green line shows the theoretically estimated RSRP, which corresponds to each of the seven propagation models, while the yellow graphic illustrates the RSRP measured in the field, following the above pictured route.
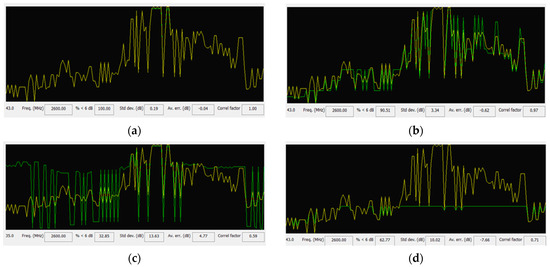
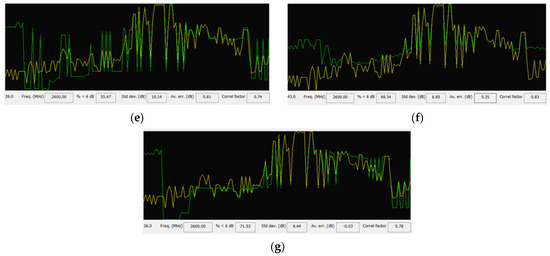
Figure 5.
Correlation between the measurements (yellow) and the estimation (green) for the 2600 MHz frequency band, using as propagation model: (a) ITU-R 1225; (b) ITU-R 528-3; (c) ITU-R P.2001-4; (d) ITU-R 1546-6; (e) ITU-R 525/526-11; (f) M.2412 UMa; (g) ITU-R 452-14.
From the obtained graphical representation, it is clearly observed that the models that were producing the best estimates, when compared to the experimental field data, are the ITU-R 1225 and ITU-R 528-3 propagation models.
Below each of these correlation graphics, a set of average performance metrics are available, in order to allow an objective evaluation regarding the performance of each of the analyzed propagation models. These metrics include:
- The percentage from the measurement route for which the difference between the measured and the estimated RSRP was of less than 6 dB (in %);
- The standard deviation (in dB);
- The average error (in dB);
- The correlation factor (ranging from 0 to 1).
Table 3 presents the average performance values for each of the previously mentioned metrics for all the seven propagation models.
Table 3.
Performance of the different propagation models used at the 2600 MHz frequency band.
The percentage < 6 dB (%) indicates for what percentage of the path that was used for performing the measurements, the estimated data has a difference of less than 6 dB from the physical measurements. The conclusion is as follows, namely, the higher this percentage, the more accurate the simulation is in terms of signal level. This fact is a very good and strong indicator of the accuracy and validity of the simulation. When 100% of the simulated data has a difference of less than 6 dB from the actual measurements, it shows that the simulation reproduces the measured data with great accuracy. This result suggests that the propagation model used in the simulation can accurately reflect the ground conditions and predict the correct values compared to the actual measurements. In other words, a result of < 6 dB (%) = 100 indicates an excellent concordance between the simulated and measured data, which shows that the simulation is reliable and accurate in reproducing the propagation medium. This shows that the simulation came out in line with expectations and can be considered fair and accurate.
Standard deviation (dB) represents the standard deviation of errors between measured and simulated values. The lower this value, the lower the errors and the more accurate the simulation. Standard deviation is a measure of the dispersion or variability of data in a set. In other words, the smaller the standard deviation, the more consistent and closer the differences are to their average. In most cases, when the standard deviation is small, this indicates a greater concordance between the simulated and measured data, showing that the simulation is consistent with reality.
A small value for the average error in decibels (dB) is a positive sign for the accuracy of the simulation. A negative value for this metric indicates that the estimated data is generally lower than the measured data, whilst a positive value indicates that the estimated data is on average higher than the experimental data. A small discrepancy between the estimations and the measurements can be attributed to factors such as measurement errors or variability in field conditions, but it is not likely to significantly affect the validity of the simulation.
A correlation factor of 1 shows a perfect correlation between the simulated and measured data. The closer this factor is to 1, the greater the concordance between the real and simulated data. Factor correlation shows us how close the relationship between simulated and measured data is. A correlation factor of 1.00 suggests a perfect correlation between the two data sets, implying that they are fully aligned or match perfectly. This implies that estimated data fits perfectly with the real data, thus indicating that the simulation is accurate, and that the propagation model used in HTZ was able to accurately reproduce the ground conditions.
All the metrics included in Table 3 lead to the conclusion that the model leading to the best results is the ITU-R 1225 model, which led to an estimation which matched the measured data almost perfectly, with a mean error of only −0.04 dB and the maximum value of 1 for the correlation factor. Strong performance can also be noticed in the case of the ITU-R 528-3 model, which has a mean error of −0.62 dB and a correlation factor of 0.97. On the other hand, the models for which the weakest results were obtained were the ITU-R 1564-6 model, exhibiting the highest mean error (−7.66 dB), and the ITU-R 2001-4, having the lowest correlation factor (0.59), and the highest standard deviation (13.63 dB).
4.2. Coverage Analysis for the 1800 MHz Frequency Band
For achieving a more complete analysis of the radio coverage in different frequency ranges, the radio parameters of the implemented MPN were modified to transmit in the 1800 MHz frequency band (LTE Band 3, Downlink EARFCN 1575). Figure 6 presents the radio coverage maps of the MPN for the 1800 MHz frequency band, estimated using the same seven propagation models.
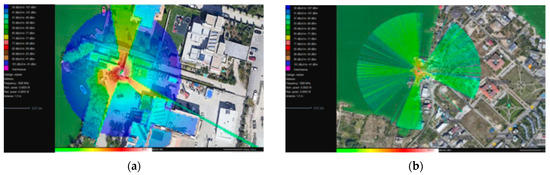
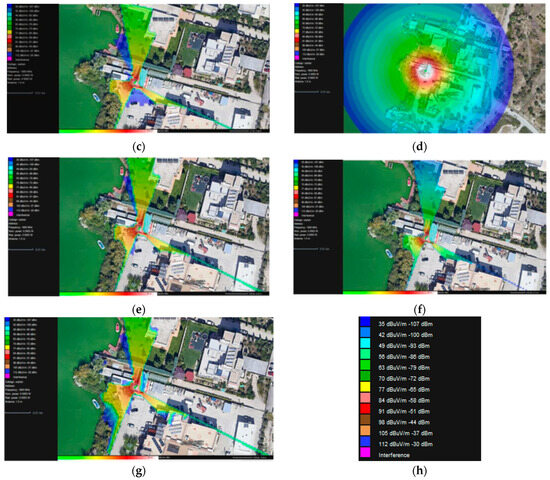
Figure 6.
Estimated coverage for the MPN on the 1800 MHz frequency using as propagation model: (a) ITU-R 1225; (b) ITU-R 528-3; (c) ITU-R P.2001-4; (d) ITU-R 1546-6; (e) ITU-R 525/526-11; (f) M.2412 UMa; (g) ITU-R 452-14. Subfigure (h) represents a detailed legend of the colors corresponding to the different received signal levels.
The most optimistic coverage was achieved for the ITU-R 1546-6 model, which indicated for the RSRP a value above the threshold for most of the entire analyzed area. Optimistic estimations are also obtained for the ITU-R 528-3 and ITU-R 1225 propagation models. On the other hand, pessimistic estimations were obtained for the other four propagation models. The smallest coverage footprint for the 1800 MHz frequency band is obtained for the M.2412 UMa propagation model.
Figure 7 details the correlation between the measurement data and the estimations obtained using the different propagation models detailed in Section 2. Table 4 presents the average performance values for each of the previously mentioned metrics for all seven of the propagation models.
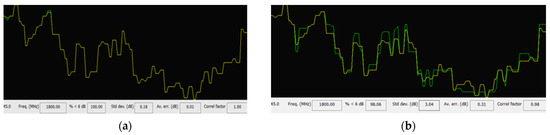
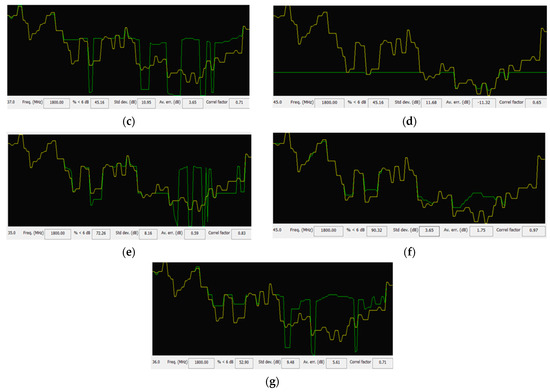
Figure 7.
Correlation between the measurements (yellow) and the estimation (green) for the 1800 MHz frequency band, using as propagation model: (a) ITU-R 1225; (b) ITU-R 528-3; (c) ITU-R P.2001-4; (d) ITU-R 1546-6; (e) ITU-R 525/526-11; (f) M.2412 UMa; (g) ITU-R 452-14.
Table 4.
Performance of the different propagation models used for the 1800 MHz frequency band.
After comparing the measurement data with the estimations obtained using the seven different propagation models, it was noticed that the highest performance was achieved at the ITU-R 1225 propagation model, with a value of <6 dB (%) = 100. This result is similar to the one obtained for the 2600 MHz frequency band, showing an almost perfect correlation between the simulated data and those measured in the field. Analyzing the data for each model, taking into account all the specified parameters and the order of the models according to their overall performance, from best to worst, is the ITU-R 1225 model, the ITU-R 528-3 model, the M.2412 UMa model, the ITU-R 452-14 model, the ITU-R 525/526-11 model, the ITU-R 2001-4 model and the ITU-R 1546-6 model.
This order reflects the overall performance of each model in simulations performed at the frequency of 1800 MHz, and all relevant parameters have been taken into account. It is also useful to notice that all of the models exhibit positive values for the average error, except for the ITU-R 1546-6 propagation model. This indicates that most of the models are more optimistic compared to reality, except for the ITU-R 1546-6 propagation model, who predicted coverage values lower on average with 11.32 dB compared to the measured data.
4.3. Coverage Analysis for the 700 MHz Frequency Band
The third frequency band for which the coverage analysis was performed is also corresponding to the lowest frequency value, 700 MHz, the radio parameters of the implemented MPN being modified to LTE Band 28, Downlink EARFCN 9435. As the frequency is the lowest one, the widest coverage was expected in this case, considering that the free space propagation loss decreases with the square of the wavelength of the radio waves. Figure 8 presents the radio coverage maps of the mobile private network in case of the 700 MHz frequency band, estimated using the same seven propagation models.
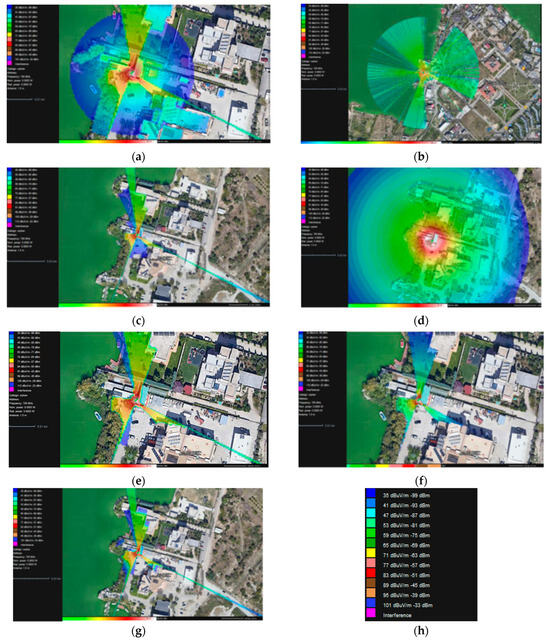
Figure 8.
Estimated coverage for the MPN on the 700 MHz frequency using as propagation model: (a) ITU-R 1225; (b) ITU-R 528-3; (c) ITU-R P.2001-4; (d) ITU-R 1546-6; (e) ITU-R 525/526-11; (f) M.2412 UMa; (g) ITU-R 452-14. Subfigure (h) represents a detailed legend of the colors corresponding to the different received signal levels.
Consistent with the observations for the 1800 MHz and 2600 MHz frequency bands, the most optimistic estimate was achieved for the ITU-R 1546-6 propagation model, followed by the ITU-R 1225 and the ITU-R 528-3 propagation models. From the other four propagation models, the smallest coverage in case of the 700 MHz frequency band is obtained for the M.2412 UMa model.
Figure 9 details the correlation between the measurement data and the estimations obtained using the different propagation models detailed in Section 2, for the same frequency band. Table 5 presents the average performance values for each of the previously mentioned metrics for all the seven propagation models.
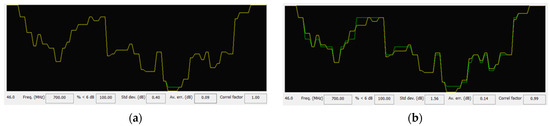
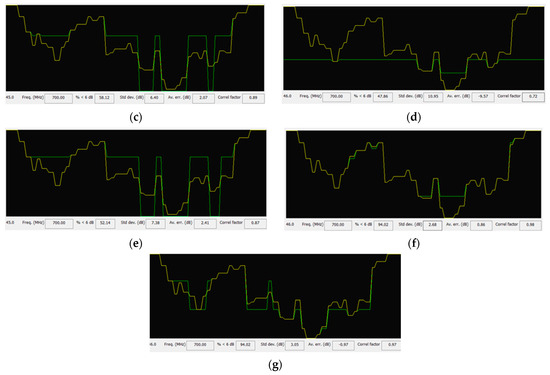
Figure 9.
Correlation between the measurements (yellow) and the estimation (green) for the 700 MHz frequency band, using as propagation model: (a) ITU-R 1225; (b) ITU-R 528-3; (c) ITU-R P.2001-4; (d) ITU-R 1546-6; (e) ITU-R 525/526-11; (f) M.2412 UMa; (g) ITU-R 452-14.
Table 5.
Performance of the different propagation models used for the 700 MHz frequency band.
Based on this analysis, the performance of the different propagation models was evaluated as follows. The ITU-R 1225 model obtained the best results at all the analyzed criteria: < 6 dB (%) = 100, low standard deviation (0.40 dB), low average error (0.09 dB) and a perfect correlation factor (1.00). The excellent performance on all criteria shows an accuracy and a very good correlation between the simulated data and the real data. The ITU-R 528-3 also achieved a percentage of < 6 dB (%) of 100, but the standard deviation and average errors are higher than those of the ITU-R 1225. However, the correlation factor of 0.99 shows a good correlation between the simulated and real data, which places it in second place in the ranking. The M.2412 UMa achieved a high percentage of < 6 dB (%) (94.02%) and a low standard deviation and average error. The correlation factor of 0.98 indicates a very good correlation between simulated and real data, which ranks it third in the ranking. The ITU-R 452-14 model performed well at < 6 dB (%) and standard deviation, but the average negative errors may indicate a tendency to underestimate the values. However, the correlation factor of 0.97 indicates a significant correlation between the simulated and actual data. The ITU-R 525/526-11 achieved an acceptable < 6 dB (%) and standard deviation, but the average error and the correlation factor are weaker than those of previous models. The ITU-R 2001-4 model achieved a lower < 6 dB (%) and standard deviation than subsequent models, but the average error and the correlation factor are worse. The ITU-R 1546-6 model achieved similar results to the ITU-R 2001-4 model but ranks last due to its relatively lower correlation factor performance.
5. Conclusions and Future Work
The radio coverage of an LTE mobile private network, implemented using software defined radio platforms, is analyzed in the current paper, based on estimations performed using the HTZ Communications radio planning software environment and field measurements obtained using a commercial mobile phone as user equipment. Seven different radio propagation models (ITU-R 1225, ITU-R 528-3, ITU-R 2001-4, ITU-R 1546-6, ITU-R 525/526-11, M.2412 UMa and ITU-R 452-14) were used for calculating the estimated radio coverage for three different LTE frequency bands (Band 3 (1800 MHz), Band 7 (2600 MHz) and Band 28 (700 MHz)) to estimate the coverage of the MPN. The analysis included the evaluation of the correlation between the estimated data and the measured data, using as metrics the percentage from the measurement path for which a difference of less than 6 dB was obtained between the estimated data and the measured data, the standard deviation, the average error and the correlation factor. The results have shown that the ITU-R 1225 model achieved the best results for all the three different frequency bands, having an almost perfect correlation with the real data, and low values for the standard deviation and average error. The ITU-R 528-3 also achieved very good performance, being placed second in the propagation model ranking. The model whose estimations were the furthest away from the measured data was the ITU-R 1546-6 model. As such, we concluded that the ITU-R 1225 model is the most accurate for estimating radio coverage in the studied context, providing high accuracy and excellent correlation with the measured data. This conclusion has important implications for the planning and optimization of mobile private networks, helping to more accurately estimate network coverage and improve network performance. Regarding future research directions, we intend to extend the area over which the measurements are performed, to increase their relevance. As the results obtained are specific to the analyzed area, we intend in the future to extend the analysis to other, different environments. Accordingly, a framework for the optimization of propagation models in the context of MPN coverage estimation could be created, in order to extrapolate the results obtained to a wider category of scenarios. Another future direction is to implement 5G MPNs using open-source software suites and SDR platforms and analyze their radio coverage.
Author Contributions
Conceptualization, A.M. and M.-C.V.; methodology, A.M. and V.-S.H.; software, V.-S.H.; validation, A.M., M.-C.V. and C.Z.; formal analysis, M.-G.G. and V.-S.H.; investigation, V.-S.H. and M.-G.G.; resources, M.-G.G.; data curation, V.-S.H. and A.M.; writing—original draft preparation, V.-S.H., M.-G.G., A.M. and R.-O.P.; writing—review and editing, A.M. and R.-O.P.; visualization, V.-S.H. and A.M.; supervision, M.-C.V. and C.Z.; project administration, A.M. and M.-C.V.; funding acquisition, M.-C.V. and C.Z. All authors have read and agreed to the published version of the manuscript.
Funding
This work has been partially supported by the NO Grants 2014–2021 under Project contract no. 42/2021, RO-NO-2019-0499—“A Massive MIMO Enabled IoT Platform with Networking Slicing for Beyond 5G IoV/V2X and Maritime Services”—SOLID-B5G, partially supported by a grant of the Ministry of Research, Innovation and Digitization, CCCDI—UEFISCDI, project number PN-1V-P7-7. l-PED-2024-0741, within PNCDI IV and partially supported by Vodafone Innovation Hub at National University of Science and Technology POLITEHNICA Bucharest.
Institutional Review Board Statement
Not applicable.
Informed Consent Statement
Not applicable.
Data Availability Statement
The data that used for the research included in the current paper is twofold. Simulations were performed using various propagation models using the HTZ Communications software (commercial software) and various measurements of the radio coverage using freely available software tools (G-Mon Pro Android application were also conducted. An archive with all the measurements is included as a minimal dataset, as the formats are readable using freely available software, as Supplementary Material File to the paper. Regarding the projects which were created and used in the HTZ communications software, as the software is not freely available, anyone interested in such details can contact the authors, who will provide all the necessary information and data.
Acknowledgments
The authors of this paper express their gratitude to Razvan Tamas (from Maritime University of Constanta) for his support which allowed them to perform the measurements in the premises of Nautical Base of the Maritime University of Constanta.
Conflicts of Interest
Author Ciprian Zamfirescu was employed by the company Vodafone Romania. The remaining authors declare that the research was conducted in the absence of any commercial or financial relationships that could be construed as a potential conflict of interest.
Abbreviations
The following abbreviations are used in this manuscript:
| COTS | Commercial Off-The-Shelf |
| EARFCN | E-UTRA Absolute Radio Frequency Channel Number |
| eNB | Evolved Node B |
| ITU | International Telecommunication Union |
| LTE | Long-Term Evolution |
| MIMO | Multiple Input Multiple Output |
| MPN | Mobile Private Network |
| NR | New Radio |
| PRBs | Physical Resource Blocks |
| RB | Resource Block |
| RSRP | Reference Signal Received Power |
| SDR | Software-Defined Radio |
| UE | User Equipment |
| PUSCH | Physical Uplink Shared Channel |
| USRP | Universal Software Radio Peripheral |
References
- Ericsson Mobile Data Traffic Outlook. Available online: https://www.ericsson.com/en/reports-and-papers/mobility-report/dataforecasts/mobile-traffic-forecast (accessed on 1 September 2025).
- International Telecommunication Union (ITU) Facts and Figures 2024. Available online: https://www.itu.int/hub/publication/D-IND-ICT_MDD-2024-4/ (accessed on 1 September 2025).
- Eswaran, S.; Honnavalli, P. Private 5G networks: A survey on enabling technologies, deployment models, use cases and research directions. Telecommun. Syst. 2023, 82, 3–26. [Google Scholar] [CrossRef] [PubMed]
- A Survey on the Past, Present, and Future of Private Networks: Device Ecosystem, Use Cases, Architecture, Spectrum, and Deployment. Available online: https://ssrn.com/abstract=4895203 (accessed on 1 September 2025).
- Akhpashev, R.V.; Drozdova, V.G. The Realistic 5G New Radio Coverage Analysis for Urban Area. In Proceedings of the 2022 Ural-Siberian Conference on Biomedical Engineering, Radioelectronics and Information Technology (USBEREIT), Yekaterinburg, Russia, 19–21 September 2022; pp. 145–147. [Google Scholar] [CrossRef]
- Hua, D.; Zhou, K.; Ou, J.; Li, F. 5G Signal Coverage Analysis in Port Container Stacking Scenario. In Proceedings of the 2023 IEEE 11th Joint International Information Technology and Artificial Intelligence Conference (ITAIC), Chongqing, China, 8–10 December 2023; pp. 1434–1438. [Google Scholar] [CrossRef]
- Mohammadjafari, S.; Roginsky, S.; Kavurmacioglu, E.; Cevik, M.; Ethier, J.; Bener, A.B. Machine Learning-Based Radio Coverage Prediction in Urban Environments. IEEE Trans. Netw. Serv. Manag. 2020, 17, 2117–2130. [Google Scholar] [CrossRef]
- Li, N.; Yin, H.; Zhu, J.; Guo, J.; She, X. Coverage Enhancement for 5G NR Networks: Solutions, Specification Impact and Performance Analysis. In Proceedings of the 2021 7th International Conference on Computer and Communications (ICCC), Chengdu, China, 10–13 December 2021; pp. 2244–2248. [Google Scholar] [CrossRef]
- Zhang, L.; Rodríguez-Piñeiro, J.; Fernández, J.; García-Naya, J.A.; Matolak, D.W.; Castedo, L. Propagation modeling for outdoor-to-indoor and indoor-to-indoor wireless links in high-speed train. Measurement 2017, 110, 43–52. [Google Scholar] [CrossRef]
- Louro, J.S.; Rui Fernandes, T.; Rodrigues, H.; Caldeirinha, R.F.S. 3D Indoor Radio Coverage for 5G Planning: A Framework of Combining BIM with Ray-tracing. In Proceedings of the 2020 12th International Symposium on Communication Systems, Networks and Digital Signal Processing (CSNDSP), Porto, Portugal, 20–22 July 2020; pp. 1–5. [Google Scholar] [CrossRef]
- Guo, X.; Guan, K.; He, D.; Yun, X.; Wang, X. Ray-tracing based 5G Coverage Analysis and Capacity Evaluation in an Indoor Hotspot Scenario. In Proceedings of the 2022 IEEE 5th International Conference on Electronic Information and Communication Technology (ICEICT), Hefei, China, 21–23 August 2022; pp. 464–469. [Google Scholar] [CrossRef]
- Feitosa, W.D.O.; Ruan, A.D.S.; Monteiro, V.F.; Cavalcanti, F.R.P. RSRP Prediction on LTE Network Testbed Using a Software Defined Radio (SDR) Platform. In Proceedings of the XL Simpósio Brasileiro de Telecomunicações e Processamento de Sinais (SBrT2022), Santa Rita do Sapucai, Brazil, 29 August–1 September 2022. [Google Scholar]
- Kalakech, A.; Bakir, M.; Youssef, R. Coverage and Cell Capacity optimization in Private LTE network based on Position and Expected Channel Knowledge. In Proceedings of the 2023 International Conference on Computer and Applications (ICCA), Cairo, Egypt, 28–30 November 2023; pp. 1–6. [Google Scholar] [CrossRef]
- Wulandari, A.; Hasan, M.; Hikmaturokhman, A. Private 5G Network Capacity and Coverage Deployment for Vertical Industries: Case Study in Indonesia. In Proceedings of the 2022 IEEE International Conference on Communication, Networks and Satellite (COMNETSAT), Solo, Indonesia, 3–5 November 2022; pp. 317–322. [Google Scholar] [CrossRef]
- Wulandari, A.; Hasan, M.; Hikmaturokhman, A. Enhanching Data Rate and Coverage in Private 5G Network: A Comparative Study of 4×4 MIMO and 8×8 MIMO Antennas. In Proceedings of the 2023 IEEE International Conference on Communication, Networks and Satellite (COMNETSAT), Malang, Indonesia, 23–25 November 2023; pp. 15–21. [Google Scholar] [CrossRef]
- Gheorghe, M.G.; Hociung, V.S.; Martian, A.; Vochin, M.C. Radio Coverage Analysis for a Mobile Private Network. In Good Practices and New Perspectives in Information Systems and Technologies (WorldCIST 2024), Lecture Notes in Networks and Systems; Rocha, Á., Adeli, H., Dzemyda, G., Moreira, F., Poniszewska-Marańda, A., Eds.; Springer: Cham, Switzerland, 2024; Volume 988, pp. 199–208. [Google Scholar] [CrossRef]
- ATDI HTZ Communications Software. Available online: https://atdi.com/products-and-solutions/htz-communications (accessed on 1 September 2025).
- Recommendation ITU-R M.1225. Available online: https://www.itu.int/dms_pubrec/itu-r/rec/m/R-REC-M.1225-0-199702-I!!PDF-E.pdf (accessed on 1 September 2025).
- Propagation model for Recommendation ITU-R P.528-3. Available online: https://www.itu.int/dms_pub/itu-r/opb/rep/R-REP-P.2345-1-2016-PDF-E.pdf (accessed on 1 September 2025).
- Electromagnetic Wave Propagation Model (Gierhart-Johnson). Available online: https://its.ntia.gov/software/if-77-electromagnetic-wave-propagation-model-gierhart-johnson (accessed on 1 September 2025).
- A General Purpose Wide-Range Terrestrial Propagation Model in the Frequency Range 30 MHz to 50 GHz. Available online: https://www.itu.int/dms_pubrec/itu-r/rec/p/R-REC-P.2001-4-202109-S!!PDF-E.pdf (accessed on 1 September 2025).
- Method for Point-to-Area Predictions for Terrestrial Services in the Frequency Range 30 MHz to 4 000 MHz. Available online: https://www.itu.int/dms_pubrec/itu-r/rec/p/R-REC-P.1546-6-201908-I!!PDF-E.pdf (accessed on 1 September 2025).
- 525526 Recommendation ITU-R P.526-11: Propagation by Diffraction. Available online: https://www.itu.int/dms_pubrec/itu-r/rec/p/R-REC-P.526-11-200910-S!!PDF-E.pdf (accessed on 1 September 2025).
- Report ITU-R M.2412-0: Guidelines for Evaluation of radio Interface Technologies for IMT-2020. Available online: https://www.itu.int/dms_pub/itu-r/opb/rep/R-REP-M.2412-2017-PDF-E.pdf (accessed on 1 September 2025).
- Recommendation ITU-R P.452-14: Prediction Procedure for the Evaluation of Interference Between Stations on the Surface of the Earth at Frequencies Above About 0.1 GHz. Available online: https://www.itu.int/dms_pubrec/itu-r/rec/p/R-REC-P.452-14-200910-S!!PDF-E.pdf (accessed on 1 September 2025).
- Ettus Research USRP B210 SDR Platform. Available online: https://www.ettus.com/allproducts/ub210-kit (accessed on 1 September 2025).
- srsRAN 4G Software Suite. Available online: https://www.srsran.com/4g (accessed on 1 September 2025).
- Mini-Circuits ZHL-2W-63-S+ Power Amplifier. Available online: https://www.minicircuits.com/pdfs/ZHL-2W-63-S+.pdf (accessed on 1 September 2025).
- Sirio SD-3000N Wideband Antenna. Available online: https://www.sirioantenne.it/en/products/uhf/sd-3000-u-n (accessed on 1 September 2025).
- Ettus Research VERT2450 Antenna. Available online: https://www.ettus.com/all-products/vert2450/ (accessed on 1 September 2024).
- SysmoISIM-SJA2 Programmable SIM/USIM/ISIM Cards. Available online: https://sysmocom.de/products/sim/sysmousim/index.html (accessed on 1 September 2025).
- Solid-B5G Research Project. Available online: https://solid-b5g.upb.ro (accessed on 1 September 2025).
- G-MoN Pro Android Application. Available online: https://play.google.com/store/apps/details?id=de.carknue.gmonpro&hl=en (accessed on 1 September 2025).


Disclaimer/Publisher’s Note: The statements, opinions and data contained in all publications are solely those of the individual author(s) and contributor(s) and not of MDPI and/or the editor(s). MDPI and/or the editor(s) disclaim responsibility for any injury to people or property resulting from any ideas, methods, instructions or products referred to in the content. |
© 2025 by the authors. Licensee MDPI, Basel, Switzerland. This article is an open access article distributed under the terms and conditions of the Creative Commons Attribution (CC BY) license (https://creativecommons.org/licenses/by/4.0/).