Abstract
Fabric properties significantly influence the accuracy of pattern dimensions derived from 3D scanned garment samples. To enhance the generated pattern accuracy, a novel predictive model was proposed to estimate the pattern dimension change ratio by integrating fabric parameters using an artificial neural network (ANN). Thirty fabrics were tested for making flared skirts. The pattern generation involves 3D scanned garment samples, the Bowyer–Watson algorithm for surface reconstruction, and an energy model for surface development. After the pattern’s dimension change ratio was obtained, principal component analysis (PCA) was applied to reduce dimensionality before correlation analysis. Results indicated that thickness, bending rigidity, drapability, and shear performance were the primary fabric parameters influencing dimensional accuracy. Backpropagation (BP) neural networks were constructed to predict the pattern size change ratio using both full fabric parameters or a PCA-reduced set, including a 9-parameter input layer, four hidden layers, and a 12-parameter output layer. The BP ANN models outperformed the radial basis function (RBF) ANN models, achieving accuracies of 96.67% and 96.02% for the full-factor and dimension-reduced models, respectively. After parameter optimization, the dimension-reduced BP ANN model enhanced pattern accuracy by 5.11%, achieving a final 97.73% accuracy. Results validate utilizing fabric parameters and BP neural networks as a sophisticated pattern optimization method.
1. Introduction
The fashion industry is rapidly shifting from traditional manual grading to digital “scan-to-sew” workflows in which 3D bodies or garment scans are converted directly into 2D production patterns [1]. Non-contact scanning protects precious samples, shortens lead times, and supports mass-customization platforms [2]. Yet the promise of “scan-to-sew” is still frustrated by a systematic discrepancy between the virtual garment and the final sewn product. The same style, when cut in different fabrics, can exhibit several millimeters of error per pattern in critical girth and length dimensions after gravity, drape, and creep have acted on the fabric, forcing costly proto-making cycles. Because pattern makers traditionally compensate for such behavior through iterative prototypes, the need for a predictive, fabric-specific correction tool has become urgent.
In recent years, 3D scanning technology has become an important tool for improving the accuracy of pattern design due to its ability to comprehensively capture depth information in 3D models of clothing [3]. Several scholars have attempted to apply 3D scanning data to the generation of clothing patterns. Lin et al. (2012) [4] manually segmented and constructed a 3D clothing model of a jacket by acquiring point cloud data and then utilized the Geomagic design and Freeform softwares to unfold the surface. However, the accuracy of the patterns generated using this method is limited. Zhang et al. (2015) [2] similarly built a polygon model of a tight jacket based on 3D point cloud data and flattened it into a 2D pattern, but the style and ease allowance of the clothing still relied on manual adjustments. Additionally, the pure geometric model of this study was not suitable for the consideration of clothing fabric materials. Bang et al. (2021) [5] present a novel method for segmenting garment parts from input 3D scan data of a triangulated mesh. By constructing the 2D pattern for each garment part, a body model with a simulatable garment can be obtained. However, many straight lines, curves, and radians generated by the 2D pattern obviously do not accord with the characteristics of garment production patterns, and the fabric factor is not considered. Recognition of this limitation prompted Chen et al. (2023) [6] to propose a non-destructive finite-element-based flattening method that integrates fabric mechanical properties, including bending rigidity and elastic modulus, directly into the surface development process. Their approach achieved an improvement in pattern accuracy over traditional manual methods, but their finite-element solution is computed for one specific fabric at a time and offers no foresight about how the pattern may deform in different materials like a lighter satin or a heavier denim. In short, every existing method halts at generating a single “best-fit” pattern for a single known material; none deliver a predictive mapping from any fabric’s low-cost lab data to the corresponding dimensional correction. Our approach generalizes such corrections by learning the error surface across fabrics.
The core variables that control the “error-per-pattern” problem outlined above are not geometric but fabric mechanical properties. Drape-meter studies show that skirt silhouette deviations correlate most strongly with fabric bending length and shear stiffness [7]. It was found that due to the deformation of the fabric, the position and length of the 3D measurement line at bust, waist, and hip girths do not match the corresponding line position and length in 2D base patterns, which is related to the mechanical properties of the fabric [8]. The process of translating flat pattern data into a 3D simulation is more complicated on clothing due to the varying and unpredictable nature of the fabric and the forces exerted by the mannequin under the garment [9,10]. However, in many CAD design systems, the properties of fabrics are often not adequately considered [11]. Studies have shown that when transforming 3D clothing models into 2D patterns, the characteristics of the fabric can significantly affect the accuracy of the generated patterns [12]. Therefore, the impact of fabric parameters should not be underestimated [13]. Instruments like Kawabata Evaluation System of Fabric (KES-F), Fabric Assurance by Simple Testing (FAST), and Cusick’s Drape-Meter can offer as many as 47 parameters for each fabric type. The abundance of fabric parameters can pose a huge computational burden. The principal component analysis (PCA) method can study mechanical properties and denim manufactured garment shrinkage [14], as well as pinpoint the primary factors impacting physical–mechanical properties [15]. Therefore, principal component analysis has emerged as an effective method for dimensionality reduction to enhance the efficiency of prediction.
The process of converting sample garments to patterns involves model reconstruction and surface development. For 3D garment modeling, Delaunay triangulation is typically used. Common algorithms include Lawson’s flip and Bowyer–Watson. The Bowyer–Watson algorithm is not limited by the spatial dimension, and the realization process of the triangulation is easier than that of Lawson [16]. A general algorithm for surface flattening using an energy model [17] addresses certain limitations and has been widely applied in clothing research for 3D mesh expansion [18,19]. Researchers have used energy models to find patterns with minimal deformation [20] and to develop simplified fabric deformation models for optimal 2D patterns [21]. For soft, deformable garments, a NURBS surface is often used for its surface reconstruction. The energy model is also suitable for the flattening of complex NURBS surfaces [22]. The energy model has already been widely used in clothing applications.
Artificial neural networks (ANNs) have already proven their value in garment-related forecasting [23,24]. For instance, a new radial basis function (RBF) ANN predictive model can estimate body dimensions related to garment pattern making [25]. An ANN can also predict the extensibility properties of fabric, obtaining the minimum deviation between the experimental value and the predicted value [26]. A backpropagation (BP) algorithm was utilized to create a prediction model for assessing the dimensional changes in fabric composites post-washing to estimate water shrinkage on the pattern, showing a high accuracy [27]. In addition, Kalkanci et al. (2018) [28] performed a prediction of finished fabric dimensional change based on ANN. These studies confirm that ANNs can capture the nonlinear mapping between material descriptors and the resulting dimensional deviations, showing effectiveness in dimension prediction.
To tackle these problems, this study proposes a new predictive model utilizing an ANN to estimate pattern dimensions change ratios when converting 3D garment scans to 2D patterns. It aims to accurately predict and optimize pattern size variations across different materials. In this study, thirty kinds of fabrics were selected, and the mechanical properties of these fabrics were tested. Then these fabrics were made into flared skirt samples. The generation of a 2D clothing pattern from a 3D garment sample was achieved by 3D scanning, surface reconstruction with the Bowyer–Watson algorithm, and surface development based on an energy model. The resulting pattern’s dimension change ratio was determined. To improve the accuracy of generating patterns affected by fabric factors, PCA was used to reduce dimension, alongside conducting correlation analysis. After comparison with the radial basis function (RBF) ANN, the backpropagation (BP) ANN was determined to construct the prediction model for estimating the change ratio of pattern dimensions with a reduced set of fabric parameters. This predictive model played a pivotal role in optimizing the final flattened pattern.
2. Materials and Methods
2.1. Experimental Data Acquisition
2.1.1. Fabrics Properties
The experimental environment was a standard atmospheric pressure environment with relative humidity of (65 ± 5)% and temperature of (20 ± 2) °C. The flared skirt was used as the experimental object because it could partly reflect the clothing shapes of different angles, waves, and radians. Several woven fabrics were selected and left for 48 h, and 21 tests of the fabrics were carried out. Thirty kinds of commonly used fabrics for flared skirts were selected so that the results of 21 tests basically had a normal distribution. Thirty is the minimum number of experimental groups for large sample analysis [29]. Each fabric parameter test was repeated three times, and the average value was taken. The test results of fabric parameters C1–C21 are shown in Table 1, taking N1–N4 as an example.

Table 1.
Fabric properties of sample garments.
2.1.2. Preparation of Experimental Garment Samples
Figure 1 presents that ∠AOB is the flared angle of a quarter of the pattern. A two-piece flared skirt style with a flared angle of 67.5° was taken as an example [30]. The skirt center front length is 40 cm; the width of the waistband is 4 cm; the net waist circumference is 64 cm; and the ease allowance of the waist was set as α, which had an adjustment of 0–2 cm, due to the difference in fabric thickness. As shown in Figure 1, the AD is the center front length, which is one-piece cutting. Center front length is the vertical distance from the waistline to the hem at the front middle of the skirt. After moving down around 1 cm from point A to reach point A’, the center back length of the back AD is obtained. Center back length is the vertical distance from the waistline to the hem at the back middle of the skirt. BC is the length of the side seam. The AB arc length is 1/2 of the front waistline arc length. The CD arc length is 1/2 of the length of the front bottom. Furthermore, ∠BAE is the upwarping angle of the front waistline, and ∠CDF is the upwarping angle of the front hemline. Selected fabrics were made into flared skirt samples according to the pattern in Figure 1, as shown in Figure 2.
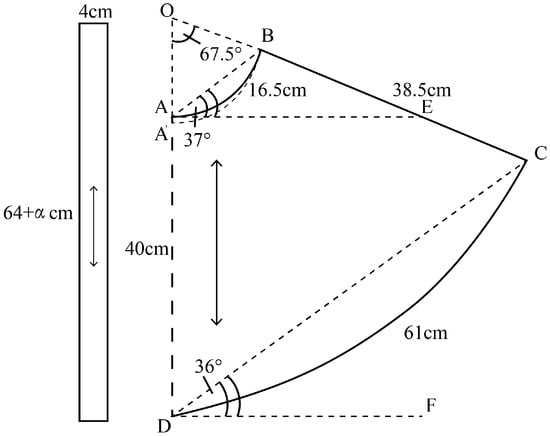
Figure 1.
The original pattern of 67.5° flared skirt.
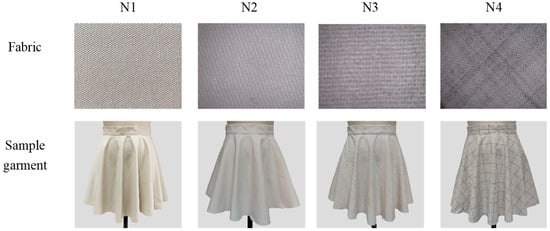
Figure 2.
Flared skirts of fabrics (N1–N4).
2.1.3. Acquisition of Point Cloud Data and Preprocessing
To obtain the depth information of three-dimensional clothing, flared skirts were supposed to be worn on the 160/84A female mannequin. The hand-held 3D scanner (Einscan-Pro2X, XianLin, Hangzhou, China) was employed. The accuracy of this scanner is 0.1mm. The scanning speed is 1,500,000 points/s, and the spatial point distance is 0.2 mm–2 mm. The scanning process is shown in Figure 3. For uniform sampling, the height of the scanner was sequentially fixed in the upper part, the middle position, and the lower part of the scannable range of the sample garment. It rotated three times around the central axis of the female mannequin. Simultaneously, the scanner was controlled to move on a fixed track until the flared skirt point clouds were obtained entirely.
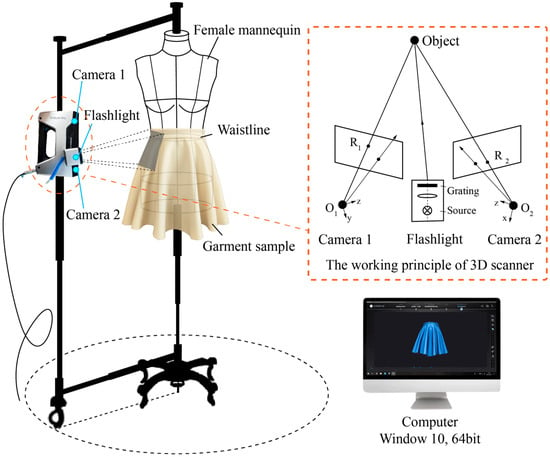
Figure 3.
Point cloud data acquisition through 3D scanning.
The Geomagic Design X 2020 (3D Systems, Inc., Rock Hill, SC, USA) software. was used to preprocess point cloud data, including coordinate system reconstruction, denoising, sampling, and smoothing. The intersection of the connection between the front and back waist points and the connection between the left- and right-side seam points was defined as the origin center so that a 3D coordinate system was established.
2.2. Surface Reconstruction
The process of turning sample garments into patterns mainly includes model reconstruction and surface development. Surface reconstruction [16] is needed in the construction of a 3D garment model. After preprocessing, Bowyer–Watson algorithm Delaunay triangulation [31] was used to triangulate the point cloud of the skirt surface. As shown in Figure 4, the spatial scattered point data and the adjacent points obeying the topology were connected to form a mesh structure so that the flared skirt model was reconstructed.
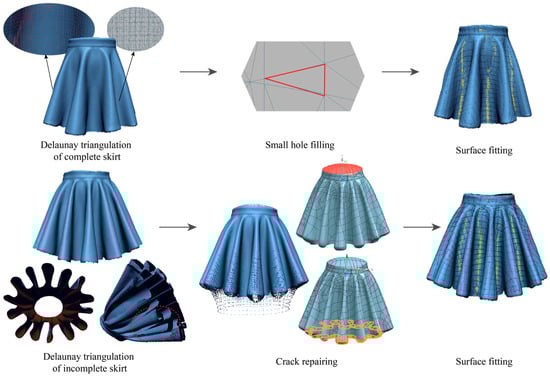
Figure 4.
Surface reconstruction and skirt repair.
The curvature change rate interpolation method was used to fit the geometric characteristics of the hole and construct a new point cloud expansion relationship to repair those holes. Finally, the triangular mesh was parameterized, and then the NURBS surface patch was carried out to fit each sub-mesh surface [32]. As shown in Figure 4, the NURBS surface model of the flared skirt was obtained.
2.3. Surface Flattening to Generate Patterns
The surface development can turn 3D clothing models into 2D clothing patterns. The energy model has been applied to clothing research to accomplish the surface expansion of a 3D mesh [18,19]. The surface development was implemented in NX 12 Open C++ (Siemens AG, Munich, Germany). As shown in Figure 5a, the first step was to segment the skirt, considering the waist section as the interface to isolate the waist part from the skirt. With the X axis and Z axis as the partition boundary, the flared skirt was eventually divided, determined by the style characteristics [33]. Only the half part is shown due to the space and the symmetry of the segmentation. In Figure 5b, (I) and (II) represent the left front and left back, respectively. Then, the 3D garment model was flattened onto a 2D plane by the surface development method based on the energy model [22]. The calculation formulas for elastic deformation energy E and elastic force f [17] are Equations (1) and (2), respectively.
where C is the spring coefficient, |Pi Pj| is the distance from Pi to Pj on the surface flattened, dj is the distance from Pi to Pj on a 3D surface, and npipj is the unit vector from Pi to Pj. Through the deformation of the spring particle, the original surface can be expanded to a 2D plane shape. As shown in Figure 5c, the flattened shape was obtained. Then, the curve was smoothed appropriately, and the length of the piece was adjusted to be consistent [13].
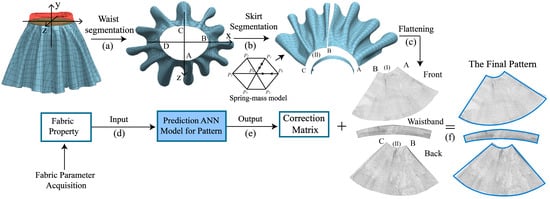
Figure 5.
Surface flattening and pattern optimization.
2.4. Key Dimension Obtaining
The dimension of generated patterns and the original pattern were compared and analyzed. In Equation (3), the dimension change was represented by the pattern dimension change ratio T, which could be defined as
where t1, t2 are denoted as the original pattern dimension and the generated pattern dimension, respectively. In this way, the proportion of changes in each size could be described mathematically. Key dimensions of the generated pattern include the following: T1, center front/back length; T2, side seam length; T3, waistline; T4, hemline length; T5, upwarping angle of waistline; T6, upwarping angle of hemline. F represents the front, and B represents the back.
3. Prediction Model Construction
3.1. Data Preprocessing
The data processing and prediction model construction of this study were conducted by MATLAB R2020b software (MathWorks, Inc., Natick, MA, USA). To ensure the accuracy and scientific nature of the sample data, it was necessary to preprocess the data before analysis. The experimental data included fabric parameters and the change rate of pattern size generated by surface expansion. The Q-Q normal test was carried out on the experimental data.
3.2. Parameter Dimension Reduction Based on Principal Component Analysis
To simplify the model and reduce the duplicate and closely related variables, principal component analysis (PCA) [34] was used to reduce the dimension of parameters. First, principal component analysis was carried out among 21 variables. As shown in Table 2, the initial solution for principal component analysis could be obtained.
Table 2.
Total variance explained table.
Table 2 shows that the first five principal components generated could represent 84.207% of the information of the overall data, with their eigenvalues exceeding 1 and a cumulative contribution rate of about 85%. The sixth component did not meet the eigenvalue threshold (>1) for retention. Consequently, the rotational sums of square loadings for the sixth component are omitted from Table 2. These five principal components could be used to basically describe the information of the original data. The five principal components were represented by F1, F2, F3, F4, and F5. As shown in Equation (4), the comprehensive value function of principal components could be obtained. Table 3 shows the factor score coefficient matrix.
Table 3.
Factor score coefficient matrix.
By substituting the five principal components in Table 3 into Equation (4), the comprehensive value function Equation (5) was obtained.
where ZXi is the standardized parameter. According to Equation (5) and Table 3, the weight of the coefficient of the comprehensive value function was analyzed. The result showed that the parameters C4, C5, C6, C9, C11, C12, C13, C14, and C15 have large weight. Therefore, these nine fabric parameters were taken as the main characteristic parameters.
3.3. Prediction of Change Ratio of Pattern Dimension Based on BP Neural Network
To use as few fabric parameters as possible to predict pattern dimension change ratio, the prediction model based on a BP ANN by using a dimension reduction factor was established. As shown in Figure 6, the structure of the BP ANN model [35] includes the input layer, hidden layer, and output layer. The input layer was 9 fabric parameters obtained by principal component analysis (PCA). The number of hidden layers was set to 4 layers, with the best prediction effect, as shown in Table 4. The hidden layer neuron quantities were set as 12, 10, 8, and 6, respectively, which is suitable for small sample sizes to prevent overfitting. The output layer was the pattern dimension change ratio T, including 12 parameters.
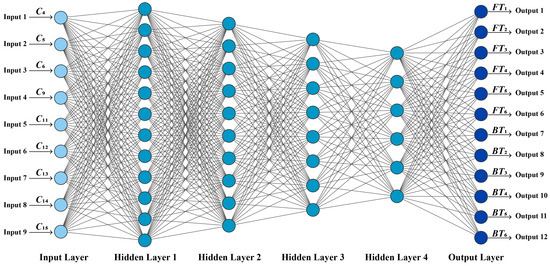
Figure 6.
The structure of the BP ANN model.
Table 4.
Optimization of the number of hidden layers.
The activation function of the BP ANN is the sigmoid function [36], as shown in Equation (6).
As shown in Figure 6, the steps are as follows: (1) The fabric parameters and pattern data were read, taking 85% of the experimental data set as a training set and 15% of the data as a test set. (2) The maximum number of training times of the network was set to 100. The learning rate was 0.1, and the expected error was 0.001. (3) Through network training, the mean square error curve gradually reached the target convergence after multiple iterations. Finally, the trained network was saved. As shown in Figure 5, the correction matrix of the pattern dimension change ratio was predicted.
3.4. Evaluation of Predicted Model
To evaluate the prediction effect, the regression loss function (Mean Absolute Error (MAE)) was used as the evaluation index, along with Mean Absolute Percentage Error (MAPE), Root Mean Square Error (RMSE), and relative RMSE [37]. The mean absolute error MAE was defined as shown in Formula (7), which represented the average absolute error between the predicted value and the observed value. Other evaluation indices are also shown in Formulas (8)–(10). n denotes the number of samples, yi represents the actual and experimental value, represents the average of the experimental values, and represents the predicted value. Using these indices to evaluate the prediction performance, the smaller the value is, the higher the prediction accuracy is.
4. Results and Discussion
4.1. Dimension Change Ratio Between Original and Developed Pattern
The dimension change ratios of the pattern developed by the energy model of thirty kinds of fabrics are shown in Table 5. The last column of Table 5 is the average of the absolute value of the patterns’ dimension change ratio, which is seen as the average change ratio (ACR).
Table 5.
The dimension change ratio of the generated pattern of thirty kinds of fabrics (for detailed data, please see Appendix A, Table A1).
As shown in Table 5, for the average ratio of change in length, T1 is the smallest. The most obvious reason is that the tensile properties of fabrics are usually the largest in the bias, followed by the crosswise grain, and the lowest in the lengthwise grain. The center front/back direction of the pattern is cut along the lengthwise grain, along which the fabric has a low elongation. However, side seam length T2, waistline T3, and hemline length T4 direction of the pattern are cut along the bias, which has a better elongation than the lengthwise grain. The change ratio of the center front length is higher than the change ratio in the center back length, which is because when the skirt is put on the female mannequin, the front skirt is almost wholly free to drape, while the back skirt is slightly supported by the hip of the female mannequin, counteracting a part of the gravity of the skirt. The reason why T5 is greater than T6 is that the radian of the waistline curve is larger than that of the hemline curve, resulting in greater deformation.
4.2. Correlation Analysis of Dimension Reduction Parameters
The main characteristic factors were obtained by PCA, and the scores of the characteristic factors are shown in Table 6 below. The higher the score, the greater the proportion, and the greater the contribution to predicting the pattern dimension change ratio.
Table 6.
The score ordering of characteristic parameters after dimensionality reduction.
Pearson correlation analysis [38] was conducted between the characteristic parameters and the dimension change ratio of the generated pattern. The results of the correlation analysis are shown in Figure 7.
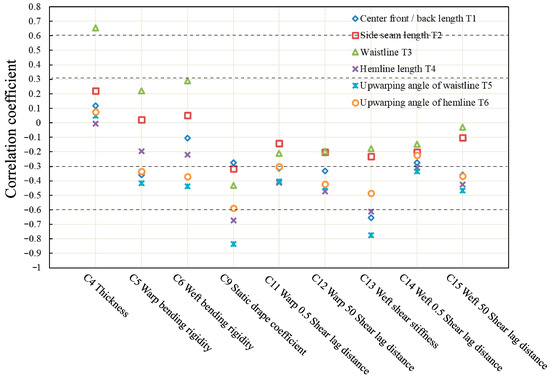
Figure 7.
Pearson correlation coefficient.
As can be seen from Figure 7, the dimension change ratio of the generated pattern is negatively correlated with the shear stiffness and bending stiffness. The larger the value is, the stronger the fabric’s resistance to deformation is, and the smaller the dimension change ratio of the pattern is. The center front length/center back length T1 is mainly affected by the weft shear stiffness C13, and the correlation is negative. The greater the shear stiffness is, the more difficult it is to shear, and the smaller the gravity deformation is. The correlation coefficient of the waistline T3 with thickness C4 shows a strong positive correlation, because only the point cloud data of the outer surface of the garment sample could be obtained. The thicker the fabric, the greater the circumference of the waistline, so the waistline T3 is greater. The waistline T3, hemline length T4, upwarping angle of the waistline T5, and upwarping angle of the hemline T6 are negatively correlated with the drape coefficient C9. The larger the drape coefficient is, the worse the drapability is, the less deformable the fabric is, and the smaller the dimension change ratio of the pattern is. The dimension change ratio of the pattern is mainly affected by thickness, bending stiffness, drapability, and shear performance.
4.3. Model Prediction Performance
Based on the results of the BP ANN models using dimensionality reduction factors, the performance plotted in Figure 8 ceased the iteration after nine steps according to the mean square error method after the minimum error was obtained from the Training, Validation, and Test values. Thus, the model shows the best performance at the ninth iteration.
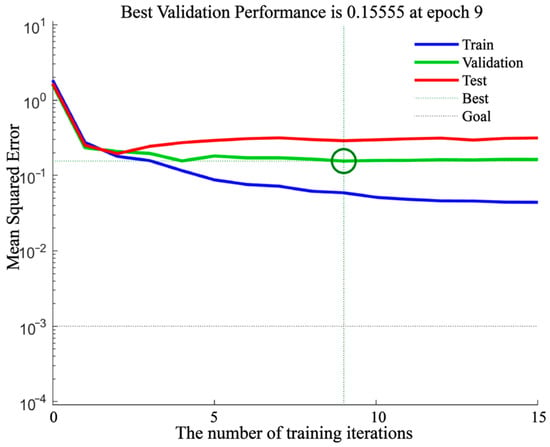
Figure 8.
The training mean square error convergence of BP neural network.
The correlation coefficient of the network is shown in Figure 9. After the BP ANN prediction model was trained for estimating the pattern dimension change ratio with dimension reduction factors, the correlation coefficient (R) of the model was 0.83854, indicating that there is a strong correlation between the real measurements and the predicted value. The prediction of the pattern dimension change ratio of the BP ANN model is successful.
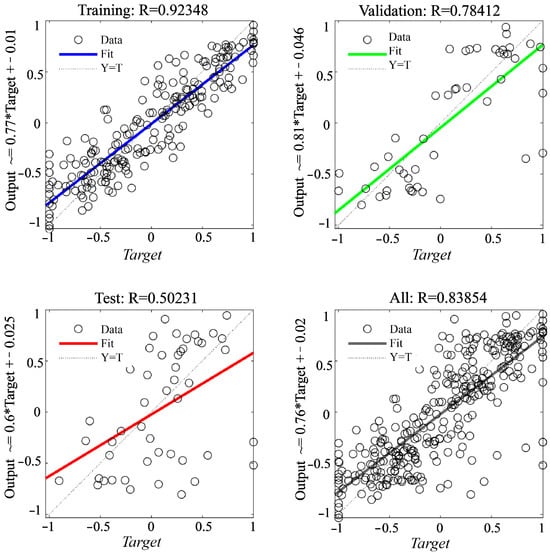
Figure 9.
Correlation coefficient of the network.
In order to explore whether dimensionality reduction parameters can replace the full-factor model while ensuring the accuracy of prediction, a prediction model based on the BP ANN was constructed for the full-factor data and the pattern dimension change ratio for comparison. The input layer was 21 fabric parameters, and the output layer was the pattern dimension change ratio. Other settings and steps of the network remained unchanged. After the model was trained with full-factor data, the correlation coefficient (R) of the model was 0.80895. This shows that there is also a strong correlation between the experimental value and the predicted value. By comparison, the R value of the dimension reduction factor BP ANN model is slightly higher than the full-factor model. Increasing training samples and optimizing hyperparameters can improve model accuracy and reduce overfitting. Future work will explore cross-validation, data augmentation, and regularization to further enhance generalization.
4.4. Comparison of Prediction Models
MAE (Mean Absolute Error), MAPE (Mean Absolute Percentage Error), RMSE (Root Mean Square Error), and relative RMSE (relative Root Mean Square Error) were used as evaluation indices to compare the prediction results of the pattern dimension change ratio. As shown in Table 7, a comparative analysis of the prediction performance across the four ANN models indicates that the BP ANN with full-factor inputs consistently outperforms the other configurations. It achieved the lowest MAE of 3.33%, MAPE of 6.24%, RMSE of 4.47%, and relative RMSE of 0.39, demonstrating both high accuracy and stability. Generally, an MAPE < 10% indicates excellent forecasting, while a relative RMSE value < 1 suggests that this model outperforms the baseline model. The BP ANN with dimensionality reduction factors demonstrated slightly lower but still robust performance, with an MAE of 3.56%, an MAPE of 8.95%, an RMSE of 6.64%, and a relative RMSE of 0.58. Dimensionality reduction resulted in a 15.793% loss of comprehensive information, leading to a modest decrease in accuracy. However, the difference between the models is minimal, indicating that the dimensionality-reduced BP ANN can effectively replace the full-factor model while maintaining predictive accuracy. In contrast, both RBF ANN models performed significantly worse. The RBF ANN using full-factor inputs yielded an MAE of 9.33%, an MAPE of 30.70%, an RMSE of 16.45%, and a relative RMSE of 1.55, while the RBF ANN based on dimensionality reduction, although showing a slightly improved MAPE of 14.45%, had a higher MAE of 11.40%, RMSE of 16.31%, and relative RMSE of 1.53.
Table 7.
Comparison of prediction methods.
As shown in Figure 10, taking MAE as the evaluation due to its directness, for the prediction of each dimension change ratio of the pattern, FT1 and BT1 hold the lowest prediction error and the best effect. The prediction errors of FT5, FT6, BT5, and BT6 are rather large, and the accuracy is not very high.
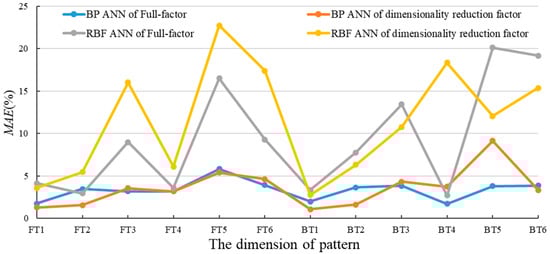
Figure 10.
Comparison of prediction models.
According to the variance in Table 7 and the trend in Figure 10, the prediction result of the BP ANN is more stable than that of the RBF ANN. Because the activation function of the BP ANN is the sigmoid function, which is a global approximation neural network for nonlinear mapping. However, the RBF ANN uses the Gaussian basis function and is a local approximation network [39]. Therefore, the RBF ANN is not applicable to the data of this study. Overall, the prediction effect of the BP ANN model is the best. The prediction errors of dimensionality reduction factors and full-factor data are both at a low level, and both have high accuracy.
4.5. Improvement of Pattern Accuracy After Optimization
The correction matrix of the change ratio of the pattern dimension was obtained by BP ANN prediction, and the developed pattern was optimized, as shown in Figure 5f. The pattern accuracy is 1 minus the absolute value of the dimension change ratio of the pattern. Figure 11 shows the pattern accuracy obtained by optimizing the pattern by the BP ANN prediction methods with dimensionality reduction factors.
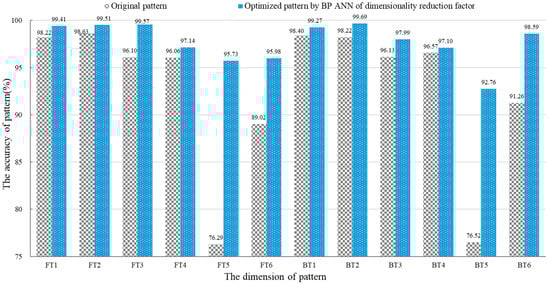
Figure 11.
The accuracy improvement of the developed pattern.
As shown in Figure 11, the pattern accuracy was improved after the modification and optimization of the BP ANN prediction model with a dimension reduction factor. Particularly, FT5 and BT5 were amended by the dimension reduction factor BP ANN prediction model, and the pattern accuracy was improved by 19.44% and 16.23%, respectively. By calculating the average accuracy, the pattern accuracy was 97.73% after the optimization of the dimension reduction factor BP ANN prediction model. After the correction of the dimension-reducing factor BP ANN prediction model, the pattern accuracy was improved by 5.11%. This was because the fabric parameters predicted the dimension change ratio of the flattened pattern, and the pattern accuracy could be improved by parametric correction of pattern dimensions.
5. Conclusions
In this study, thirty kinds of fabrics were selected for fabric testing to make flared skirts. This study employed 3D scanned garment samples for depth information acquisition directly, Delaunay triangulation based on the Bowyer–Watson algorithm for surface reconstruction, and an energy model for surface development. The dimension change ratio of the pattern was obtained. A new predictive model was constructed using BP ANN, including the input layer with 9 parameters, four hidden layers, and the output layer with 12 parameters, for estimating the dimension change ratio of pattern integrated with fabric parameters. The conclusions are as follows:
- (1)
- Principal component analysis was applied to reduce dimensionality, and correlation analysis was conducted. It was found that the pattern dimension was primarily influenced by parameters such as thickness, bending rigidity, drapability, and shear performance.
- (2)
- Compared with the RBF ANN method, the BP ANN model for the dimension reduction factor achieved an impressive average prediction accuracy of 96.44%. The full-factor BP ANN model demonstrated the most accurate predictions, with an average accuracy of 96.67%. However, the prediction accuracy of the RBF ANN model was comparatively lower, with average accuracies of 90.67% and 88.6% for the full-factor and dimension reduction factor models, respectively. This shows that the dimension reduction factor BP ANN model can replace the full factor due to the minor difference.
- (3)
- After the parameterized correction of the dimension-reducing factor BP ANN prediction model, the pattern accuracy was notably enhanced by 5.11%, reaching 97.73%. It was proven that the prediction model is effective in optimizing the pattern dimensions from scanned garments.
In the future, a wider range of fabric samples will be employed, implying the utilization of an extensive deep learning database to assess their effects on pattern generation and enhance pattern accuracy.
Author Contributions
Conceptualization, J.C. and F.Z.; methodology, J.C. and Z.G.; software, T.L. and Y.S.; validation, J.C., Z.G. and Y.S.; formal analysis, J.C., Z.G. and T.L.; investigation, J.C. and K.-l.Y.; resources, J.C.; data curation, J.C. and K.-l.Y.; writing—original draft preparation, J.C.; writing—review and editing, J.C., F.Z. and K.-l.Y.; visualization, J.C. and Y.S.; supervision, K.-l.Y., F.Z. and J.Y.; project administration, K.-l.Y. and F.Z.; funding acquisition, K.-l.Y., J.Y. and F.Z. All authors have read and agreed to the published version of the manuscript.
Funding
This research was funded by the Research Grant Council, project account PolyU 15606922.
Institutional Review Board Statement
Not applicable.
Informed Consent Statement
Not applicable.
Data Availability Statement
The original contributions presented in this study are included in the article. Further inquiries can be directed to the corresponding author.
Conflicts of Interest
The authors declare no conflicts of interest.
Abbreviations
The following abbreviations are used in this manuscript:
| ANN | Artificial Neural Network |
| BP ANN | Backpropagation Artificial Neural Network |
| RBF ANN | Radial Basis Function Artificial Neural Network |
| PCA | Principal Component Analysis |
| CAD | Computer-Aided Design |
| MAE | Mean Absolute Error |
| MAPE | Mean Absolute Percentage Error |
| RMSE | Root Mean Square Error |
| relative RMSE | relative Root Mean Square Error |
| ACR | Average Change Ratio |
Appendix A
Table A1.
The dimension change ratio of the generated pattern of thirty kinds of fabrics.
Table A1.
The dimension change ratio of the generated pattern of thirty kinds of fabrics.
| Number | Center Front Length (%) | Side Seam Length (%) | Waistline (%) | Hemline Length (%) | Upwarping Angle of Waistline (%) | Upwarping Angle of Hemline (%) | Center Back Length (%) | Side Seam Length (%) | Waistline (%) | Hemline Length (%) | Upwarping Angle of Waistline (%) | Upwarping Angle of Hemline (%) |
|---|---|---|---|---|---|---|---|---|---|---|---|---|
| FT1 | FT2 | FT3 | FT4 | FT5 | FT6 | BT1 | BT2 | BT3 | BT4 | BT5 | BT6 | |
| N1 | 1.05 | −0.66 | 4.53 | −2.81 | −15.74 | −8.40 | 1.61 | −0.31 | 1.64 | −0.47 | −12.49 | −3.94 |
| N2 | 0.41 | −0.45 | 0.23 | −0.54 | −19.86 | −9.02 | 0.13 | −0.07 | −1.07 | 1.98 | −12.24 | −4.07 |
| N3 | 0.12 | −1.33 | 4.67 | −3.29 | −12.77 | −6.65 | 0.14 | −2.07 | 1.19 | 0.03 | −14.13 | −9.41 |
| N4 | 4.35 | 5.68 | −5.61 | 0.37 | −16.84 | −13.80 | 0.64 | −1.50 | −5.94 | 4.74 | −11.46 | −7.62 |
| N5 | −0.10 | 0.27 | 0.18 | 0.22 | −11.89 | −4.28 | 2.24 | 2.62 | −0.32 | 0.72 | −20.86 | −8.78 |
| N6 | 3.23 | 4.19 | −7.36 | −1.20 | −24.71 | −10.80 | 1.24 | 2.96 | −3.36 | −4.07 | −22.80 | −10.94 |
| N7 | 0.06 | −0.88 | −3.34 | 0.12 | −14.30 | −1.28 | −0.14 | −1.08 | −2.07 | 0.27 | −12.81 | −0.72 |
| N8 | 3.04 | 0.77 | −3.72 | −0.32 | −17.69 | −5.14 | 0.26 | 1.17 | 0.77 | −0.90 | −12.58 | −5.44 |
| N9 | 0.51 | −0.28 | 3.59 | −0.64 | −9.01 | −3.75 | 0.21 | −1.82 | 6.77 | −0.80 | −13.80 | −6.37 |
| N10 | −0.52 | 0.14 | −4.79 | −0.65 | −8.73 | −3.36 | −0.49 | −1.32 | 1.49 | 3.47 | −12.23 | −3.78 |
| N11 | −0.13 | −2.13 | −4.15 | 2.58 | −13.12 | −2.20 | 0.52 | −2.00 | −0.78 | 2.58 | −16.90 | −1.94 |
| N12 | −0.28 | 0.50 | −1.38 | −0.16 | −11.91 | −5.38 | −0.71 | 0.27 | −0.58 | 0.63 | −9.36 | −2.13 |
| N13 | −1.00 | −0.50 | −2.92 | 0.44 | −8.97 | −3.76 | 0.00 | −0.29 | 0.51 | 0.59 | −10.51 | −6.40 |
| N14 | 1.25 | 2.46 | −8.28 | −4.90 | −32.98 | −16.52 | 2.00 | 4.06 | −5.95 | −5.82 | −32.77 | −17.77 |
| N15 | 1.27 | −1.45 | −4.71 | 0.00 | −16.57 | −5.14 | 1.90 | −2.97 | −3.23 | −0.76 | −26.46 | −7.65 |
| N16 | 0.24 | −1.13 | −3.93 | 1.78 | −13.28 | −3.54 | 0.85 | −0.35 | −2.86 | 0.71 | −15.66 | −2.72 |
| N17 | 2.87 | 4.40 | −3.70 | −0.07 | −16.33 | −8.12 | 0.55 | 0.87 | −0.12 | 2.67 | −17.58 | −3.53 |
| N18 | −1.46 | 0.58 | −5.13 | −0.20 | −14.34 | −6.74 | −0.39 | 0.36 | −0.12 | −0.15 | −13.39 | −7.81 |
| N19 | 1.64 | −0.23 | −5.97 | −0.60 | −19.23 | −5.41 | 0.06 | 0.45 | −3.59 | −1.63 | −16.07 | −7.67 |
| N20 | 0.66 | 2.05 | −5.99 | −1.57 | −10.03 | −5.78 | 1.05 | −0.20 | 1.69 | −2.79 | −17.54 | −7.04 |
| N21 | −0.28 | −0.68 | −0.19 | 0.23 | −11.73 | −3.00 | −0.61 | −1.62 | −3.89 | 0.69 | −11.88 | 0.50 |
| N22 | −0.31 | 0.64 | −3.41 | 0.54 | −13.04 | −4.27 | 0.76 | 1.33 | −2.56 | 0.27 | −14.31 | 0.54 |
| N23 | 2.59 | 4.72 | 2.87 | −1.88 | −23.61 | −14.06 | 2.72 | 4.22 | −1.48 | −2.86 | −26.21 | −17.37 |
| N24 | 0.24 | −1.75 | −1.88 | −1.30 | −17.38 | −3.62 | 3.65 | 5.66 | 1.54 | 0.82 | −17.43 | −6.35 |
| N25 | −1.48 | −1.79 | −7.20 | −2.43 | −20.18 | −6.49 | −1.25 | −1.19 | −6.15 | −2.03 | −18.15 | −7.52 |
| N26 | 0.75 | 1.28 | −5.21 | −0.75 | −14.72 | −6.51 | 1.41 | 0.55 | −4.86 | −0.46 | −14.04 | −5.04 |
| N27 | 0.06 | 0.20 | −7.00 | 2.09 | −16.07 | −4.12 | 1.27 | 0.57 | −3.66 | 0.37 | −17.03 | −3.51 |
| N28 | 3.03 | 2.58 | −0.13 | −1.22 | −20.66 | −7.77 | 0.61 | −1.24 | −1.64 | 0.33 | −16.66 | 0.02 |
| N29 | −2.00 | 1.47 | −5.92 | −3.34 | −18.39 | −11.36 | 2.21 | 0.52 | −7.06 | −3.84 | −26.37 | −9.36 |
| N30 | 3.05 | 1.30 | −1.21 | −12.28 | −48.74 | −25.15 | 2.51 | −1.03 | 2.13 | −12.16 | −43.30 | −25.75 |
| ACR | 1.27 | 1.55 | 3.97 | 1.62 | 17.09 | 7.18 | 1.07 | 1.49 | 2.63 | 1.99 | 17.57 | 6.72 |
References
- Lyu, Y.; Wang, Z.; Ye, Q.; Sun, Y.; Chao, J. Body data-driven garment pattern construction in digital fashion innovations: A review. Text. Res. J. 2025. [CrossRef]
- Zhang, J.; Innami, N.; Kim, K. Upper garment 3D modeling for pattern making. Int. J. Cloth. Sci. Technol. 2015, 27, 852–869. [Google Scholar] [CrossRef]
- Chen, X.W.; Zhou, B.; Lu, F.X.; Wang, L.; Bi, L.; Tan, P. Garment modeling with a depth camera. ACM Trans. Graph. 2015, 34, 1–12. [Google Scholar] [CrossRef]
- Lin, N.; Lin, J.; Lin, N. Reverse 3D garment model reconstruction technology research. Adv. Mater. Res. 2012, 480, 2148–2151. [Google Scholar] [CrossRef]
- Bang, S.; Korosteleva, M.; Lee, S.H. Estimating Garment Patterns from Static Scan Data. Comput. Graph. Forum. 2021, 40, 273–287. [Google Scholar] [CrossRef]
- Chen, J.Z.; Guo, Z.Y.; Li, T.; Du, L.; Zou, F.Y. An undamaged pattern generation method from 3D scanned garment sample based on finite element approach. Ind. Textilă 2023, 74, 35–41. [Google Scholar] [CrossRef]
- Matsudaira, M.; Masuda, T.; Wada, M.; Yokura, H. Shape factor of flared skirts compared with that of circular fabrics. J. Text. Eng. 2015, 61, 69–73. [Google Scholar] [CrossRef]
- Lagė, A.; Ancutienė, K. Virtual try-on technologies in the clothing industry: Basic block pattern modification. Int. J. Cloth. Sci. Technol. 2019, 31, 729–740. [Google Scholar] [CrossRef]
- Magnenat-Thalmann, N.; Volino, P. From early draping to haute couture models: 20 years of research. Vis. Comput. 2005, 21, 506–519. [Google Scholar] [CrossRef][Green Version]
- Porterfield, T.A.; Lamar, M. Examining the effectiveness of virtual fitting with 3D garment simulation. Int. J. Fash. Des. Technol. Ed. 2017, 10, 320–330. [Google Scholar] [CrossRef]
- Rödel, H.; Schenk, A.; Herzberg, C.; Krzywinski, S. Links between design, pattern development and fabric behaviours for clothes and technical textiles. Int. J. Cloth. Sci. Technol. 2001, 13, 217–227. [Google Scholar] [CrossRef]
- Špelic, I. The current status on 3D scanning and CAD/CAM applications in textile research. Int. J. Cloth. Sci. Technol. 2019, 32, 891–907. [Google Scholar] [CrossRef]
- Zhang, D.L.; Li, J.T.; Wang, J. Design patterns of soft products using surface flattening. J. Comput. Inf. Sci. Eng. 2018, 18, 021011. [Google Scholar] [CrossRef]
- Khedher, F.; Jaouachi, B. The principal component analysis method to study mechanical properties and denim manufactured garment shrinkage. Int. J. Cloth. Sci. Technol. 2025, 37, 387–401. [Google Scholar] [CrossRef]
- Hristian, L.; Ostafe, M.M.; Dulgheru, I.; Buhu, L.; Buhu, A.; Negru, D. Identification of influence factors on physical-mechanical properties, using the principal component analysis, in selecting the textile fabrics for the clothing products. Ind. Textilă. 2020, 71, 438–445. [Google Scholar] [CrossRef]
- Peters, J.F. Delaunay Mesh Segmentation. In Foundations of Computer Vision; Springer: Cham, Switzerland, 2017; pp. 199–209. [Google Scholar]
- Wang, C.C.L.; Smith, S.S.F.; Yuen, M.M.F. Surface flattening based on energy model. Comput. Aid Des. 2002, 34, 825–833. [Google Scholar] [CrossRef]
- Liu, Q.S.; Xi, J.T.; Wu, Z.Q. An energy-based surface flattening method for flat pattern development of sheet metal components. Int. J. Adv. Manuf. Technol. 2013, 68, 1155–1166. [Google Scholar] [CrossRef]
- Yang, Y.C.; Zou, F.Y.; Li, Z.; Ji, X.F.; Chen, M.Z. Development of a prototype pattern based on the 3D surface flattening method for MTM garment production. Fibres Text. East. Eur. 2011, 19, 107–111. [Google Scholar]
- Fang, J.J.; Ding, Y. Energy-based optimal darted pattern for garment design. Int. J. Cloth. Sci. Technol. 2014, 26, 164–183. [Google Scholar] [CrossRef]
- Peng, Y.J.; Zhu, Y.X.; Zhang, M.M.; Ma, Y.; Wang, Y.H. Surface flattening based on energy fabric deformation model in garment design. In Proceedings of the 2017 International Conference on Virtual Reality and Visualization (ICVRV), Zhengzhou, China, 21–22 October 2017; pp. 73–78. [Google Scholar]
- Zhuang, M.; Zhang, X.; Fang, J. The optimum flattening for undeveloped 3-D body surface based on energy. In Proceedings of the 2010 International Conference on Electronics and Information Engineering (ICEIE 2010), Kyoto, Japan, 1–3 August 2010. [Google Scholar]
- Thomassey, S.; Zeng, X. Artificial Intelligence for Fashion Industry in the Big Data Era; Springer: Singapore, 2018; pp. 1–6. [Google Scholar]
- Giri, C.; Jain, S.; Zeng, X.; Bruniaux, P. A detailed review of artificial intelligence applied in the fashion and apparel industry. IEEE Access 2019, 7, 1. [Google Scholar] [CrossRef]
- Wang, Z.; Wang, J.; Xing, Y.; Yang, Y.; Liu, K. Estimating human body dimensions using RBF artificial neural networks technology and its application in activewear pattern making. Appl. Sci. 2019, 9, 1140. [Google Scholar] [CrossRef]
- Ko, E.; Kim, S. Garment pattern nesting using image analysis and three-dimensional simulation. Fiber Polym. 2013, 14, 860–865. [Google Scholar] [CrossRef]
- Wang, J.; Song, J.Y.; Tang, A.Q. A model construction about predicting the rate of dimensional change after wash of fabric composites. Adv. Mat. Res. 2011, 332–334, 496–499. [Google Scholar] [CrossRef]
- Kalkanci, M.; Sinecen, M.; Kurumer, G. Prediction of dimensional change in finished fabric through artificial neural networks. Text. Appar. 2018, 28, 43–51. [Google Scholar]
- Dowdy, S.; Wearden, S.; Chilko, D. Statistics for Research; John Wiley & Sons: Hoboken, NJ, USA, 2011. [Google Scholar]
- Zhang, W.B. Apparel Construction Design; China Textile & Apparel Press: Beijing, China, 2006. [Google Scholar]
- Rivara, M.C.; Diaz, J. Terminal triangles centroid algorithms for quality delaunay triangulation. Comput. Aid Des. 2020, 125, 102870. [Google Scholar] [CrossRef]
- Kuzmichev, V.E.; Tislenko, I.V.; Adolphe, D.C. Virtual design of knitted compression garments based on bodyscanning technology and the three-dimensional-to-two-dimensional approach. Text. Res. J. 2018, 89, 2456–2475. [Google Scholar] [CrossRef]
- McCartney, J.; Hinds, B.K.; Chong, K.W. Pattern flattening for orthotropic materials. Comput. Aid Des. 2005, 37, 631–644. [Google Scholar] [CrossRef]
- Olive, D.J. Principal Component Analysis; Springer: Berlin/Heidelberg, Germany, 2017; pp. 189–217. [Google Scholar]
- Kalkanci, M.; Kurumer, G.; Öztürk, H.; Sinecen, M.; Kayacan, Ö. Artificial neural network system for prediction of dimensional properties of cloth in garment manufacturing: Case study on a T-shirt. Fibres Text. East. Eur. 2017, 25, 135–140. [Google Scholar] [CrossRef]
- Liu, K.; Wang, J.; Kamalha, E.; Li, V.; Zeng, X. Construction of a prediction model for body dimensions used in garment pattern making based on anthropometric data learning. J. Text. Inst. 2017, 108, 2107–2114. [Google Scholar] [CrossRef]
- Phellan, R.; Hachem, B.; Clin, J.; Mac-Thiong, J.M.; Duong, L. Real-time biomechanics using the finite element method and machine learning: Review and perspective. Med. Phys. 2021, 48, 7–18. [Google Scholar] [CrossRef]
- Benesty, J.; Chen, J.; Huang, Y.; Cohen, I. Pearson correlation coefficient. In Noise Reduction in Speech Processing; Springer: Berlin/Heidelberg, Germany, 2009; pp. 1–4. [Google Scholar]
- Liu, Q.; Sun, P.; Fu, X.; Zhang, J.; Yang, H.; Gao, H.; Li, Y. Comparative analysis of BP neural network and RBF neural network in seismic performance evaluation of pier columns. Mech. Syst. Signal Process 2020, 141, 106707. [Google Scholar] [CrossRef]


Disclaimer/Publisher’s Note: The statements, opinions and data contained in all publications are solely those of the individual author(s) and contributor(s) and not of MDPI and/or the editor(s). MDPI and/or the editor(s) disclaim responsibility for any injury to people or property resulting from any ideas, methods, instructions or products referred to in the content. |
© 2025 by the authors. Licensee MDPI, Basel, Switzerland. This article is an open access article distributed under the terms and conditions of the Creative Commons Attribution (CC BY) license (https://creativecommons.org/licenses/by/4.0/).