1. Introduction
Higher education institutions are increasingly expected to address sustainability challenges, enhance infrastructure efficiency, and promote operational transparency. Managing expansive campuses with mixed-use environments—from academic buildings to residential zones and green infrastructure—poses significant complexity and calls for innovative technological solutions. In response, smart campus initiatives have gained global momentum by integrating advanced digital technologies to optimize resource use and support data-driven decision-making.
Digital twins have emerged as a powerful paradigm among the key technologies enabling this transformation. A digital twin is a real-time, data-driven virtual representation of physical assets and systems. Although there is no universally agreed-upon definition of a digital twin, the concept is often positioned along a continuum that includes the digital model (static representation), the digital shadow (one-way data flow), and the digital twin (two-way, real-time interaction). This study adopts the latter perspective, emphasizing its role as a dynamic system for real-time monitoring and decision support. When applied in a campus setting, administrators can visualize infrastructure, monitor environmental conditions, simulate operational scenarios, and respond effectively to dynamic needs. The fusion of Building Information Modeling (BIM), Geographic Information Systems (GIS), and Internet of Things (IoT) sensor data facilitates a dynamic and multiscale spatial intelligence framework.
Recent studies highlight the growing role of open-source technologies in advancing digital twin and IoT applications, particularly in resource-constrained or experimental environments. For example, open platforms have been employed for industrial IoT integration [
1], smart campus IoT deployments [
2], and smart building and grid management [
3]. Following this direction, the framework developed in this study leverages open-source tools for sensing, data acquisition, and visualization, ensuring low-cost implementation, interoperability, and replicability across different institutional and urban contexts.
Chiang Mai University (CMU), a leading public university in northern Thailand, offers a compelling case study for digital twin implementation in Southeast Asia. Spanning over 7800 rai (approximately 3000 acres), CMU’s campus comprises diverse functional areas, including educational, research, residential, and green spaces. The Faculty of Engineering was selected as the pilot site due to its rich variety of facilities, classrooms, laboratories, dormitories, and utility systems—providing a micro-urban environment ideal for prototyping a campus-scale digital twin.
This study presents the design and implementation of a dynamic digital twin system tailored to CMU’s operational context. The system integrates Revit-based BIM models, spatial data from quantum geographic information system (QGIS) and SuperMap, real-time sensor streams (e.g., particulate matter less than 2.5 µg/m3 (PM2.5), temperature, humidity), and web-based dashboards for interactive visualization. By combining static and real-time data, the platform enables multilevel visualization—ranging from faculty-wide overviews to room-level insights—supporting energy management, space optimization, and environmental monitoring applications.
The main contributions of this paper are: (1) the design and deployment of an integrated digital twin system combining BIM, GIS, and IoT technologies; (2) the development of real-time dashboards for campus-scale monitoring and decision support; and (3) the demonstration of a modular, replicable smart campus framework within a Southeast Asian university context. This introduction lays the groundwork for the subsequent sections, which detail the system architecture, implementation process, testing outcomes, and broader implications for sustainable campus management.
The remainder of this research is structured as follows.
Section 2 reviews the related literature on smart campuses, digital twin technologies, and the integration of BIM, GIS, and IoT.
Section 3 outlines the materials and methods, including requirement analysis, data collection, 3D model creation, sensor deployment, and data integration.
Section 4 presents the results of system development, dashboard visualization, and prototype testing, followed by a discussion of broader implications. Finally,
Section 5 concludes the study by highlighting key findings, limitations, and potential directions for future research.
3. Materials and Methods
3.1. Data Collection and Requirement Analysis
This phase adopted a dual-track methodology, integrating stakeholder consultation with physical data acquisition. This research consisted of interviews and participatory workshops with key campus stakeholders, including representatives from the facilities management division, energy office, ICT services, and environmental sustainability units. These engagements helped identify core operational challenges, such as inefficient space utilization, the absence of real-time air quality monitoring, and fragmented data silos. Insights from these consultations were instrumental in shaping the functional requirements of the proposed digital twin platform.
In addition, this research adopted a formal requirements survey that was administered in January 2022 to the building management team of the Faculty of Engineering, Chiang Mai University. The survey aimed to assess digital needs across eight core facility management domains.
Table 1 presents a summary of the key functional capabilities prioritized by stakeholders during this phase.
In designing and developing the Digital Twin Framework for Sustainable Facility Management in a Smart Campus, it is essential to address these management requirements. Regarding the data collection process, the primary stakeholders involved were the building management team, consisting of (1) building resource management personnel and (2) maintenance technicians. They provided physical information necessary for developing the digital twin system, as the framework requires building and environmental data to be integrated with numerical datasets for enhanced visualization.
A significant challenge was collecting baseline data, as certain records were not systematically maintained. Examples include tree species, their spatial locations, and utility infrastructure details. A dedicated survey team was established to collect, digitize, and organize these data into a structured digital database to address this.
Previous studies highlight that overall energy consumption in campus buildings typically includes electrical loads (lighting, plug loads, and HVAC systems) and thermal energy for heating or hot water supply, depending on the climatic context. For example, Kapalo and Adamski [
42] analyzed heat consumption in buildings located in moderate climates, where heating demand strongly influenced overall usage. In contrast, in tropical climates such as Thailand, electricity dominates total energy consumption, with HVAC and lighting being the primary contributors.
Stakeholders defined the water flow tracking function to focus primarily on cold and total water consumption, rather than hot water, as heating is not a significant demand in the local context. One challenge identified was the difficulty of fully modeling and monitoring the entire piping network within buildings, which would require substantial resources. Instead, a modular approach was proposed, allowing future expansion to cover more detailed monitoring. Furthermore, pipeline anomalies (e.g., leaks, blockages, and abnormal resistance) were considered relevant to water management, consistent with findings in [
43], which emphasize the role of local resistance coefficients in flow behavior and anomaly detection.
The physical resource survey focused on the Faculty of Engineering at Chiang Mai University and encompassed two primary categories: (1) building data and (2) precinct data. The survey was conducted between June 2021 and January 2022. The building dataset comprised 25 structures with a combined gross floor area of approximately 96,000 square meters. Architectural drawings were available for most buildings in Computer-Aided Design (CAD) and Portable Document Format (PDF) formats, facilitating the development of Level of Development (LOD) 300 BIM models using Autodesk Revit (Autodesk, Inc., San Rafael, CA, USA), SketchUp (Trimble Inc., Sunnyvale, CA, USA), and other modeling tools. According to the survey, the availability of architectural documentation was generally high, which was critical for accurate 3D reconstruction. In cases where drawings were missing or incomplete, on-site visits and manual measurements were conducted.
The precinct dataset, covering approximately 40,000 square meters, included infrastructure components such as roads, drainage systems, utility poles, signage, and natural features like trees. As base data for these elements were unavailable, the field surveys were adopted to obtain geospatial coordinates for subsequent modeling. GIS layers included a Digital Elevation Model (DEM) for terrain reference and land cover classifications for contextual spatial analysis. The land cover classification categorized surface features into buildings, roads, trees, grass areas, parking lots, and bare soil—providing essential input for environmental simulation and spatial validation.
3.2. Three-Dimensional Model Creation
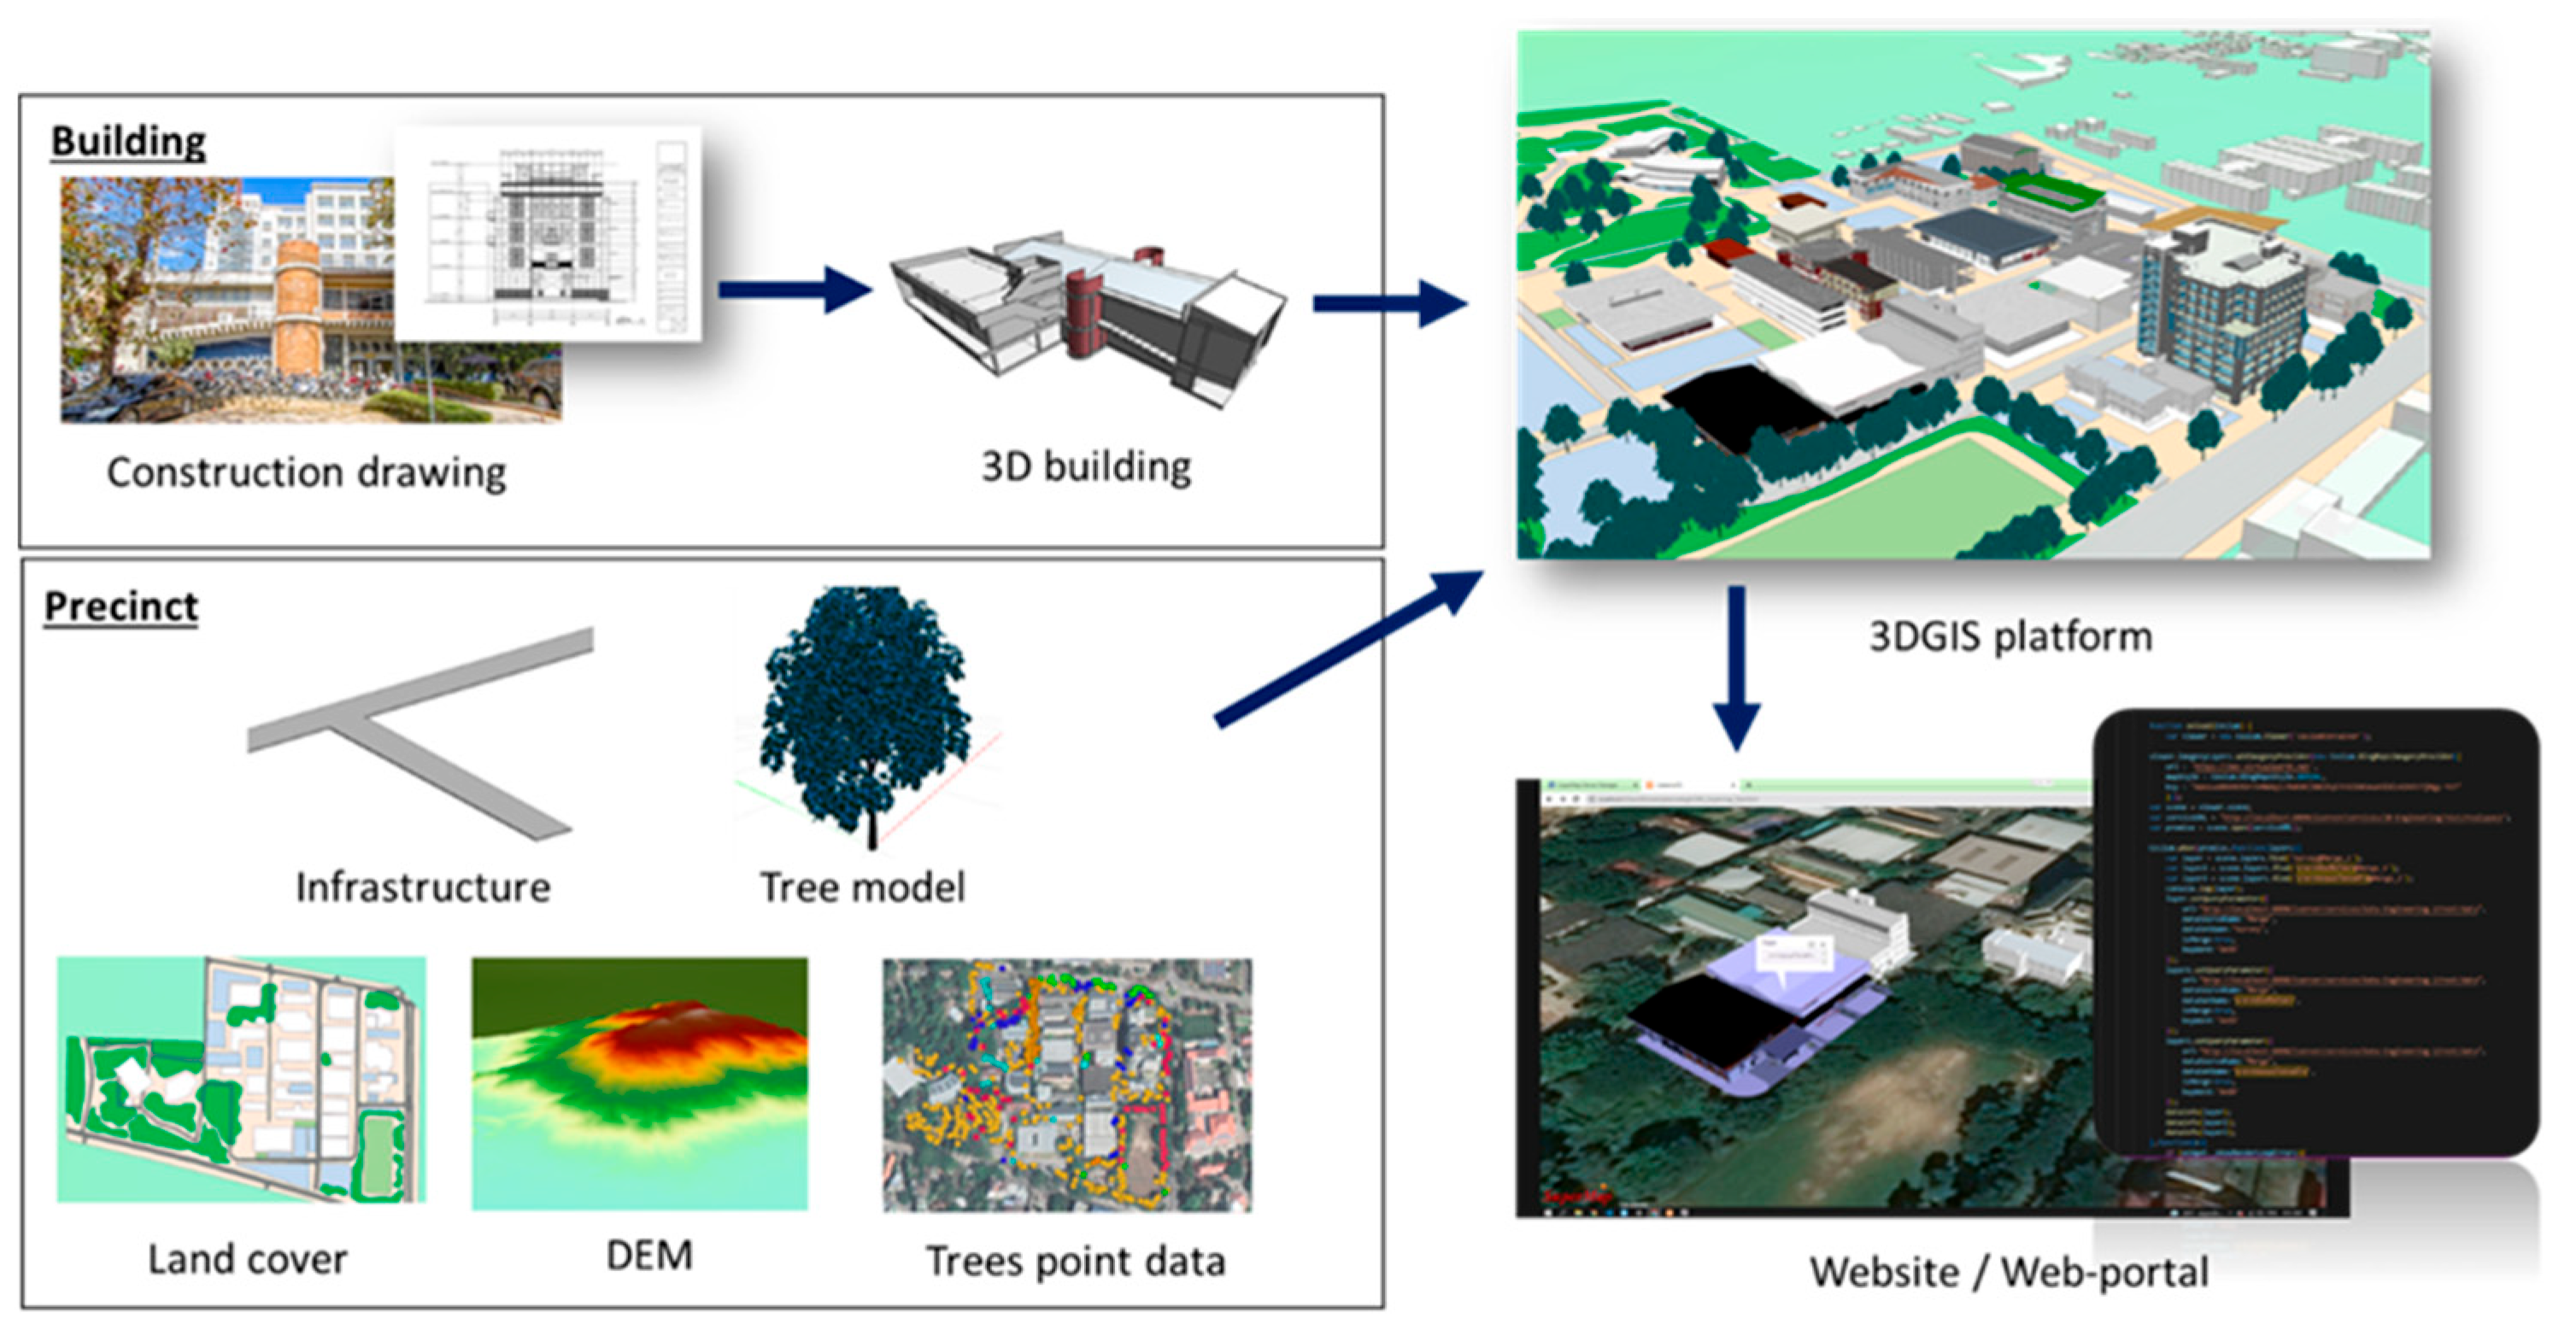
The second phase involved transforming the collected spatial data into semantically enriched and geospatially accurate 3D models. Building models were developed using Autodesk Revit and SketchUp, with CAD floorplans converted into volumetric representations of walls, floors, roofs, and mechanical, electrical, and plumbing (MEP) systems. These models adhered to LOD 300 standards, offering sufficient detail for applications in space management, energy simulation, and asset tracking.
Following BIM development, models were exported in IFC format to ensure platform interoperability. Each building was georeferenced in QGIS, aligning its footprint with surveyed base layers, including roads, terrain, and vegetation.
Three-dimensional terrain models were generated using a 10 m resolution DEM to capture topographic variation for the surrounding precinct. Urban objects such as trees, lamp posts, drainage pipes, and signage were modeled manually based on high-precision global navigation satellite system (GNSS) field data. These objects were integrated into a unified digital environment using SuperMap iDesktop (SuperMap Software Co., Ltd., Beijing, China) and visualized in three dimensions via the iClient3D web platform.
Semantic attributes were associated with each 3D object to enhance functionality. For instance, tree objects included data on species, canopy diameter, and estimated carbon sequestration capacity, while infrastructure components such as pipelines included metadata on diameter, material type, and maintenance history. This enriched semantic framework enabled the 3D model to function as a visualization tool and as a comprehensive facility management and sustainability database.
It consists of the entire 3D model, which was optimized for WebGL-based deployment to support performance and scalability. It enabled real-time interaction and data retrieval through standard web browsers—eliminating the need for plugins or high-performance computing equipment.
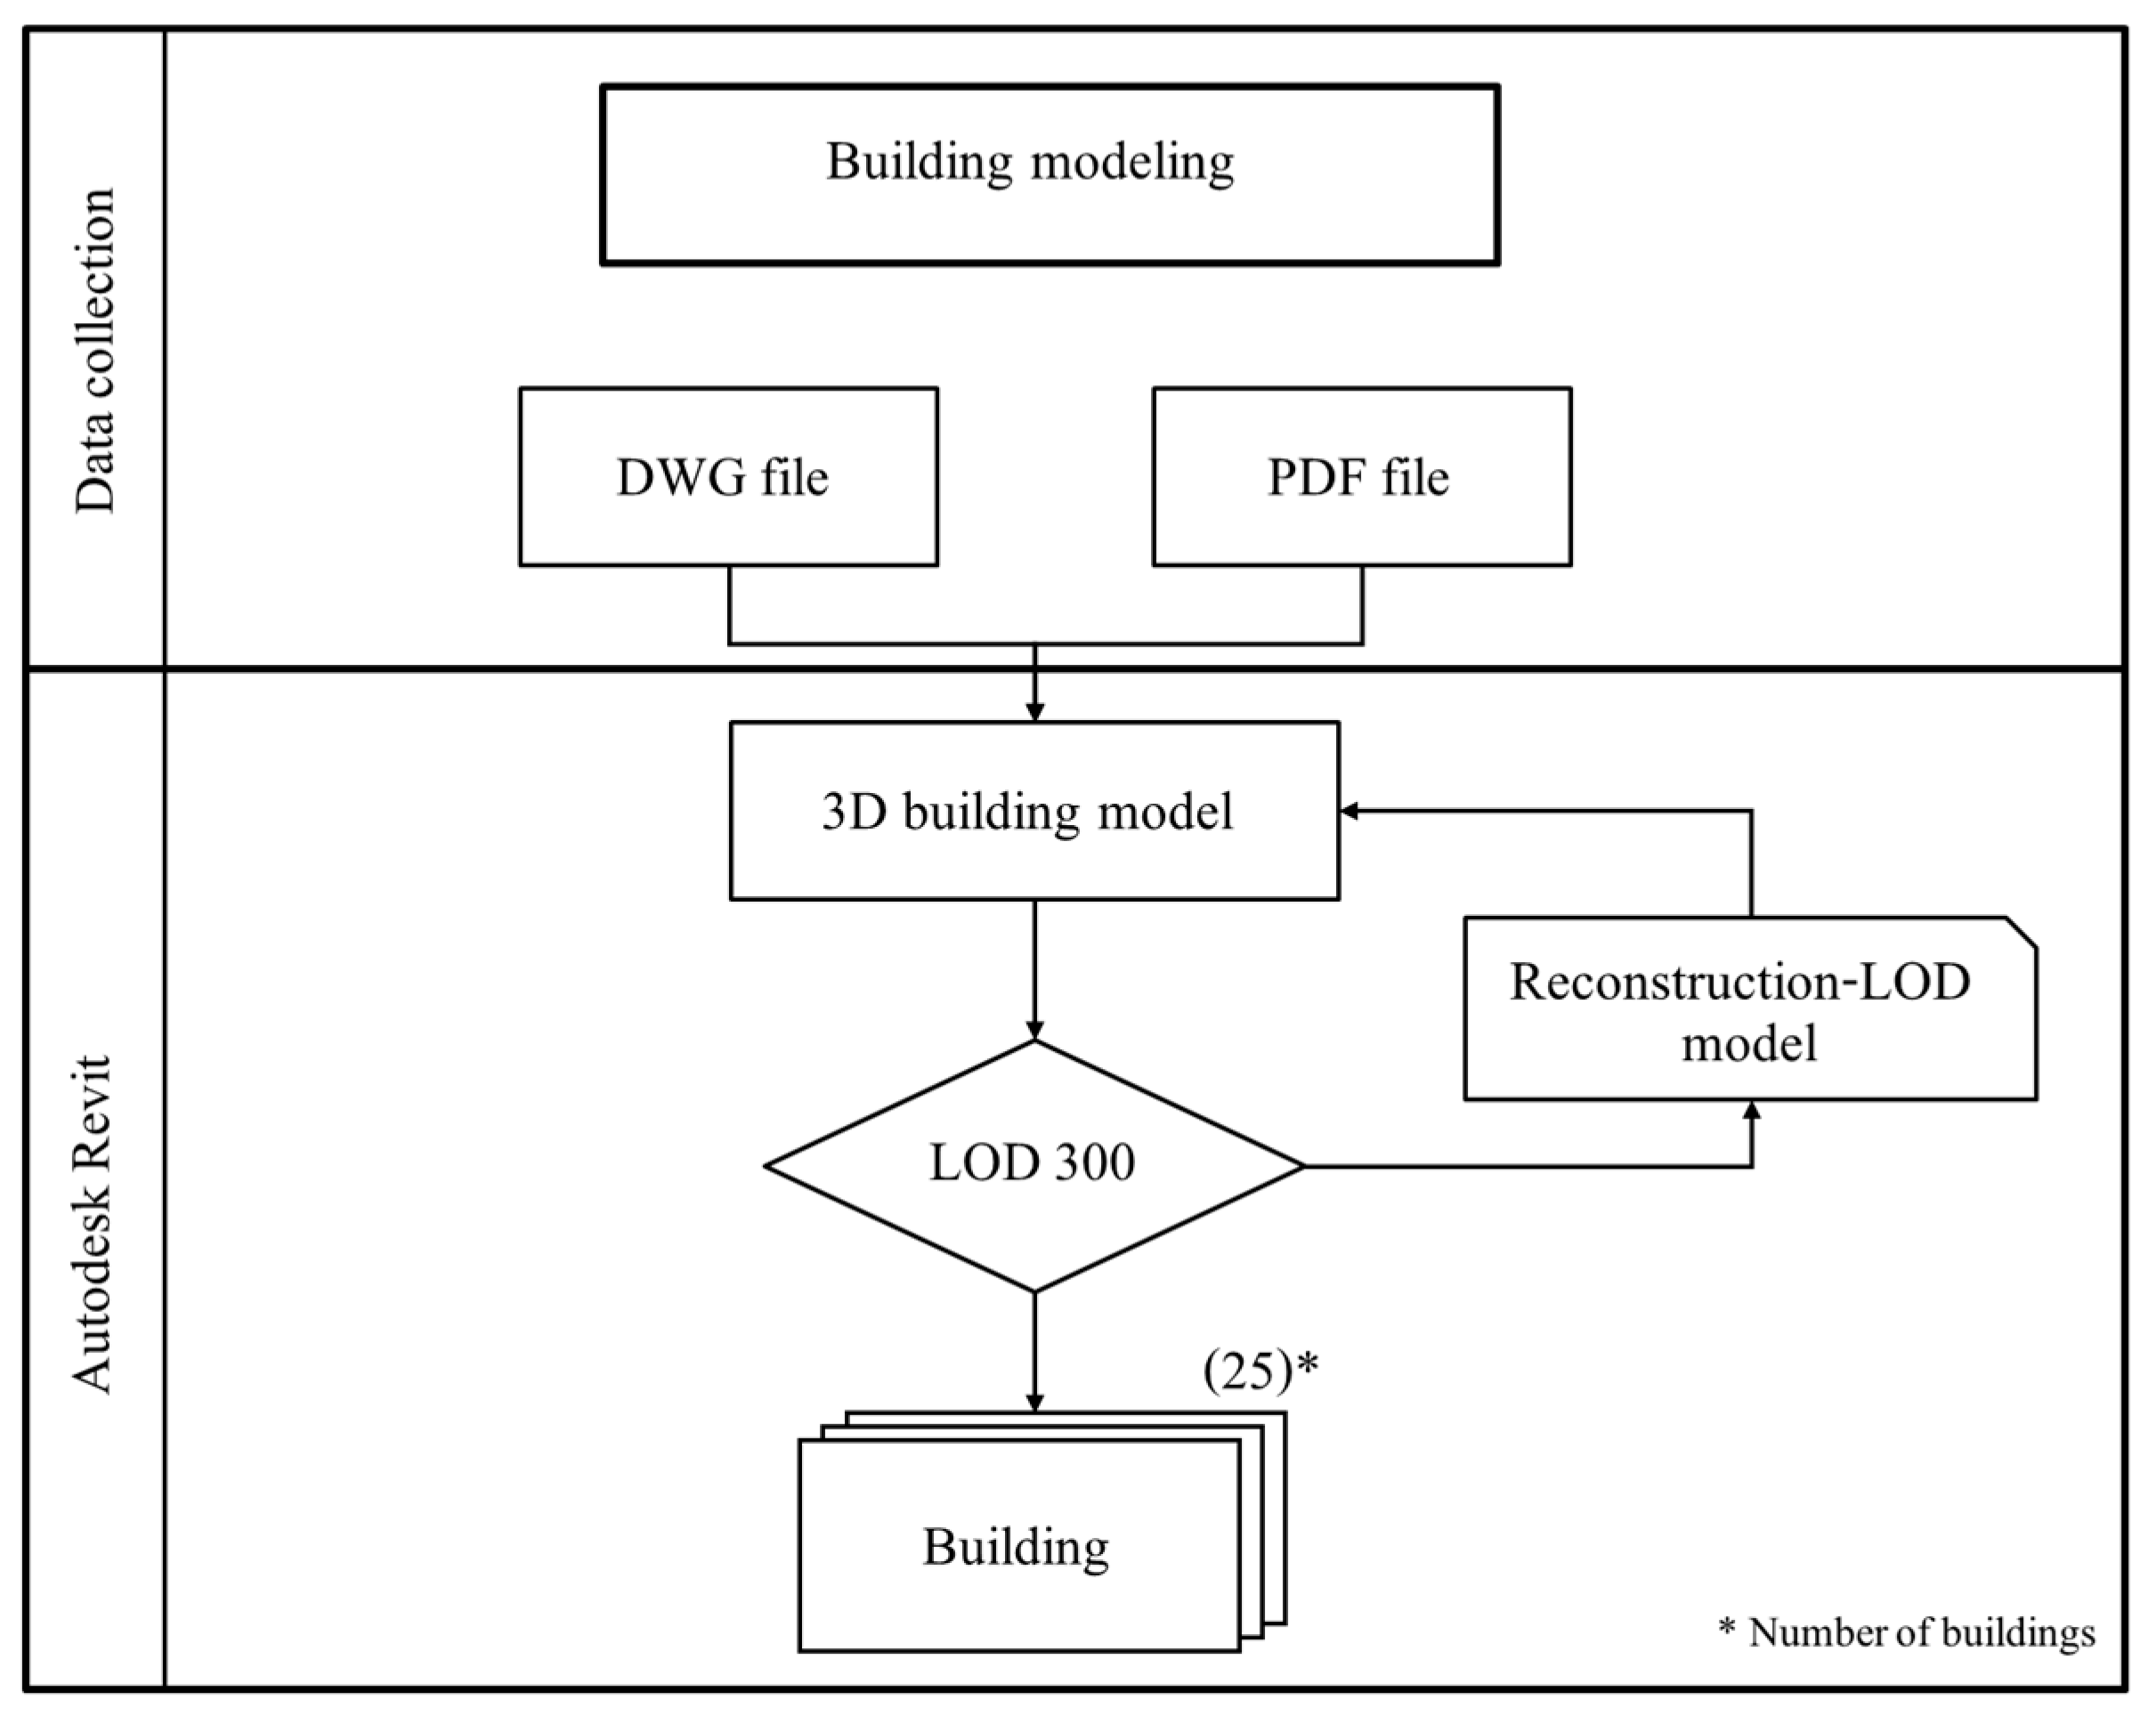
In this phase, the building management team participated by providing consultation on the appropriate level of model detail, as it directly affects the performance of the web-based visualization. Excessively detailed models would require high computational resources, negatively impacting usability. A challenge was also encountered with older buildings that lacked existing digital records; this was addressed through on-site surveys to generate the necessary models. The ICT services team also provided guidance and managed the computing environment to ensure the platform could be effectively supported (
Figure 1).
3.3. Sensor Deployment and Data Acquisition
The third phase focused on identifying appropriate sensors, determining deployment locations, and establishing protocols for real-time data acquisition. The research team reviewed existing data sources comprehensively to evaluate the data types necessary for effective digital twin implementation. This review encompassed historical usage logs, equipment maintenance records, and current sensor data formats.
After this data audit, the deployment sensor was conducted closely with campus engineers. The process involved mapping sensor types to the functional domains previously identified during the requirements analysis and selecting optimal deployment zones based on criteria such as wireless network coverage, electrical safety compliance, and data transmission efficiency.
The integration of real-time sensor data and dashboard visualization in this study is consistent with emerging implementations in smart campus contexts. For example, the digital twin platform developed at Qatar University demonstrates how data-driven energy modeling can empower sustainable facility management [
44]. Similarly, National Taiwan University has deployed a 3D digital twin integrated with IoT to support climate-resilient campus operations [
45]. These cases validate the methodological choices adopted in the present framework and demonstrate their broader applicability.
IoT technologies were employed to facilitate real-time data collection and centralized processing. The core microcontroller used for sensor integration was the NodeMCU ESP8266 (Espressif Systems Co., Ltd., Shanghai, China), selected for its hardware flexibility, low cost, and proven reliability in academic settings. This platform coordinated sensor operations and transmitted data to a central server.
The sensor network supported various functional domains, including environmental monitoring and energy/resource usage tracking. A combination of Narrowband Internet of Things (NB-IoT) and Long-Range Wide Area Network (LoRaWAN) communication protocols was implemented to support long-range, low-power data transmission across campus. The specific sensor types and hardware configurations used in this phase are summarized in
Table 2, which outlines the technical specifications and data parameters of each sensor module deployed for environmental and facility monitoring.
The sensor network architecture was structured around eight functional domains identified during the system requirements phase. A hybrid communication strategy combining NB-IoT and LoRaWAN was adopted, as conventional Wi-Fi proved unreliable due to high interference and spectrum congestion on campus. These protocols were selected for their long-range transmission, intense signal penetration, and low power consumption. Alternatives such as Zigbee, Z-Wave, and Bluetooth Low Energy were considered but dismissed due to limited coverage. At the same time, Sigfox was excluded because of bandwidth constraints and dependence on external operators. Deployment challenges, including signal attenuation and sensor interoperability, were mitigated through optimized gateway placement, transmission calibration, and redundant sensor nodes.
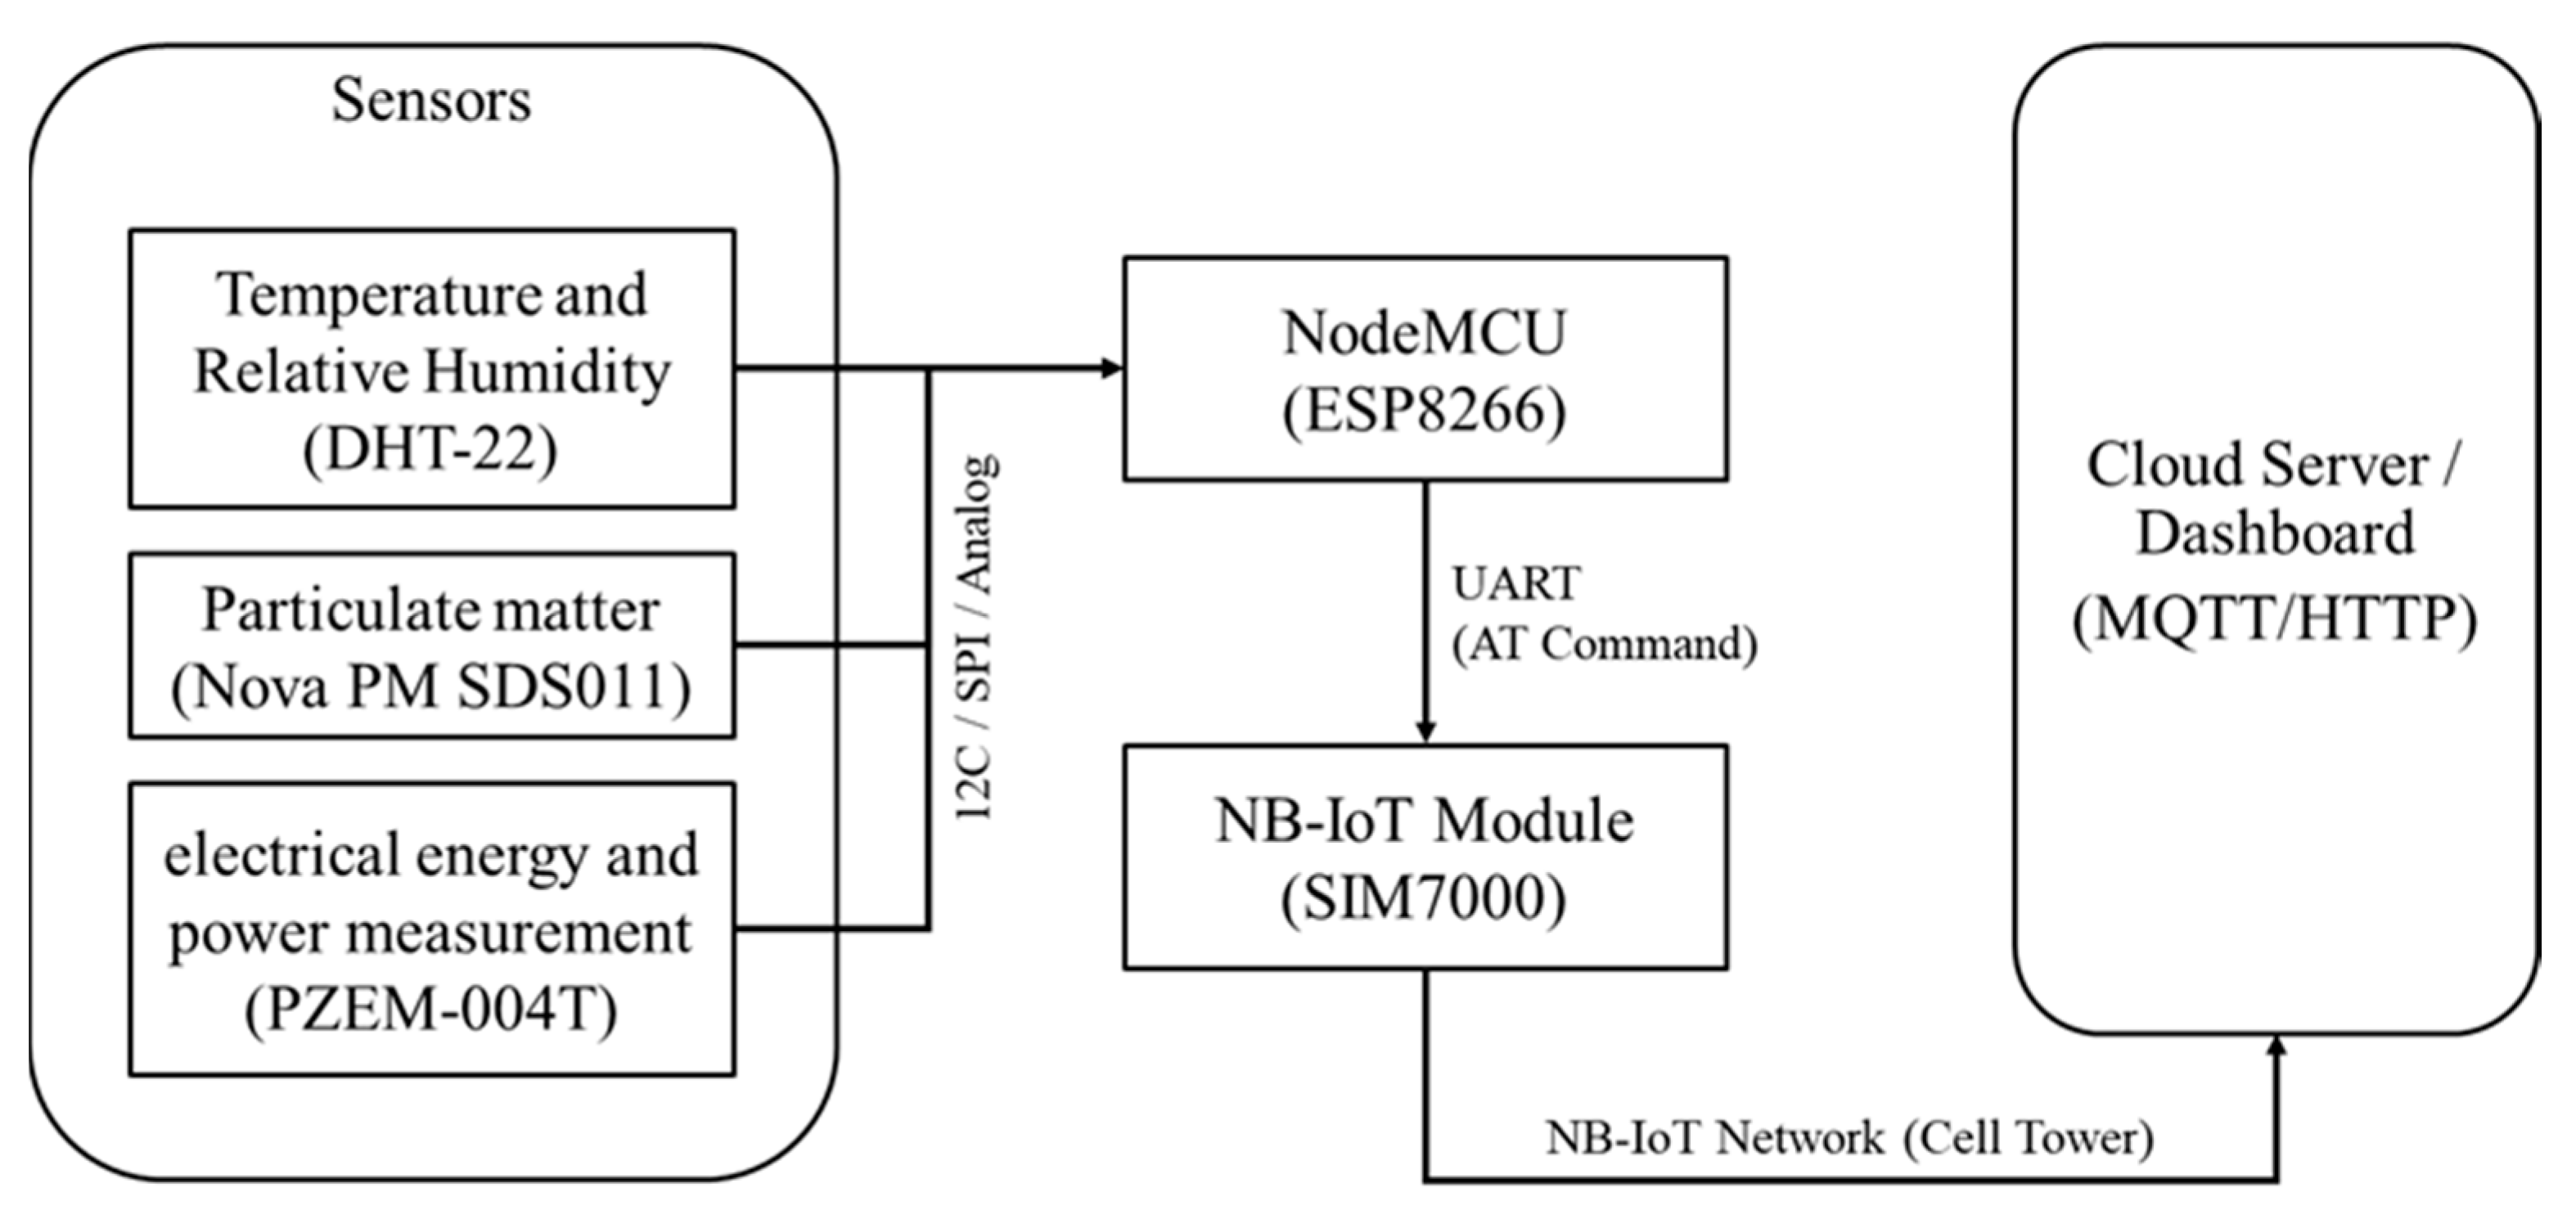
Figure 2 illustrates the detailed deployment architecture of the IoT sensor network for environmental monitoring. Multiple environmental sensors (e.g., temperature, humidity, and air-quality sensors) are connected to data acquisition devices such as NodeMCU or Arduino microcontrollers. The microcontrollers acquire and digitize the sensor readings and subsequently communicate with the NB-IoT communication module through the UART interface using AT commands. The NB-IoT module then transmits the data over the cellular network to a cloud-based MQTT server. The data is received, processed, stored, and visualized at the cloud layer in real time for facility management and monitoring purposes. The communication protocols explicitly involved in this architecture include UART (sensor-to-MCU), AT command protocol (MCU-to-NB-IoT), NB-IoT (module-to-cellular network), and MQTT (cloud data exchange). This architecture provides a low-power, long-range, and reliable data acquisition solution tailored for scalable IoT deployment.
The network integrated temperature, humidity, energy, and air quality sensors, whose accuracy was validated against reference instruments, including the Dust Boy system operated by CMU’s Climate Change Data Center (CCDC), Chiang Mai, Thailand. The results confirmed reliable performance, with accuracy maintained within ±0.5 °C for temperature, ±3% RH, and ±2% for energy, ensuring high-quality data for facility management and sustainability analysis.
Sensor deployment was organized into four designated zones, each selected to support different use cases and environmental contexts:
- 1.
Faculty Precinct Outdoor Area: Twelve environmental sensors—capable of measuring PM2.5, temperature, and humidity—were mounted on existing CCTV poles, subject to administrative clearance. These sensors supply real-time environmental data that enriches the 3D environment model through dynamic overlays, including air quality visualizations and interpolated contour maps.
- 2.
Eighth Floor, 30-Year Engineering Building: One digital electricity meter was installed in the main electrical cabinet to monitor power consumption, accompanied by two environmental sensors positioned in the hallway and elevator lobby to capture ambient temperature and humidity data.
- 3.
Room 818 (City Research and Development Center): This room was outfitted with targeted monitoring devices, including an energy consumption sensor attached to the air conditioning system, a motion detector for user presence analytics, and additional PM2.5 and environmental sensors to capture indoor air quality.
- 4.
Building-Wide Electrical Data: Aggregated electricity consumption data at the building level were acquired from the Department of Electrical Engineering and the Energy Research and Development Institute (ERDI-CMU), Chiang Mai, Thailand. Previously collected for institutional research purposes, these data were integrated into the digital twin platform to support historical benchmarking and real-time analysis.
In this phase, the building management team, particularly the maintenance technicians, participated by providing consultation on installing and integrating sensors to maximize the measurement and monitoring of energy consumption and air quality. Collaborations were established with ERDI and DustBoy, organizations based in Chiang Mai, Thailand, to ensure data accuracy and reliability, which provided reference energy and air quality data for validation and effective comparison.
3.4. Data Integration Algorithm Design
The fourth phase centered on developing the algorithmic infrastructure for seamless integration between physical sensors, digital models, and the facility management web platform. This integration layer ensures that real-time data streams—originating from energy meters, environmental sensors, and occupancy detectors—are properly validated, timestamped, and transformed into standardized formats suitable for storage and web-based visualization.
The system is implemented using open-source tools (e.g., Firebase, QGIS, SuperMap iDesktop, and web dashboards), which reduce costs, enhance interoperability, and improve replicability across different institutional and urban contexts [
1].
The visualization design was developed and aligned with stakeholder requirements, as the building management team emphasized the need to consolidate physical and informational data into a single platform. This integration was intended to improve usability and clearly represent the facility environment. However, challenges arose due to limited resources and available tools, leading to an initial platform design that prioritized energy management and environmental monitoring. Other functions are planned for incremental development in later stages.
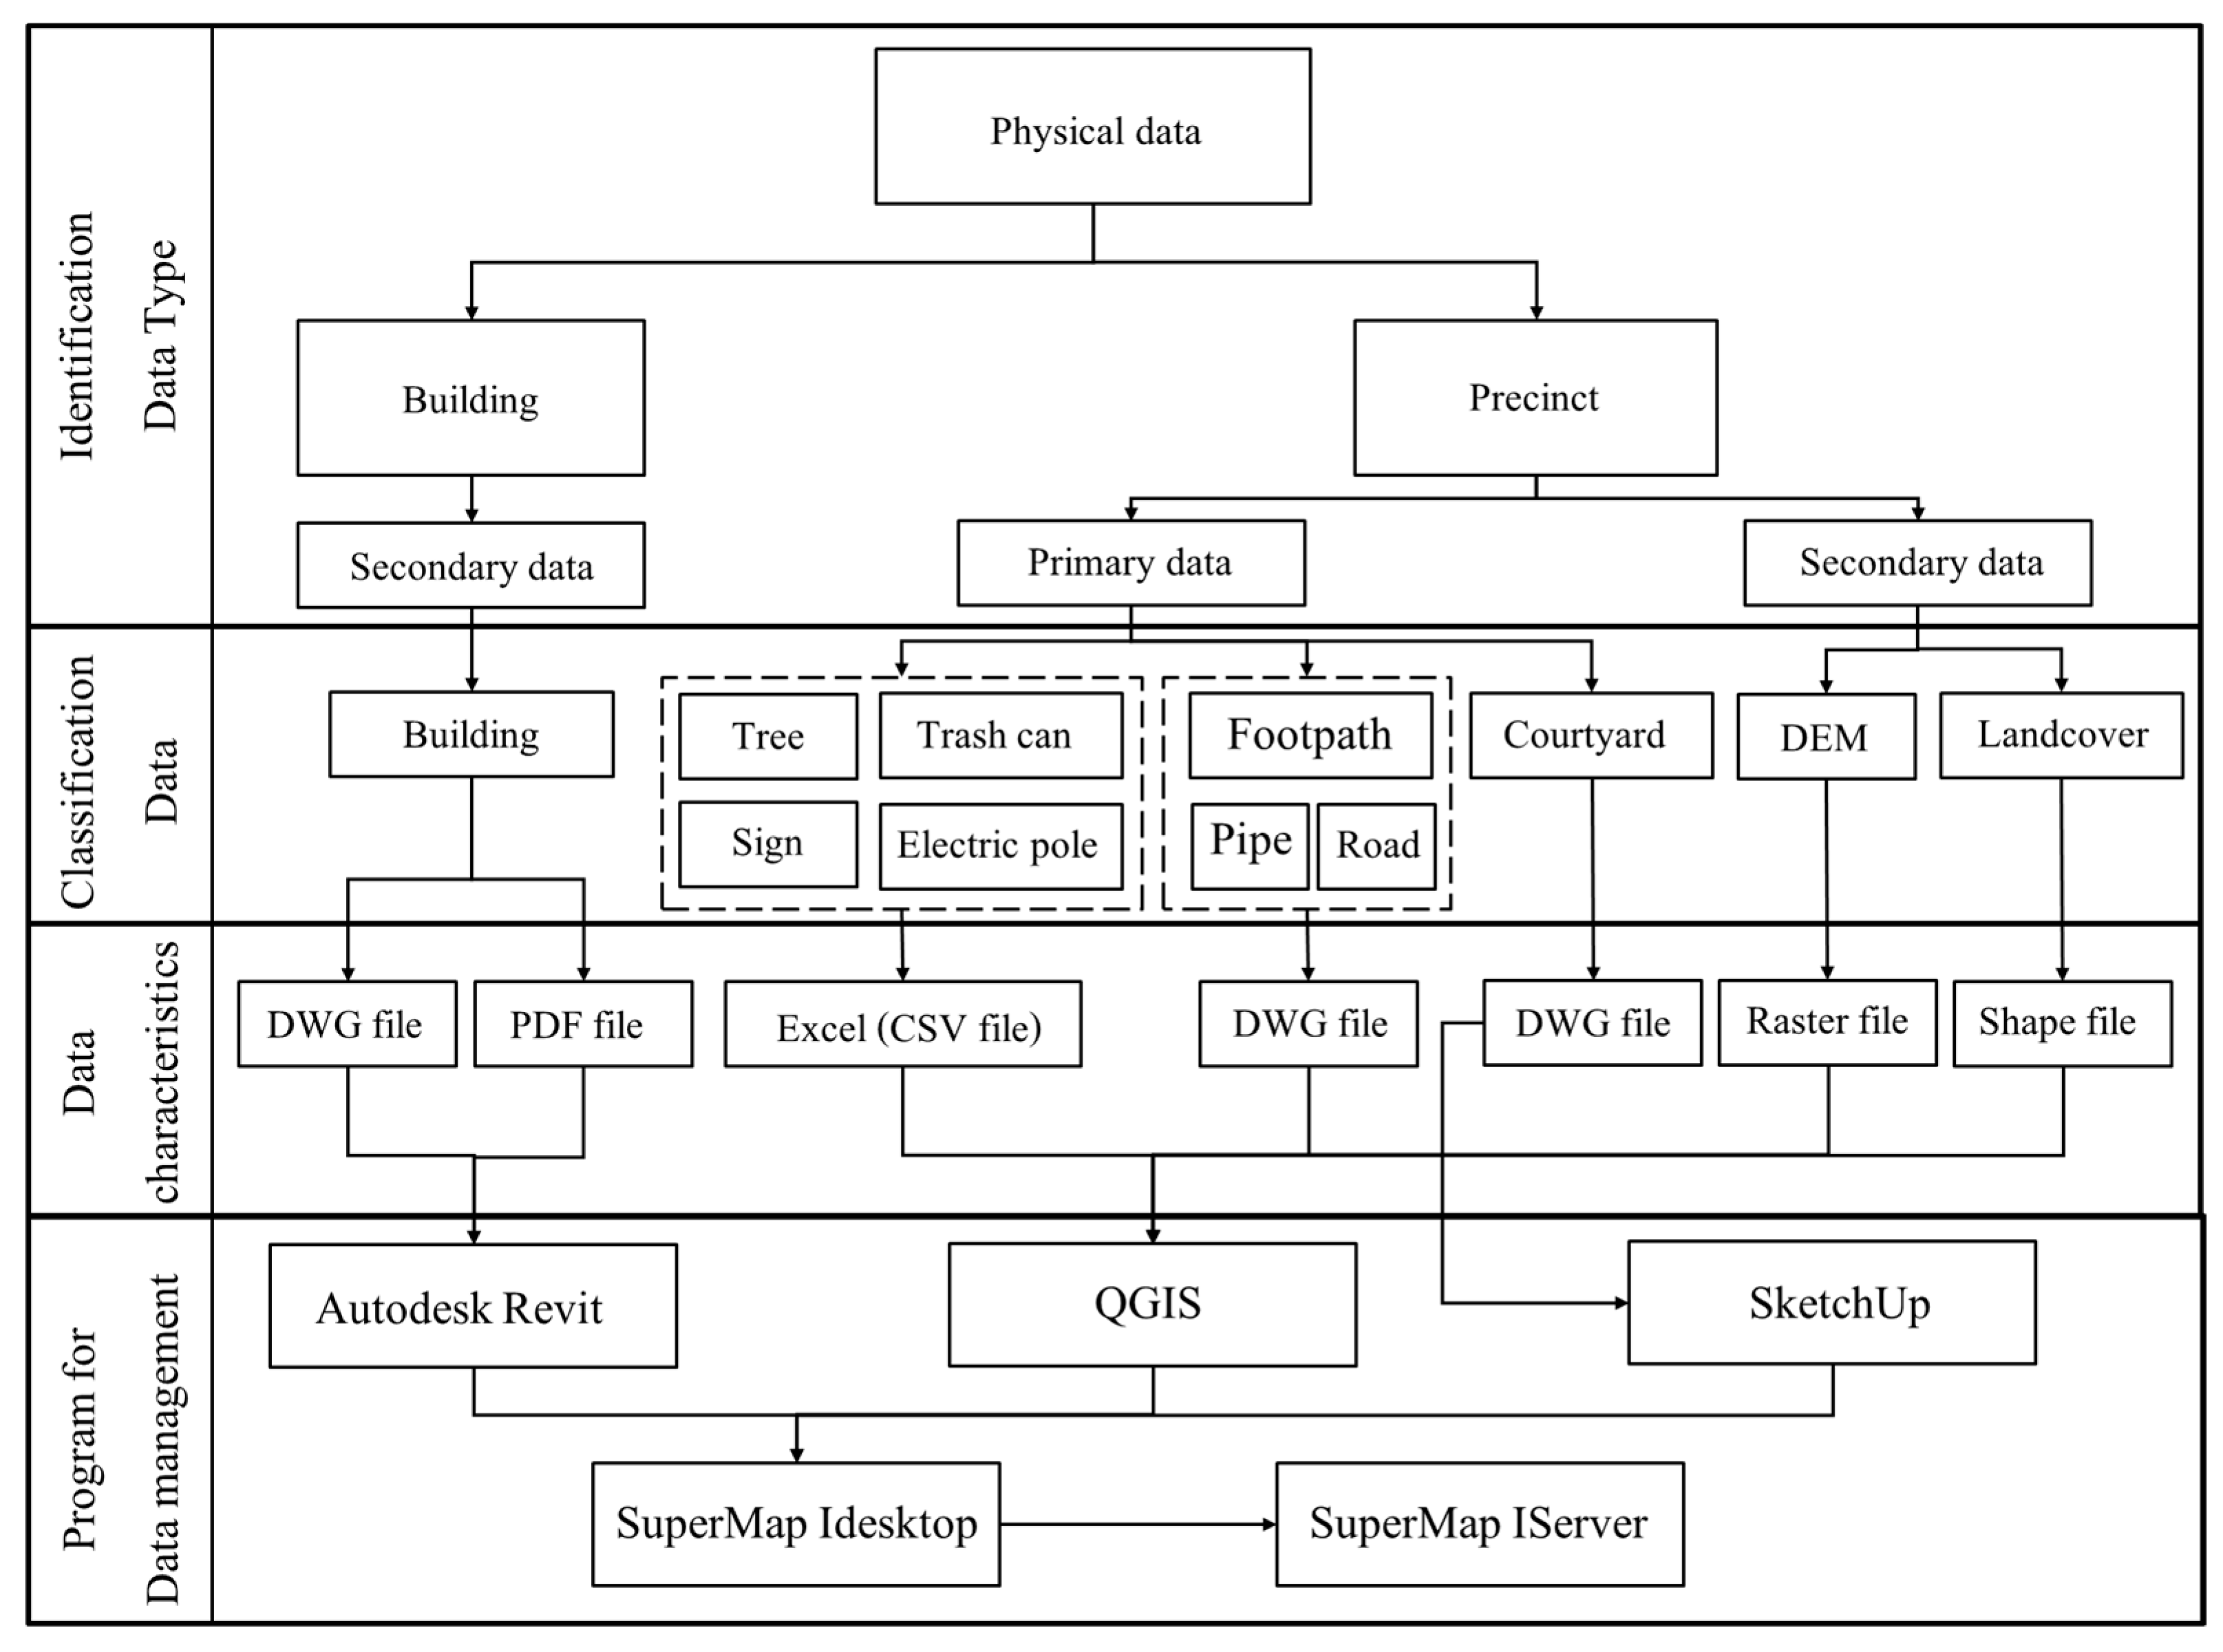
Both physical and sensor-derived data require preprocessing and segmentation to support accurate and real-time dashboard rendering. It involves aligning raw data inputs with predefined visualization layers, enabling structured data representation in the user interface. As illustrated in
Figure 3, physical data is classified into three distinct categories: (1) Building Information, (2) Primary Site Information, and (3) Secondary Site Information. Building models were created from architectural drawings in AutoCAD Drawing 2018 (DWG) and PDF formats using Autodesk Revit 2022, ensuring compatibility with BIM workflows. Primary site data—such as road layouts and utility infrastructure—was collected in Excel, stored in a local comma-separated values (CSV) format and DWG formats, and processed through QGIS for spatial alignment. Secondary site data, which includes terrain, vegetation, and land use features, was represented using shapefiles and raster datasets and managed using QGIS Desktop 3.34.0 and SuperMap iDesktop 10i(2021) SP1.
By standardizing and synchronizing these multiple data types, the integration algorithm forms the digital backbone of the smart campus platform, supporting multiscale interaction and real-time facility monitoring.
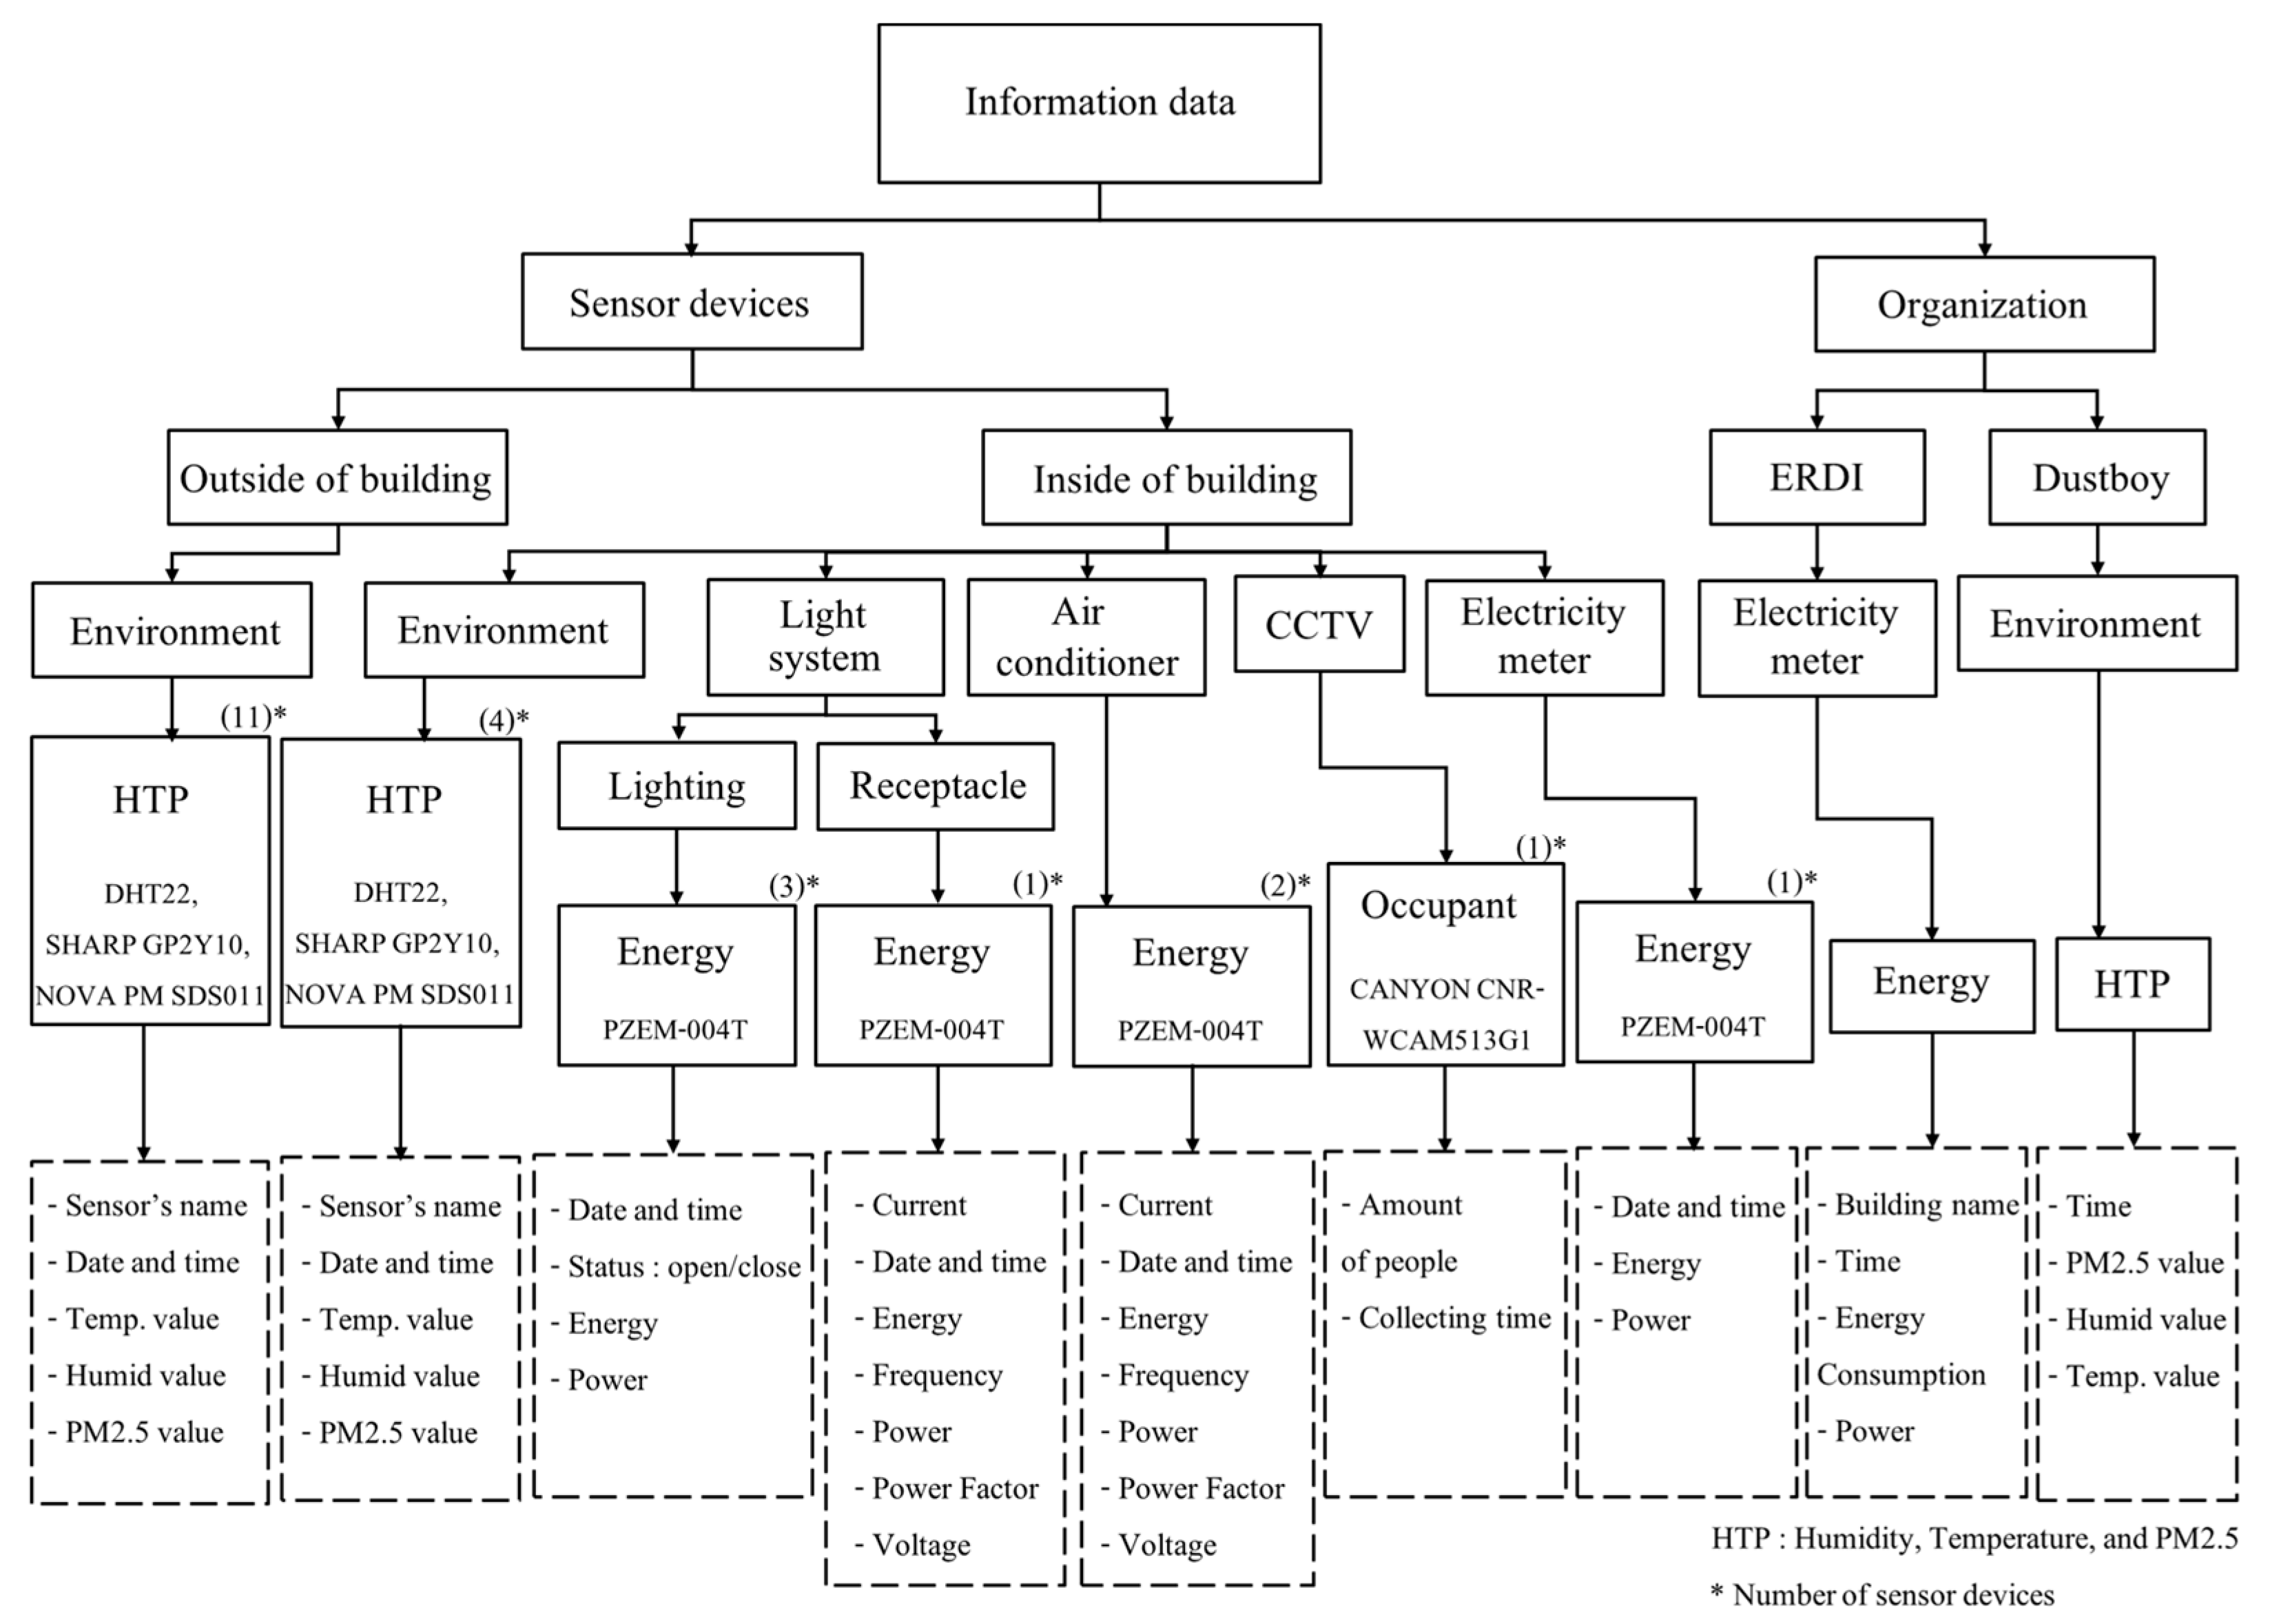
Figure 4 illustrates how sensor information is grouped into three types: (1) External environmental sensors for PM2.5, temperature, and humidity; (2) indoor sensors for environmental conditions, power usage, and occupancy; and (3) institutional datasets from ERDI and Dustboy. These categorizations guide subsequent processing and visualization strategies.
To enable complete interoperability between Autodesk Revit and SuperMap iDesktop, a four-step algorithm was developed:
- 1.
Three-Dimensional Model Generation: Using Revit to create LOD 300 building models from architectural drawings. Only architectural elements, doors, windows, and energy-use components (e.g., air conditioning (AC) units, lighting) are modeled to minimize data load and enhance rendering performance (
Figure 5).
- 2.
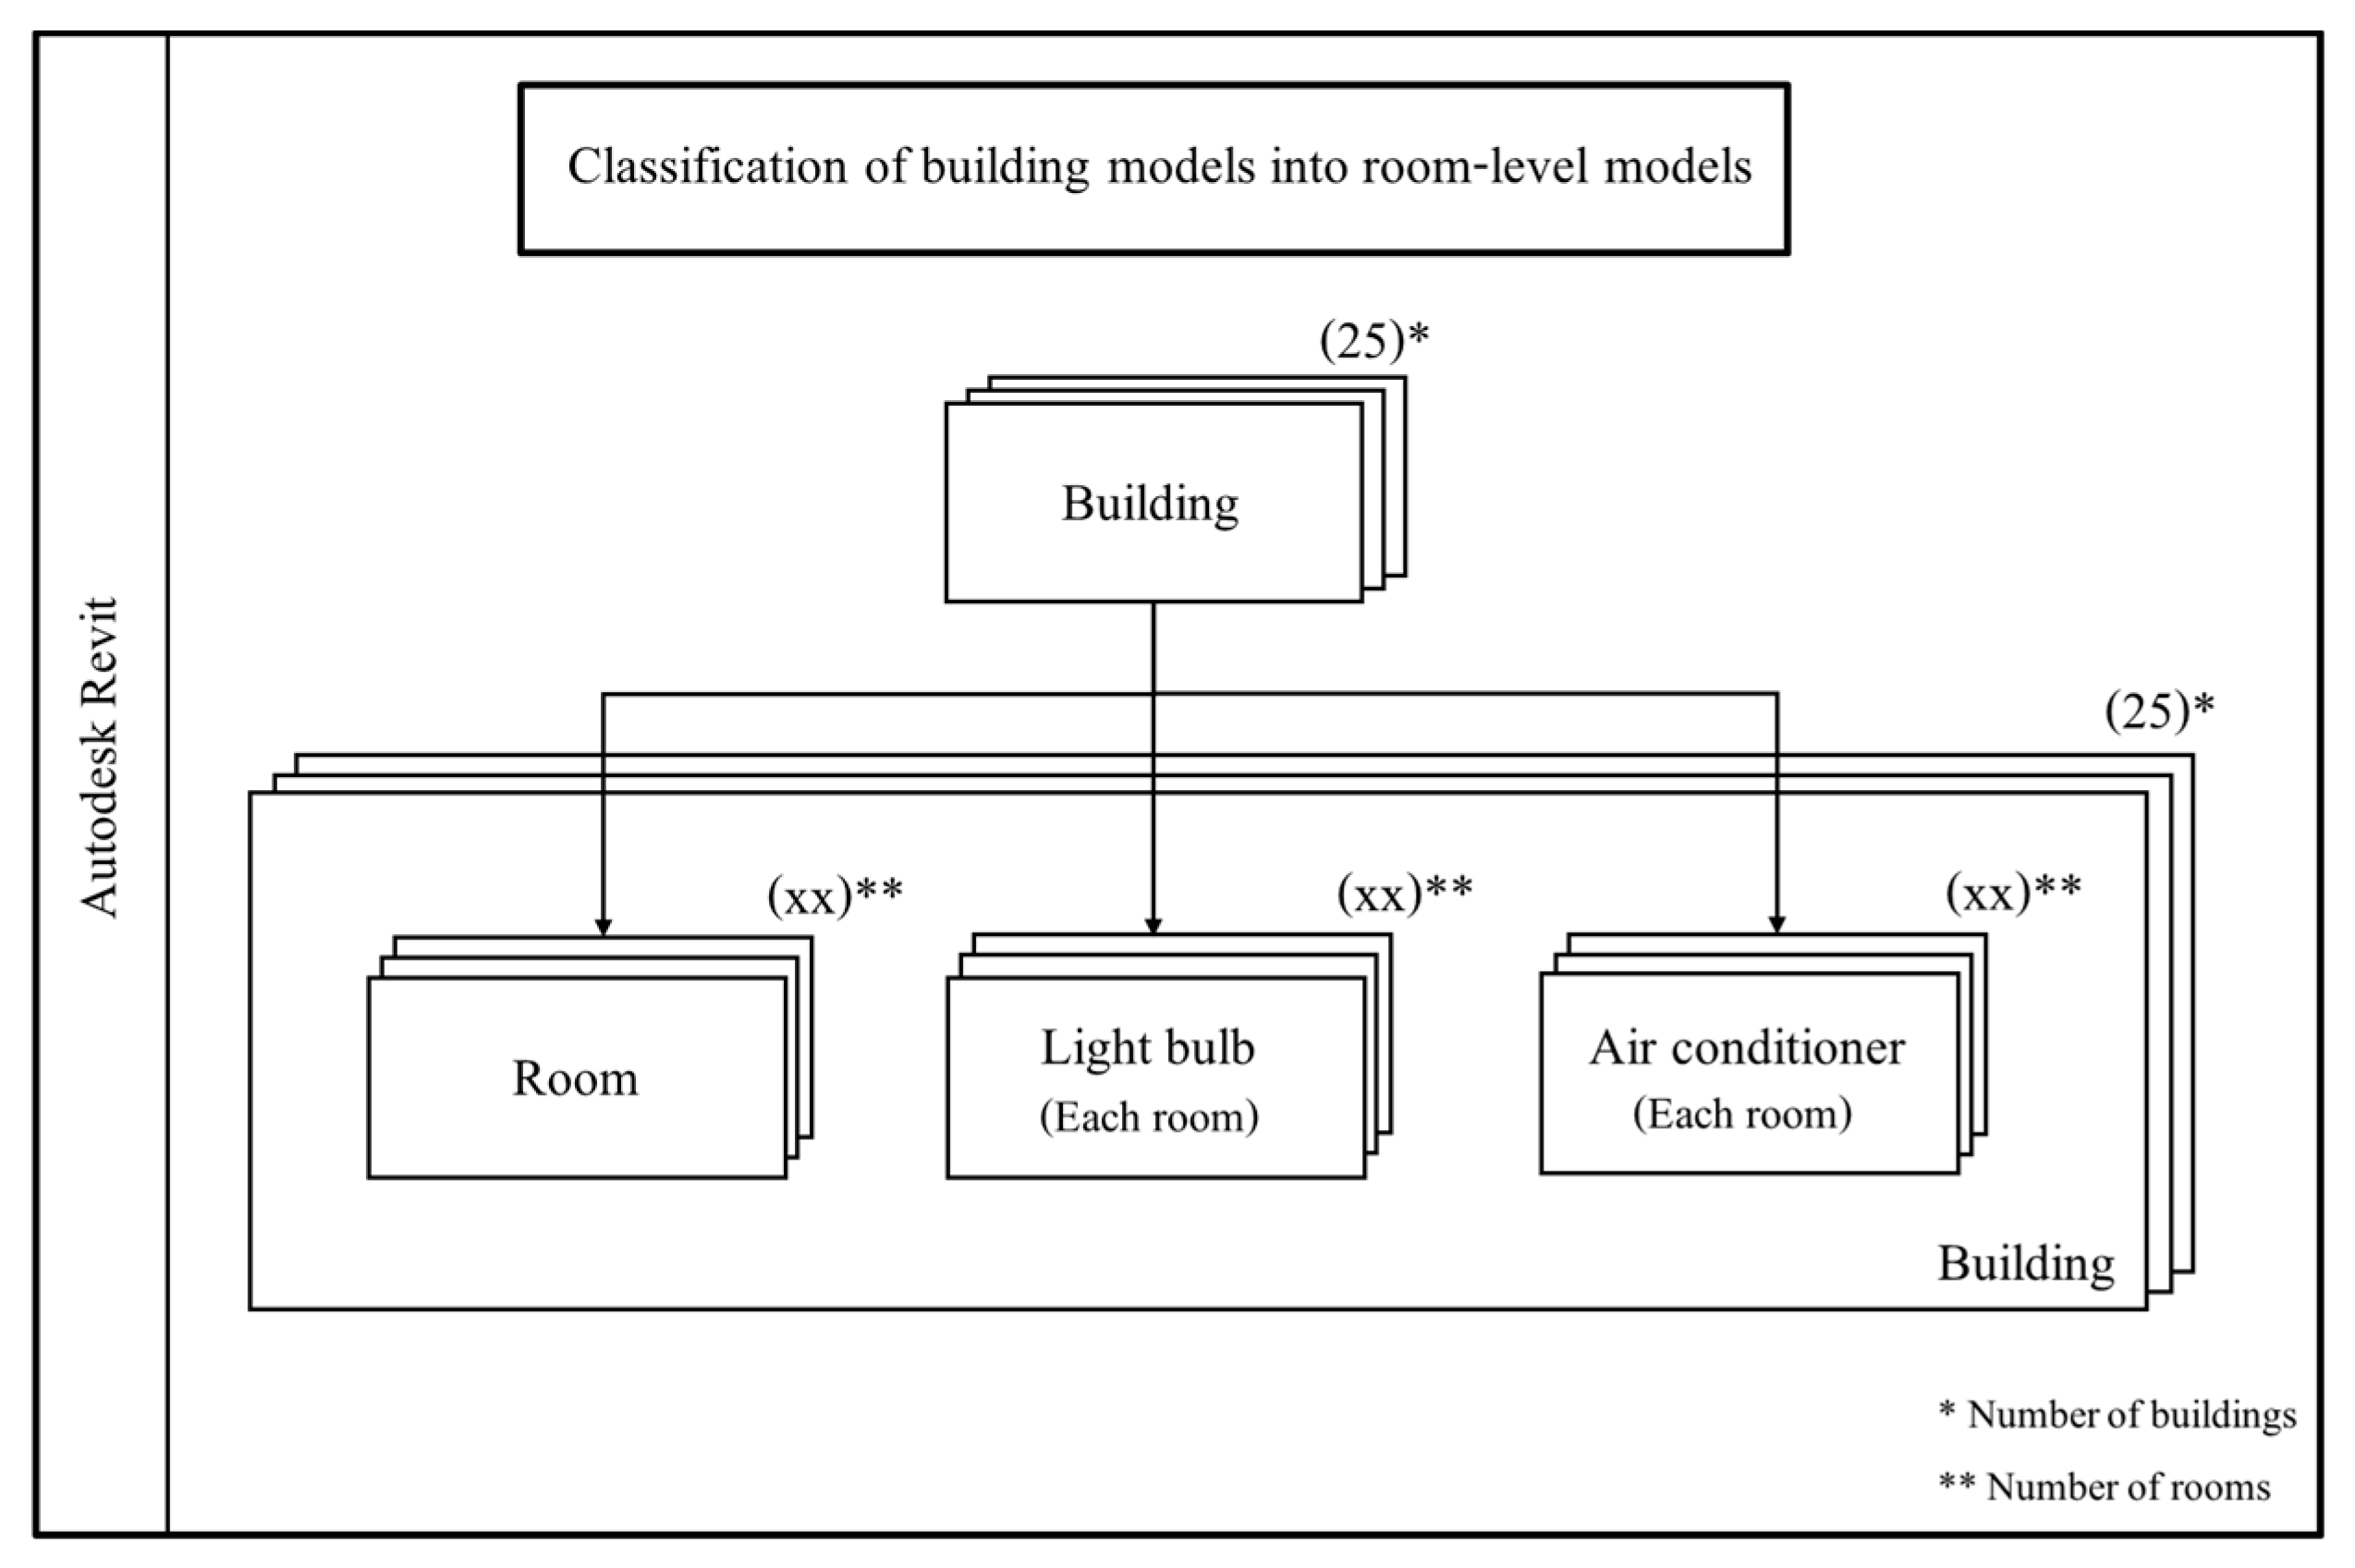
Room-Level Model Segmentation: Models are segmented into rooms using Revit, allowing greater flexibility in object selection and linking with sensor data.
- 3.
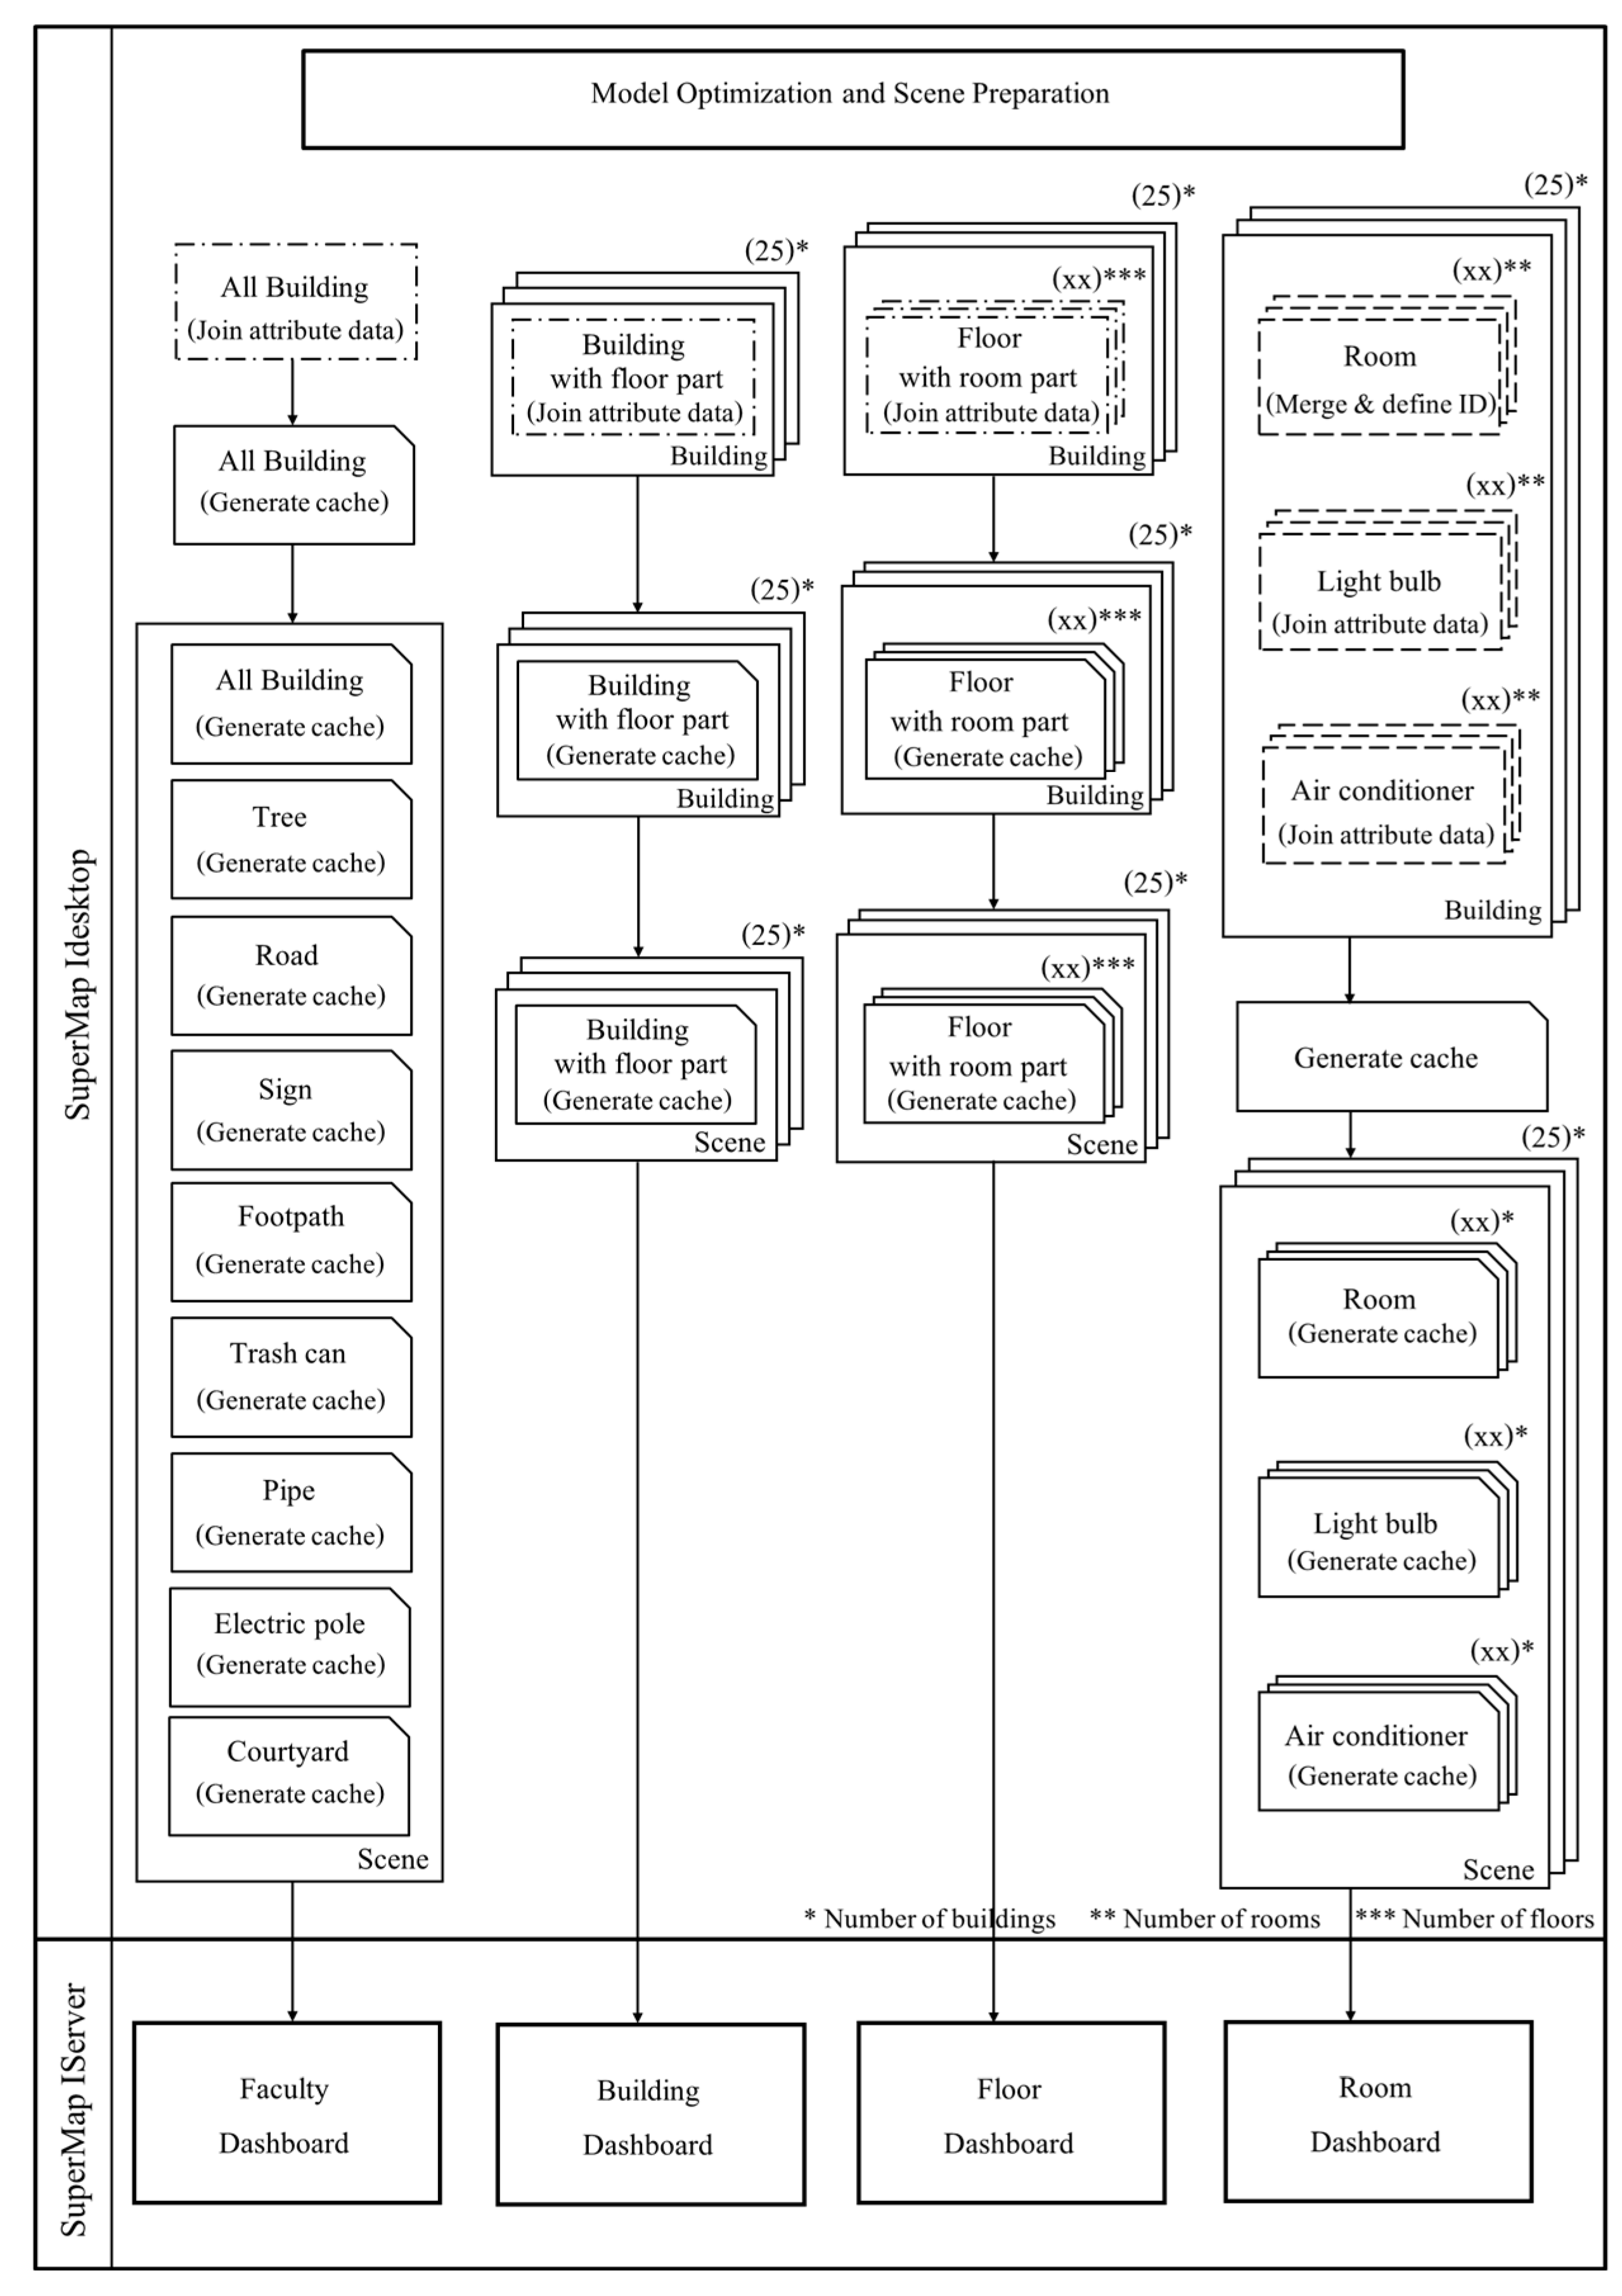
Data Grouping for Dashboard Levels: Data are grouped into four layers for visualization—faculty-level, building-level, floor-level, and room-level. Merged model parts are tagged with unique identifiers (IDs) and joined with attribute tables for Application Programming Interface (API) access (
Figure 6 and
Figure 7).
- 4.
Model Optimization and Scene Preparation: To reduce system load, models are optimized using the Generate Cache process in SuperMap. Cache files are deployed into Scenes for initial testing before final transfer to the SuperMap iServer 10i(2021) SP1 (
Figure 8).
After completing the data processing pipeline, the structured physical data is deployed to an online database hosted on the SuperMap iServer platform. This setup facilitates seamless data access through standardized API endpoints, enabling efficient integration with web-based interfaces and real-time visualization dashboards.
4. Results and Discussion
This section presents the outcomes of each key phase in developing the digital twin system for smart campus management at the Faculty of Engineering, Chiang Mai University, following the same order as the methodology.
4.1. Results of Data Collection and Requirement Analysis
In January 2022, the research team conducted a series of requirement analysis interviews with two primary stakeholder groups at the Faculty of Engineering, Chiang Mai University: (1) building resource management personnel and (2) maintenance technicians. The interview protocol and questionnaire were structured around eight core facility management system modules identified during the initial planning phase.
Responses from both groups were compiled, analyzed, and synthesized to identify shared priorities and domain-specific requirements. The results are summarized in
Table 3, which presents the prioritized needs of each stakeholder group and provides a comparative overview of functional expectations to inform platform design and sensor deployment strategies.
In our case study, “overall energy usage” refers specifically to electricity consumption across 25 faculty buildings, as heating loads are negligible in this climatic region. Stakeholders prioritized energy management because electricity accounts for the largest share of operating costs, mainly driven by HVAC systems (Science and Technology Park, Chiang Mai University, Chiang Mai, Thailand) and lighting demand.
The results of the stakeholder requirement survey directly influenced the system design. The top priority identified was visualizing physical data alongside energy and environmental information collected from sensors. Consequently, the dashboard design highlights these datasets as the primary display. The second priority was including a maintenance alert system, which necessitated data collection on electrical appliances and building equipment. The third priority, water flow tracking, presented significant challenges, as modeling and collecting data on the building’s entire piping system would be resource-intensive and difficult to achieve. Therefore, this requirement was considered a potential development path for future expansion, alongside other secondary needs.
Stakeholders ranked energy management as the highest-priority functional requirement, reflecting its dominant contribution to total operating costs. Although precise cost breakdowns vary by building, electricity expenditures typically account for 60–70% of operating budgets in campus facilities, consistent with values reported in the literature. The second-ranked requirement, maintenance alerts, was associated with extending equipment life cycles and reducing unexpected repair costs. At the same time, water flow tracking, although less prioritized, was recognized as a potential area for long-term sustainability planning.
4.2. Results of 3D Model Creation
The research team collected and processed a range of physical data, which was categorized into two-dimensional (2D) and 3D spatial data:
Two-Dimensional Data: Includes land cover, height maps, tree data, and road networks. Tools like QGIS were used to digitize, georeference, and convert raw inputs into shapefiles for import into platform. Land use data was classified into six categories: buildings, roads, trees, grass, parking lots, and soil.
Three-Dimensional Data: Building construction drawings were converted to LOD 300 models using Autodesk Revit. For areas without plans, drone imagery was used to construct external 3D meshes. Additional infrastructure models, such as roads and light poles, were developed based on direct measurements.
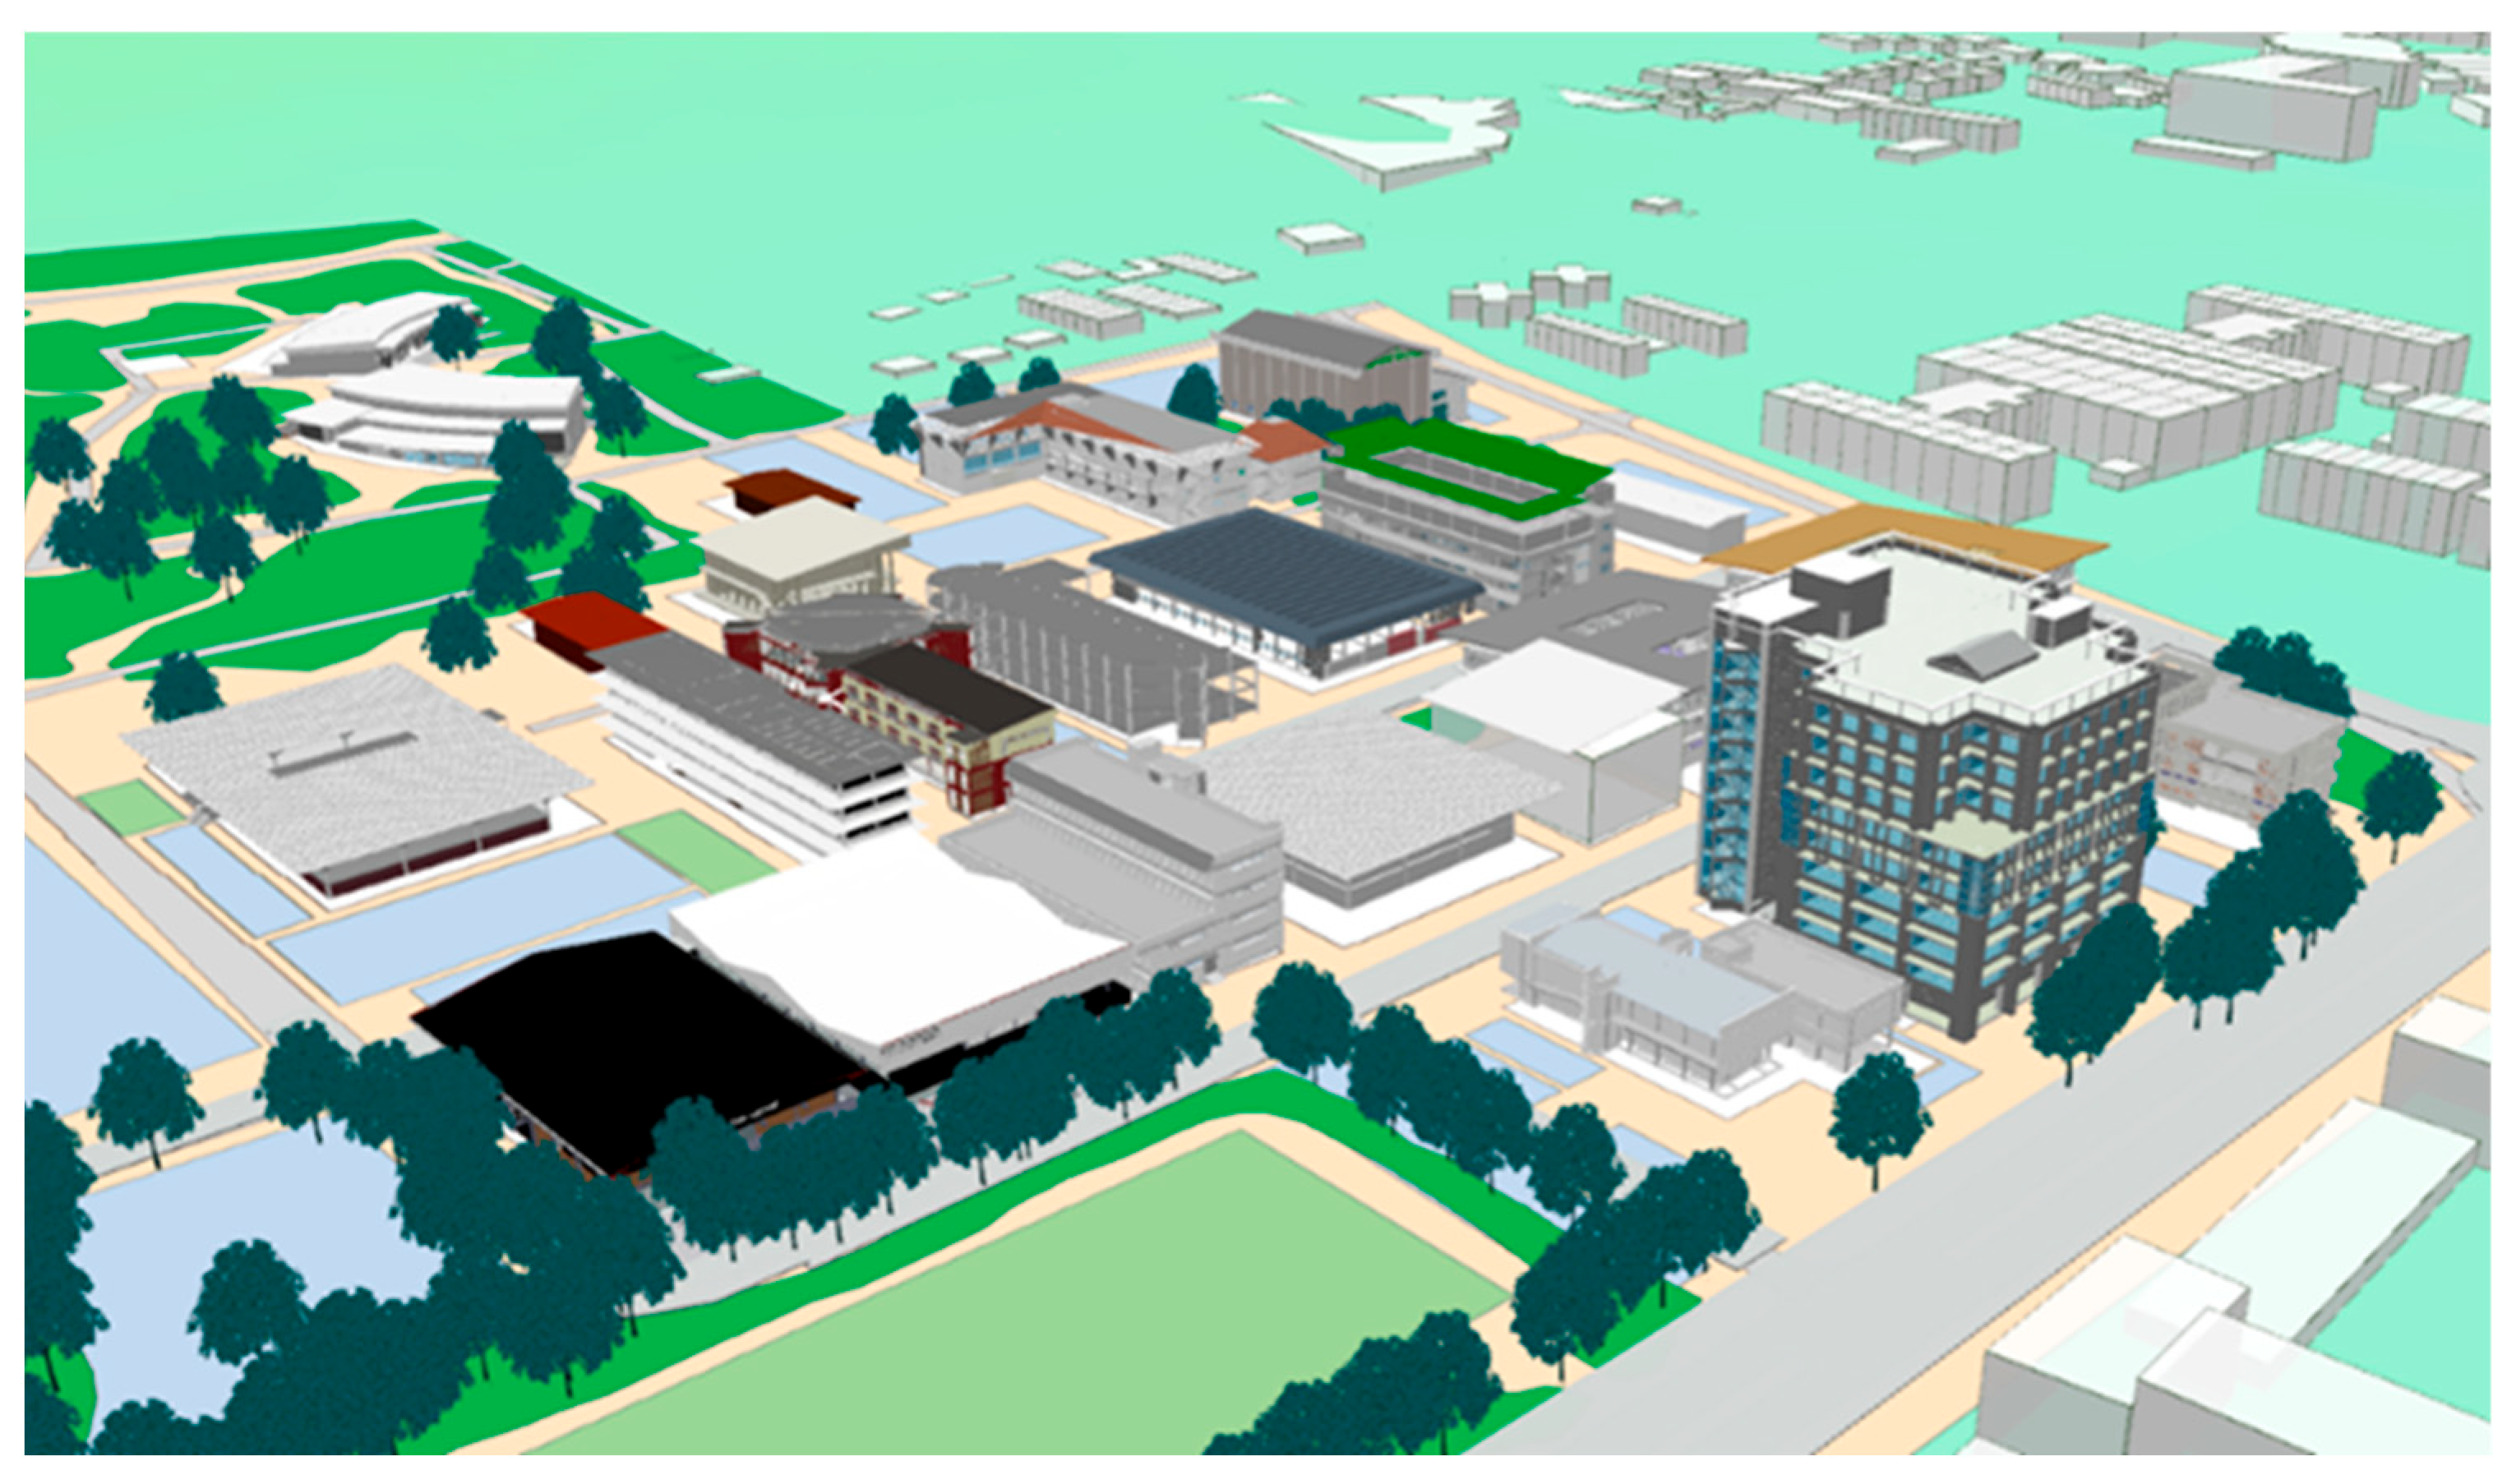
Once created, all models were exported to SuperMap iDesktop. It provided an integrated 3D GIS environment to visualize and manage geographic data attributes, as shown in
Figure 9.
4.3. Results of Sensor Deployment and Data Acquisition
The research team prepared and deployed IoT-based sensors to monitor environmental and electrical data. Key components are present in
Table 4.
Following the deployment of sensor devices across 12 designated locations within the Faculty of Engineering, Chiang Mai University, it became essential to establish a robust database infrastructure to store and manage incoming data before integrating it into the visualization platform. This database serves as a foundation for real-time monitoring and supports downstream analytical applications such as time-series trend analysis, anomaly detection, and predictive modeling using machine learning techniques.
To ensure data accuracy and acquisition stability during the initial testing phase, sensor outputs—including PM2.5, ambient temperature, and relative humidity—were first transmitted to Firebase. Firebase provided a cloud-based real-time interface for performance tracking, rapid validation of sensor functionality, and early-stage debugging.
In addition to data collected from locally installed sensors, the system architecture incorporated
Supplementary Datasets accessed through standardized Application Programming Interfaces (APIs) provided by external partner organizations. These APIs enabled seamless connection to existing remote sensor infrastructures. For example, structured electricity consumption data were retrieved from ERDI via API, allowing direct integration into the dashboard component of the digital twin system. It significantly enriched the visualization layer by adding high-resolution energy usage metrics, enhancing the platform’s capability to support data-driven facility management.
4.4. Results of Data-Linking Algorithm and Dashboard Visualization
The design of appropriate algorithms for linking 3D models and data layers enabled effective dashboard integration, supporting multiscale visualization across faculty, building, floor, and room levels.
- 1.
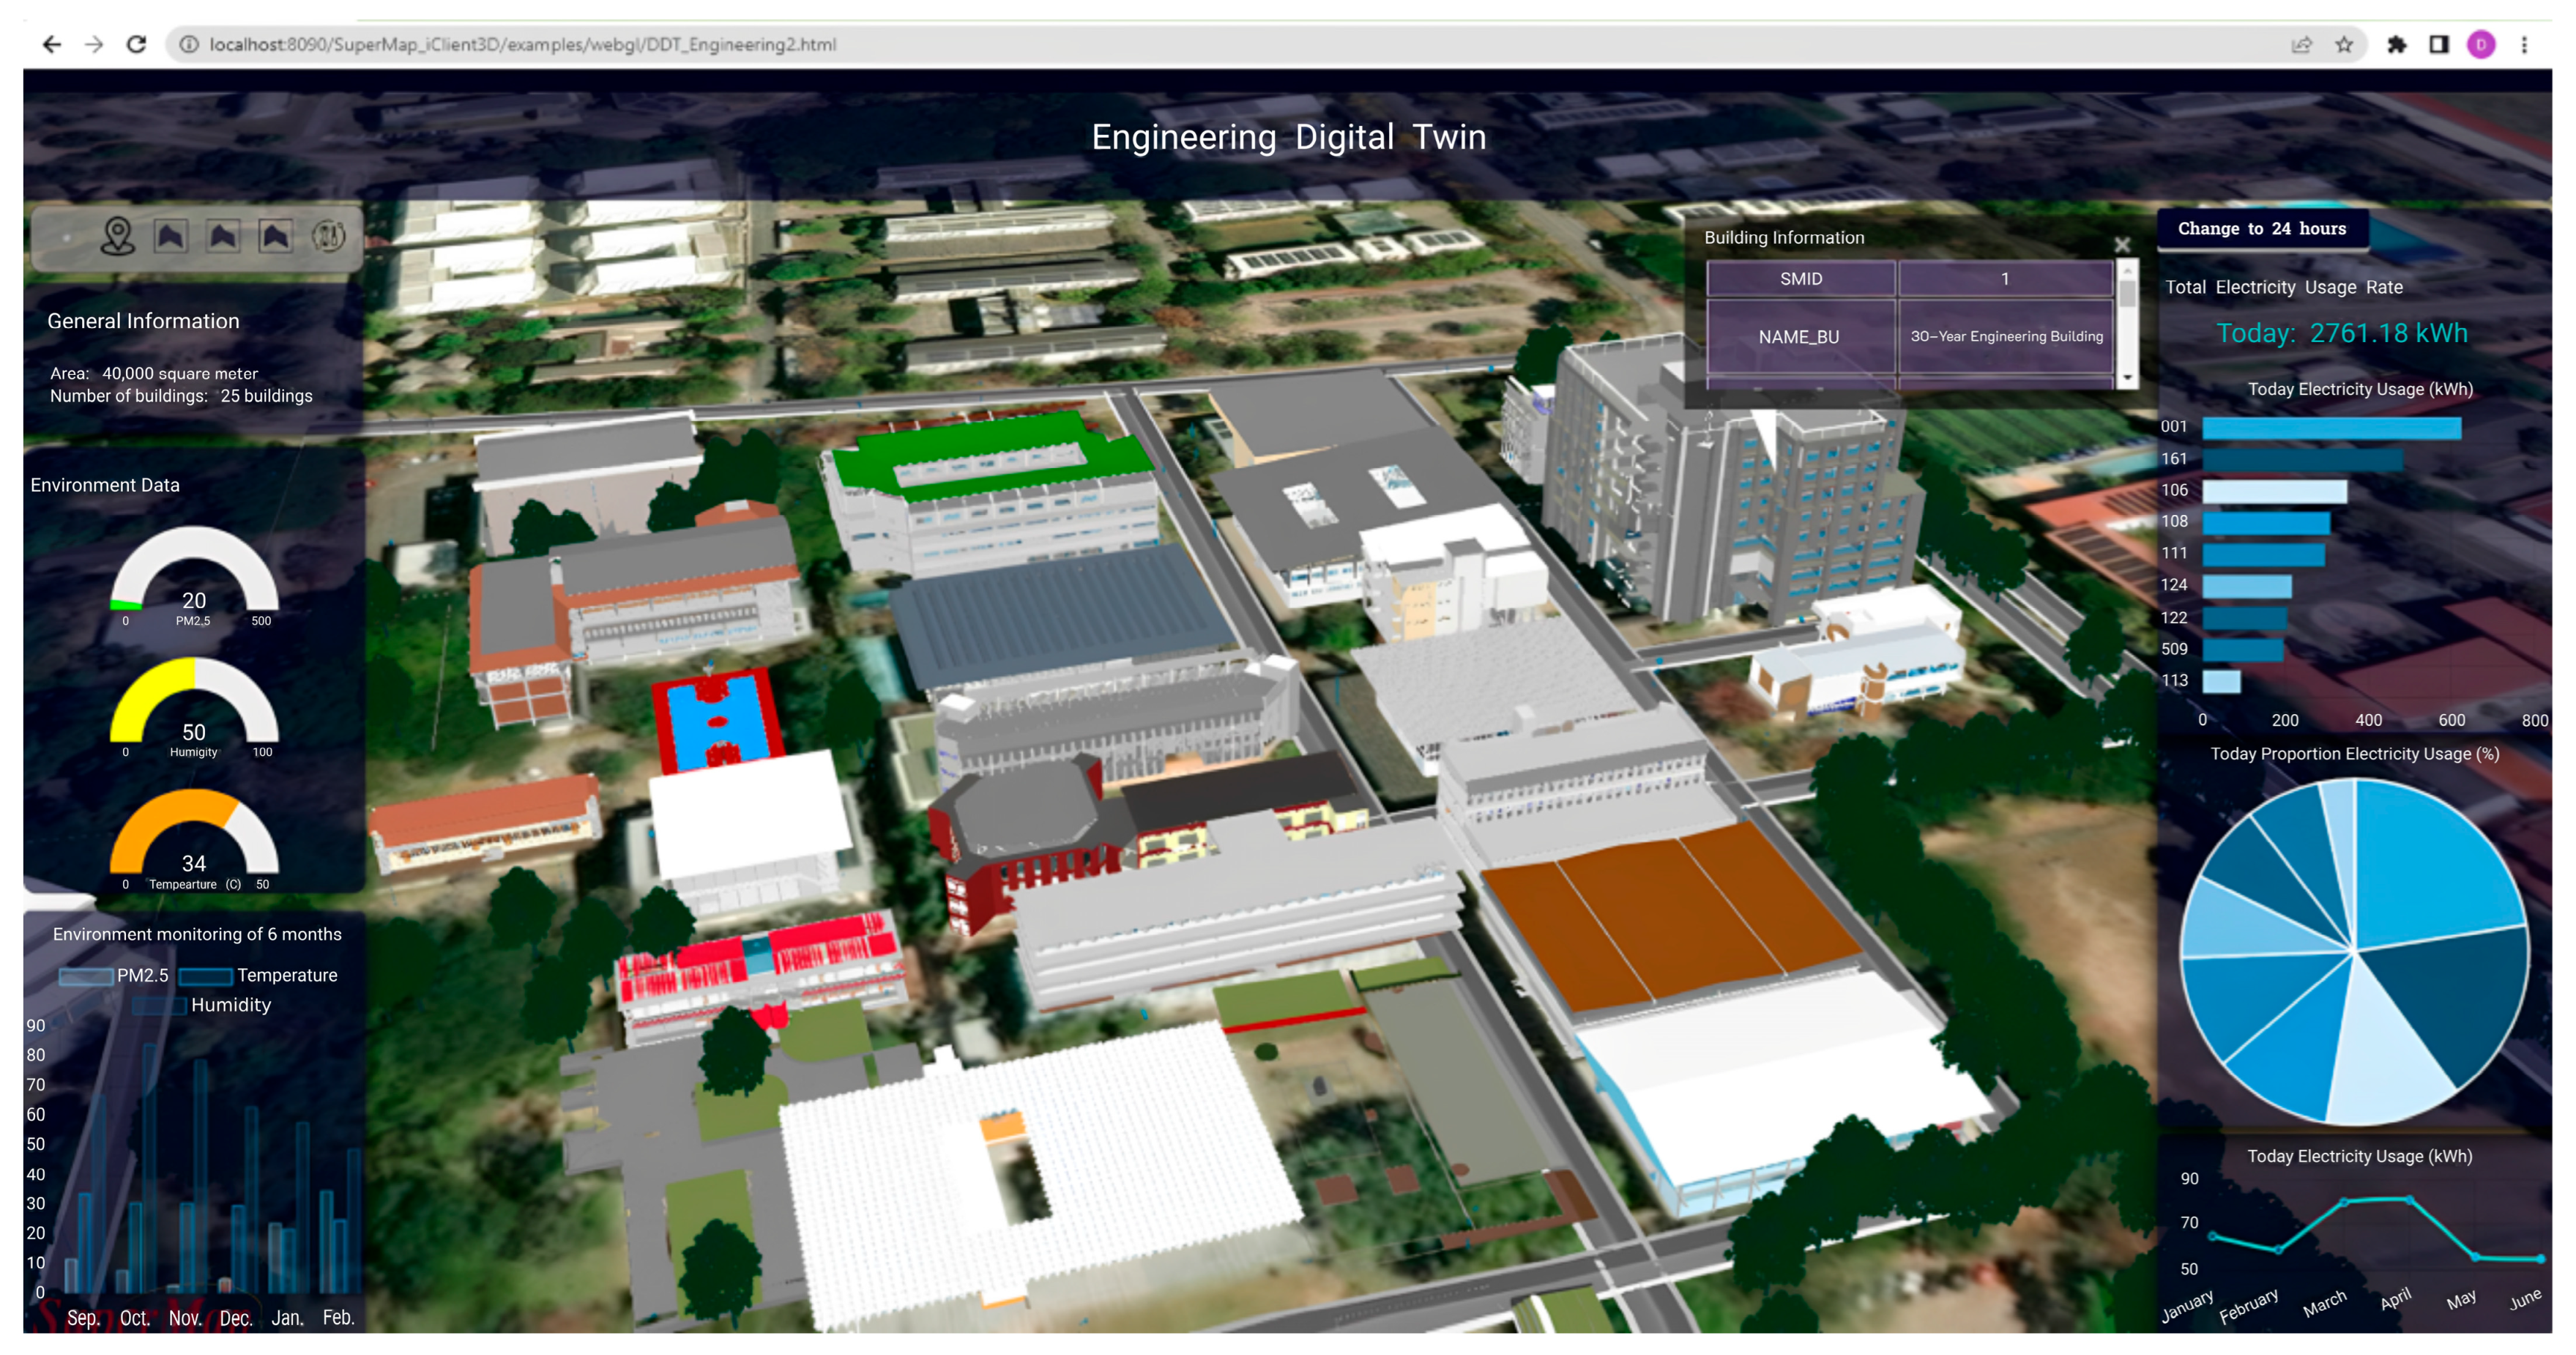
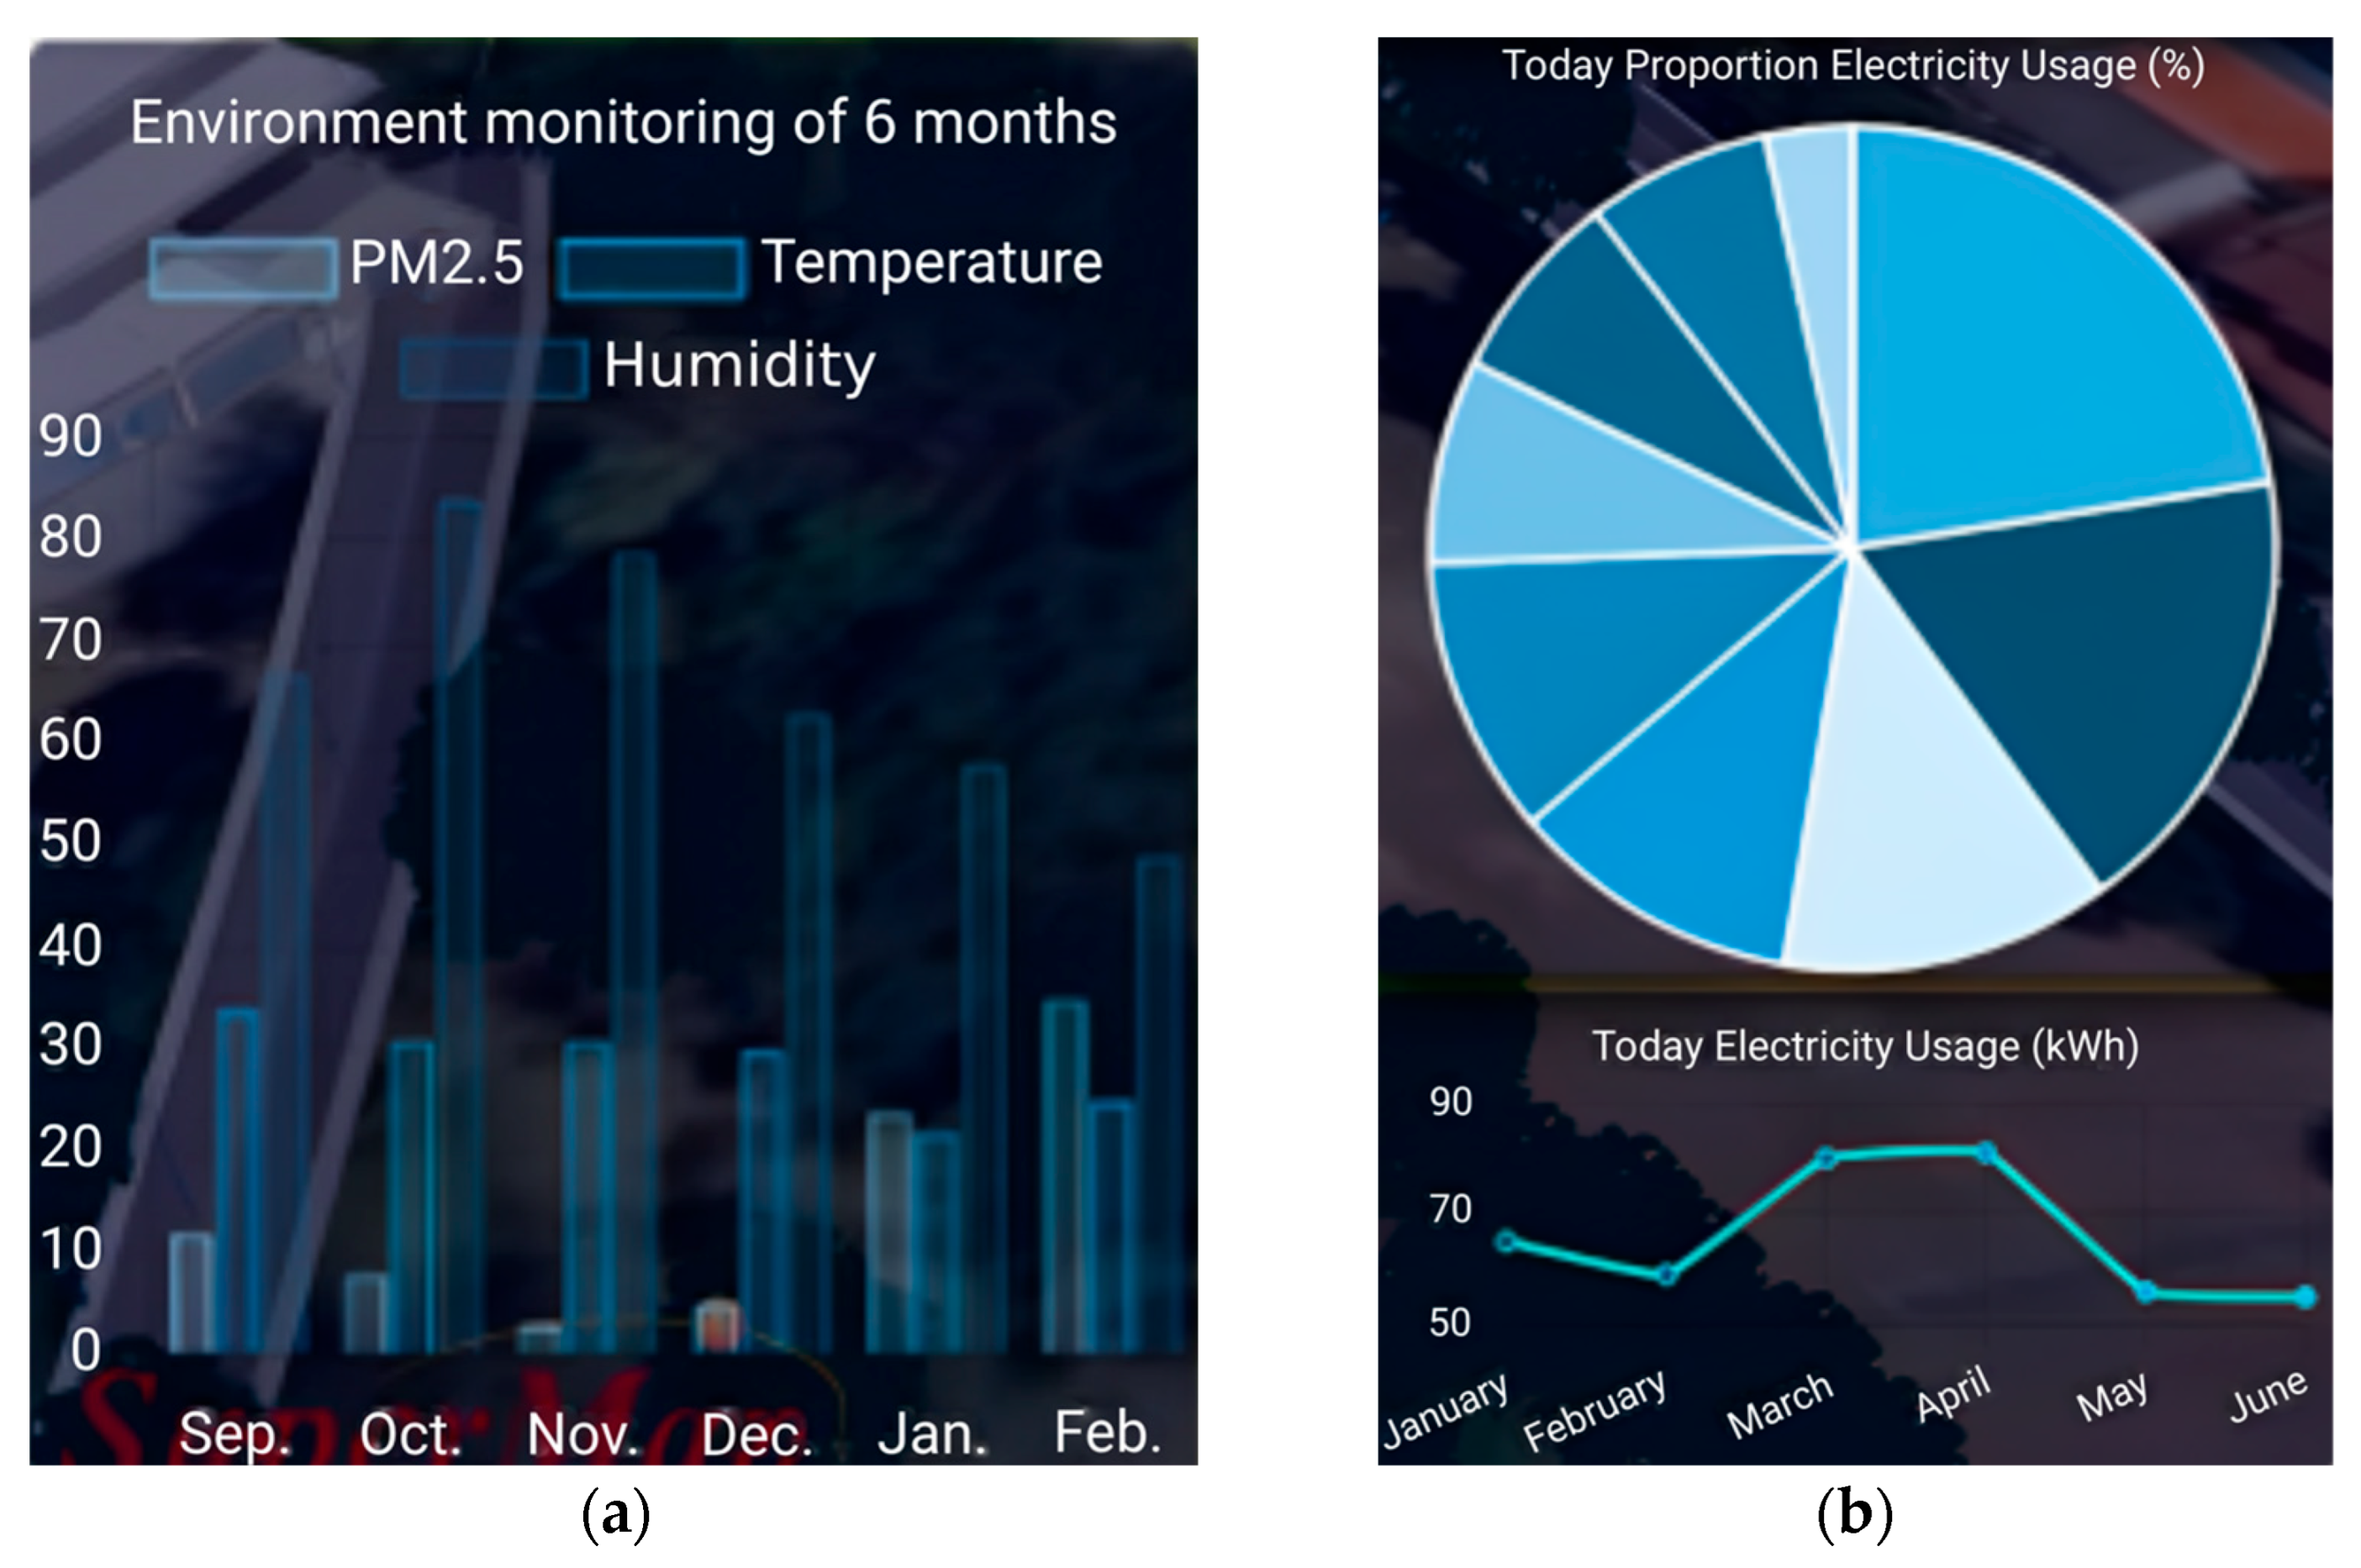
Faculty-Level Dashboard: This dashboard visualizes the entire campus model with building overlays, summarizing sensor data such as PM2.5, temperature, humidity, and total electricity usage. Users can select individual buildings to explore additional details, as shown in
Figure 10 and
Figure 11.
This dashboard is designed to provide a comprehensive overview of the faculty’s overall energy consumption and environmental conditions. It presents average environmental parameters—temperature, relative humidity, and PM2.5—across the entire area, with weekly, monthly, and yearly historical trends shown in graphs on the left side of the dashboard. On the right side, the dashboard displays the overall energy consumption from all 25 buildings within the faculty, including a bar chart that separates the energy consumption by individual building, along with historical trends on weekly, monthly, and yearly scales.
Additional features include a toolbar at the top left, allowing users to toggle between 3D model visualization and GIS-based mapping. It also supports the display of 2D distribution maps of temperature, relative humidity, and PM2.5 and access to an administrative panel for managing electrical equipment. This dashboard serves faculty administrators—who can use it to monitor energy usage and support energy management planning—and other users such as visitors, students, and staff, who can use it to explore the building layout and more easily locate classrooms or rooms of interest.
- 2.
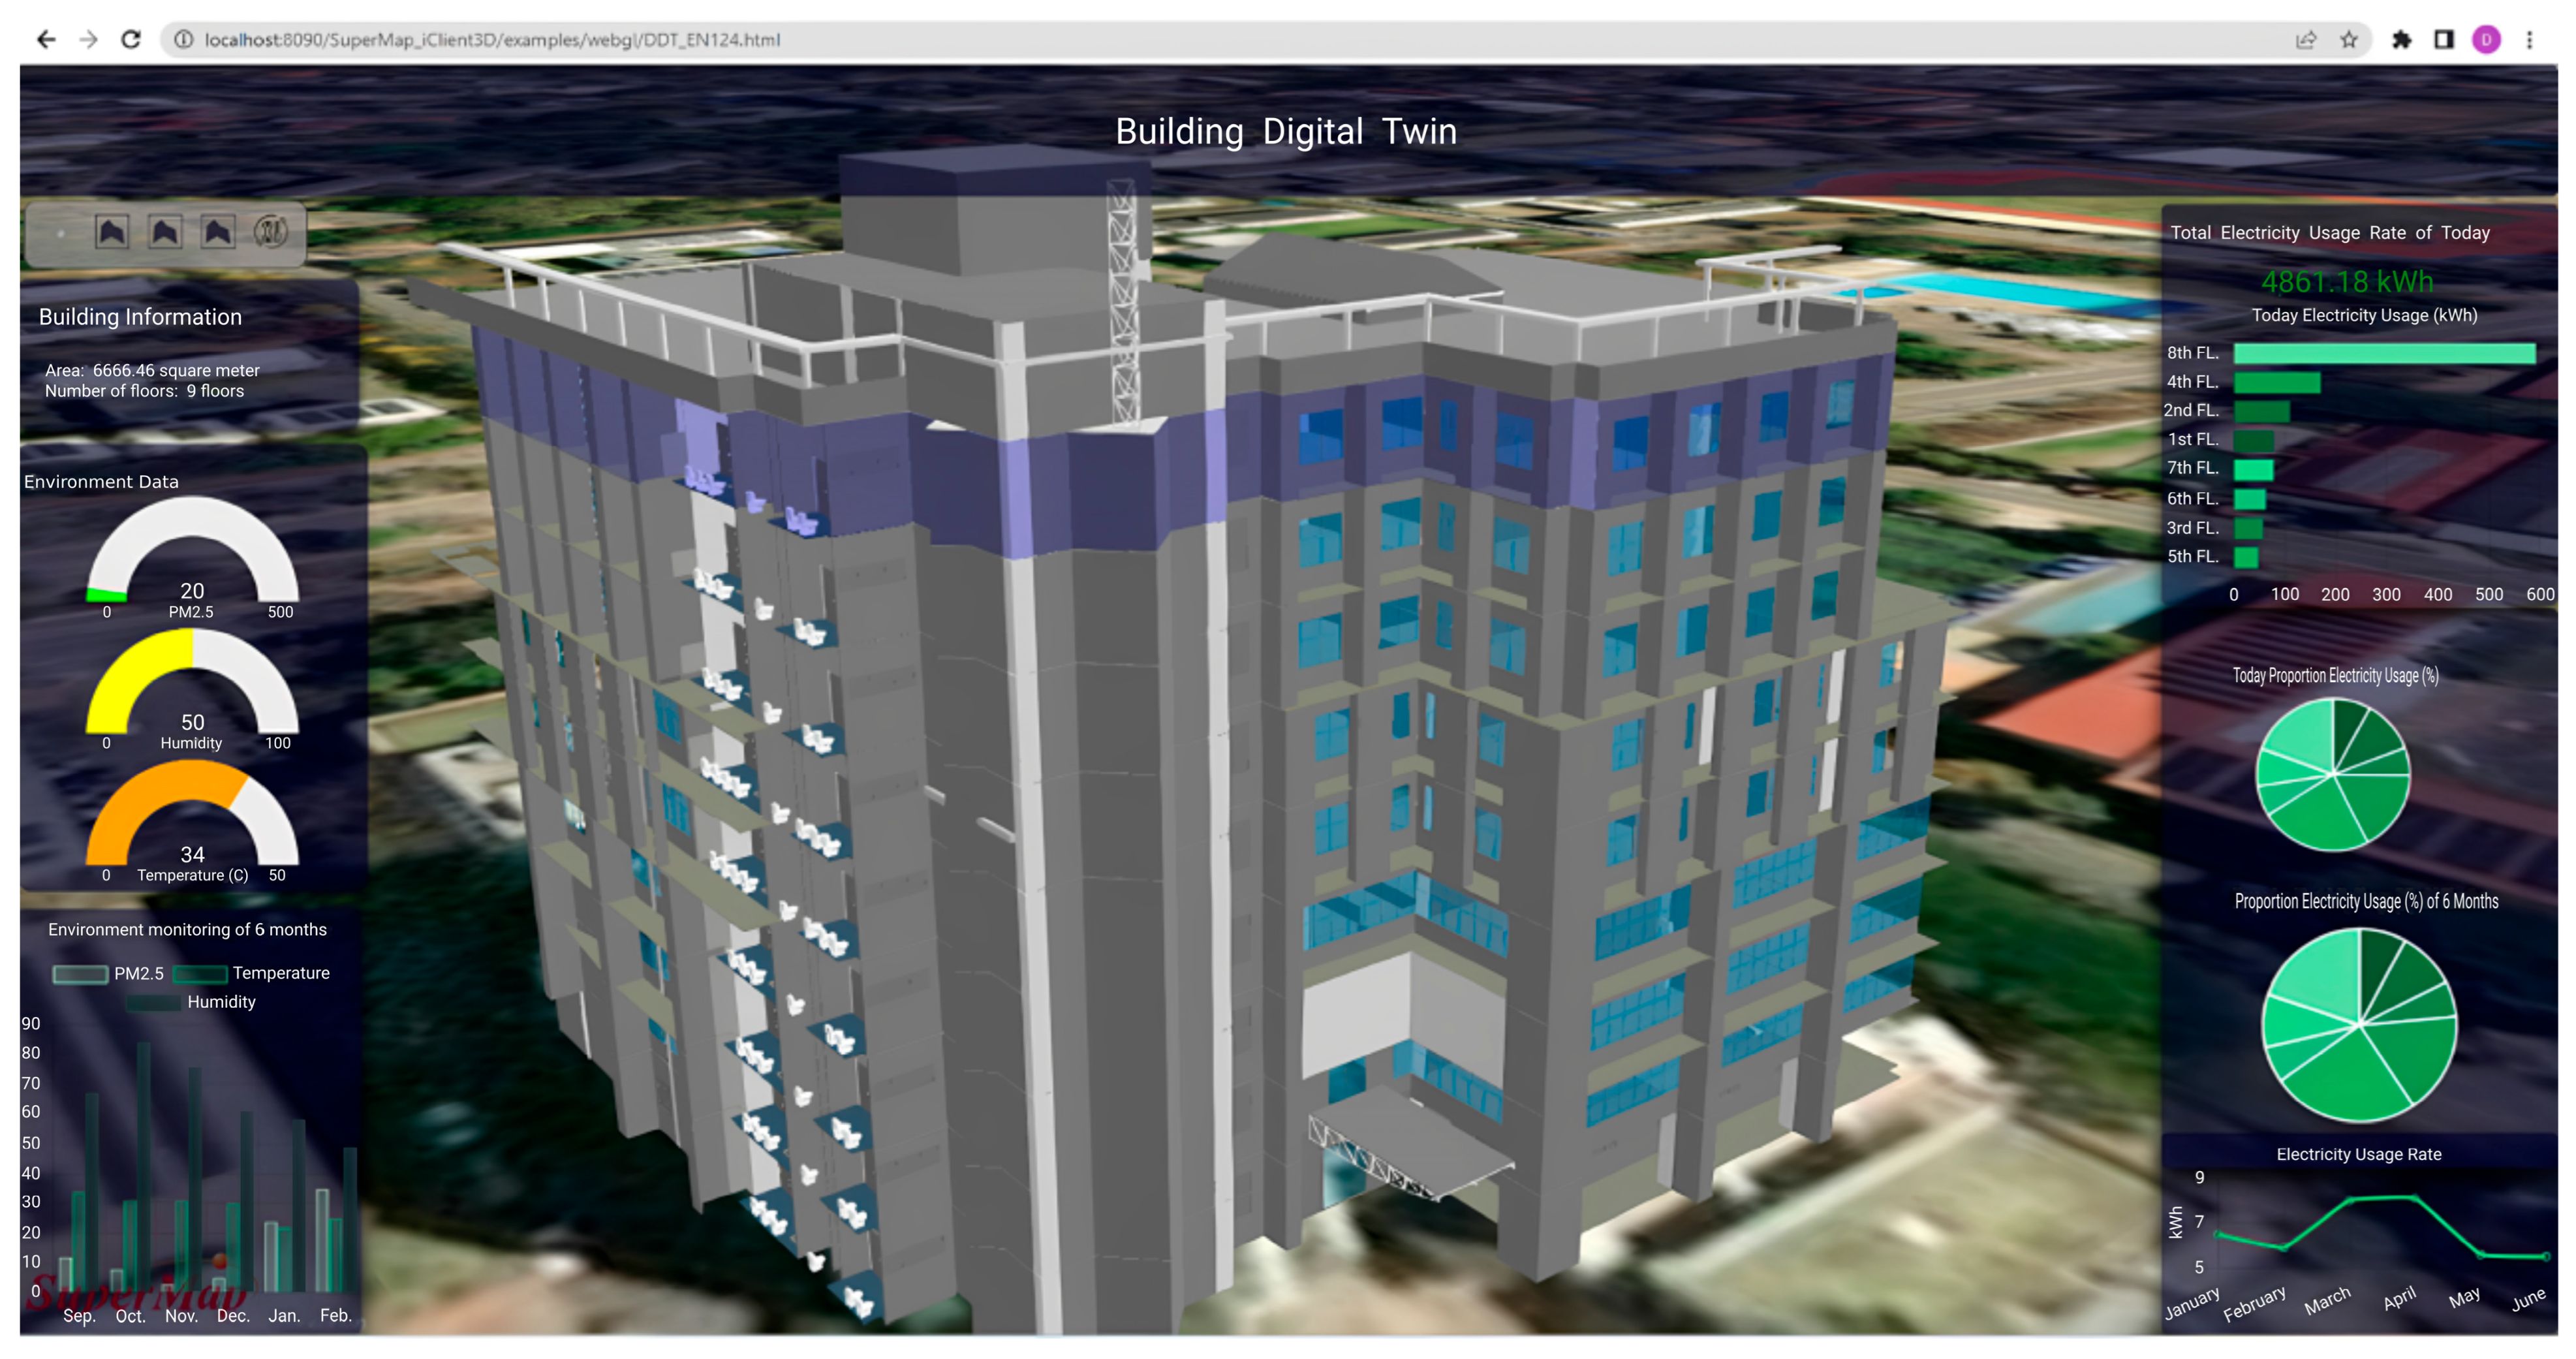
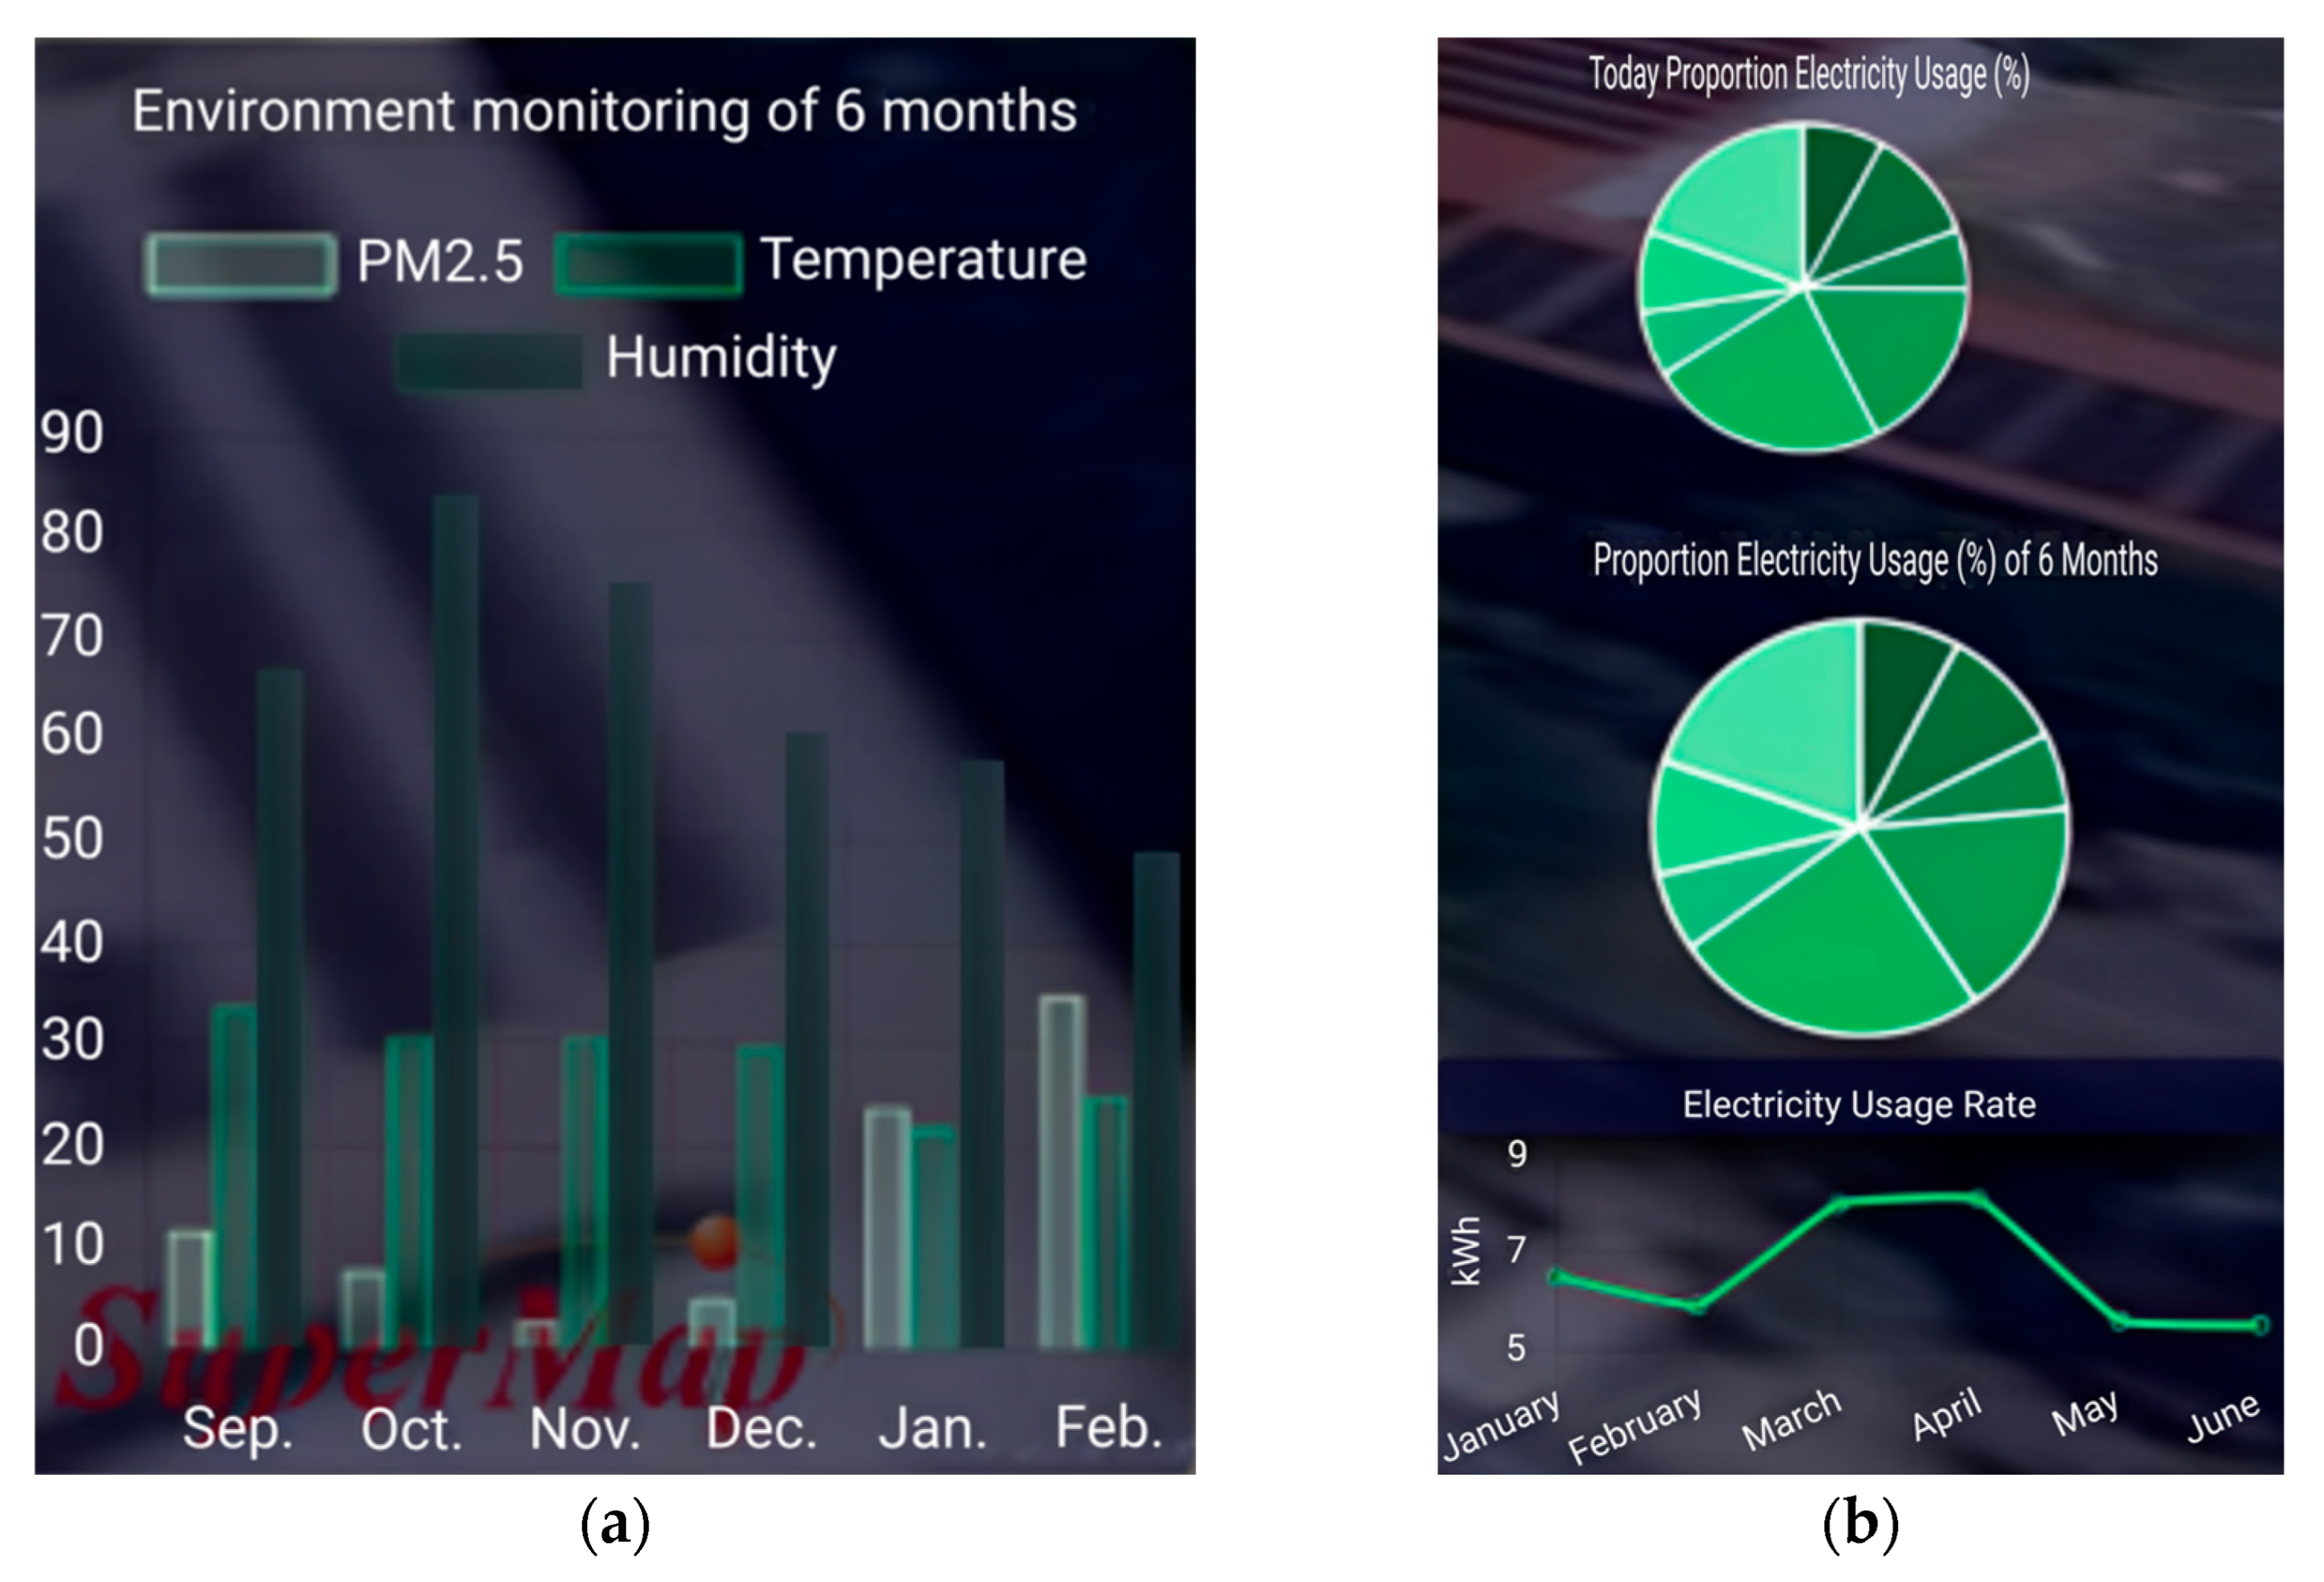
Building-Level Dashboard: This dashboard allows users to select a specific building to display floor-by-floor breakdowns. Users can also access data visualizations of internal environmental readings and power metrics per building, as shown in
Figure 12 and
Figure 13.
The building-level dashboard adopts a similar interface to the faculty-level version. It provides average building-level environmental data on the left side, including temperature, relative humidity, and PM2.5, and overall building energy consumption on the right side. It enables users to analyze and compare energy consumption at the building scale. In addition, the dashboard incorporates bar charts that show detailed energy usage for each floor of the building. Visitors can also use this dashboard to easily navigate and identify specific floors and rooms within the building.
- 3.
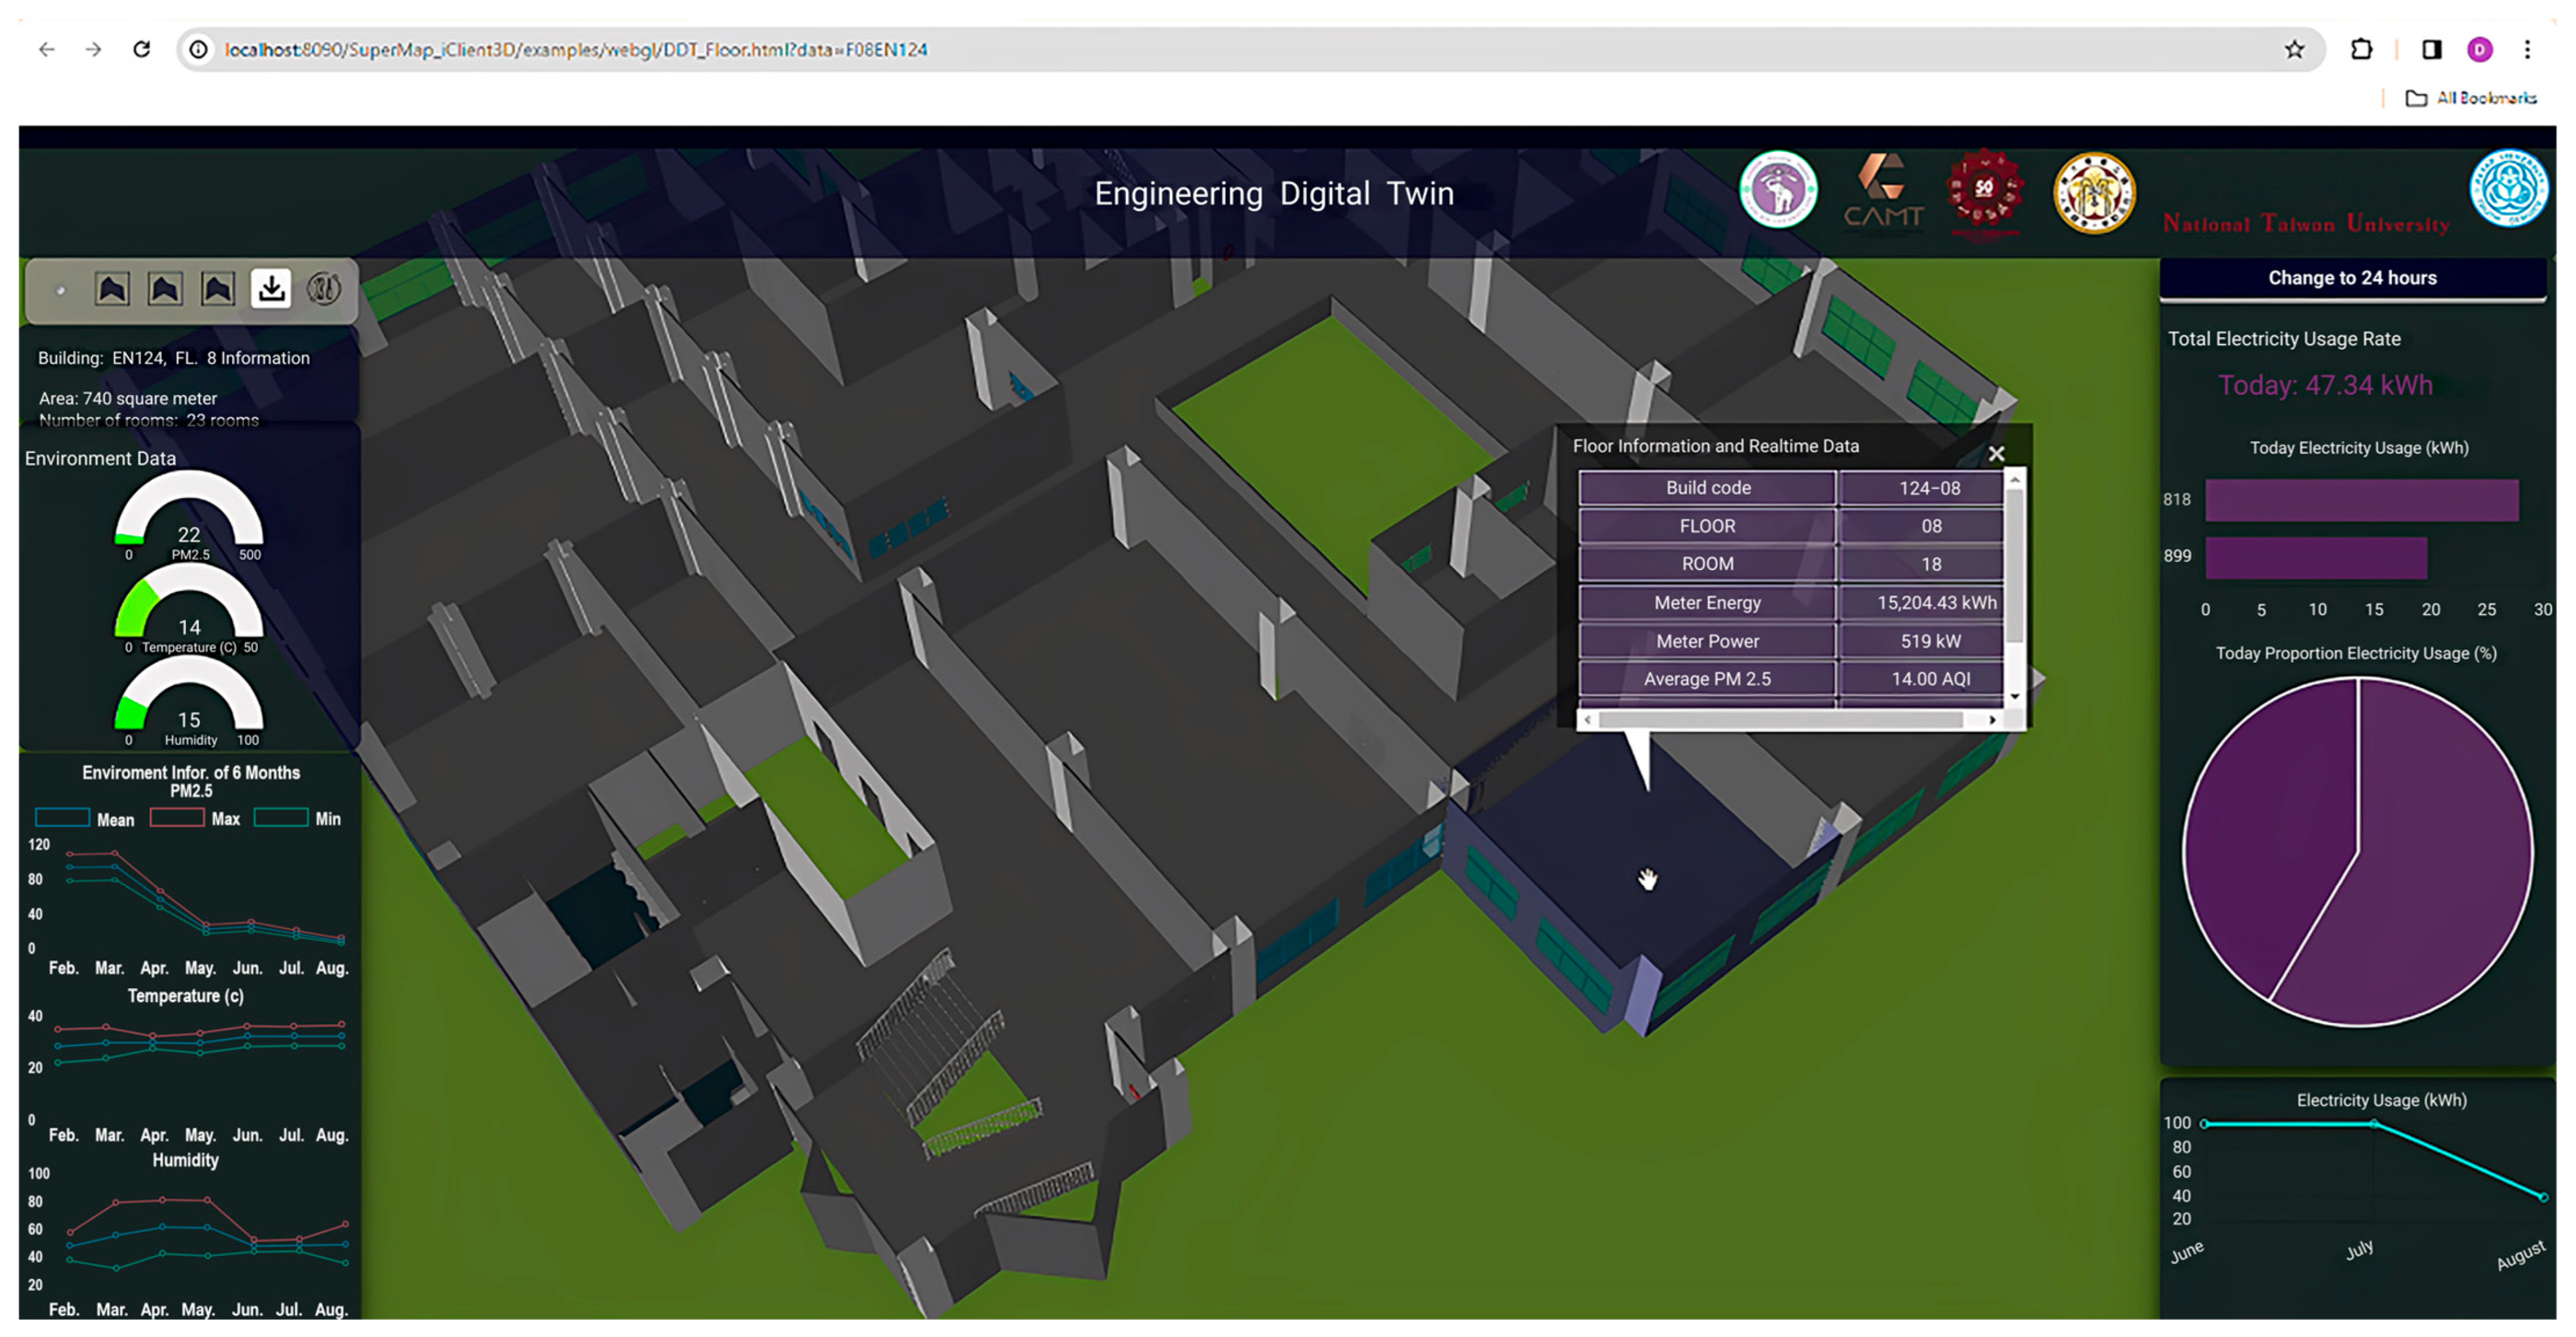
Floor-Level Dashboard: This provides a 3D model view of each floor, highlighting individual rooms and displaying room-specific metrics and real-time sensor values, as shown in
Figure 14.
The floor-level dashboard also shares a consistent interface design with the faculty and building-level dashboards but introduces additional functionalities. A toolbar at the top right lets users download relevant construction floor plans, making this tool particularly useful for maintenance personnel. Moreover, the 3D models are integrated with environmental data, enabling visualization of temperature, relative humidity, and PM2.5 values through dynamic color shading. This feature helps users understand the environmental conditions of individual rooms on the floor (
Figure 15).
- 4.
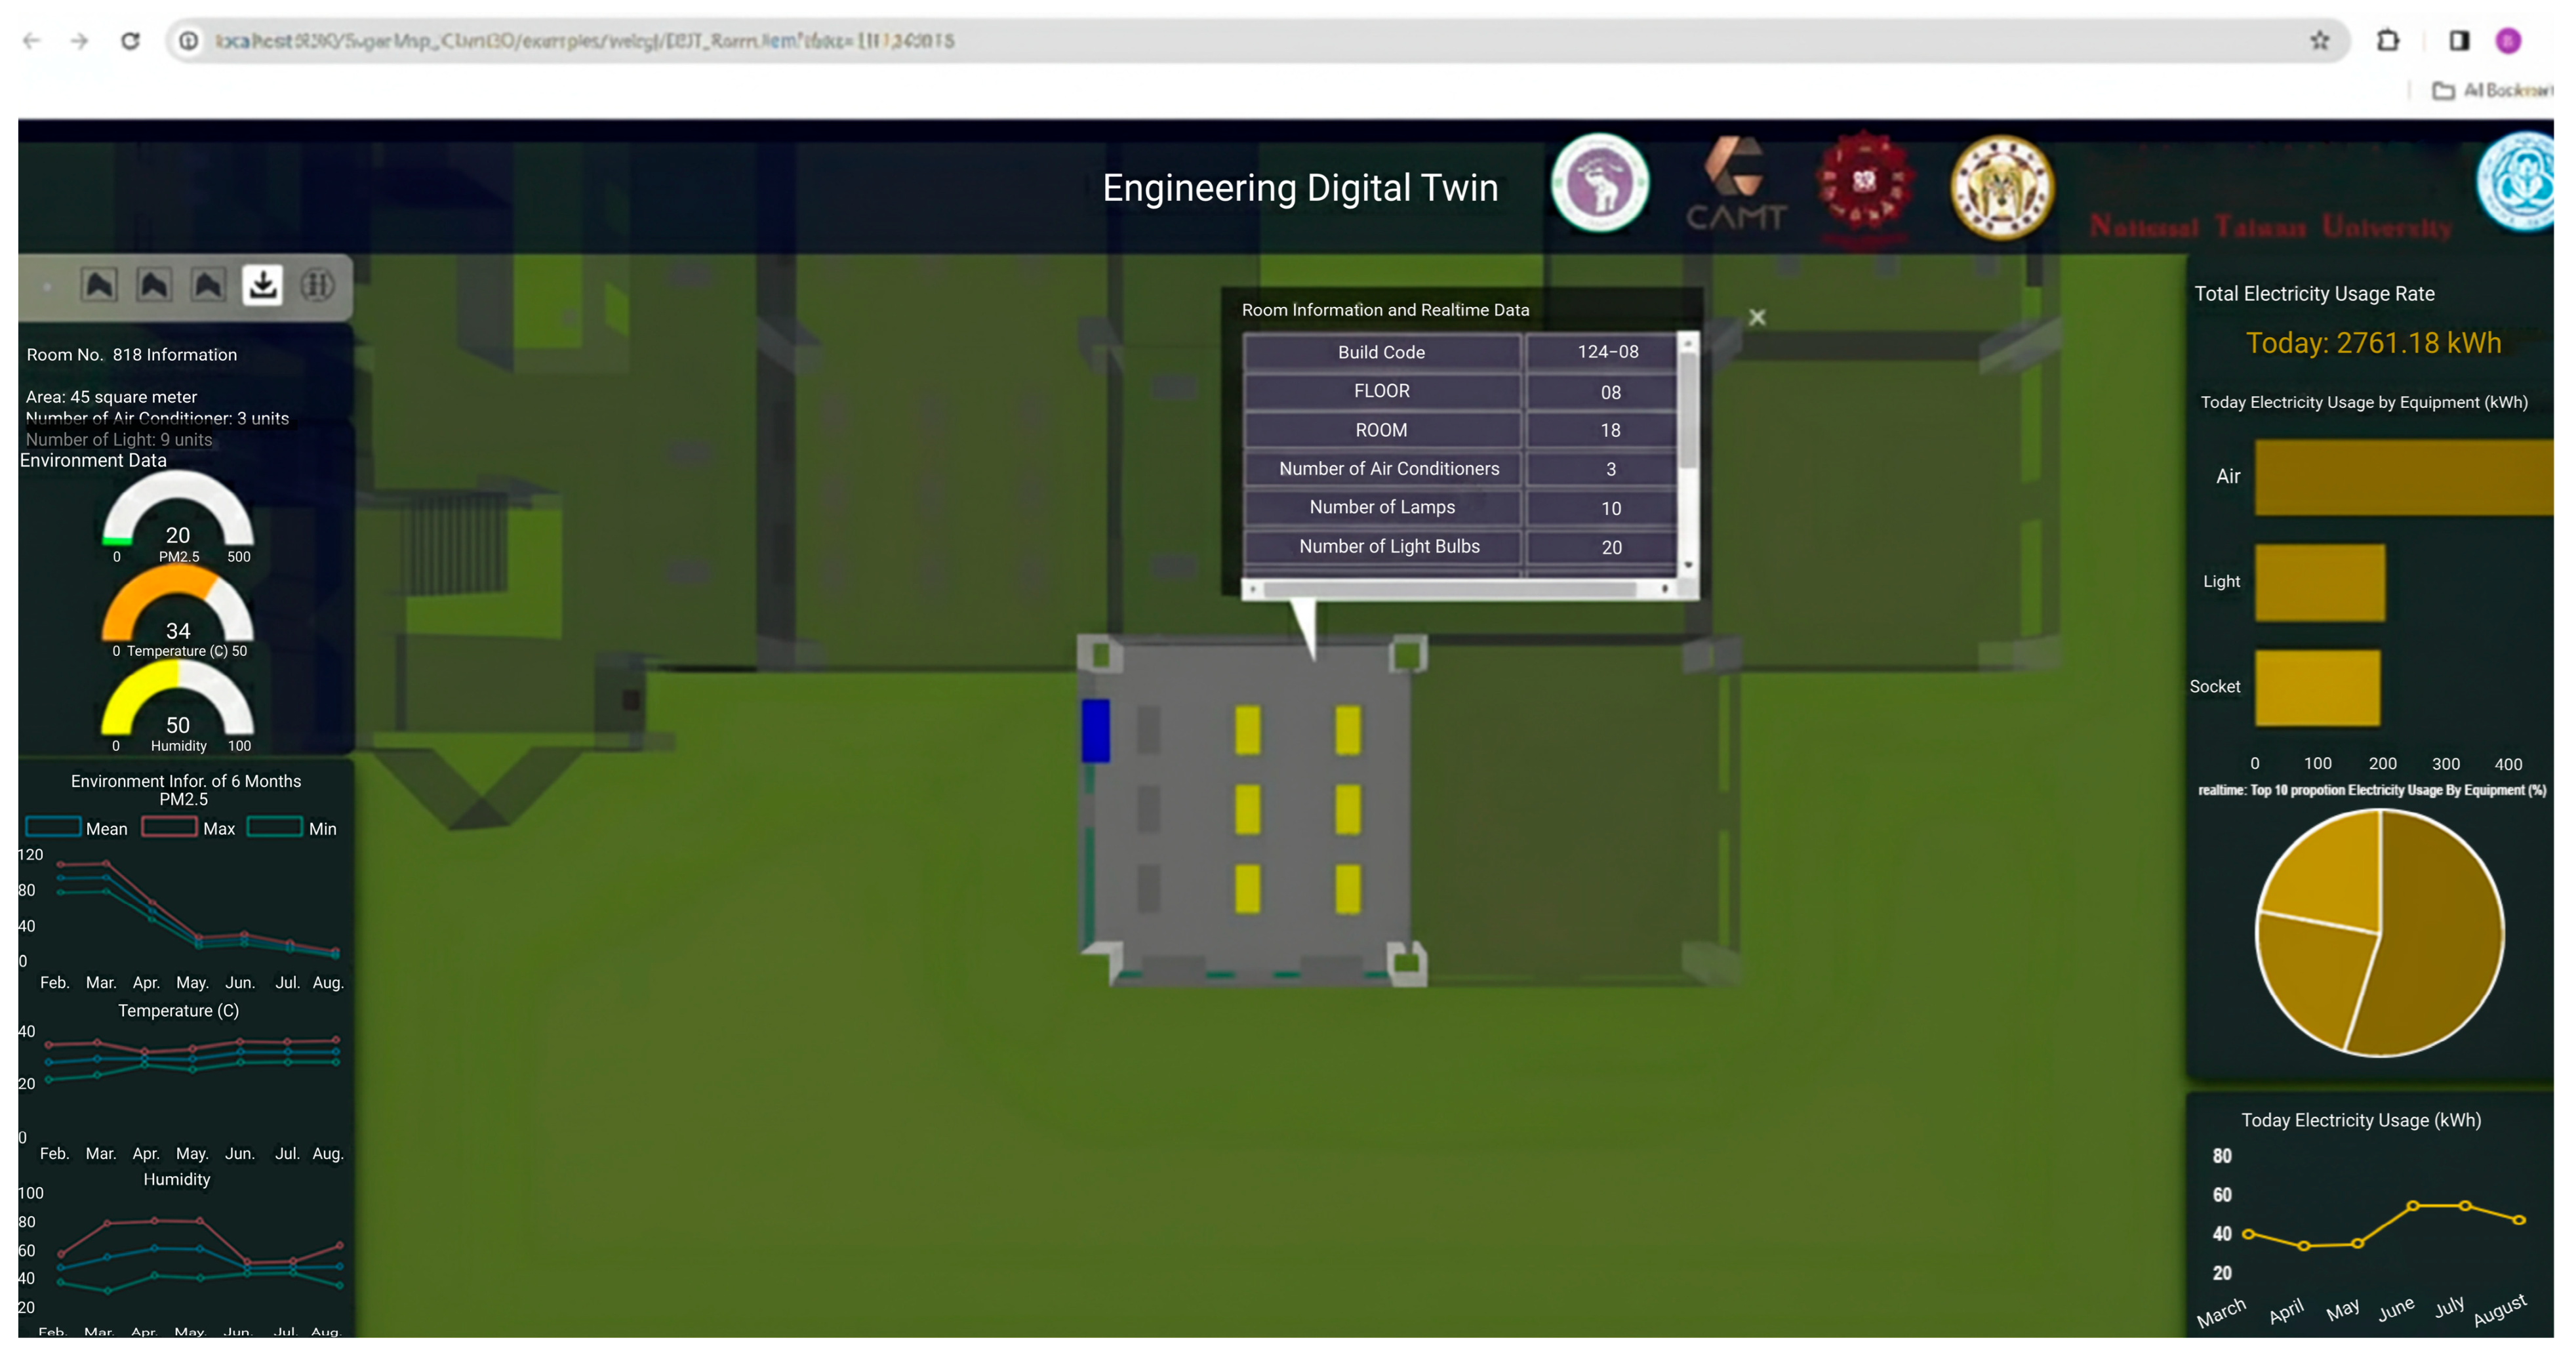
Room-Level Dashboard: This dashboard offers a highly granular visualization of device status. For example, yellow lights indicate active light bulbs, and blue signifies an active air conditioner. Sensor values like PM2.5, temperature, humidity, and room-specific power usage are presented in
Figure 16.
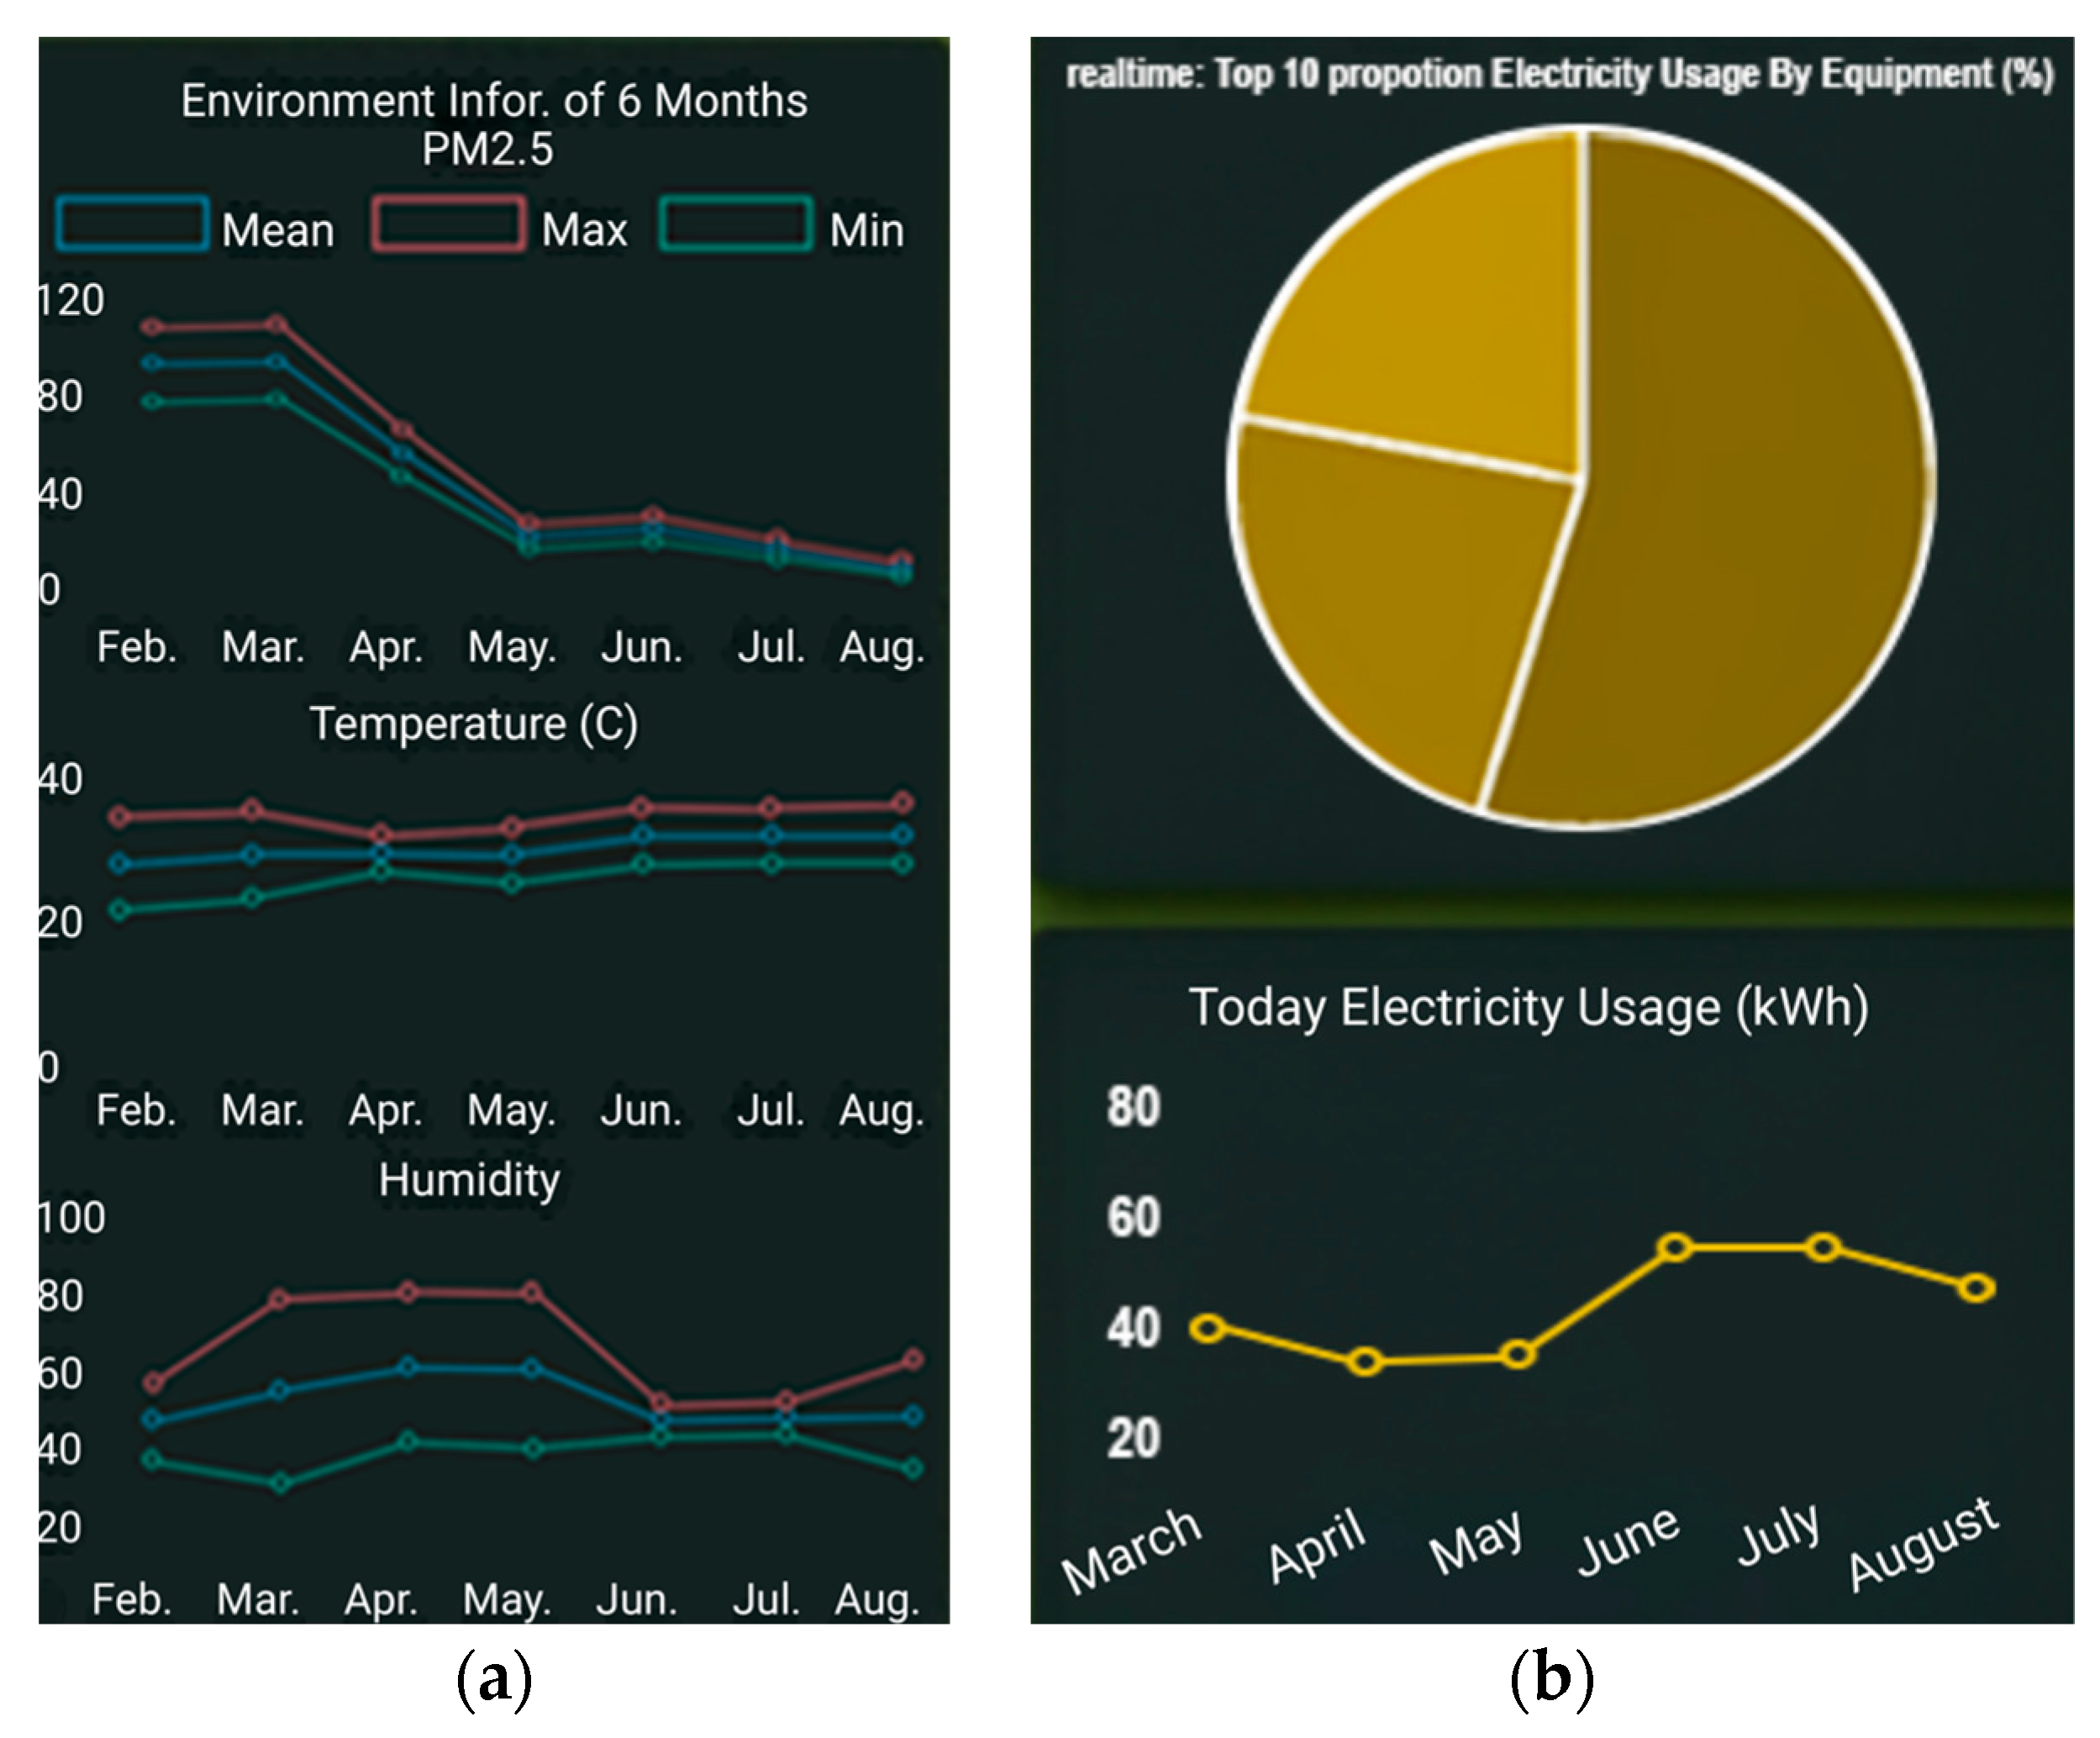
The room-level dashboard provides detailed information for individual rooms. On the left, it displays environmental conditions, while the right side shows the room’s total energy consumption. In this example, identifiers such as FLOOR 08 and ROOM 18 correspond to the 8th floor of the 30-Year Engineering Building and a specific room (Room 818: the City Research and Development Center) in the 3D model database. Energy usage is measured in kilowatt-hours (kWh), the correct SI unit, using sensors (PZEM-004T, Peacefair Electronic Technology Co., Ltd., Ningbo, Zhejiang, China) that capture both instantaneous power (kW) and accumulated energy (kWh). Consumption is further disaggregated into three categories—Air (air-conditioning units), Light (lighting system), and Socket (plug loads such as computers and appliances)—which are represented in bar chart form. This breakdown enables users to assess the relative impact of different types of electrical appliances within the room. Additionally, the dashboard includes a dedicated function for maintenance technicians, allowing them to manage and update appliance data in the database. This feature enhances data completeness and supports the potential development of predictive maintenance and repair alert systems in the future (
Figure 17).
This modular dashboard architecture enables administrators to manage data across multiple spatial levels, supporting effective monitoring and decision-making for a sustainable smart campus. Moreover, it facilitates current energy and environmental monitoring and establishes a foundation for future system extensions.
Potential features such as occupancy tracking, water monitoring, and automated control systems can be integrated into the existing framework by leveraging the same modular data ingestion and visualization pipeline. Occupancy sensors (passive infrared detectors, Bluetooth beacons, or Wi-Fi analytics) could be incorporated to enrich spatial intelligence and support applications such as demand-driven HVAC control and space utilization analysis. Water monitoring would require deploying flow and pressure sensors linked through NB-IoT or LoRaWAN protocols, with the resulting data mapped to the existing hierarchical dashboard. Automated control systems, such as smart lighting or adaptive HVAC, could be integrated by extending the Application Programming Interface (API) layer to support bidirectional communication, enabling the platform to monitor and actuate devices in real time.
However, technical and logistical challenges accompany these extensions. Integrating heterogeneous sensors requires careful attention to interoperability, calibration, and data validation to maintain accuracy across domains. The increased data volume and complexity—particularly when combining high-frequency occupancy streams with energy and environmental datasets—necessitate scalable cloud-based storage and optimized data-processing pipelines. Techniques like edge computing, data aggregation, and anomaly detection will be critical to managing latency and reducing system load. Additionally, user training and workflow adaptation are essential to ensure facility managers and technicians can effectively interpret and act on more complex data outputs.
From a scalability perspective, the system’s hardware-agnostic design and reliance on standardized APIs make it well-suited to handle incremental growth. New sensor modules or third-party data services can be integrated without major redesign, and the visualization layer can dynamically adapt to new data categories by extending the hierarchical dashboard architecture. These characteristics reassure that the platform is capable of supporting the current smart campus deployment and flexible enough to evolve alongside the growing demands of urban-scale digital twin applications.
4.5. Results of System Testing for the Digital Twin Prototype
The prototype system for sustainable smart campus management was developed and tested with building resource managers at the Faculty of Engineering, Chiang Mai University. The primary objective of the evaluation was to assess system usability and collect stakeholder feedback for future enhancements.
User feedback indicated high satisfaction, particularly with the system’s ability to provide intuitive access to campus-wide conditions and key operational data. Among the features, the most highly requested was the capability to display energy consumption at the faculty level and disaggregate it by individual buildings. The dashboard further supports detailed visualization down to the floor and room levels, enabling a clear overview of energy usage across different locations.
The second most valued feature was access to updated construction drawings, which developers and researchers had uploaded into the database. These drawings serve as a central repository, allowing users to download them when needed for maintenance or renovation purposes. System drawings were the most frequently used in practice, as they provide essential details for repairing and managing various building systems.
In addition, the dashboard incorporated a specialized feature for maintenance technicians to manage information about key electrical equipment such as lighting and air-conditioning units. These were modeled in three dimensions and linked to the latest survey data. However, integrating the 3D models with equipment attributes—including type, power consumption, maintenance schedule, and physical location—proved to be the most challenging task, requiring significant manual data collection. The system was enhanced to address this challenge, allowing maintenance technicians to input equipment information directly. Initial usability tests revealed some difficulties that were mitigated by conducting training sessions. After training, technicians demonstrated improved understanding of how to use the dashboard effectively, and the collected data were successfully transferred for use in other subsystems (
Figure 18).
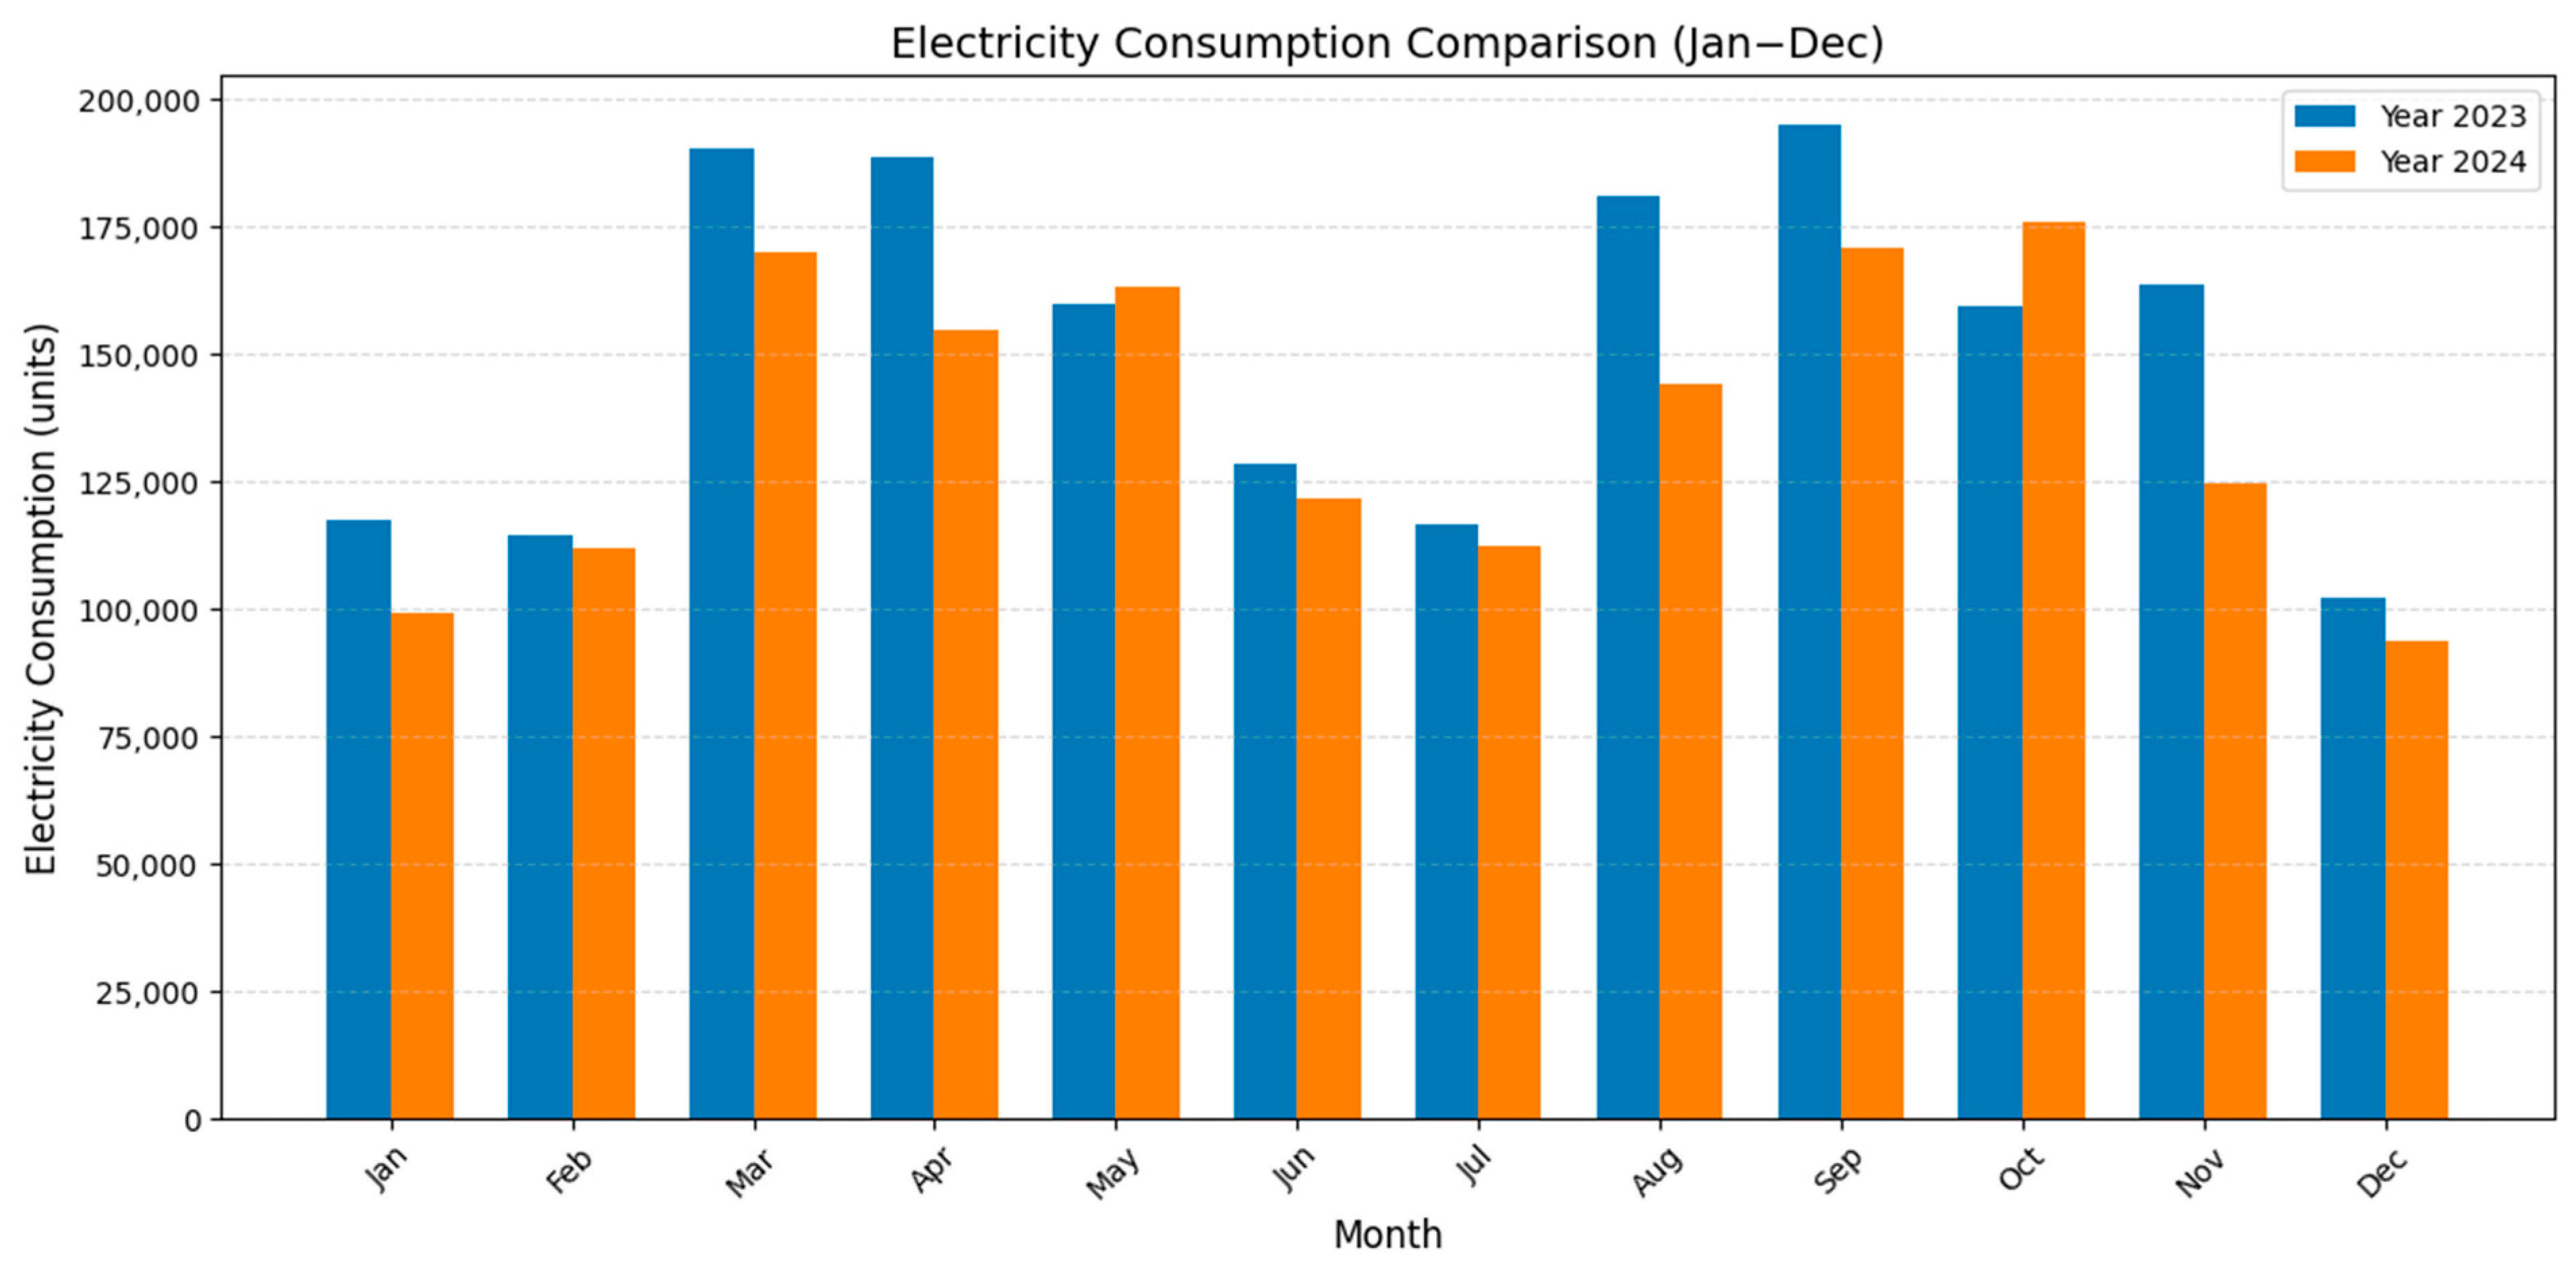
A comparative analysis of electricity consumption in the Faculty of Engineering between January–December 2023 and the corresponding period in 2024 demonstrates quantifiable improvements in energy efficiency during the pilot implementation phase of the platform. Although seasonal peaks in consumption remained evident in March–April and September–October, the overall electricity usage in 2024 was consistently lower than in the preceding year. Substantial reductions were observed in August (−20.9%), November (−23.3%), and December (−8.3%), resulting in an average annual decrease of approximately 9–12%. These findings suggest that the platform effectively contributed to optimizing electricity usage by minimizing unnecessary loads during periods of low occupancy and fostering greater awareness of energy consumption patterns among faculty members and students. The results provide concrete evidence that the system not only facilitates monitoring but also achieves measurable improvements in energy efficiency, thereby reinforcing its contribution to institutional sustainability objectives.
In energy management, stakeholders recommended incorporating a data export function—particularly supporting formats such as Excel—to enable further analysis and seamless integration into existing workflows. Consequently, the dashboard was upgraded to meet these needs by allowing direct download of both energy data and construction drawings through the interface.
The prototype was officially transferred to the Faculty of Engineering on 22 October 2024, initiating its real-world application and serving as a foundation for iterative improvement toward full-scale deployment.
Beyond the university setting, the digital twin framework demonstrates strong potential for broader applications in smart cities and built environment innovation. Campuses often function as microcosms of urban environments, and the scalability of this system suggests it can be adapted for city-wide operations. For example, the multiscale dashboard architecture—capable of visualizing data at the building, floor, and room levels—can be extended to urban districts, streets, and individual public facilities.
Outside the campus environment, digital twin technologies are increasingly deployed in urban mobility and policy-making contexts. For example, recent studies have explored digital twin–empowered cooperative autonomous car-sharing services [
46] and their role in optimizing vehicle routing. Others have emphasized using digital twins as decision-support tools for urban policy-making [
47]. These examples highlight the scalability of the present framework and its potential contribution to cross-domain smart city objectives, including carbon reduction, climate resilience, and improved urban mobility.
Specific use cases include municipal energy management, where aggregated consumption patterns across neighborhoods could be monitored in real time to optimize demand-response strategies and support renewable energy integration. Environmental monitoring functions, already tested on the campus, could be scaled to track urban air quality, noise levels, or heat-island effects, providing valuable insights for public health and climate adaptation planning. The framework could also support smart mobility initiatives by integrating sensor data from parking facilities, electric vehicle charging stations, and traffic flows into a unified spatial dashboard.
Importantly, these applications align with broader smart city objectives such as reducing carbon emissions, improving resource efficiency, and enhancing citizen well-being. By linking building-level data to district- and city-level platforms, the system can contribute to sustainable urban governance, enabling municipalities to identify inefficiencies, implement targeted interventions, and track progress toward carbon neutrality goals. As cities worldwide pursue digital transformation strategies, the tested prototype offers a replicable, modular, and hardware-agnostic foundation for urban-scale digital twin development.
5. Conclusions
This study demonstrates the successful design, development, and deployment of a digital twin framework for sustainable facility management at Chiang Mai University. The system transforms fragmented information into an interactive decision-support tool by integrating 3D spatial modeling, real-time IoT sensor data, and multiscale dashboard visualization. The case study highlights its modular and replicable architecture, validation through real-world implementation, and contribution to aligning digital twin applications with sustainability objectives. Beyond campus operations, the framework offers broader implications for data-driven and climate-responsive smart city governance.
One of the system’s primary strengths is its ability to synthesize complex and heterogeneous datasets into intuitive, user-centric visualizations. The multilevel dashboard allows stakeholders to monitor aggregate energy consumption, identify anomalies, and assess space utilization dynamically. This functionality supports operational efficiency and targeted interventions—such as detecting underutilized spaces or identifying devices left in standby mode.
Notably, user feedback highlighted the value of exportable energy data, which extends the platform’s utility to downstream workflows such as monthly reporting, performance benchmarking, and machine learning–based forecasting. The system’s modular and scalable architecture, built on open-source tools (e.g., Firebase, QGIS, SuperMap iDesktop, and web-based dashboards) and standardized APIs, further ensures flexibility for future expansion. Core modules, including data ingestion, validation, and API interfacing, are hardware-agnostic, allowing seamless integration of additional sensors and third-party data services as infrastructure evolves. Open platforms reduce costs, enhance interoperability, and ensure replicability across institutional and urban contexts [
1,
2,
3].
The visual interface is critical in translating complex sensor data into actionable insights. At the faculty level, administrators can compare energy use across buildings. In contrast, at the room level, real-time monitoring of lighting and HVAC operations enables detection of inefficiencies or system faults. These layered dashboards enhance transparency, enable proactive management, and foster sustainable energy practices.
Nonetheless, the current system has limitations. Despite these contributions, some functions—such as equipment data entry—still require manual input, and expanding the framework to include occupancy tracking, water monitoring, or automated control will add complexity. Future research and development will therefore focus on addressing these challenges by prioritizing the automation of data collection through advanced sensing and edge computing, enhancing interoperability via open data standards, and strengthening data governance and cybersecurity frameworks. Furthermore, incorporating predictive analytics and machine learning will enable the transition from a monitoring-oriented platform to a proactive optimization system capable of generating recommendations and supporting informed interventions.
Beyond the campus context, the framework’s modular and hardware-agnostic architecture provides strong potential for replication in smart city environments. Extending its functions to urban-scale domains—such as energy districts, water distribution networks, and mobility systems—positions the platform to contribute more broadly to sustainability objectives, including carbon reduction, resource efficiency, and climate resilience.
