Abstract
Sudden Infant Death Syndrome (SIDS) is one of the leading causes of postnatal mortality, with the prone sleeping position identified as a critical risk factor. This article presents the design, implementation, and validation of a low-cost embedded system for unobtrusive, real-time monitoring of infant posture. The system acquires data from a pressure mat on which the infant rests, converting the pressure matrix into an image representing the postural imprint. A Convolutional Neural Network (CNN) has been trained to classify these images and distinguish between prone and supine positions with high accuracy. The trained model was optimized and deployed in a data acquisition and processing system (DAQ) based on the Raspberry Pi platform, enabling local and autonomous inference. To prevent false positives, the system activates a visual and audible alarm upon detection of a sustained risk position, alongside remote notifications via the MQTT protocol. The results demonstrate that the prototype is capable of reliably and continuously identifying the infant’s posture when used by people who are not technology experts. We conclude that it is feasible to develop an autonomous, accessible, and effective monitoring system that can serve as a support tool for caregivers and as a technological basis for new strategies in SIDS prevention.
1. Introduction
Sudden Infant Death Syndrome (SIDS) is defined as the sudden and unexpected death of an apparently healthy infant under one year of age, with no identifiable cause even after a thorough post-mortem investigation [1,2,3]. This phenomenon remains one of the leading causes of infant mortality in developed countries, with peak incidence occurring between two and six months of age [4,5,6]. Despite decades of research, its precise etiology remains multifactorial and not fully understood, leading to considerable distress among families and posing an ongoing challenge to the pediatric medical community.
Research has identified multiple risk factors associated with SIDS, including genetic predisposition, exposure to tobacco smoke, and unsafe sleeping environments [7,8,9]. Some studies have also suggested correlations with family history [10] or environments with abnormal temperatures [11]. Among all these factors, sleep position has been identified as the most significant and, crucially, the most easily modifiable. There is overwhelming scientific consensus that the supine position (lying on the back) significantly reduces the risk compared to the prone position (lying on the stomach) [1,12]. This finding has driven global public health campaigns, such as “Back to Sleep”, which have significantly reduced SIDS rates [13]. However, the risk remains and may even increase as infants acquire the ability to change position during sleep, thereby requiring continuous monitoring autonomously.
In response to this need, various technological solutions for infant monitoring have been explored. Some approaches involve video-based systems [14,15], which present notable limitations such as dependence on lighting conditions, possible occlusion of the field of view, and, fundamentally, privacy concerns. Other strategies utilize body-worn sensors attached to the infant to measure vital signs such as heart rate, respiration, or oxygen saturation [16,17,18,19]. While effective at capturing physiological data, these solutions are intrusive, may cause discomfort to the infant, and are at risk of accidental detachment.
To address the limitations of current systems, this article presents an alternative, non-invasive, privacy-preserving solution. It proposes the design and implementation of a system based on a pressure-sensing mat placed beneath the infant’s mattress. The objective is to autonomously and continuously monitor the infant’s posture, issuing reliable alerts in the event of detecting a prolonged risky position. This work demonstrates the feasibility of using pressure data, transformed into images and classified by a convolutional neural network (CNN) deployed on an embedded system, as an effective and accessible tool for the prevention of SIDS.
The remainder of the article is organized as follows: first, a review of pressure-sensing mats used as the primary data acquisition device is presented. This is followed by a description of the data acquisition process and the characteristics of the collected data. Subsequently, the data processing methodology is detailed, including transformation and analysis using deep learning techniques. Finally, the developed autonomous system is described, and the study’s conclusions are presented.
2. Pressure-Sensing Mats: Principles and Application
2.1. Operating Principle and Applications
Pressure-sensing mats are data acquisition devices that capture the distribution of force across a surface. This technology constitutes a cornerstone in the field of Human Activity Recognition (HAR), with applications ranging from healthcare—such as patient monitoring and the prevention of pressure ulcers [20,21] or heart failure detection [22]—to collaborative robotics, where it enhances human–robot interaction.
In the field of body position detection using pressure mats, some studies [23] have explored approaches similar to ours. However, these works primarily focus on estimating the positions of body parts in adults, whose larger body size and different postural physiology make the direct application of such methods to infants problematic for achieving our objectives. To maintain reliability, the system presented must implement a supine posture reassertion.
The technology is based on a matrix of discrete sensing points. Each point, or sensor, typically functions as a variable resistor (piezoresistor), whose resistance value changes depending on the applied pressure. The most common reading principle for each sensor (R1 in Figure 1) relies on a voltage divider circuit. In this setup, the sensor (R1) is connected in series with a fixed reference resistor (R2) between a supply voltage (Vcc) and ground (GND). The output voltage (Vo), which is proportional to the exerted pressure, is measured between the two resistors and is given by the equation:
where R1(P) represents the resistance of the sensor as a function of pressure P. The choice of the reference resistor R2 is critical, as it determines the sensitivity and operational range of the sensor, allowing for the adjustment of the response curve to be either more linear or logarithmic, as illustrated in Figure 2.
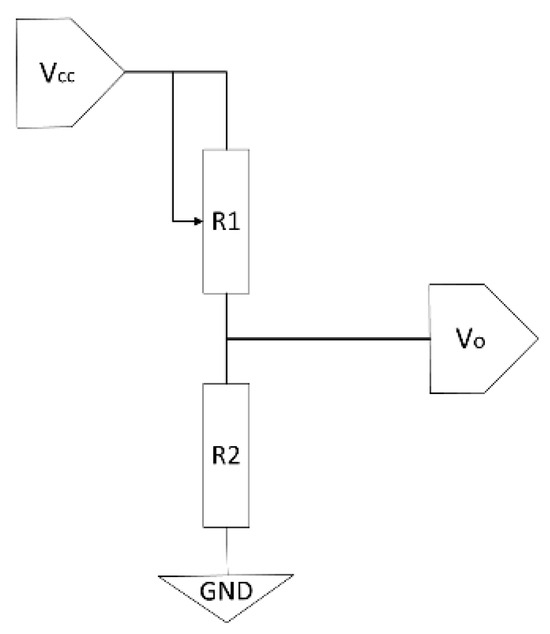
Figure 1.
Electronic schematic of a voltage divider used for reading a piezoresistive pressure sensor (R1).
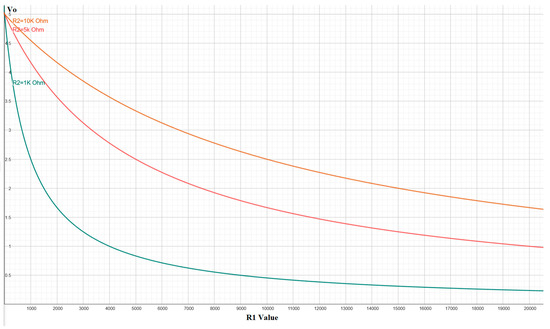
Figure 2.
Behavior of the output voltage (Vo) as a function of the sensor resistance (R1) for different values of the reference resistor (R2), showing the circuit’s capability to adjust sensitivity.
2.2. From Individual Sensors to Textile Matrices
While individual force sensors such as those in the FSR400 series [24] can be employed for point-specific measurements, constructing a high-density pressure-sensitive surface using discrete sensors becomes impractical due to the complexity of wiring. To overcome this limitation, advanced textile materials such as Velostat, Carbo-Text, or Polypyrrole have emerged, integrating the sensor matrix directly into the fabric structure [25].
The construction of these pressure-sensing mats entails a trade-off between spatial resolution (sensor density), the total sensing area, and the sampling frequency. As the number of sensors in the matrix increases (Figure 3), more complex control electronics are required, typically involving multiplexers and buffers to manage the sequential reading of all points. This introduces inherent latency: with a fixed reading system, scanning a larger number of sensors leads to a lower acquisition frequency for the complete matrix. Alternatively, maintaining a high acquisition rate across a large matrix necessitates parallel reading hardware, which significantly increases the overall system cost.
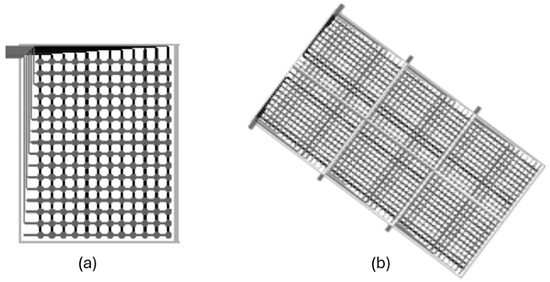
Figure 3.
Scaling of sensor matrices. (a) Single matrix. (b) Multiple interconnected matrices covering a larger surface, managed by central control electronics. (source: Technical documentation of the Company Sensing Tex).
2.3. Data Acquisition System Used in This Study
This study utilized two non-commercial prototypes of pressure mats developed by the company Sensing Tex [26], based on their Sensing Mat Dev Kits platform. The key technical specifications of these devices are summarized below:
- Physical Dimensions: 1000 × 1000 mm.
- Sensing Area: 950 × 950 mm
- Matrix Resolution: 80 × 80 sensors, totaling 6400 measurement points
- Spatial Resolution: Approximately 11.87 mm center-to-center distance between sensors
- Optimized Pressure Range: At the specific request of this project, the mats were calibrated for optimal performance with weights ranging from 5 to 10 kg maximum in a sensor zone, corresponding to the target infant population
- Sensibility Error: 0.2–0.5 N
- Measurement Resolution: The internal analog-to-digital converter (ADC) operates at 12 bits, providing 4096 distinct pressure levels per sensor
- Materials: Neoprene top layer and anti-slip base (see Figure 4)
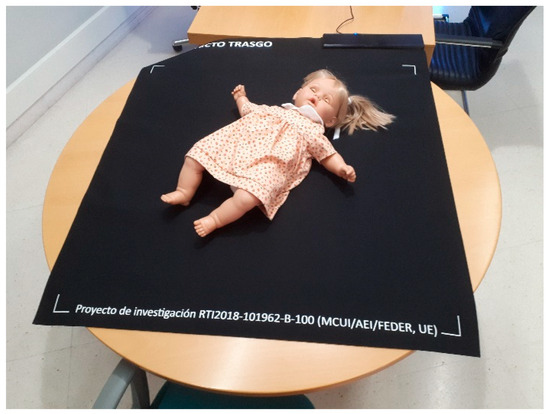 Figure 4. Prototype of the Sensing Tex pressure mat used in the study, with a mannequin illustrating the capture of the pressure imprint.
 - Sampling Frequency: We performed data acquisition via the USB interface. Although the manufacturer specifies a rate of 5 Hz, empirical measurements taken from the captured data revealed an effective sampling rate between 10 and 11 Hz
The manufacturer provides a software application compatible with Windows, Android, and iOS that allows for real-time visualization and data capture (Figure 5), as well as a Software Development Kit (SDK) [27]. This SDK was employed in our work to develop a custom application, enabling direct integration with the mat from a Linux environment and offering complete programmatic control over the data acquisition process.
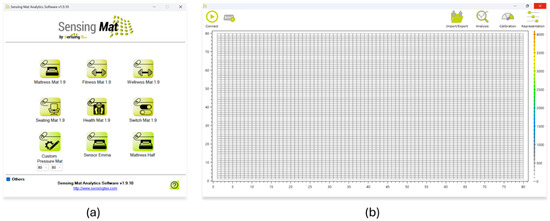
Figure 5.
Software provided by the manufacturer. (a) Device selection screen. (b) Real-time interface for visualizing the pressure matrix.
3. Data Collection
Data collection was conducted within the framework of a broader project, leveraging routine pediatric check-ups that infants are required to undergo according to the healthcare protocol of the Community of Madrid (Spain). To participate in the study, parents were informed in advance about the procedures to be performed and provided explicit written consent. The relevant ethics committees of both the sponsoring university and the associated healthcare area approved both the consent process and the procedures involving nominal data. The codes and dates of these ethics committees are listed below:
- Alcala University:
- o Date: 20 September 2019
- o Code: CEI/HU/2019/33
- Prince of Asturias University Hospital:
- o Date: 4 May 2022
- o Code: 07/926456-9/22
- Health Department of the Community of Madrid:
- o Date: 13 May 2022
- o Code: 20220005
During data acquisition, the pediatrician carried out the standard clinical assessments, but in this case using a pressure-sensing mat placed on the examination table. Simultaneously, a specialized technician operated the computer connected to the mat using the software provided by the manufacturer.
In total, data was collected from 87 infants, ranging in age from birth to 15.7 months, with a mean age of 5.0 months and a standard deviation of 4.1. However, after calculating the corrected ages based on the gestational week at delivery, the mean age was 4.8 months. Figure 6 shows a histogram with the age distribution of the infants included in the study.
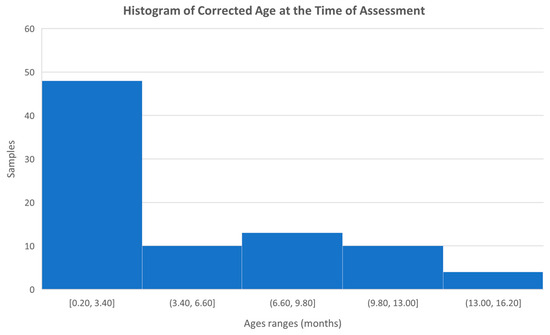
Figure 6.
Histogram with the age distribution of the infants studied.
We subsequently conducted a thorough review of the recorded samples, using both the manufacturer’s software (see Figure 7) and supplementary video recordings captured during the sessions, with the involvement of physiotherapists and technologists. As a result, certain samples from specific infants, in both the prone and supine positions, were excluded. The main reasons for discarding samples included the presence of signal interference, such as additional pressure marks caused by objects used to capture the infant’s attention, or unintentional contact between the pediatrician and the mat. Attempts are made to capture positions as cleanly as possible to make it easier to locate these postures later, even if there is interference. Other samples were excluded in cases where proper testing could not be completed due to the infant crying or becoming distressed, most likely due to the unfamiliar presence of the doctor [28].
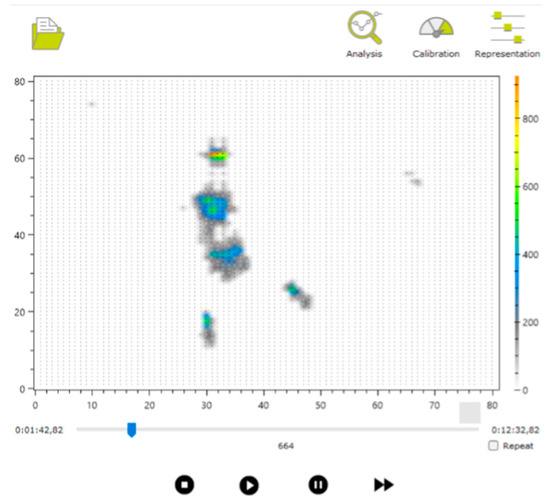
Figure 7.
Example of visualization of one of the captured files.
Following this filtering process, a total of 55 children in the supine position and 54 in the prone position were ultimately selected.
3.1. Data Obtained
Two main types of files were generated for each infant:
- Pressure imprint file, capturing the data recorded by the mat
- Timestamp and position annotation file, marking the time intervals during which the infant remained in each posture (prone or supine)
3.1.1. Pressure Imprint File
The manufacturer’s software allows for the export of the pressure imprints recorded during the session in JSON format [29]. This file (see Box 1 for an example) contains the complete sequence of samples collected during the session.
The JSON file includes several variables, such as metadata (e.g., software version and configuration parameters), which are not relevant to this study but have been retained to ensure reproducibility in future data analyses.
For this work, the standard software configuration was used, without applying capture limits or thresholds. This choice aimed to preserve the integrity of the samples, even at the expense of allowing the presence of “shadows” or potential interferences, in order to simulate as realistic an environment as possible.
The key variable for analysis is pressureData, which contains an array of samples. Each sample consists of two fields:
- dateTime: timestamp in ISO 8601 format [30]
- pressureMatrix: an 80 × 80 pressure matrix, where each element represents the integer value recorded by each sensor, though presented in the file as a decimal
Box 1. Example of the structure of the JSON file exported by the manufacturer’s application.
{
"softwareVersion": "1.9",
"calibrationConfiguration": {
"calibrationTable": {
…
},
"customCalibrationTable": null,
"calibrationUnits": 0,
"isVoltageSharingCompensationActivated": true,
"isOutputImpedanceCompensationActivated": false,
…
},
"representationConfiguration": {
"threshold": 0,
"scaleSetting": 0,
"automaticScaleDefinition": 0,
…
},
"pressureData": [
{
"dateTime": "2024-01-27T17:14:41.6112986+01:00",
"pressureMatrix": [
[
…
],
[
…
],
…
]
}
]
}
3.1.2. Annotation File
The review process described above also enabled the precise definition of the time intervals corresponding to each posture adopted by the infant.
The annotation file (Box 2) contains lines of text indicating the video frames at which posture changes occurred, visually identified using the manufacturer’s application. Each line includes the frame number and a letter marking the beginning or end of a posture: S for supine and P for prone. For example, in Figure 7, the frame number is shown as 664 (visible at the bottom of the interface, above the video playback controls), indicating the relevant point in the recording.
Box 2. Example of an Annotation File Indicating Start and End Points for Supine and Prone Positions.
162 S
504 S
658 P
901 P
This annotation file follows an internal protocol developed to facilitate automated data analysis. It typically contains an even number of lines, representing paired start and end events for each posture. If a start marker is detected without a corresponding end marker, that entry is automatically discarded.
4. Data Analysis
The analysis of each infant’s data involved jointly processing the pressure imprint file and the annotation file, to extract the samples corresponding to the time intervals during which the infant remained in a specific posture.
To achieve this, the JSON pressure data file was read sequentially to identify the frame ranges associated with each posture, as specified in the annotation file. From that point, the corresponding pressure matrices were extracted one by one and converted into PNG-format images. These images were stored in directories labeled with both the posture (prone or supine) and the infant’s identifier. The name of each PNG file corresponds to the frame number of the matrix within the JSON file, allowing direct traceability to its original position in the data sequence if required.
This task was implemented in Python 3.10 using, among other tools, the OpenCV library for processing and converting matrices into images.
Figure 8 shows a set of six sample images, corresponding to three prone and three supine examples from different infants. Each image has a resolution of 80 × 80 pixels, corresponding to the number of sensors in the pressure mat. Given that the images were saved in greyscale PNG format with lossless compression, the resulting file size is typically below 1 KB in most cases.
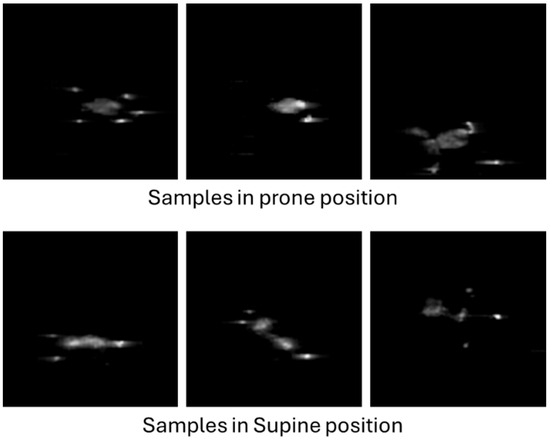
Figure 8.
Examples of infant pressure imprint images.
After processing all the infant samples using this procedure, a total of 44,559 supine images and 24,769 prone images were obtained. This substantial difference in sample count reflects practical considerations: due to the young age of the participants, in many cases only supine position tests were conducted, or the infant was kept in the prone position for a significantly shorter duration. As noted in several studies [31,32,33,34], one of the most widely used international tools for assessing infant motor development is the Alberta Infant Motor Scale (AIMS). The AIMS evaluates gross motor skills in infants aged 0 to 18 months, focusing on posture and antigravity movements through the observation of spontaneous activity. Based on these observations, each infant is assigned a score that determines their placement on the scale. Since the scale is primarily designed to assess antigravity movements, the lateral position is given little consideration, which in turn limits the range of postures analyzed in this study.
According to this scale, as infants grow, more time is spent testing them in the prone position and other postures, which also accounts for the variation in posture duration observed during data collection.
5. Image Analysis
Once the images have been generated from the pressure footprints of the infants on the mattress, the objective is to automatically determine whether each image corresponds to a prone or supine position. To achieve this, artificial intelligence techniques based on convolutional neural networks (CNNs) are employed.
CNNs [35,36,37,38,39] are a type of neural network specialized in processing data structured in a grid-like format, such as images. These networks have revolutionized visual analysis across numerous fields, from medical diagnostics to autonomous driving, owing to their ability to extract hierarchical features and detect complex spatial patterns without the need to design such features manually.
In this study, a CNN was developed using Python, with the open-source libraries Keras and TensorFlow, which are widely used for the development and training of deep learning models.
Image Preprocessing
Before using the images as input for the model, they must undergo a preprocessing stage. This step aims to adjust both the quality and quantity of data to optimize model performance and reduce training time.
Given the imbalance between the number of images in each class (supine and prone), it is necessary to equalize the two sets. To balance unbalanced classes, strategies such as oversampling using techniques like SMOTE [40,41] or synthetic data generation exist. However, due to the large availability of images, the approach chosen was to reduce the number of images in the majority class (supine) by randomly discarding around 20,000 samples. As a result, two balanced sets were obtained, each with approximately 25,000 images.
Subsequently, the data are split into two subsets: one for training (70%) and one for testing (30%). This split is not performed randomly on the images themselves, but at the individual level; that is, different infants are selected for each subset. In this way, the presence of images from the same baby in both sets is avoided, which could otherwise create a false impression of high performance due to the similarity between samples.
6. Neural Network Architecture
The architecture of the CNN was designed using Python code (Box 3). As the first step in data processing, the original 80 × 80 pixel images are reduced to a size of 40 × 40 pixels to decrease computational complexity. Subsequently, pixel values are normalized to the range [0, 1], which facilitates the model’s learning process.
Box 3. Example Code Defining the CNN Used.
num_classes = len(class_names) # class_names: prone, supine
img_height = 40
img_width = 40
model = Sequential([
layers.Rescaling(1./255, input_shape=(img_height, img_width, 3)),
layers.Conv2D(16, 3, padding='same', activation='relu'),
layers.MaxPooling2D(),
layers.Conv2D(32, 3, padding='same', activation='relu'),
layers.MaxPooling2D(),
layers.Conv2D(64, 3, padding='same', activation='relu'),
layers.MaxPooling2D(),
layers.Flatten(),
layers.Dense(128, activation='relu'),
layers.Dense(num_classes)
])
The network consists of several layers arranged sequentially (Box 4). In its initial structure, it includes three convolutional layer blocks, which act as filters capable of detecting relevant features such as edges, shapes, or textures. Each of these blocks is followed by a max pooling layer, which reduces the dimensionality of the data while preserving the most significant information. This process helps to decrease the risk of overfitting and improves computational efficiency.
Box 4. Result of the CNN Generation Code Compilation.
Layer (type) Output Shape Param
#
=================================================================
rescaling_1 (Rescaling) (None, 40, 40, 3) 0
conv2d (Conv2D) (None, 40, 40, 16) 448
max_pooling2d (MaxPooling2D) (None, 20, 20, 16) 0
conv2d_1 (Conv2D) (None, 20, 20, 32) 4640
max_pooling2d_1 (MaxPooling2D) (None, 10, 10, 32) 0
conv2d_2 (Conv2D) (None, 10, 10, 64) 18496
max_pooling2d_2 (MaxPooling2D) (None, 5, 5, 64) 0
flatten (Flatten) (None, 1600) 0
dense (Dense) (None, 128) 204928
dense_1 (Dense) (None, 2) 258
=================================================================
Total params: 228,770
Trainable params: 228,770
Non-trainable params: 0
As the network progresses, the number of filters per block increases (from 16 to 64), enabling it to learn increasingly complex patterns (Figure 9). After the convolutional blocks, the data are flattened (using a flatten layer), converting them into a one-dimensional vector, which serves as input for the final dense layers.
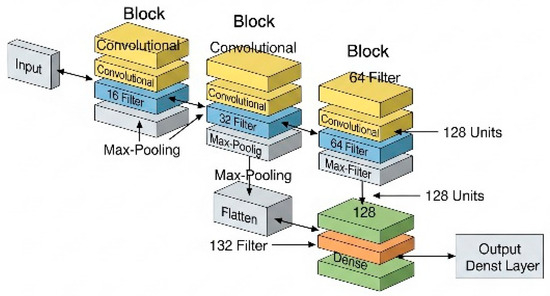
Figure 9.
Graphical representation of the CNN used.
In the final phase, the vector passes through an intermediate dense layer with 128 neurons, whose function is to combine the extracted features. The output layer consists of 2 neurons, allowing binary classification between the two positions: prone and supine.
In total, the network has approximately 229,000 trainable parameters, which are automatically adjusted during the training process, enabling the model to improve its predictive capacity progressively. This architecture provides an appropriate balance between accuracy and computational efficiency.
6.1. Model Training
Once the architecture is defined, the model training process begins (Box 5). This process involves adjusting the internal parameters (weights and biases) so that the network learns to identify patterns in the images. The model is trained for 10 epochs, that is, 10 complete cycles over the training dataset (train_ds). During each epoch, the network makes predictions that are compared with the actual labels, and its parameters are adjusted using backpropagation and optimization algorithms.
Box 5. Definition of the Number of Epochs and CNN Training.
epochs = 10
history = model.fit(
train_ds,
validation_data=val_ds,
epochs=epochs
)
Additionally, a validation set (val_ds) is used, which does not participate in direct training but allows the evaluation of the model’s performance at the end of each epoch. This is essential for detecting potential signs of overfitting (Box 6).
Box 6. Output of the CNN Training for Each Epoch.
Epoch 1/10
2588/2588 [==============================] - 436s
154ms/step - loss: 0.0829 –
accuracy: 0.9678 - val_loss: 0.0307 - val_accuracy:
0.9870
Epoch 2/10
2588/2588 [==============================] - 44s
17ms/step - loss: 0.0276 –
accuracy: 0.9873 – val_loss: 0.0250 - val_accuracy:
0.9877
Epoch 3/10
2588/2588 [==============================] - 45s
17ms/step - loss: 0.0229 –
accuracy: 0.9882 – val_loss: 0.0204 - val_accuracy:
0.9890
Epoch 4/10
2588/2588 [==============================] - 43s
17ms/step - loss: 0.0198 –
accuracy: 0.9888 – val_loss: 0.0188 - val_accuracy:
0.9888
Epoch 5/10
2588/2588 [==============================] - 44s
17ms/step - loss: 0.0193 –
accuracy: 0.9893 – val_loss: 0.0178 - val_accuracy:
0.9890
Epoch 6/10
2588/2588 [==============================] - 47s
18ms/step - loss: 0.0171 –
accuracy: 0.9898 – val_loss: 0.0169 - val_accuracy:
0.9895
Epoch 7/10
2588/2588 [==============================] - 43s
17ms/step - loss: 0.0179 –
accuracy: 0.9893 – val_loss: 0.0184 - val_accuracy:
0.9888
Epoch 8/10
2588/2588 [==============================] - 46s
18ms/step - loss: 0.0176 –
accuracy: 0.9896 – val_loss: 0.0177 - val_accuracy:
0.9889
Epoch 9/10
2588/2588 [==============================] - 46s
18ms/step - loss: 0.0166 –
accuracy: 0.9899 – val_loss: 0.0183 - val_accuracy:
0.9900
Epoch 10/10
2588/2588 [==============================] - 42s
16ms/step - loss: 0.0168 –
accuracy: 0.9899 – val_loss: 0.0158 - val_accuracy:
0.9893
6.2. Training Results
After training, key metrics such as accuracy and loss are obtained for both the training and validation datasets. These metrics are stored in the variable history within the code and can be graphically represented to analyze the model’s progression (Figure 10).
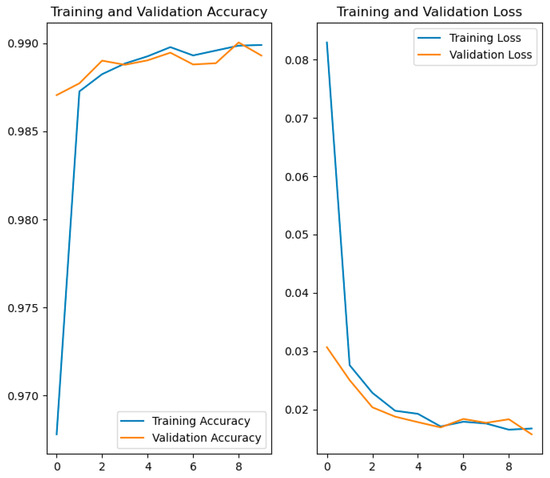
Figure 10.
Comparative graphs of accuracy and loss in training and validation.
- The graph on the left shows the evolution of accuracy. From the earliest epochs, the model achieves high accuracy, exceeding 97% in both training and validation. From there, both curves continue to rise and stabilize above 99%.
- The graph on the right displays the loss progression. Initially, the loss decreases rapidly, as is typical during the early learning phases. It then stabilizes, progressively falling below a value of 0.02.
The close alignment of the training and validation curves in both metrics indicates that the model shows no significant signs of overfitting and generalizes well to data not seen during training.
In summary, the results show that the model has been successfully trained, achieving high accuracy and low loss on both the training and validation data. The strong correspondence between both curves is a clear indication that the model has effectively learned the relevant features of the images and is ready to be reliably used in the practical application described in the following section.
7. Autonomous System
Following the training and validation of the neural network model, the implementation of the final system proposed in this article proceeds. This system is designed to operate autonomously in the usual environments where children sleep, such as their homes or nurseries.
7.1. Hardware and System Environment
We chose a Raspberry Pi 4 Model B with 4 GB of RAM as the data acquisition and processing system (DAQ), running the Raspberry Pi OS Lite operating system. This version of the system lacks a graphical user interface, which reduces resource consumption and facilitates its operation as an embedded system. We based this choice on the platform’s low cost, compact size, and adequate processing capacity for the required tasks.
7.2. Data Acquisition from the Mattress
One of the initial steps in developing the system was to replicate the data acquisition functionality using the pressure mattress. Although the manufacturer does not provide a reading application compatible with Linux systems, they do offer a USB communication SDK. Using this API, direct reading from the mattress was programmed, obtaining a pressure matrix representing the weight distribution across the surface (an 80 × 80 pixels image).
At this stage, the data obtained from the pressure mattress undergo preprocessing, which includes, among other operations, adapting the original resolution (for example, 80 × 80) to a unified 40 × 40 format. This transformation standardizes the model’s input, facilitating compatibility with different sensor configurations. Should the input parameters be modified, minimal adjustments to the code would be necessary to ensure correct integration with the analysis system.
7.3. System Operation
The system is designed to operate autonomously and continuously. Using a Python script, the DAQ takes samples from the mattress at regular intervals. Each reading generates a matrix containing the pressure values. Before performing classification, it verifies whether the child is present on the mattress by checking if the matrix contains a significant number of non-zero values.
If the child is detected, the classification system is activated. Part of the preprocessing code used during model training is reused for this purpose. Specifically, the images are reduced to 40 × 40 pixels, the values are normalized to the range [0, 1], and they are adapted to the input format expected by the neural network.
The preprocessed matrix is passed to the model loaded in memory, which performs inference and returns a probability for each class (prone or supine). The class with the highest probability is considered the current posture.
7.4. Decision Logic and Buffer System
Since it is unlikely for a baby to change position multiple times within a few seconds, a filtering mechanism is implemented to avoid false alarms. This is based on a circular buffer that stores the last 5 predictions:
- A value of −1 is entered if supine is detected.
- A value of 1 is entered if the prone position or any other position is detected.
- A value of 0 is entered if no presence is detected on the mattress.
If the average of the buffer exceeds a threshold of 0.3, it is considered that the baby has maintained an incorrect position (i.e., at least 3 of the last 5 predictions were not supine), and an alarm notification is generated.
This threshold and other system parameters can be configured via a local web interface accessible from the DAQ itself (Figure 11).

Figure 11.
Web page for system configuration form.
7.5. Alert System and Additional Sensors
When an incorrect position is detected, the system can notify the alert in various ways:
- Local notifications:
- A red LED is activated to indicate the alarm state.
- A buzzer is available, which is disabled by default but can be configured to emit an audible signal.
- 2.
- Remote notifications:
- A notification system using the MQTT protocol [42] is provided, allowing integration with monitoring platforms or mobile devices.
The combination of these notification methods enables an effective response to risk situations, both in the room where the infant is located and in adjacent or remote locations, without the need for constant on-site supervision.
Additionally, with a view to a future study, the system incorporates a DHT22 (AM2302) environmental sensor [43], responsible for measuring ambient temperature and humidity (Figure 12) to evaluate evidence found in the literature suggesting a possible association between abnormal thermal conditions and an increased risk of sudden infant death syndrome (SIDS) [11].
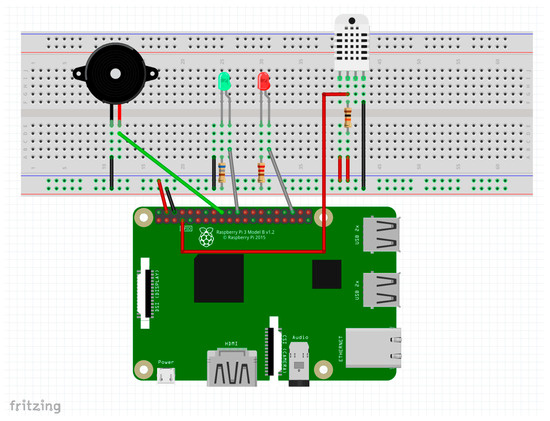
Figure 12.
Schematic of additional sensors connected to the DAQ (source: Own elaboration using Fritzing).
7.6. Remote Communication via MQTT
For remote notifications, an alarm publication service has been implemented using the MQTT protocol. Eclipse Mosquitto [44] is used as the MQTT broker, and message transmission is carried out in Python using the Paho library.
Initially, receiving devices must be connected to the same local network for security reasons and must be subscribed to the system’s topic channel. However, as shown in the web configuration interface (Figure 11), it is possible to change the server to a public one if remote access from outside the local network is desired. This would enhance the system’s capabilities at the cost of placing trust in the external server to which data are transmitted.
To receive notifications on mobile devices, applications such as MyMQTT [45] or IoT MQTT Panel [46,47] can be installed. Once notifications are enabled, these apps allow real-time alerts to be received directly from the system.
The adoption of this protocol enables the integration of alerts generated by multiple autonomous systems operating within a hospital environment. Furthermore, this architecture could be extended to the remote monitoring of alarms in private homes, to proactively respond to potential assistance requests.
8. Discussion of Results and Conclusions
Throughout this work, the proposed objectives have been successfully achieved: on the one hand, the design and training of an image classification model based on a convolutional neural network (CNN); and on the other, the implementation of an autonomous system capable of detecting a baby’s sleeping posture in a non-invasive and human-independent manner. This functionality is of significant value, as it enables the identification of positions associated with a higher risk of sudden infant death syndrome (SIDS), contributing to the prevention of such events.
Regarding the first objective, the trained model demonstrated high performance in binary classification tasks, with accuracy levels exceeding 98% for both the training and validation datasets. These strong results were supported by a large, properly balanced, and preprocessed dataset, which enabled the neural network to learn effectively without overfitting. The accuracy and loss graphs showed stable behavior, indicating good generalization by the model.
One of the most notable achievements has been the effective deployment of the model on an embedded platform, specifically a DAQ. This low-cost, low-power device proved sufficiently powerful to perform real-time inference using the trained model, without the need for external hardware or server connections.
The architecture of the developed system enables continuous and autonomous detection, based on regular readings from a sensitized mattress that captures the baby’s pressure distribution. The implementation of a sliding buffer structure added robustness to the decision-making system, helping to avoid false alarms triggered by isolated readings or temporary anomalies.
In addition, the system provides both local and remote notification mechanisms Via LEDs, buzzers, and MQTT messaging, making it a versatile tool suitable for both home and clinical settings. Its web-based configuration interface allows critical parameters to be adjusted without modifying the underlying code, making it accessible to non-technical users.
In summary, the developed system demonstrates the technical and practical feasibility of using artificial intelligence, combined with pressure sensors and low-cost hardware, to carry out non-invasive infant posture monitoring. This represents a significant step forward compared to previous methods, many of which relied on intrusive or less accessible solutions.
The results obtained also open up several avenues for future development, including:
- The incorporation of new sensors to enrich the collected data, such as a depth camera.
- Integration with IoT platforms or connected healthcare systems.
- Expansion of the model to other tasks related to sleep analysis, such as phase detection or abnormal movement identification.
- Enhancement of the alarm system, adapting it to personalized scenarios based on each environment or user type.
Overall, the solution presented is a technological development with high potential impact in the field of infant care, offering real-world applicability and opportunities for continuous improvement.
Author Contributions
Conceptualization, A.G.-H.; Methodology, A.G.-H. and B.A.; Software, A.G.-H.; Validation, L.C.-P., A.G.-H. and S.N.-N.; Formal analysis, S.N.-N. and A.G.-H.; Investigation, A.G.-H.; Resources, S.N.-N. and B.A.; Data curation, All; Writing—original draft preparation A.G.-H.; Writing—review and editing, A.G.-H. and L.C.-P.; Supervision, B.A.; Project administration, B.A.; funding acquisition, B.A. and S.N.-N. All authors have read and agreed to the published version of the manuscript.
Funding
This project has been funded by the European Union and the ‘Junta de Castilla-La Mancha’ (Operational Programme of Castilla-La Mancha 2021-2027) reference SBPLY/21/180501/000257.
Institutional Review Board Statement
The study was conducted in accordance with the Declaration of Helsinki, and approved by the Institutional Review Board (or Ethics Committee) of Universidad de Alcalá (protocol code CEI/HU/2019/33, date of approval 20 September 2019), Hospital Universitario Príncipe de Asturias de Alcalá de Henares (protocol code 07/926456-9/22, date of approval 4 May 2022), and Consejería de Sanidad de la Comunidad de Madrid (protocol code 20220005, date of approval 13 May 2022).
Informed Consent Statement
Informed consent was obtained from all subjects involved in the study.
Data Availability Statement
The data will be available in the data repository held by our university library (https://biblioteca.uah.es/ayuda/autoayuda/noticias/Repositorio-de-datos-e-cienciaDatos/, accessed on 20 July 2025).
Conflicts of Interest
The authors declare no conflicts of interest.
Abbreviations
The following abbreviations are used in this manuscript:
| SIDS | Sudden Infant Death Syndrome |
| CNN | Convolutional Neural Network |
| MQTT | Message Queuing Telemetry Transport |
| HAR | Human Activity Recognition |
| ADC | Analog-to-Digital Converter |
| USB | Universal Serial Bus |
| SDK | Software Development Kit |
| JSON | JavaScript Object Notation |
| PNG | Portable Network Graphics |
| SMOTE | Synthetic Minority Over-sampling Technique |
| API | Application Programming Interface |
| AIMS | Accuracy of the Alberta Infant Motor Scale |
References
- Bajanowski, T.; Vege, Å.; Byard, R.W.; Krous, H.F.; Arnestad, M.; Bachs, L.; Banner, J.; Blair, P.S.; Borthne, A.; Dettmeyer, R.; et al. Sudden infant death syndrome (SIDS)—Standardised investigations and classification: Recommendations. Forensic Sci. Int. 2007, 165, 129–143. [Google Scholar] [CrossRef] [PubMed]
- Bouvier-Colle, M.H.; Inizan, J.; Michel, E. Postneonatal mortality, sudden infant death syndrome: Factors preventing the decline of infant mortality in France from 1979 to 1985. Paediatr. Perinat. Epidemiol. 1989, 3, 256–267. [Google Scholar] [CrossRef]
- Centers for Disease Control (CDC). Seasonality in sudden infant death syndrome—United States, 1980–1987. MMWR Morb. Mortal. Wkly. Rep. 1990, 39, 891–895. [Google Scholar]
- Almansoor, B.A.; Almaiman, W.A. Sudden infant death syndrome. Int. J. Adv. Med. 2023, 10, 340–344. [Google Scholar] [CrossRef]
- Rodrigues, L.; De Souza, A.V.; Del Risco Sánchez, O.; Carmona, E.V. Knowledge, attitudes and practice on sudden infant death: Study protocol of a scoping review. BMJ Open 2024, 14, e080107. [Google Scholar] [CrossRef]
- Douglas, A.S.; Gupta, R.; Helms, P.J.; Jolliffe, I.T. Month of birth as an independent variable in the sudden infant death syndrome. Paediatr. Perinat. Epidemiol. 1997, 11, 57–66. [Google Scholar] [CrossRef]
- Mitchell, E.A.; Krous, H.F. Sudden unexpected death in infancy: A historical perspective. J. Paediatr. Child Health 2015, 51, 108–112. [Google Scholar] [CrossRef]
- Tappin, D.; Mitchell, E.A.; Carpenter, J.; Hauck, F.; Allan, L. Bed-sharing is a risk for sudden unexpected death in infancy. Arch. Dis. Child. 2023, 108, 79–80. [Google Scholar] [CrossRef]
- Kim, T.H.; Lee, H.; Woo, S.; Lee, H.; Park, J.; Fond, G.; Boyer, L.; Hahn, J.W.; Kang, J.; Yon, D.K. Prenatal and postnatal factors associated with sudden infant death syndrome: An umbrella review of meta-analyses. World J. Pediatr. 2024, 20, 451–460. [Google Scholar] [CrossRef] [PubMed]
- Mehboob, R.; Kurdi, M.; Ahmad, M.; Gilani, S.A.; Khalid, S.; Nasief, H.; Mirdad, A.; Malibary, H.; Hakamy, S.; Hassan, A.; et al. Comprehensive analysis of genes associated with sudden infant death syndrome. Front. Pediatr. 2021, 9, 742225. [Google Scholar] [CrossRef] [PubMed]
- Lakhoo, D.P.; Blake, H.A.; Chersich, M.F.; Nakstad, B.; Kovats, S. The Effect of High and Low Ambient Temperature on Infant Health: A Systematic Review. Int. J. Environ. Res. Public Health 2022, 19, 9109. [Google Scholar] [CrossRef] [PubMed]
- Ruiz Botia, I.; Cassanello Peñarroya, P.; Díez Izquierdo, A.; Martínez Sánchez, J.M.; Balaguer Santamaria, A. Síndrome de muerte súbita del lactante: ¿siguen las familias las recomendaciones? An. Pediatr. (Engl. Ed.) 2020, 92, 222–228. [Google Scholar] [CrossRef] [PubMed]
- Jullien, S. Sudden infant death syndrome prevention. BMC Pediatr. 2021, 21 (Suppl. 1), 320. [Google Scholar] [CrossRef]
- Bharati, V. An efficient edge deep learning computer vision system to prevent sudden infant death syndrome. In Proceedings of the 2021 IEEE International Conference on Smart Computing (SMARTCOMP), Irvine, CA, USA, 23–25 August 2021; pp. 286–291. [Google Scholar] [CrossRef]
- Nishida, M.; Takeda, T.; Mori, H.; Mizoguchi, H.; Sato, T. Monitoring Patient Respiration and Posture Using Human Symbiosis System. In Proceedings of the 1997 IEEE/RSJ International Conference on Intelligent Robots and Systems. Innovative Robotics for Real-World Applications. IROS ’97, Grenoble, France, 11 September 1997; Volume 2, pp. 632–639. [Google Scholar] [CrossRef]
- Al-Nashash, H.; Lvov, B. Sudden infant death syndrome detector. Technol. Health Care 1997, 5, 461–469. [Google Scholar] [CrossRef]
- Kinney, H.C.; Thach, B.T. The sudden infant death syndrome. N. Engl. J. Med. 2009, 361, 795–805. [Google Scholar] [CrossRef]
- Glinge, C.; Rossetti, S.; Oestergaard, L.B.; Stampe, N.K.; Lynge, T.H.; Skals, R.; Winkel, B.G.; Lodder, E.M.; Bezzina, C.R.; Gislason, G.; et al. Risk of sudden infant death syndrome among siblings of children who died of sudden infant death syndrome in Denmark. JAMA Netw. Open 2023, 6, e2252724. [Google Scholar] [CrossRef] [PubMed]
- Burke, M.J.; Downes, R. A fuzzy logic based apnoea monitor for SIDS risk infants. J. Med. Eng. Technol. 2006, 30, 397–411. [Google Scholar] [CrossRef]
- McInnes, E.; Jammali-Blasi, A.; Bell-Syer, S.E.; Dumville, J.C.; Middleton, V.; Cullum, N. Support surfaces for pressure ulcer prevention. Cochrane Database Syst. Rev. 2015, 2015, CD001735. [Google Scholar] [CrossRef]
- Meaume, S.; Marty, M. Pressure ulcer prevention using an alternating-pressure mattress overlay: The MATCARP project. J. Wound Care 2018, 27, 488–494. [Google Scholar] [CrossRef]
- Cohen-McFarlane, M.; Green, J.; Goubran, R.; Knoefel, F. Monitoring congestive heart failure using pressure-sensitive mats. In Proceedings of the 2016 IEEE International Symposium on Medical Measurements and Applications (MeMeA), Benevento, Italy, 15–18 May 2016; pp. 1–6. [Google Scholar] [CrossRef]
- Harada, T.; Mori, Y.; Nishida, T.; Yoshimi, T.; Sato, T. Body Parts Positions and Posture Estimation System Based on Pressure Distribution Image. In Proceedings of the 1999 IEEE International Conference on Robotics and Automation (Cat. No.99CH36288C), Detroit, MI, USA, 10–15 May 1999; Volume 2, pp. 968–975. [Google Scholar] [CrossRef]
- Interlink Electronics, Inc. Available online: https://www.interlinkelectronics.com/force-sensing-resistor (accessed on 20 July 2025).
- Yuan, L.; Wei, Y.; Li, J. Smart pressure e-mat for human sleeping posture and dynamic activity recognition. IEEE J. Sel. Areas Sens. 2024, 2, 9–20. [Google Scholar] [CrossRef]
- Sensing Tex, Inc. Available online: https://sensingtex.com/ (accessed on 20 July 2025).
- Sensing Tex. Presentation of Sensing Tex Products and Features. Available online: http://sensingtex.com/wp-content/uploads/2018/02/DATA-SHEET_Switch_Sensor_Tex_english_rev_11.pdf (accessed on 20 July 2025).
- Walker, D.M.; Tolentino, V.R. White coat versus no white coat: The pediatrician’s dilemma. Ambul. Pediatr. 2007, 7, 201–202. [Google Scholar] [CrossRef]
- JSON. Available online: https://www.json.org (accessed on 20 July 2025).
- ISO 8601; Date and Time Format. ISO: Geneva, Switzerland, 2017. Available online: https://www.iso.org/iso-8601-date-and-time-format.html (accessed on 20 July 2025).
- de Albuquerque, P.L.; Lemos, A.; Guerra, M.Q.; Eickmann, S.H. Accuracy of the Alberta Infant Motor Scale (AIMS) to detect developmental delay of gross motor skills in preterm infants: A systematic review. Dev. Neurorehabil. 2015, 18, 15–21. [Google Scholar] [CrossRef]
- Fuentefria, R.D.N.; Silveira, R.C.; Procianoy, R.S. Motor development of preterm infants assessed by the Alberta Infant Motor Scale: Systematic review article. J. Pediatr. (Rio J.) 2017, 93, 328–342. [Google Scholar] [CrossRef]
- Ko, J.; Lim, H.K. Motor development comparison between preterm and full-term infants using Alberta Infant Motor Scale. Int. J. Environ. Res. Public Health 2023, 20, 3819. [Google Scholar] [CrossRef] [PubMed]
- Syrengelas, D.; Kalampoki, V.; Kleisiouni, P.; Manta, V.; Mellos, S.; Pons, R.; Chrousos, G.P.; Siahanidou, T. Alberta Infant Motor Scale (AIMS) performance of Greek preterm infants: Comparisons with full-term infants of the same nationality and impact of prematurity-related morbidity factors. Phys. Ther. 2016, 96, 1102–1108. [Google Scholar] [CrossRef]
- Wu, Z. Application of CNN classic model in modern image processing. J. Adv. Eng. Technol. 2024, 1, 1–6. [Google Scholar] [CrossRef]
- Jiang, Z. Several applications of convolutional neural networks in medical imaging. Trans. Comput. Sci. Intell. Syst. Res. 2024, 7, 200–205. [Google Scholar] [CrossRef]
- Izadkhah, H. Medical image processing: An insight to convolutional neural networks. In Deep Learning in Bioinformatics; Academic Press: Cambridge, MA, USA, 2022; pp. 175–213. [Google Scholar] [CrossRef]
- Song, X. Exploration and research of convolutional neural networks in image recognition. Appl. Comput. Eng. 2025, 121, 58–65. [Google Scholar] [CrossRef]
- Liu, T. Application of convolutional neural networks in image classification and applications of improved convolutional neural networks. Appl. Comput. Eng. 2024, 81, 56–62. [Google Scholar] [CrossRef]
- Fernández, A.; Garcia, S.; Herrera, F.; Chawla, N.V. SMOTE for learning from imbalanced data: Progress and challenges, marking the 15-year anniversary. J. Artif. Intell. Res. 2018, 61, 863–905. [Google Scholar] [CrossRef]
- Pradipta, G.A.; Wardoyo, R.; Musdholifah, A.; Sanjaya, I.N.H.; Ismail, M. SMOTE for handling imbalanced data problem: A review. In Proceedings of the 2021 Sixth International Conference on Informatics and Computing (ICIC), Semarang, Indonesia, 10–11 November 2021; pp. 1–8. [Google Scholar] [CrossRef]
- MQTT Protocol. Available online: https://mqtt.org/ (accessed on 20 July 2025).
- Waveshare. Temperature and Humidity Sensor DHT22. Available online: https://www.waveshare.com/wiki/DHT22_Temperature-Humidity_Sensor (accessed on 20 July 2025).
- Eclipse Mosquito. Available online: https://mosquitto.org/ (accessed on 20 July 2025).
- MyMQTT Android and IOS Application. Available online: https://mymqtt.app/en (accessed on 20 July 2025).
- IoT MQTT Panel IOS Application. Available online: https://apps.apple.com/pl/app/iot-mqtt-panel/id6466780124 (accessed on 20 July 2025).
- IoT MQTT Panel Android Application. Available online: https://play.google.com/store/apps/details?id=snr.lab.iotmqttpanel.prod (accessed on 20 July 2025).


Disclaimer/Publisher’s Note: The statements, opinions and data contained in all publications are solely those of the individual author(s) and contributor(s) and not of MDPI and/or the editor(s). MDPI and/or the editor(s) disclaim responsibility for any injury to people or property resulting from any ideas, methods, instructions or products referred to in the content. |
© 2025 by the authors. Licensee MDPI, Basel, Switzerland. This article is an open access article distributed under the terms and conditions of the Creative Commons Attribution (CC BY) license (https://creativecommons.org/licenses/by/4.0/).