Article

Edge or Cloud Architecture: The Applicability of New Data Processing Methods in Large-Scale Poultry Farming

1
Faculty of Informatics, Eotvos Lorand University, Pazmany Peter Setany 1/c, 1117 Budapest, Hungary
2
Faculty of Electrical Engineering and Informatics, Budapest University of Technology and Economics, Műegyetem rkp. 3., 1111 Budapest, Hungary
3
University Research and Innovation Center (EKIK), Óbuda University, Bécsi út 96/b., 1034 Budapest, Hungary
4
Austrian Center for Medical Innovation and Technology, ACMIT Gmbh, Viktor-Kaplan-Str. 2, 2700 Wiener Neustadt, Austria
5
John von Neumann Faculty of Informatics, Óbuda University, Bécsi út 96/b, 1034 Budapest, Hungary
*
Authors to whom correspondence should be addressed.
Technologies 2025, 13(1), 17; https://doi.org/10.3390/technologies13010017
Submission received: 30 September 2024 / Revised: 7 December 2024 / Accepted: 19 December 2024 / Published: 1 January 2025
(This article belongs to the Section Information and Communication Technologies)

Abstract

:
As large-scale poultry farming becomes more intensive and concentrated, a deeper understanding of poultry meat production processes is crucial for achieving maximum economic and ecological efficiency. The transmission and analysis of data collected on birds and the farming environment in large-scale production environments using digital tools on a secure platform are not straightforward. In our on-site research, we have investigated two architectures, a cloud-based processing architecture and an edge computing-based one, in large-scale poultry farming circumstances. These results underscore the effectiveness of combining edge and cloud-based solutions to overcome the distinct challenges of precision poultry farming settings. Our system’s dynamic capability, supported by AWS’s robust cloud infrastructure and on-site edge computing solutions, ensured comprehensive monitoring and management of agricultural data, leading to more informed decision-making and improved operational efficiencies. A hybrid approach often represents the most viable strategy when examining contrasting strengths and weaknesses. Combining edge and cloud solutions allows for the robustness and immediate response of edge computing while still leveraging cloud systems’ advanced analytical capabilities and scalability.

1. Introduction

Digitalization of the agri-food sector is a significant challenge, as animal meat processing has become intensive and concentrated across many sectors [1,2,3]; a deeper and more detailed understanding of poultry meat production processes is crucial for achieving maximum economic and ecological efficiency. The analysis of animal-environment interaction is supported by precision livestock farming (PLF) solutions [4,5], which involve the application of info-communication technologies. The transmission and analysis of data collected on individual animals and the farming environment in large-scale production environments using digital tools on a secure platform is not straightforward. Large-scale livestock farming (including poultry production) may occur in rural areas, far from big cities, where the routine use of info-com devices is not always reliable. At the same time, there is a growing need and demand for digital solutions that increase production efficiency and minimize the use of human labor. Of the data collection tools available for precision livestock technologies, which can be broadly divided into three categories (sensors, microphones, and cameras), cameras are the most relevant in large-scale poultry production to collect individual data from tens of thousands of birds, typically in buildings larger than 1000 m2. Cameras are often considered particularly valuable for large-scale poultry production. They can potentially capture individual data from thousands of birds within buildings typically larger than 1000 m2, providing visual insights that complement numerical environmental data. An additional advantage of cameras is their stability and durability. Cameras can be housed in IP67-rated enclosures more quickly than other sensors, providing robust protection against dust and moisture. This level of durability makes cameras particularly suitable for the challenging environments found in large-scale poultry barns, where maintaining consistent sensor performance can be difficult, while recent advancement in rapid prototyping offers a cost-efficient way to create 3D printed custom sealed and durable cases [6]. The cameras provide the ability to collect images [7] and videos, which add to the numerical data collected on the environmental parameters of the barn (e.g., temperature, humidity, ammonia levels, and airspeed). Data science models can use the images to estimate individual body weight [8]. In contrast, the analysis of the videos can be used to monitor the static and dynamic behavior of the birds [9]. In contrast to numerical data, images and videos are large, and their transmission and analysis place high demands on the digital infrastructure. Artificial intelligence (AI), machine learning, and deep learning have become essential R&D tools today, and their applications in agriculture are increasingly evident. Yet, despite their widespread use in research projects and industry, most of these ML models and results never reach the actual production environment. The above statement is supported by a VentureBeat report [10], which showed that 87% of ML projects never progress beyond the prototype phase. This can be due to several reasons, ranging from failure to collect adequate data or any data, lack of communication between team members, or lack of tools and knowledge essential for a scalable, monitorable, and interpretable system. Almost the smallest part of an ML project is developing the ML model itself. It is also necessary to emphasize the methodology and development culture that facilitates fast and efficient decision-making monitoring and evaluation of the models. Our research aims to bridge this gap and provide practical insights into implementing edge and cloud-based solutions in large-scale poultry farming, thereby contributing to advancing precision livestock farming. An additional consideration would be the sustainability and social responsibility aspect of large-scale farming, where producers are being put under pressure to monitor and assess the ESG-related aspects of their work [11,12].
In our field research, we have investigated two architectures, a cloud-based processing architecture and an edge computing-based processing architecture, in large-scale poultry farming circumstances. During the experiment, we used a high-bandwidth internet connection, which allowed us to implement a cloud-based solution and compare the practical aspects of each approach. Each approach has strengths and weaknesses; cloud-based solutions offer significant computational power and scalability, essential for running complex machine learning (ML) models and large-scale data analysis, but rely on stable internet connectivity. Conversely, edge computing supports ML deployment directly on-site, enabling real-time processing with lower latency and reduced dependency on the internet, though limited computational resources constrain it. This paper will explore these two architectures’ practical differences, benefits, and limitations, focusing on how they support ML applications for precision livestock farming and enhance data-driven decision-making in agricultural environments.

2. Related Works

Numerous studies have explored imaging technologies, processing techniques, and computational models for poultry weight estimation and monitoring systems. Imaging systems rely on visual light (CCD, CMOS), thermal and infrared sensors, and advanced modalities like MRI and CT [13]. Image processing is vital for enhancing accuracy, with color space transformations to HSV and Lab improving object segmentation, as demonstrated in sick broiler detection systems [14,15]. Weight estimation approaches include regression models [16], ANN [17], and SVR techniques [18]. Feature extraction is critical, with 2D features such as area and perimeter [19] and 3D features like volume and surface area [18,20,21] commonly used. Anatomical features such as carcass areas have also been employed for weight prediction [22]. Integrating cloud and edge computing introduces scalability and real-time processing capabilities but poses challenges like latency and resource optimization. These infrastructures are essential for advancing poultry weight estimation systems by enabling distributed computation while addressing unique challenges [21,23]. Despite these advancements, a critical gap remains in ensuring the quality and usability of data collected in real-world environments, where infrastructure and operational constraints significantly influence outcomes. Data collection is inherently challenging due to hardware contamination, unstable weighing platforms, and animal behaviors that hinder accurate measurements [8,24]. We addressed this gap by focusing on methods to maximize the value of collected data, even in the presence of practical problems.

3. Materials and Methods

Our research was carried out on a large-scale goose farm in Northern Hungary. The farm has eight barns measuring 12 m × 72 m × 2.5 m. The production is a two-stage type, with pre-rearing up to 7 weeks. After this period, the geese are placed in the stuffing shed, where they stay for two weeks before being transported to the slaughterhouse. The bedding material is chopped wheat straw. After the day-old geese are received, the litter straw is supplemented with fresh wheat straw by strawing twice a week. The housing technology iss fully automated. An automatic feeding system fills the dry feed into the daily bins of the feeding lines. The feed is then filled into the circular feeding pens on the feeding lines by a motor at the end of the lines. The water permeability of the drinking lines with valves is adapted to the geese’s needs. Computer-controlled ventilation (automatic opening and closing of fans and air inlets), heating technology with heat blowers, and cooling with cooling pads ensure an age-appropriate housing environment for the geese (Figure 1 and Figure 2). The density of the birds is ten geese/m2. The geese are French Landes geese, which can reach 6 kg individual body weight by the end of the 7-week pre-rearing period.
Considering the harsh environment (dust, insects, humidity, and ammonia) in a large-scale poultry farming facility (in rural Hungary), we used outdoor IP67-rated security IP cameras in the stables for image data collection, equipped with built-in infrared illumination, a fixed dome Hikvision DS-2CD1123G0E-I (C) dome IP camera (2MP, IR30m, 2.8 mm, POE), and a Hikvision DS-2CD2143G2-I dome IP camera (4MP, StarLight, IR30m, 2.8 mm, POE). The camera vendor often offered a vendor-specific solution for scanning the camera images or the video stream. Still, we used a camera-independent solution that can be used to perform data collection regardless of the camera type in case it is supported RTSP (RFC 7826: Real-Time Streaming Protocol Version 2.0). The weight data were collected using a bird scale consisting of a suspended weighing plate and a digital data collection unit. The plate and the mechanics were reassembled from a Fancom 747 bird scale and the ILM.C1 pulling scale cell. The cameras in the stable were connected to a Gigabit Ethernet switch in the barn using Category 5e UTP wiring, and power was also supplied over this wire using PoE (Power over Ethernet) technology. The cameras and the scale were fixed to the metal roof structure of the barn. This straight bar load cell (sometimes called a strain gauge) can translate up to 10kg of pressure (force) into an electrical signal. Each load cell can measure the electrical resistance that changes in response to, and is proportional to, the strain (e.g., pressure or force) applied to the bar. With this gauge, the weight of an object can be measured if the object’s weight changes over time or if one needs to sense the presence of an object by measuring strain or load applied to a surface. Each straight bar load cell is made from an aluminum alloy capable of holding a capacity of 10 kg. These load cells have four strain gauges hooked up in a wheatstone bridge formation. Additionally, these load cells offer an IP66 protection rating and feature two M4 and two M5-sized through-holes for mounting purposes.

3.1. Edge-Based Infrastructure

3.1.1. Dataset

Time stamps were assigned to the collected weight data so that we could later match the data on individual bird weight and camera-made image pairs. The measured weight data were transmitted via the RS485 interface to the data acquisition computer, which also processed the camera images. We used images at 2 MPx resolution. A Raspberry Pi 3b microcomputer on a 32 GB SD card and an external 1 TB hard drive captured and stored the camera images (Figure 3). The data were recorded in weekly rotation, so new data overwrote the oldest data to ensure available storage space. The measured weight data were labeled with a timestamp and then uploaded to a central database. The validation of the camera images to be included in the neural network training dataset was performed in several steps. First, those images were selected from the collected ones where exactly one bird is visible on the scale, the scale appears to be at rest, and the bird is on the scale with its entire body. All other images where the birds were not on the measuring plate with their whole body were removed from the database, which included pictures where a lot of birds were in one place, the edges of the scale were hidden by the birds, the reference point was wrong, or there were no birds on the scale. These cases were filtered during the comparison with the weighted data.
The measured values that did not match the development curve of the birds and the corresponding images were also removed from the cleaned database. Consecutive, identical images were averaged. Images that did not carry additional information were discarded (e.g., images where a bird was permanently on the scales). As a result, only those images that could serve as inputs to the feature extractor component were left in the image database.
During a single 10-week cycle, our study implemented a rigorous image collection protocol, capturing images every 10 s from 8 am to 8 pm daily. This schedule was explicitly chosen to coincide with the hours when the stable lights were on, ensuring that all images were captured in color. The importance of using color images stems from their suitability for our post-processing needs, where color depth plays a critical role in accurately analyzing and distinguishing features relevant to our study. This systematic collection resulted in approximately 4320 images daily, accumulating 302,400 images throughout the study. When the lights were turned off at night, the camera only captured black and white images. These monochrome photos were deemed unsuitable for our processing algorithms, which require color differentiation to function correctly. Consequently, pictures captured outside the 8 am to 8 pm window were automatically discarded. This strategic approach ensured that the data for analyzing geese’s growth and weight dynamics was highly reliable.

3.1.2. Preparation of Mask Dataset

A segmentation component was used to process the images, as annotated data were needed to train the neural network. To reduce the workload of the learning process, we added instance segmentation to the image sorting software, which selected the birds on the scale. The segmentation represented the polygons containing the scale and the birds. The publicly available LabelMe software [25] was used to generate this, which offered several inclusion shapes, including the polygon with the unique shape. The LabelMe software has the additional advantage of supporting the concatenation and conversion of the files generated during annotation into more popular formats.
Figure 4 shows the working process using LabelMe. Because the goose’s shape is irregular, we used polygon labels for labeling. Figure 4 also shows the visualization results. It can be seen that the two valid pieces of information in the image—the scale and the goose—are labeled.
Finally, the mask image was created, as shown in Figure 5. We obtained two pieces of valuable information for extracting feature sets. A final “.json” format file and “.png” format mask file were generated, which could be applied in subsequent feature extraction steps. Then, we can further extract the feature set based on it in the following steps.

3.1.3. Preparation of Key Point Dataset

The geese in the barn often moved during the recording and are in different postures during their daily lives, even when standing still. To improve the accuracy of the follow-up model for weight prediction, we have annotated a dataset containing critical points of the goose body parts. Geese farmers are familiar with many typical goose poses, which we have often encountered on our recordings. For example, geese usually have their wings spread or their necks extended. This movement increased the number of occupied areas to a great extent. As a result, the masked area will be larger and thus not match the actual weight, resulting in inaccurate modeling. We have annotated each of the following five key points on the goose: the tail, the middle of the body, the neck, the left wing, and the right wing, as shown in Figure 6.
Thus, even if the goose stretches its neck to increase the area, this does not affect the effective weight area. The left and right wings are joined together to form the lateral width of the goose’s body. It does not affect the effective weight area even if the goose opens its wings to increase the area. The area formed by fitting the five points can be used later to determine the actual effective weight range of the bird. In this way, the accuracy of the modeling can be improved. A final “.json” format file is generated, which can be applied in subsequent feature extraction steps. At the end of this procedure, the training dataset was established in the edge case.

3.1.4. Feature Extraction

In this part, we employed the Mask R-CNN algorithm to train the dataset we had prepared in advance with the LabelMe annotation tool. The dataset included the original images and the corresponding annotation information. The .json file contained the location and category of each marker point; we needed to convert this .json file into a .png mask file. The dataset was then converted to the COCO format, which the Mask R-CNN model supports.
The next step was to extract the feature set we were looking for from the images: the number of animals on the scale and the area occupied. This was accomplished by an instance segmentation component that detected the scale and the birds. The area was given by the polygon capturing the detected birds. As a last step, we matched the weight measurement data along the timestamps, computed average weight and area as a function of the animals in the image, and performed an outlier filter to delete the erroneous values.
The development of filtering components that processed the data was also presented, where the aim was to be easily integrated into the pipeline and usable in other machine vision and learning-based projects, being well customizable depending on the task. To automate the data collection process, the first step was to match the weight data on the image retrieved from the camera with the retrieved image. The operation of the automated pipeline was improved by using filter modules that could be loaded separately. There were several reasons why repetitive errors had to be detected; firstly, bias was introduced into the dataset, giving the neural network more chance to learn specific patterns; the network’s generalization ability was degraded, becoming less accurate on data it had not seen before, minimizing the storage capacity requirement. To achieve proper scalability on a large dataset, the difference hash was used, which had several advantages: first, it was not sensitive to different resolutions and aspect ratios; second, changing the contrast did not change the hash value or altered it only slightly, so that hash values of very similar images were closer to each other and the solution was fast. To count as many repetitive images as possible, the method used grayscale images and did not look for a complete match between hash values, allowing for slight variations.
Another approach was to pre-filter the images, i.e., to decide before writing them to disk whether a given frame had new information. For this purpose, we used a motion detector. In many cases, the movement of birds or dirt on the camera caused blurred images, significantly impairing automatic segmentation and manual mask annotation. Therefore, we implemented edge detection on the input image since the fewer edges found, the more likely the image was blurred. We chose a Laplace operator and ran it on three test images (Figure 7) over which we superimposed an artificial blur. The first image remained sharp everywhere, the second blurred on the scale area, and the last blurred everywhere.
The variance was used to determine the fuzziness metric. A more considerable variance is related to the number of detected edges, so the smaller the variance, the fuzzier the image is considered. In the case of edge computing, the Python language was selected, because, in deep learning, big data, and image processing, this language has several libraries that make the development much more accessible. One of our primary input data sources was a set of images from the OpenCV library and Tensorflow and Keras, which contain various essential predefined machine learning models. In addition, the pandas module helped us with data processing, and for annotation, we used the publicly available LabelMe software. The infrastructure diagram for the edge solution can be seen in Figure 8.

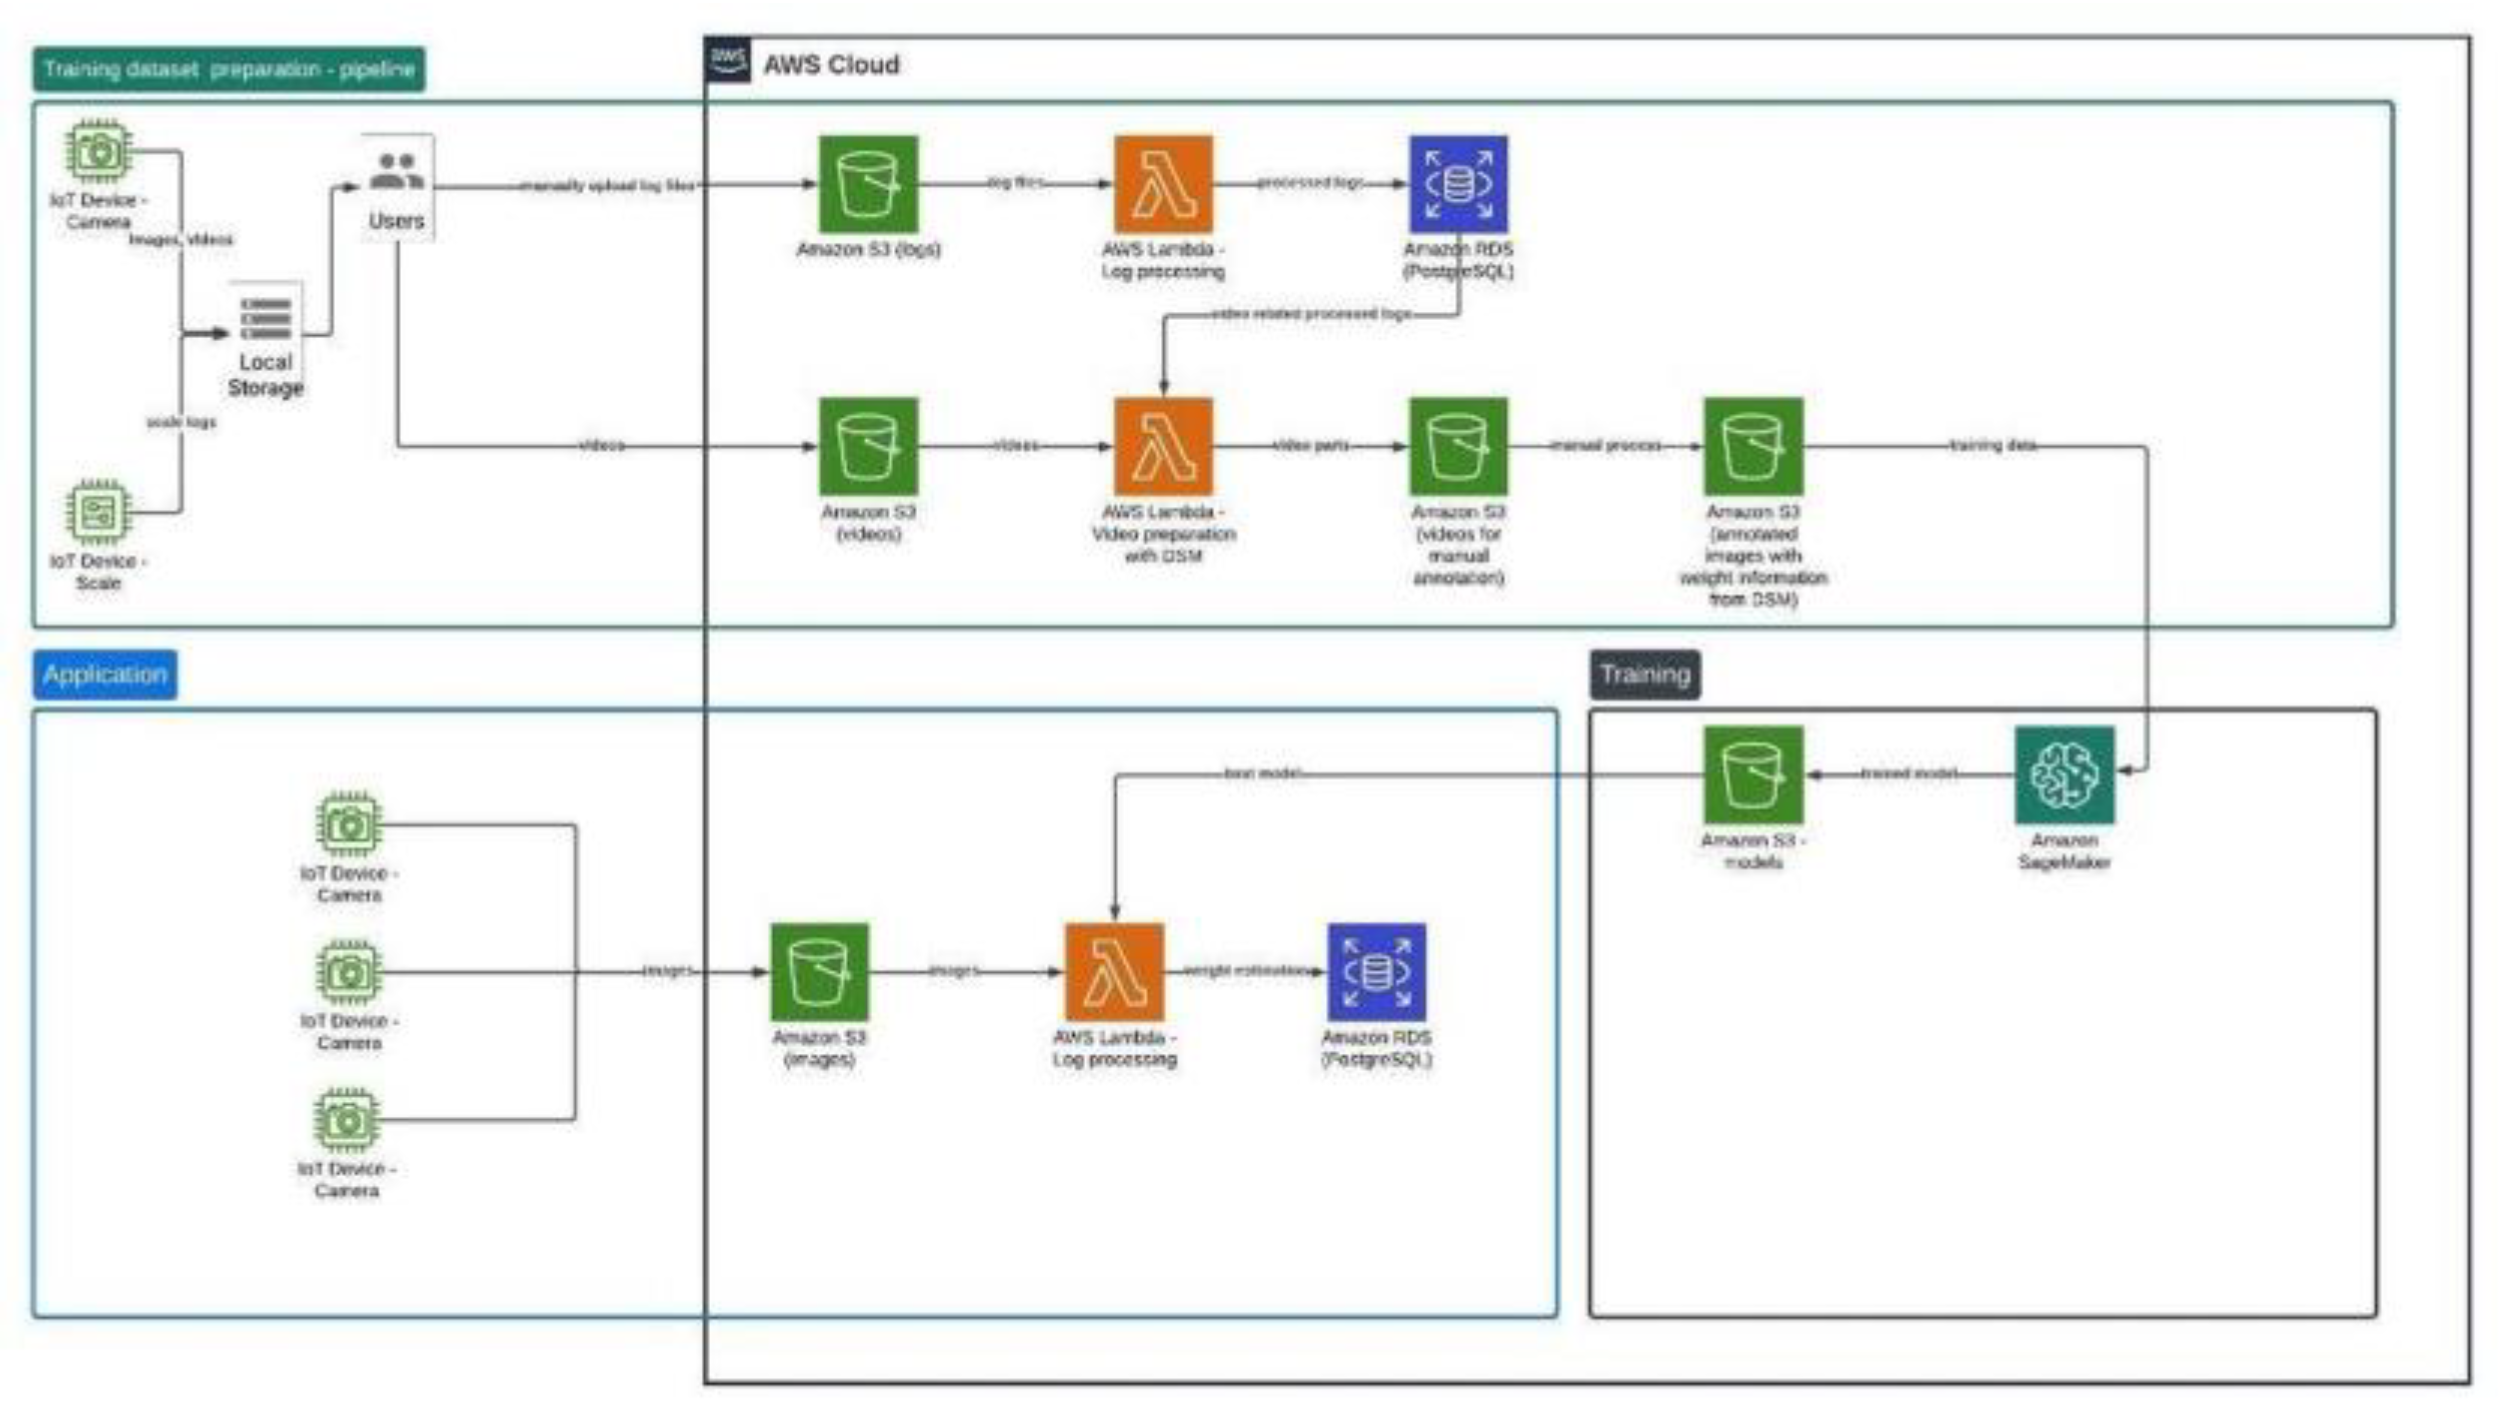
3.2. Cloud-Based Solution

3.2.1. AWS Infrastructure

Our precision agriculture study utilized comprehensive Amazon Web Services (AWS) cloud services to streamline our data management and processing workflows (Figure 9), ensuring efficient handling and scalability of extensive datasets. Let us introduce here a concise overview of the specific AWS services employed and their roles in our project:
AWS S3 [26]: Amazon Simple Storage Service (S3) was used to store two types of data: log files with scale measurements and images. Separate S3 buckets were assigned to each data type to improve organization and apply appropriate access controls.
AWS Lifecycle Policies: To manage storage costs, lifecycle policies were configured on the S3 buckets. These policies automatically transitioned older images to lower-cost storage classes (S3 Standard-IA, S3 Glacier) based on age, reducing costs while maintaining access to data when needed.
AWS RDS with PostgreSQL [27]: Amazon RDS was used to host a PostgreSQL database for storing and querying processed log file data. This setup enabled secure, reliable data storage and supported complex queries for data analysis.
Infrastructure as Code (IaC): We adopted an infrastructure-as-code approach, using AWS services to manage and provision our cloud resources through code. This method allowed us to maintain consistency across various deployment environments, reduce manual configuration errors, and streamline the updating and scaling of our infrastructure.
AWS Lambda [28]: For data processing, we employed AWS Lambda to implement code in response to triggers from S3, allowing us to process incoming data files automatically without managing servers. This serverless computing service enables real-time data processing and seamless data flow management.
AWS SageMaker [29]: We utilized AWS SageMaker to support our machine learning workflows, including training and deploying models. This fully managed service provided a central platform for all stages of machine learning development, from model building and training to deployment and monitoring, enhancing the efficiency and scalability of our machine learning efforts.
These AWS services collectively supported our goal to manage large-scale data effectively, allowing for dynamic scaling and robust data processing capabilities essential for the success of our precision agriculture initiatives. This integrated AWS infrastructure ensured that each aspect of our data handling—from initial collection to detailed analysis—was optimized for performance, cost, and scalability.

3.2.2. Dataset

In the cloud-based implementation of our precision agriculture study, we manually collected two-hour-long video segments daily over a ten-week cycle using the interface provided by Hikvision cameras online. This manual process facilitated the verification of data quality and connectivity while ensuring the operational integrity of the camera systems. A substantial total of 140 h of video was captured throughout this period.
We meticulously organized our data storage and management strategy using AWS cloud services to ensure the efficient handling of extensive datasets. We had a log file that captured the scale information in grams, for which we set up a dedicated AWS S3 bucket to store these logs systematically. Another separate S3 bucket was explicitly created for storing videos. To manage costs effectively while dealing with a high volume of data, we implemented lifecycle policies on the image storage bucket, which helped optimize the storage costs by transitioning older videos to cheaper storage tools within AWS.
For data cleaning and preprocessing, we developed specialized algorithms containerized with Docker [30] to ensure stability, consistency, and reproducibility. The data cleaning algorithm processed scale readings by averaging multiple entries within the same second and imputing missing data when necessary, using the average of adjacent values to maintain the continuity of the dataset. Following the data cleaning process, we compiled a sequence of scale readings for each second, each entry marked as either a known value or a null. Then, we delineated intervals in this sequence that were free of nulls. We computed a difference sequence within these complete intervals to examine weight changes, an essential factor for precise weight estimations.
The processed results from the log files were analyzed and stored efficiently for future access and analysis. For this purpose, we utilized AWS RDS with a PostgreSQL database. The specific version of PostgreSQL used was configured to fit our requirements for robust data management and querying capabilities. By storing the processed results in an AWS RDS database, we ensured that the data were secure, easily retrievable, and manageable, facilitating complex queries and extensive data analysis.
This automated pipeline, from data storage in S3 to processing via Lambda and storing results in RDS, underscored our commitment to leveraging cloud technology for efficient, scalable, and reliable data management.
Regarding the modeling of the growth trajectory of geese, we initially used Gaussian Process Regression (GPR) with a Radial Basis Function (RBF) kernel [31,32] to create a continuous, smooth growth curve from the known weekly optimal weight curve (Figure 10).
Considering the computational intensity of GPR and the sporadic nature of our data, we opted to execute this model locally rather than in the cloud. This decision allowed for more direct control over the computing resources and reduced dependencies on cloud services for this specific task. Once the growth curve was estimated, it was uploaded to an S3 bucket, making it dynamically accessible to other programs and systems within our infrastructure. This model provided us with a growth curve and estimated the uncertainty around these predictions, which was instrumental in setting a flexible yet precise threshold for detecting significant weight changes. To this end, we expanded the model’s uncertainty margin by an additional +/−10% to ensure robust detection of actual weight anomalies due to animal interactions with the scale.
We utilized a difference sequence stored in an AWS RDS database to monitor and respond to these anomalies. This sequence, representing changes in weight over time, allowed us to systematically check each measurement against the threshold defined by the GPR model’s expanded uncertainty margin. By leveraging this approach, our system could promptly identify and address significant deviations from the expected weight trajectory, enhancing the reliability and accuracy of our weight monitoring processes. This integration ensured that the estimated growth curves could be easily incorporated into our broader analytical framework, augmenting the dynamic capabilities of our system and facilitating real-time data-driven decision-making.
Once a potential interaction was identified, the exact time of the event was used to pinpoint and extract the corresponding video segment from the continuous recording. This segment was then uploaded to an AWS S3 bucket designated for storing video data related to significant events. Concurrently, the event’s details—such as the time and observed weight difference—were recorded in an AWS RDS database, establishing a preliminary link between the weight data and the video.
In our study, we used a detailed approach to image analysis to confirm the presence of a goose from the collected video segments. Once we identified and cropped these images, they were fed into a Convolutional Neural Network (CNN) for preliminary classification, ensuring that only relevant images were processed further. This CNN was explicitly designed to detect and confirm the presence of a goose. The robustness of this method was enhanced by leveraging a Support Vector Regression (SVR) mode using features such as size and shape, cited in research [33], following foundational principles [34] and subsequent developments [35] in the late 1990s and early 2000s.
We selected 752 images paired with precise scale data to train and validate this SVR model, employing a dynamic difference sequence method. The choice of 752 images was based on our goal to minimize the dataset size while ensuring the model’s stability. Once the learning and test results were sufficiently accurate, we determined that additional data collection was unnecessary and halted the process. This method facilitated the systematic sampling of images across various growth stages and environmental conditions, capturing a broad spectrum of weight-influencing features. The dataset was categorized into training (80%) and validation (20%) subsets to optimize learning and ensure the model’s reliability on new, unseen data.
Furthermore, our preprocessing techniques enabled us to expand the selected image set into a dataset of 1214 images, categorized as “goose” or “not goose”, with 605 images labeled as “not goose”. This dataset was divided into training (70%), validation (20%), and testing (10%) subsets. Each image was resized to 256 × 256 pixels to standardize inputs and ensure uniform training conditions. We applied various data augmentation techniques to enhance the model’s generalization capabilities, including rotation, shifting, shearing, zooming, and flipping. Our CNN architecture featured complex convolutional layers and max pooling, culminating in a sigmoid output layer for accurate classification.
To support these machine-learning workflows, we utilized AWS SageMaker, which provided a robust platform for training, deploying, and monitoring our machine-learning models. SageMaker’s integration allowed us to easily manage and version control our machine learning models, deploying them efficiently with minimal downtime and ensuring that each model version was adequately documented and could be rolled back if necessary.

4. Results

Our study in precision poultry farming utilized a dual-approach data collection and processing system, focusing on the distinct contributions of edge-based and cloud-based solutions to monitoring and analyzing geese’s growth and weight. This section details the outcomes and efficiencies gained from each approach.

4.1. Edge-Based Results

Significant effort was invested into validating and annotating the captured images. Using the LabelMe software, instance segmentation was applied meticulously to identify and label images where exactly one goose was visible on the scale. This method ensured that images with partial visibility or several geese, which could distort the weight data, were excluded from the dataset. The system was configured to filter out repetitive or unclear images using advanced motion detection and edge detection algorithms. This process helped retain only the most transparent and relevant images for further processing. The edge detection tools were particularly useful in evaluating the quality of images, discarding any that did not meet the strict criteria necessary for accurate weight estimation. In our edge-based system, implementing advanced filtering mechanisms during the training data preparation process proved essential for achieving accurate and reliable model training. Many of these filtering techniques can be adapted and applied during real-time deployment to maintain input quality. By incorporating these real-time filters, the system ensures that only clear, relevant images are processed by the ML model, enhancing real-time analysis accuracy and maintaining low-latency responses. This dual-purpose filtering application—both during training and in real-time operation—demonstrates the importance of preprocessing for consistent system performance. Our edge-based system can handle the inherent variability of agricultural conditions, ensuring consistent and reliable outputs.

4.2. Cloud-Based Solution

In contrast, our cloud-based solution leveraged AWS’s robust infrastructure to streamline data handling and processing. As soon as log files containing scale data in grams were downloaded, they were uploaded to a designated AWS S3 bucket. This setup was seamlessly integrated with AWS Lambda and configured to detect and process new files as they arrived automatically. AWS Lambda ensured that log files were handled efficiently without manual intervention, significantly speeding up the data processing workflow.
The difference sequence method was a pivotal part of our data analysis, employed to monitor changes in weight as recorded by the scale. This method was particularly useful in discerning the normal weight fluctuations from those indicating an animal’s direct interaction with the scale. Each time an animal stepped onto or off the scale, a notable difference in weight was recorded. By comparing these differences against the adjusted growth curve, which included an additional 10% margin to account for uncertainty, we could effectively determine if the observed weight change was within the expected limits.
This automated and integrated approach facilitated real-time monitoring and enhanced the accuracy of our weight measurements. We could adjust our data by promptly identifying instances where an animal’s interaction likely caused a recorded weight change. This capability was crucial for maintaining high data quality and ensuring that our growth models remained accurate and reflective of proper animal growth patterns rather than environmental or operational factors artifacts.
These results underscored the effectiveness of combining edge and cloud-based solutions to overcome the distinct challenges of precision agriculture settings. Our system’s dynamic capability, supported by AWS’s robust cloud infrastructure and on-site edge computing solutions, ensured comprehensive monitoring and management of agricultural data, leading to more informed decision-making and improved operational efficiencies. In contrast, our cloud-based solution leveraged the extensive capabilities of AWS’s robust infrastructure to streamline and optimize data handling and processing. Central to this approach was the automated uploading log files containing weight data in grams to a designated AWS S3 bucket. This setup was integrated with AWS Lambda and configured to detect and process new files as they arrived. The seamless automation of data ingestion and initial processing significantly reduced manual intervention, enhancing the reliability and speed of data handling. The automated nature of this system ensured a higher level of consistency and allowed for more efficient resource allocation, ultimately facilitating more timely insights.
A notable achievement of our cloud-based solution was the successful implementation of the difference sequence method for practical data analysis. This approach was pivotal in addressing challenges associated with the stability and reliability of scale readings, particularly during power outages or interruptions that could shift the scale’s zero point, resulting in skewed or inaccurate absolute measurements. By focusing on relative changes rather than absolute values, the difference sequence method maintained the integrity of the data, providing accurate measurements even when the baseline of the scale was altered. This breakthrough significantly enhanced the robustness of the data processing pipeline, allowing it to withstand and adapt to operational inconsistencies without compromising data quality.
Another strength of our cloud-based solution was the capability to leverage data involving multiple animals on the scale simultaneously. Traditionally, such data would have been considered unreliable due to the inability to discern individual weights when multiple animals were present. However, by analyzing the incremental weight changes when an animal stepped on or off the scale, our method was able to extract and isolate individual weight data from complex, multi-animal scenarios. This innovative use of data transformation turned previously unusable datasets into valuable sources of information, greatly expanding the range and volume of data available for analysis and training.

5. Discussion

Several practical problems occurred with the hanging bird scales that recorded individual bird weights for learning the algorithm. First, a small circular plate was fitted to the scale, successfully used in a previous project for ducks [8]. However, in this case, the scale was unstable due to the heavier birds and the high suspension point, causing the animals to avoid stepping on the scale. Therefore, measurements were obtained very rarely and only from smaller specimens. To measure more often, the weighing platform was repositioned lower, closer to the barn floor, and the measuring area was increased, as shown in Figure 3. The optimal height had to be identified since the birds would carry the littering straw to the weighing plate in case of a plate that was too low hanging, causing inaccurate measurements. Since the weighing plate’s size, material, and shape greatly influenced the birds’ willingness to step on the scales, the accuracy of the measurement, different materials, and shapes of weighing plates were tested. They were contaminated at different rates, and their material and color made it easier or more challenging to detect and accurately segment birds on the weighing pan.
One major challenge encountered in automated bird weighing systems was the accumulation of feces (guano) and other debris on the weighing platform. These increased the measured weight data and generated continuous errors that an automatic offset system had to counter. A promising solution to this challenge involves using automatic weighing systems such as pan scales. These scales, designed as platforms suspended low above the litter, measure the weight of individual birds as they step onto them, significantly reducing the need for active human labor [24].
An innovative approach to increase the frequency of weight measurements involves placing these scales as obstacles that birds must traverse to access feeders or drinkers. This strategy leverages the birds’ natural behavior to enhance data collection. Scales placed within nests (e.g., at the entrance) are particularly effective for laying hens, and similar techniques have been used in monitoring wild birds [36]. Automatic measurements also mitigate stress on chickens by eliminating the need for manual handling and human interactions [37]. The real-time accessibility of collected data is crucial for efficient farm management, enabling farmers to promptly monitor weight increments and address potential nutritional deficiencies [38,39].
In the context of EDGE computing-based bird weighing, DeepLabCut (DLC) was initially considered but not used as a final solution due to difficulties in accurately determining the position of body parts during annotation. Instead, the goose mask area calculated by Mask R-CNN was chosen as the primary feature for weight estimation. Extended necks in geese posed a problem, as they covered a larger area, negatively impacting the weight estimation algorithm. To address this, we experimented with two solutions: first, using DLC to detect the points on the birds’ backs connected to the neck and then cutting the mask accordingly; second, re-training Mask R-CNN with an annotated dataset excluding the neck area. The latter approach proved more effective and provided more accurate annotations.
Despite these advancements, measurement errors were anticipated. The weight of the measured animals should fall within the lower and upper thresholds of the estimated curve. Erroneous measurements were filtered out during outlier screening. A critical component of this process was the manual review of video segments stored in the cloud. We could accurately pair specific animals with their corresponding weight data by visually confirming which animal caused anomalies in the difference sequence method. This manual verification enriched our training dataset with precise animal-weight pairings and provided multiple images from each video segment, offering varied visual data points for each interaction.
Integrating GPR with the different sequence methods and leveraging cloud storage and database management significantly enhanced our ability to build a comprehensive and accurate training dataset. This dataset is essential for training sophisticated models to predict animal weight changes, improving system accuracy, and understanding animal behavior related to physical changes over time. Our automated pipeline, which includes data storage in S3, processing via Lambda, and result storage in RDS, exemplifies our commitment to utilizing cloud technology for efficient, scalable, and reliable data management. This setup ensures high data integrity and accessibility, which are vital for ongoing analysis and monitoring in our study.
In the rapidly evolving domain of precision agriculture, integrating technological solutions for data processing and analysis is crucial. These solutions are categorized into two distinct approaches: edge and cloud-based. Each has unique benefits and limitations tailored to farm management.
Edge solutions process and analyze data locally on devices deployed directly in the field, such as farms or stables. This autonomy allows for real-time analysis without reliance on broadband wireless or wired internet connections. This is a significant benefit in remote or rural settings where connectivity may be intermittent or unavailable. Devices in these scenarios are subjected to more considerable wear and tear than those in more controlled environments, leading to more frequent failures and the need for robust hardware that can withstand harsh conditions. Despite these challenges, edge computing facilitates immediate computational responses, which is critical in environments like agriculture, where timing and local data processing can directly influence operational decisions.
However, resolution and computational power limitations can hinder the effectiveness of specific advanced analytical methods. For example, in edge computing-based bird weighing systems, the use of Deep Lab Cut (DLC) was not viable as the precise positioning of body parts was challenging due to the small size of the animals and the resolution constraints. Instead, the Mask R-CNN framework was adapted to exclude the neck and head in weight estimations to avoid inaccuracies caused by the varying poses of the geese, illustrating a tailored approach to overcome specific technological hurdles.
On the other hand, cloud-based solutions offer a centralized data processing approach, where data from multiple edge devices are collected and analyzed using powerful cloud computing resources. This method supports scalable and complex analytics, such as machine learning algorithms and large-scale data integrations, which are invaluable for predictive modeling and advanced decision-making processes. The centralized nature of cloud computing allows for comprehensive management and more accessible updates, making it ideal for scenarios where connectivity is reliable and data needs are extensive.

6. Future Works

In future work, we aim to extend the current system by incorporating environmental parameters inside the barn and external meteorological stations to analyze their effects on weight estimation, behavior, and potential connections with weight changes. Additionally, we plan to advance and automate the creation of the learning dataset, particularly by enhancing the difference sequence method (DSM). This includes developing a more flexible k-DSM methodology to address cases where changes take longer than one second and integrating animal tracking to better associate changes with individual animals. Lastly, we aim to process the entire dataset of videos, currently spanning 2–3 TB, and make it publicly accessible to facilitate further research and development in the field.

7. Conclusions

The growing shortage of human resources in large-scale poultry production, increasingly concentrated production systems, and rising input prices are driving the need for digital solutions in everyday practice. Although more research results have been published in the literature in recent years, few computer vision developments have been validated in large-scale operations that poultry farmers can use in their daily work. Reasons include properly transmitting and storing large amounts of images and video and securely returning the information to a visualization platform that farmers can use. The dependency on continuous internet connectivity is a significant limitation, especially in rural or undeveloped regions lacking telecommunication infrastructure. For instance, in many African countries, less than 40% of farming households have internet access, and the data costs remain prohibitively high. This connectivity gap is not just a challenge in developing nations; a 2023 report by Vodafone UK highlighted that 99.4% of rural constituencies in Great Britain suffer from inadequate 5G coverage, underscoring a global issue in rural digital connectivity.
Given these contrasting strengths and weaknesses, a hybrid approach often represents the most viable strategy. Combining edge and cloud solutions allows for the robustness and immediate response of edge computing while still leveraging cloud systems’ advanced analytical capabilities and scalability. This approach supports a more dynamic adaptation to the diverse needs of modern livestock farming. Additionally, because systems like ours require regular calibration to ensure accurate and reliable performance, having a robust infrastructure for training dataset creation is crucial. This ensures that models remain up to date and capable of handling the variability inherent in livestock environments.
Expanding technologies like 5G could dramatically enhance edge and cloud computing solutions by providing faster, more reliable internet connections. However, the uneven rollout of 5G, especially in rural areas, continues to pose challenges. Infrastructure developments are costly, and the economic return in sparsely populated agricultural regions is often insufficient to justify the investment by telecommunication companies.
Precision livestock farming is at a transformative juncture, with technological advancements offering unprecedented opportunities to enhance farm management and productivity. The strategic integration of edge and cloud computing technologies, tailored to specific local conditions and connectivity landscapes, will be crucial in overcoming current limitations and unlocking the potential of data-driven agriculture globally. As technology and infrastructure evolve, the agricultural sector must adapt to these changes to maximize food production and sustainability benefits.

Author Contributions

Conceptualization, M.A., S.S. and G.T.; methodology, S.S. and G.T.; software, G.T.; validation, S.S. and T.H.; formal analysis, G.T.; investigation, M.A., S.S. and G.T.; resources, M.A. and S.S.; writing—original draft preparation, G.T., M.A. and S.S.; writing—review and editing, M.A., S.S. and T.H.; visualization, G.T.; supervision, M.A. and S.S.; project administration, G.T.; funding acquisition, M.A. All authors have read and agreed to the published version of the manuscript.

Funding

Marta Alexy’s work was funded by Project TKP2021-NVA-29 and was implemented with the support provided by the Ministry of Culture and Innovation of Hungary from the National Research, Development, and Innovation Fund, and Toth Gergo’s work was carried out with the support provided by the National Research, Development, and Innovation Fund of the Ministry of Culture and Innovation, financed by project number 2020-1.1.2-PIACI-KFI-2021-00237. T. Haidegger is a Consolidator Researcher supported by the Distinguished Researcher program of Óbuda University.

Institutional Review Board Statement

Ethical review and approval were not required for this study under Hungarian regulations, as it involved non-invasive observational research using remote cameras. The study adhered to all applicable Hungarian laws, including Act XXVIII of 1998 on the Protection and Humane Treatment of Animals, and followed international ethical guidelines for the ethical treatment of animals.

Informed Consent Statement

Not applicable.

Data Availability Statement

The data utilized in this study are owned by LAB-NYÚL Kft, and access to the proprietary dataset can be requested by contacting LAB-NYÚL Kft via https://labnyul.hu, accessed day on 14 October 2024 Access will be subject to approval and may require signing a data-sharing agreement. In collaboration with LAB-NYÚL Kft, we are working to finalize and legally validate a curated subset of the dataset (<50 GB) for public release. Once approved, this subset will be made available via Zenodo under a CC BY 4.0 license to ensure proper attribution and compliance with legal and ethical standards. In addition, we are preparing a larger dataset designed to extend the publicly available data. This larger dataset, which will encompass several terabytes, is being developed in collaboration with LAB-NYÚL Kft to ensure compliance with all legal and ethical requirements. Once finalized, the dataset will be hosted on Dryad to provide robust storage and accessibility for the research community.

Conflicts of Interest

The authors declare no conflicts of interest.

References

  1. Takács, K.; Mason, A.; Cordova-Lopez, L.E.; Alexy, M.; Galambos, P.; Haidegger, T. Current Safety Legislation of Food Processing Smart Robot Systems–The Red Meat Sector. Acta Polytech. Hung. 2022, 19, 249–267. [Google Scholar] [CrossRef]
  2. Mason, A.; de Medeiros Esper, I.; Korostynska, O.; Cordova-Lopez, L.E.; Romanov, D.; Pinceková, M.; Bjørnstad, P.H.; Alvseike, O.; Popov, A.; Smolkin, O.; et al. RoBUTCHER: A novel robotic meat factory cell platform. Int. J. Robot. Res. 2024, 43, 1711–1730. [Google Scholar] [CrossRef]
  3. Mason, A.; Haidegger, T.; Alvseike, O. Time for change: The case of robotic food processing. IEEE Robot. Autom. Mag. 2023, 30, 116–122. [Google Scholar] [CrossRef]
  4. Berckmans, D. General introduction to precision livestock farming. Anim. Front. 2017, 7, 6–11. [Google Scholar] [CrossRef]
  5. Norton, T.; Chen, C.; Larsen, M.L.V.; Berckmans, D. Review: Precision livestock farming: Building ‘digital representations’ to bring the animals closer to the farmer. Animal 2019, 13, 3009–3017. [Google Scholar] [CrossRef]
  6. Jaksa, L.; Azamatov, B.; Nazenova, G.; Alontseva, D.; Haidegger, T. State of the art in Medical Additive Manufacturing. Acta Polytech. Hung. 2023, 20, 8. [Google Scholar]
  7. Okinda, C.; Nyalala, I.; Korohou, T.; Wang, J.; Achieng, T.; Wamalwa, P.; Mang, T.; Shen, M. A review on computer vision systems in the monitoring of poultry: A welfare perspective. Artif. Intell. Agric. 2020, 4, 184–208. [Google Scholar] [CrossRef]
  8. Szabo, S.; Alexy, M. Practical Aspects of Weight Measurement Using Image Processing Methods in Waterfowl Production. Agriculture 2022, 12, 1869. [Google Scholar] [CrossRef]
  9. Kristensen, H.H.; Aerts, J.M.; Leroy, T.; Wathes, C.M.; Berckmans, D. We are modeling the dynamic activity of broiler chickens in response to step-wise changes in light intensity. Appl. Anim. Behav. Sci. 2006, 101, 125–143. [Google Scholar] [CrossRef]
  10. Available online: https://venturebeat.com/ai/why-do-87-of-data-science-projects-never-make-it-into-production/ (accessed on 13 June 2024).
  11. Haidegger, T.; Mai, V.; Mörch, C.M.; Boesl, D.O.; Jacobs, A.; Khamis, A.; Lach, L.; Vanderborght, B. Robotics: Enabler and inhibitor of the sustainable development goals. Sustain. Prod. Consum. 2023, 43, 422–434. [Google Scholar] [CrossRef]
  12. Bist, R.B.; Bist, K.; Poudel, S.; Subedi, D.; Yang, X.; Paneru, B.; Mani, S.; Wang, D.; Chai, L. Sustainable poultry farming practices: A critical review of current strategies and future prospects. Poult. Sci. 2024, 104295. [Google Scholar] [CrossRef]
  13. Yu, K.; Ren, J.; Zhao, Y. Principles, developments, and applications of laser-induced breakdown spectroscopy in agriculture: A review. Artif. Intell. Agric. 2020, 4, 127–139. [Google Scholar] [CrossRef]
  14. Cheng, H.-D.; Jiang, X.H.; Sun, Y.; Wang, J. Color image segmentation: Advances and prospects. Pattern Recognit. 2001, 34, 2259–2281. [Google Scholar] [CrossRef]
  15. Zhuang, X.; Bi, M.; Guo, J.; Wu, S.; Zhang, T. Development of an early warning algorithm to detect sick broilers. Comput. Electron. Agric. 2018, 144, 102–113. [Google Scholar] [CrossRef]
  16. Mollah, M.B.R.; Hasan, M.A.; Salam, M.A.; Ali, M.A. Digital image analysis to estimate the live weight of broiler. Comput. Electron. Agric. 2010, 72, 48–52. [Google Scholar] [CrossRef]
  17. Amraei, S.; Mehdizadeh, S.A.; Näas, I.A. Development of a transfer function for weight prediction of live broiler chicken using machine vision. Eng. Agrícola 2018, 38, 776–782. [Google Scholar] [CrossRef]
  18. Amraei, S.; Mehdizadeh, S.A.; Sallary, S. Application of computer vision and support vector regression for weight prediction of live broiler chicken. Eng. Agric. Environ. Food 2017, 10, 266–271. [Google Scholar] [CrossRef]
  19. Amraei, S.; Mehdizadeh, S.A.; Salari, S. Broiler weight estimation based on machine vision and artificial neural network. Br. Poult. Sci. 2017, 58, 200–205. [Google Scholar] [CrossRef] [PubMed]
  20. Du, C.-J.; Sun, D.-W. Estimating the surface area and volume of ellipsoidal ham using computer vision. J. Food Eng. 2006, 73, 260–268. [Google Scholar] [CrossRef]
  21. Berckmans, D. Precision livestock farming technologies for welfare management in intensive livestock systems. Rev. Sci. Tech. De L’office Int. Des Epizoot. 2014, 33, 189–196. [Google Scholar] [CrossRef] [PubMed]
  22. Okinda, C.; Sun, Y.; Nyalala, I.; Korohou, T.; Opiyo, S.; Wang, J.; Shen, M. Egg volume estimation based on image processing and computer vision. J. Food Eng. 2020, 283, 110041. [Google Scholar] [CrossRef]
  23. Wang, L.; Sun, C.; Li, W.; Ji, Z.; Zhang, X.; Wang, Y.; Lei, P.; Yang, X. Establishment of broiler quality estimation model based on depth image and BP neural network. Trans. Chin. Soc. Agric. Eng. 2017, 33, 199–205. [Google Scholar]
  24. Chedad, A.; Vranken, E.; Aerts, J.-M.; Berckmans, D. Behaviour of Chickens Towards Automatic Weighing Systems. IFAC Proc. Vol. 2000, 33, 207–212. [Google Scholar] [CrossRef]
  25. Russell, B.C.; Torralba, A.; Murphy, K.P.; Freeman, W.T. LabelMe: A Database and Web-Based Tool for Image Annotation. Int. J. Comput. Vis. 2007, 77, 157–173. [Google Scholar] [CrossRef]
  26. Available online: https://aws.amazon.com/s3/ (accessed on 13 November 2024).
  27. Available online: https://aws.amazon.com/rds/ (accessed on 13 November 2024).
  28. Available online: https://aws.amazon.com/lambda/ (accessed on 13 November 2024).
  29. Available online: https://aws.amazon.com/sagemaker/ (accessed on 13 November 2024).
  30. Available online: https://www.docker.com/ (accessed on 13 June 2024).
  31. Rasmussen, C.E.; Nickisch, H. Gaussian processes for machine learning (GPML) toolbox. J. Mach. Learn. Res. 2010, 11, 3011–3015. [Google Scholar]
  32. Buhmann, M.D. Radial basis functions. Acta Numer. 2000, 9, 1–38. [Google Scholar] [CrossRef]
  33. Mortensen, A.K.; Lisouski, P.; Ahrendt, P. Weight prediction of broiler chickens using 3D computer vision. Comput. Electron. Agric. 2016, 123, 319–326. [Google Scholar] [CrossRef]
  34. Cortes, C.; Vapnik, V. Support-vector network. Mach. Learn. 1995, 20, 273–297. [Google Scholar] [CrossRef]
  35. Vapnik, V. The Nature of Statistical Learning Theory; Springer: Berlin/Heidelberg, Germany, 1995. [Google Scholar]
  36. Larios, D.F.; Rodríguez, C.; Barbancho, J.; Baena, M.; Leal, M.Á.; Marín, J.; León, C.; Bustamante, J. An Automatic Weighting System for Wild Animals Based in an Artificial Neural Network: How to Weigh Wild Animals without Causing Stress. Sensors 2013, 13, 2862–2883. [Google Scholar] [CrossRef]
  37. Wang, K.; Pan, J.; Rao, X.; Yang, Y.; Wang, F.; Zheng, R.; Ying, Y. An Image-Assisted Rod-Platform Weighing System for Weight Information Sampling of Broilers. Trans. ASABE 2018, 61, 631–640. [Google Scholar] [CrossRef]
  38. Lee, C.C.; Adom, A.H.; Markom, M.A.; Tan, E.S.M.M. Automated Chicken Weighing System Using Wireless Sensor Network for Poultry Farmers. IOP Conf. Ser. Mater. Sci. Eng. 2019, 557, 012017. [Google Scholar] [CrossRef]
  39. Lacy, M.P. Broiler Management. In Commercial Chicken Meat and Egg Production; Springer Science + Business Media: New York, NY, USA, 2002; pp. 829–868. [Google Scholar]
Figure 1. Scenery at the beginning of the rearing period in large-scale geese production.
Technologies 13 00017 g001
Figure 2. At the end of the rearing period in large-scale geese production.
Technologies 13 00017 g002
Figure 3. Different scales and geese images for training ((a) many geese on the scale, (b) no geese on the scale, (c) valid image).
Technologies 13 00017 g003
Figure 4. Labeling process and instance segmentation results.
Technologies 13 00017 g004
Figure 5. The resulting mask uses the LabelMe tool.
Technologies 13 00017 g005
Figure 6. Key points of geese.
Technologies 13 00017 g006
Figure 7. Application of the Laplace operator on three test images: (1) sharp image, (2) image with blur applied to the scale area, and (3) image with blur applied to the entire image.
Technologies 13 00017 g007
Figure 8. Edge infrastructure.
Technologies 13 00017 g008
Figure 9. Cloud infrastructure.
Technologies 13 00017 g009
Figure 10. Geese growth estimation using Gaussian Process Regression (GPR) with a Radial Basis Function (RBF) kernel. The collaborating company provided the data (’x’), representing their expected growth curve.
Technologies 13 00017 g010
Disclaimer/Publisher’s Note: The statements, opinions and data contained in all publications are solely those of the individual author(s) and contributor(s) and not of MDPI and/or the editor(s). MDPI and/or the editor(s) disclaim responsibility for any injury to people or property resulting from any ideas, methods, instructions or products referred to in the content.

