Abstract
Forest ecosystems are critical components of Earth’s biodiversity and play vital roles in climate regulation and carbon sequestration. They face increasing threats from deforestation, wildfires, and other anthropogenic activities. Timely detection and monitoring of changes in forest landscapes pose significant challenges for government agencies. To address these challenges, we propose a novel pipeline by refining the U-Net design, including employing two different schemata of early fusion networks and a Siam network architecture capable of processing RGB images specifically designed to identify high-risk areas in forest ecosystems through change detection across different time frames in the same location. It annotates ground truth change maps in such time frames using an encoder–decoder approach with the help of an enhanced feature learning and attention mechanism. Our proposed pipeline, integrated with ResNeSt blocks and SE attention techniques, achieved impressive results in our newly created forest cover change dataset. The evaluation metrics reveal a Dice score of 39.03%, a kappa score of 35.13%, an F1-score of 42.84%, and an overall accuracy of 94.37%. Notably, our approach significantly outperformed multitasking model approaches in the ONERA dataset, boasting a precision of 53.32%, a Dice score of 59.97%, and an overall accuracy of 97.82%. Furthermore, it surpassed multitasking models in the HRSCD dataset, even without utilizing land cover maps, achieving a Dice score of 44.62%, a kappa score of 11.97%, and an overall accuracy of 98.44%. Although the proposed model had a lower F1-score than other methods, other performance metrics highlight its effectiveness in timely detection and forest landscape monitoring, advancing deep learning techniques in this field.
1. Introduction
Forests are essential elements of land-based ecosystems and play a crucial role in conserving biodiversity and sustaining numerous species. Furthermore, woods play a vital role as significant carbon sinks [1], actively absorbing carbon dioxide from the atmosphere and, therefore, reducing the negative effects of climate change. In addition, woods offer a diverse range of ecosystem services, such as water filtration [2], pollination [3], and nutrient cycling [4], which collectively contribute to the preservation of air, water, and soil quality that is crucial for the welfare of humans and the sustainability of the environment.
The monitoring and detection of changes in forest cover hold immense significance for environmental stewardship and sustainable management practices. This process is indispensable for a multitude of reasons, covering various aspects of ecosystem health [5], biodiversity conservation [6], and global climate stability [7]. Alterations in forest cover have the potential to disrupt habitats [8], resulting in imbalances within ecosystems and posing a potential threat to fragile species. By monitoring alterations in forest cover, we can evaluate the soundness of these crucial services and establish measures to protect them. In the realm of resource management, monitoring forest cover changes is paramount for ensuring the sustainable utilization of natural resources and preventing overexploitation. By tracking such shifts in forest cover, we can identify areas at risk of degradation or depletion and implement targeted conservation measures to mitigate these risks. In addition, monitoring changes in forest cover addresses emerging challenges such as human–wildlife conflict by identifying changes in wildlife habitats [9] and promoting strategies for coexistence between human populations and wildlife [10]. By understanding how changes in forest cover impact wildlife distribution and behavior, we can develop informed management strategies that minimize conflicts and foster harmonious relationships between humans and wildlife [11]. In essence, the detection and monitoring of changes in forest cover serve as the cornerstone of effective environmental management, with far-reaching implications for biodiversity conservation, climate change mitigation, ecosystem health, and sustainable resource utilization. By prioritizing this crucial aspect of environmental monitoring, we can work toward safeguarding the health and resilience of forest ecosystems and the myriad benefits they provide to both nature and society.
The identification of changes in forest cover is essential to the monitoring and management of Earth’s ecosystems because it offers vital information about environmental dynamics and guides conservation efforts. But even with improvements in analytical techniques and remote sensing technologies, there are still various challenges standing in the way of precisely identifying and quantifying changes in forest cover. These difficulties are caused by a variety of reasons, such as the intricacy of forest ecosystems [12] and the dynamic nature of changes in land use [13]. The intrinsic complexity of forest ecosystems [12] makes detecting changes in forest cover one of the primary obstacles. From lush tropical rainforests to sparse boreal forests, woods display a variety of structural and compositional features that create different difficulties for precise detection and classification. Furthermore, the understanding of the dynamics of forest cover change can be made more difficult by natural disturbances like wildfires [14], insect infestations [15], and disease outbreaks [16].
Unlike traditional approaches, deep learning’s development has shown enormous promise for solving a variety of remote sensing change detection problems in forest cover detection. However, with the exception of change detection, which is greatly improved by the use of deep learning, the integration of deep learning brings two significant drawbacks: training samples and hardware and software issues. Large sets of labeled training sample sets are necessary for typical deep learning models to perform well [17,18]. However, geospatial systems typically have an especially small number of labeled training samples available [19,20,21], particularly for change detection. High processing power in both software and hardware is required for deep learning.
It is also necessary to consider multisource data fusion and multiscale challenges of remote sensing data in forest cover detection. It should be noted that varying degrees of difficulty can be achieved for various ground targets. One of the most significant issues with photographs taken from various perspectives, for example, is the displacement of high-rise structures [22], and another notable problem is the heterogeneous appearance [23]. Furthermore, to address the challenges associated with change detection, the learning framework should incorporate domain knowledge, such as geographic data, remote sensing image characteristics, and other geoscience-related knowledge, in order to improve the method’s dependability. However, learning from small sample sets is helpful for developing algorithms when there is a lack of large amounts of labeled data, especially since deep architectures have shown greater potential in such practices. However, in order to impose efficient prevention mechanisms against deforestation, the accuracy obtained from such algorithms might be invaluable due to inadequate numbers of existing datasets.
The use of deep architectures that focus on a single task is essential for detecting changes in forests [24]. They are good at understanding the various features in data from remote sensing. The single-task deep architecture in the context of deep learning generally refers to structures such as fully connected networks for tasks like regression or classification, recurrent neural networks (RNNs) for sequence modeling, or convolution neural networks (CNNs) for image recognition [25]. The word “deep” in “deep architecture” describes the network’s depth, indicating the existence of several layers through which data flow to enable hierarchical feature extraction and representation learning. By feeding input data and matching target labels to these architectures, supervised learning techniques are used to train them. The network then learns to map inputs to outputs through a process known as forward and backward propagation.
Due to their exceptional ability to examine intricate spatial and spectral patterns present in remote sensing data, single-task deep structures play a crucial role in identifying forest changes [26]. These designs use deep learning models, such as CNNs, to automatically extract complex information from satellite data. This enables the accurate detection of changes in forest cover over time. It is possible to accurately detect a variety of forest disturbances [27], including deforestation, reforestation, and forest degradation, because of their ability to record geographical context and temporal correlations [27]. Transfer learning is also useful for adapting pre-trained models to particular forest change detection tasks, which improves performance and efficiency. They simplify the processing of massive volumes of satellite data by automating the monitoring process [28]. This reliable and timely information is essential to make well-informed decisions about forest management and conservation initiatives.
In this study, we use deep neural networks (as shown in Figure 1) to detect changes in forest cover by performing detailed visual analysis while excluding images that are not related to forest cover during the training phase. Moreover, we utilize advanced architecture search approaches to refine and optimize deep neural network models, in addition to developing datasets to overcome obstacles associated with data collection or production, guaranteeing that our models are highly skilled at detecting minor variations in forest cover with unmatched precision and dependability. The major contributions of this study are summarized below.
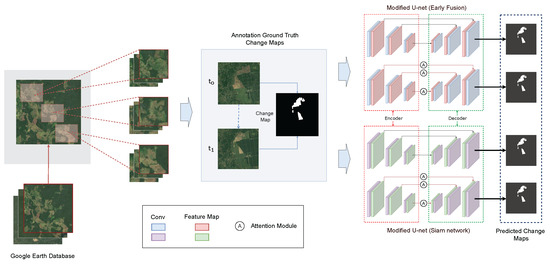
Figure 1.
The proposed pipeline for change detection in high threat zones in forests.
- An enhanced deep-learning model capable of identifying areas where deforestation has occurred is proposed.
- A customized dataset of high-spatial resolution satellite images is constructed to facilitate the evaluation of algorithms for robust change detection in forest areas.
- The feature learning of the U-Net is improved with the help of residual learning modules.
- A novel attention mechanism for sequential satellite images is proposed to minimize both the additional parameters needed to train the model to detect changes and the data needed for auxiliary tasks.
2. Related Work
In recent years, computer vision and deep learning techniques have significantly improved various applications’ accuracy and capabilities. However, challenges persist, particularly in applying these technologies to complex, real-world settings. This study synthesizes conceptual frameworks from multiple academic disciplines, integrating foundational theories and methodologies from change detection, deep learning with a focus on semantic segmentation, visual attention, supervised change detection, and CNNs. These areas provide essential methodologies and conceptual foundations that drive our research forward.
Previous studies have focused on enhancing traditional image differencing techniques or developing new methods to improve change detection precision [29]. Our research takes a different path by using CNNs to extract features directly from image pairs. This method surpasses manually designed features by developing robust characteristics. Using a specific loss function, our network distinguishes feature vectors for changing pixels while preserving those for unchanged pixels. Change detection is then performed by analyzing the distances between these vectors, with accuracy refined using the k-nearest neighbor (KNN) technique. Change detection techniques are generally categorized into pixel-based and object-based methods [30]. Pixel-based methods identify changes at the individual pixel level, while object-based methods group pixels associated with the same object using attributes like color, shape, and neighborhood information to assess changes.
Fully convolutional networks (FCNs) have become the leading technique in deep semantic change detection due to advancements in CNNs within supervised learning. CNN methods have notably been applied to road recognition using image pairs [31]. Previously, manual features like SIFT were used to assess image patch similarity, but these often missed critical elements like lighting or perspective changes. The modern approach uses deep CNNs to train a universal similarity function on paired image patches, effectively distinguishing between matches and mismatches. This allows the network to adapt to various transformations, achieving significantly better results compared to manual descriptors and surpassing leading dataset benchmarks.
The U-Net architecture has significantly impacted medical imaging segmentation by introducing a novel structure that features an expanding path with up-sampling layers. This design enhances the resolution of the output and facilitates precise localization by integrating high-resolution features from the contracting path. Unlike traditional FCNs [32], U-Net features a unique U-shaped design, eliminating the need for fully connected layers and enabling efficient segmentation of large images through tiling. Moreover, U-Net employs extensive data augmentation using elastic deformations, effectively addressing the challenges of limited training data and enhancing its adaptability to various changes.
The integration of attention mechanisms into U-Net architectures has recently gained significant interest within the research community, particularly for addressing various challenges in image segmentation. Traditional U-Net architectures are constrained by processing limitations and often yield inaccurate border predictions. However, advancements such as IBA-U-Net have emerged, utilizing innovative components like the Redesigned Inception (RI) and Attentive BConvLSTM (BA) blocks to enhance feature fusion and improve the precision of output. A study on forest cover classification using remote sensing has proposed the use of attention gates (AGs) to boost the segmentation performance of U-Net by focusing selectively on relevant image regions [33]. These autonomous AGs can identify crucial areas without specific instructions, thus obviating the need for predefined region-of-interest (ROI) specifications or separate localization models. By enhancing sensitivity to foreground elements through the suppression of feature activation in background areas, AGs yield more accurate segmentation results with real-time efficiency.
An architecture used to focus the U-Net was designed to improve the delineation of polyp boundaries in medical imaging by employing deep network layers to generate gating signals for precise attention allocation [34]. It mimics the human visual processing pathways for spatial (‘where’) and identification (‘what’) tasks, optimizing segmentation by adjusting focus parameters to minimize errors and potentially enhance patient outcomes. Meanwhile, a new approach called panoptical segmentation has been introduced for segmenting satellite image time series (SITS) [35]. It utilized the U-TAE, a spatiotemporal encoder that blends multiscale spatial convolutions with temporal self-attention mechanisms to effectively capture complex temporal, spatial, and spectral patterns critical for SITS analysis. Additionally, the Parcels-as-Points (PaPs) framework employed modified CenterMask networks to address the unique challenges of SITS panoptic segmentation effectively.
According to the literature, a key development is the shift from traditional image differencing to using CNNs for feature extraction from image pairs, overcoming the limitations of manually crafted features. Specialized loss functions enhance change detection accuracy by distinguishing altered pixels while preserving unchanged areas. Advancements in supervised learning have led to FCNs, significantly improving deep semantic change detection. Integrating attention mechanisms into U-Nets has also garnered interest, with AGs improving segmentation accuracy by focusing on specific image regions, increasing sensitivity to foreground elements, and reducing false positives.
Despite the significant advancements made, there is still room for further enhancements in the field of computer vision, particularly in the application of U-Nets. By incorporating additional techniques to improve feature learning and adaptability to diverse transformations, U-Nets that operate without supplementary tasks could potentially outperform their multitasking counterparts. Additionally, the availability of high-quality datasets specifically aimed at detecting changes in forest coverage provides a unique opportunity to develop models that can address important environmental challenges effectively.
Our strategy integrates several crucial techniques to address these issues. We incorporate residual learning blocks into U-Nets to boost performance by improving feature learning and adaptability. Implementing AGs aims to increase segmentation precision and reliability. Although effective in most scenarios, models can further benefit from multitasking learning techniques. However, the lack of suitable datasets is a significant limitation. To overcome this, we propose developing a carefully curated dataset focused on changes in forest coverage. This dataset would be valuable for training and evaluating algorithms for environmental monitoring and conservation, leading to more robust and effective solutions.
3. Materials and Methods
Our study is systematically divided into three distinct phases, each crucial for developing a reliable detection model for highly vulnerable forest areas at risk of deforestation. The study clearly articulates (as shown in Figure 1) these objectives in the beginning, establishing the framework for subsequent actions. In the first phase, we acquire multiple satellite images to monitor changes in forest cover over time. The second phase involves a structured approach to preprocessing these large visual datasets, preparing them for detailed analysis. The third and pivotal phase introduces our novel pipeline, tailored to enhance the precision of change detection. Finally, we employ a comprehensive set of evaluation metrics to assess the performance of our model.
3.1. Proposed Novel Pipeline
Our proposed pipeline demonstrates the outcomes of our tailored U-Net design (Figure 2) when applied to a new dataset, using two distinct evaluation frameworks. The initial schema employs early fusion networks, whereas the second schema utilizes a Siam network architecture capable of processing multiple inputs to enhance performance. Rodrigo Caye Daudt et al. [11] incorporated residual blocks into the architecture of the U-Net in order to improve its ability to learn features. Expanding on this basis, we aimed to enhance feature acquisition by exploring advanced versions of residual learning, such as ResNeSt and ResNeXt, in both branches of the U-Net. In addition, the study examined AGs within side units for the purpose of change detection. Our investigation focused on channel AGs and spatial and channel AGs using two separate methodologies. Initially, we combined AGs with the feature learning blocks (illustrated in Figure 3), utilizing both channel and spatial attention techniques. In the second strategy (Figure 4), we employed additive and concentrate attention-based methods at the concatenation locations of feature maps to improve feature acquisition by utilizing both spatial and channel attention processes. This technique includes multiple intricate methodologies, each carefully assessed. At first, the focus is directed exclusively towards the feature map from the deepest level of the contracting path, followed by scaling to the level of concatenation. Next, we investigate the use of feature maps from nearby layers that are close to the site of concatenation. In multi-path AGs, we combine channel, spatial channel, and spatial attention mechanisms to improve the effectiveness of the attention gate.
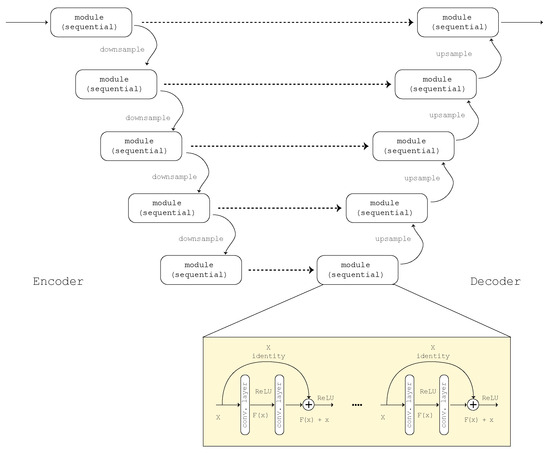
Figure 2.
General U-Net architecture used in this study with the addition of feature learning modules.
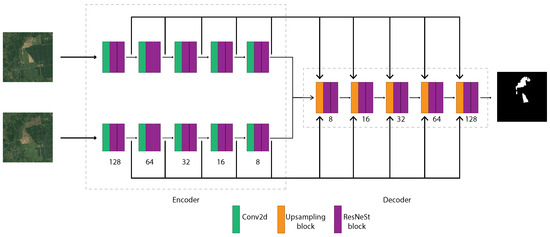
Figure 3.
Change detection process using an encoder–decoder approach with enhanced feature learning and attention mechanism.
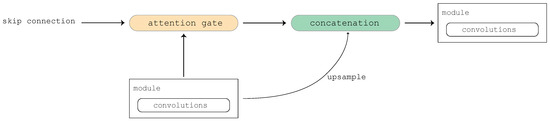
Figure 4.
High-level overview of using AGs in the second strategy of applying attention.
3.2. Data Collection
The main challenge with high-sensitivity remote sensing data is that they require very rigorous preprocessing [36]. Additionally, they are computationally expensive and require significant processing power, which reduces their practical usage. To overcome these challenges, we have collected RGB images specifically designed to detect changes in forest cover on a global scale. These photos were obtained from Google Earth [37], which provides a temporal archive dating back to the 1980s. The images have been standardized to have the same dimensions of 970 pixels in width and 1980 pixels in height. Initially, we utilized information from the Deforestation Fronts report [38] from 2004 to 2017, which identifies 12 specific areas where deforestation is occurring. Our technique involves randomly selecting sections from the original photos along the time axis, which increases the size of the dataset (https://www.kaggle.com/datasets/asheniranga/change-detection-in-forest-covers, accessed on 19 June 2024). The major objective is to enhance our dataset by creating several patches from a single volume of data, ensuring that the contextual features of the image time series are maintained. Our proposed approach entails randomly choosing a pixel from the original image and then extracting adjacent pixels along the temporal axis, with the selected pixel as the center point. The dimensions of our patch are fixed at 480 pixels in both width and height. Thus, we establish a boundary box that is surrounded by a 240-pixel margin, depicted by the red box in Figure 5. The centers for random selections are limited to this boundary to guarantee that patches of the necessary size may be reliably extracted without requiring a padding method to accommodate centers outside of this designated area.
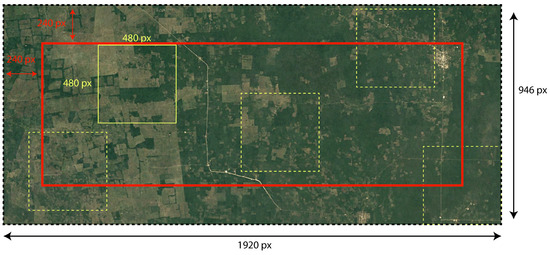
Figure 5.
Sample cropping patches from the original high-resolution satellite image.
We carefully curated a limited set of three patches from each volume, yielding a grand total of 1500 photos, with each image measuring 480 pixels in both dimensions. Although 1500 photos were produced by cropping, not all of the cuts were considered appropriate for training due to the arbitrary selection of centers. Furthermore, the data were filtered for annotation purposes by considering the intricacy of changes inside each cut. The annotation process involved using the clipped sub-volumes and focusing specifically on successive pairings of photos. Figure 6 illustrates the process of image change annotation, showing the original state of a particular region at the beginning of the time series compared to its subsequent condition after a certain time interval. Annotations between one timestamp and a subsequent timestamp are made along the temporal axis, emphasizing the changes occurring at a specific location over time. For instance, at timestamps and , observations are recorded to capture the changes in the corresponding location. This method allows for a dynamic analysis, as shown in Figure 7, where the differences between and highlight the temporal progression of the phenomena being studied. By focusing on these changes at particular time points, the analysis provides deeper insights into how specific locations evolve over time. After collecting image patches in the earlier steps of the data pipeline, we use Label Studio to annotate these changes as segmentations. This means that unchanged areas in the current timestamp (t), compared to the previous timestamp (t − 1), are labeled as 0 in pixel value. Changes between the two timestamps are labeled as 1 in pixel value. The goal is to train models to detect changed pixels (those with a value of 1). The annotation file was created to clearly define the differences between these two time periods.
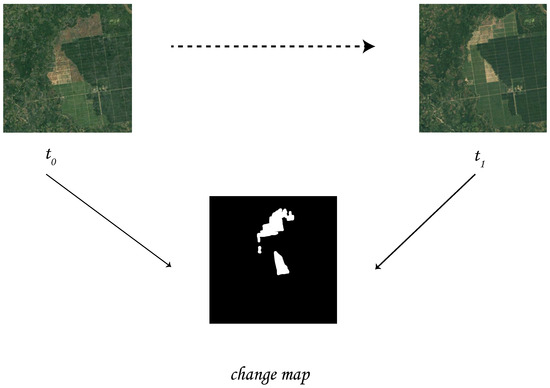
Figure 6.
Change annotation in a particular region (trios); and show two different instance over the same location in two different time periods.
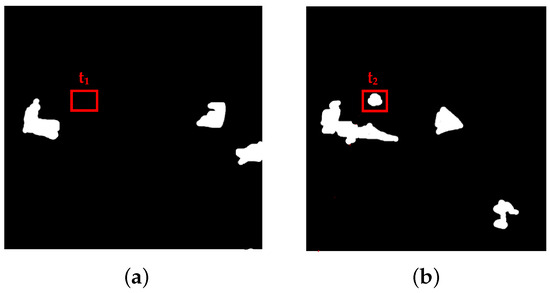
Figure 7.
Method of annotating changes between two different timestamps (, ). (a) Extracted image from time frame ; (b) extracted image from time frame .
3.3. Preprocessing
The methodology utilized in our study encompasses the implementation of two distinct data augmentation strategies: geometric augmentations and color property alterations. Geometric augmentations pertain to the application of modifications to input images, including the randomized selection of image segments, patch positioning, and deliberate mirroring. Randomized cropping entails the extraction of segments with specific dimensions from temporal steps while ensuring consistency across the dataset. On the other hand, dynamic cropping, as illustrated in Figure 8, introduces variability by dynamically selecting cropping locations in real time. Patching involves the segmentation of complete images into individual parts using a sliding window mechanism. This approach introduces intentional diversity into the dataset, enabling the model to glean insights from varied spatial configurations. The second augmentation technique, color property alterations, focuses on adjusting hue, saturation, brightness, and contrast, thereby enabling the model to discern diverse lighting scenarios and color distributions within the dataset.
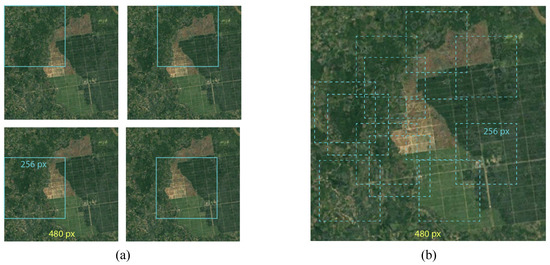
Figure 8.
Systematic patches for images that are obtained from dynamic cropping. (a) Extract from image using stride and patch side size values from annotated image trios; (b) randomly extract image patches from annotated image trios.
In the realm of color property manipulation, the techniques of adjusting brightness and contrast serve as pivotal tools in generating augmentation outcomes. In order to apply a consistent effect to both input images, a uniform factor is employed. This factor is randomly generated within the range of 1.0 to 2.5. The impact of these manipulations is visually depicted in Figure 9, showcasing the transformative effects brought about by this process.
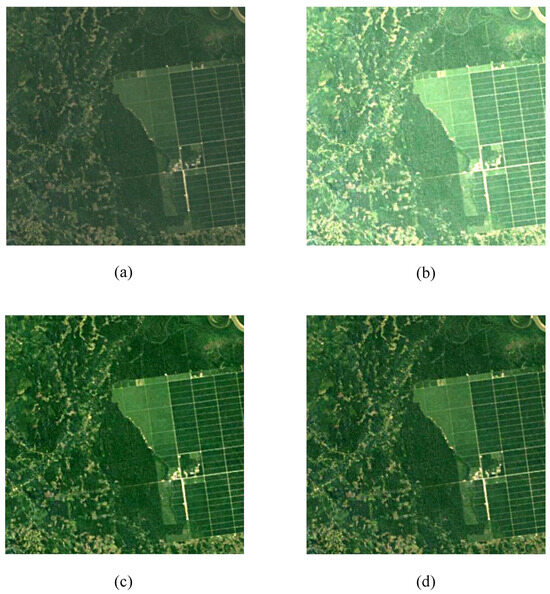
Figure 9.
Resultant images from color changes: (a) normal image; (b) increased brightness; (c) increased saturation; (d) randomly increased brightness and saturation.
3.4. Change Detection Algorithm
We conduct our experiments in two main phases. First, we evaluate the effectiveness of different U-Net configurations, specifically comparing the Siamese and early fusion fully convolutional approaches. In the second phase, we investigate the impact of various attention mechanisms on the best-performing U-Net configuration identified in the first phase. We assess the performance of channel, spatial, and combined attention approaches.
Segmented images or masks resulting from image segmentation are essential inputs for subsequent tasks such as object detection, tracking, and scene interpretation. Semantic segmentation, instance segmentation, and panoptic segmentation are the three main forms of picture segmentation, each addressing different parts of this complex process. We opt for a segmentation-based approach due to its flexibility in identifying changes, especially in change detection scenarios, for the following reasons:
- Segmentation is adept at detecting random shapes and natural variations, such as curves, without the need for predefined shapes.
- Changes in images are often infrequent and subtle, requiring a method capable of identifying these small differences.
The changes detected from the input image pairs are represented as segmented masks, as illustrated in Figure 10.
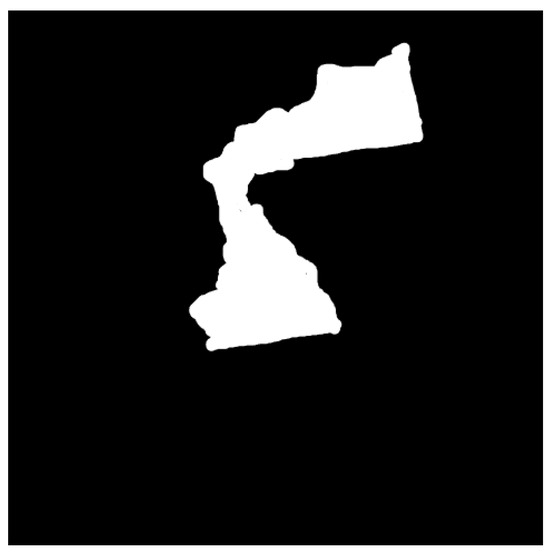
Figure 10.
Resultant segmented image after applying change detection algorithm.
Our primary objective is to detect changes in inputs by utilizing segmented change maps (Algorithm 1). Image segmentation in our approach involves the classification of pixels on a per-pixel basis, where each pixel is given to a certain category or class based on its visual characteristics. The primary goal of this is to define distinct objects or regions inside an image, which is a crucial step with several applications in various computer vision fields.
| Algorithm 1 ResNeSt-based U-Net Algorithm |
Training set: train_x Labels of training data: train_y Require: train_x and train_y Ensure: Segmented maps m Kk while
do while do batch_x batch_y while do W(x_) ▹ Apply attention-enhanced ResNeSt blocks on input x_n end while while do W(q_) ▹Apply attention-enhanced ResNeSt blocks in decoder x_n x_n y_pred end while back-propagation Adjust the parameter to optimize loss function end while end while return and y_pred |
4. Results and Discussion
As mentioned above, we evaluated and compared the performance of the proposed methods with our custom dataset. We tested the two architectures of U-Net—early fusion and U-Net Siam—both with and without the integration of an attention mechanism. Additionally, the two popular datasets that have been used in past studies similar to ours were analyzed along with our models in terms of performance metrics.
4.1. Performance Evaluation
In the assessment of models to evaluate their effectiveness, reliability, and robustness, performance metrics are a critical aspect. The present study chiefly focuses on the examination of five distinct evaluation metrics, namely, accuracy, precision, recall, Dice, and kappa, as depicted in Table 1. The Dice coefficient serves to gauge the level of overlap between the predicted and actual change maps, factoring in both missed and erroneously identified changes. The utilization of datasets featuring disparate distributions poses a challenge, as it necessitates the segmentation of larger entities into smaller fragments. Meanwhile, the kappa score emerges as a dependable metric for evaluating model performance, even within datasets characterized by imbalanced class distributions. Nonetheless, interpreting fluctuations in kappa values can be intricate, given that minor discrepancies could significantly impact the ensuing calculations. The assessment of recall pertains to the model’s ability to recognize authentic alterations; however, the pursuit of maximizing recall oftentimes involves a trade-off with precision, potentially resulting in misclassification. Precision, on the other hand, bolsters the model’s efficacy in detecting changes, thereby diminishing the likelihood of misinterpreting irrelevant pixels. While accuracy assumes paramount importance in scenarios where costs are a prevailing concern, an elevated accuracy level may inadvertently lead to compromised recall and the generation of less meaningful outcomes within datasets exhibiting non-uniform class distributions. The integration of these metrics facilitates a comprehensive grasp of the model’s performance in capturing changes, thereby catalyzing advancements in the realm of computer vision research.

Table 1.
Metrics used in the study to compare and capture the performance of the models; () is the observed agreement between ground truth and predictions, while () is the expected agreement between ground truth and predictions given class distributions.
4.2. Performance Evaluation of U-Net Architectures without the Attention Mechanism
Our study uses a specialized test dataset to ensure the accuracy of its assessment, avoiding information leakage. It also examines the use of various feature learning blocks to train different forms of the U-Net. This is the first stage of the experimental pipeline, which we conduct to identify the best configuration of input and knowledge sharing within U-Net. The intricacy of change detection requires a departure from conventional methods of picture categorization or detection. Change detection, unlike conventional systems that analyze a single image, necessitates the concurrent analysis of two or more photographs in order to detect alterations in the surroundings. This deviation necessitates dynamic changes and nuanced spatial variances over time. Unlike classifiers and detectors, which rely on a single-image processing paradigm, change detection uses neural networks to simultaneously evaluate pairs of images. This approach allows the network to immediately assess the discrepancies in pixel values between the input images and to identify any discernible patterns or alterations that have taken place. The configuration of the neural network is crucial when inputting images for change detection. The number of input photographs can vary depending on the network architecture. For instance, if the network is designed to simultaneously evaluate pairs of photographs, it may incorporate several input layers to process the two inputs. Conversely, networks designed for processing individual images might incorporate a larger number of channels in the input layer. This enables the combination of many images into a single, stacked input. The choice between these methods is contingent upon the particular network structure and the characteristics of the change detection task being performed. We tested two configurations, namely, the Siam configuration and the early fusion configuration, with different feature learning blocks. We set the U-Net feature learning block as the baseline feature learning block. We tested three types of residual learning blocks with each configuration for change maps, namely, the original residual learning block; the aggregated residual transformation, also known as ResNeXt; and the residual split attention, also known as ResNeSt; these are shown in Figure 11.
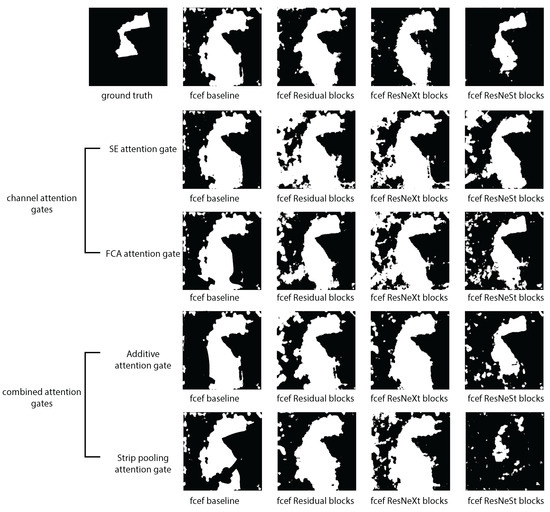
Figure 11.
Attention blocks in the fully convolutional early fusion (FCEF) architecture compared to those without attention FCEF models.
The Siam network technique outperforms other approaches in most aspects, with learning features providing a more accurate representation of data. The ResNeSt block shows superior performance in all metrics except recall, despite surpassing other feature learning blocks.
4.3. Performance Evaluation of U-Net Architectures with the Attention Mechanism
During this phase of the experiment, our objective was to enhance the performance of the U-Net by implementing AGs. We primarily evaluated three varieties of attention gating. Specifically, the attention mechanisms include channel attention, spatial attention, and combinations of channel and spatial attention. We conducted a comparative analysis of the early fusion approach and the Siam network, both incorporating attention blocks that are combined with the feature learning blocks previously examined in the initial phase of the study. Identical training processes and measurements were employed to compare these concepts. AGs were used for the context to learn better representations from inputs and utilize them to boost the performance of the models. The attending process can be summarized as follows:
where g(x) is the process of attending to the discriminative area of the input and generating the attention score, and f(g(x), x) is the process of applying attention scores with the input x to the attention block that is learned in the g(x). In an attention block, we can experiment with it in three main ways: depth-wise (channel attention), spatial-wise (spatial attention), and temporal dimension-wise. Temporal attention is more useful in video analysis. Therefore, we approached this problem with channel and spatial attentions. Conversely, we adapted attention U-Net and focus U-Net, combining these two types of attention in order to mitigate their drawbacks. Results of this approach are shown in Figure 11 and Figure 12.
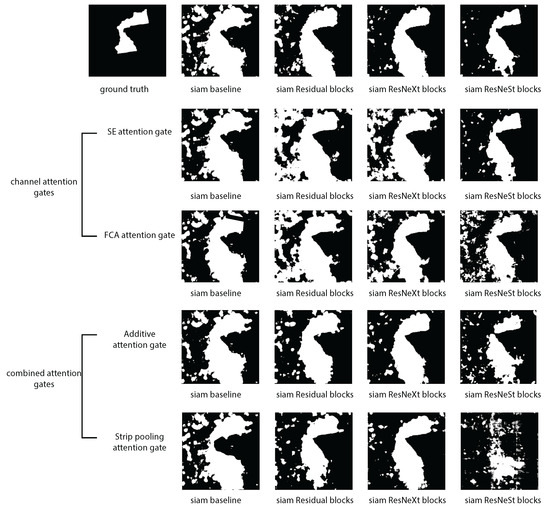
Figure 12.
Each attention block in the Siam architecture compared to those without the Siam attention model.
The outcomes of each attention gate are analyzed to acquire knowledge about the significance of features. Within the realm of channel attention approaches, the FCA attention gate outperforms the SE attention gate in the early fusion architecture. However, in the Siam architecture, the converse is observed. The SE block [39] demonstrated superior performance compared to the FCA attention [40] gate. ResNeSt [41] is the feature learning block utilized in the network on both occasions. While considering combination AGs, the additive attention method is superior and holds true for both early fusion and Siam architectures. However, in both instances, the network utilizes distinct feature learning blocks. The highest performance in the early fusion architecture was achieved with the residual block. However, with regard to Siam design, the best performance was observed with the ResNeXt feature learning block. The optimal performance was achieved by combining ResNeSt as a feature learning block, the SE channel attention gate, and the Siam architecture.
We conducted a two-stage model comparison to identify which is the most efficient and accurate. The results are shown in Table 2, including the Dice value (intersection of expected and predicted results), kappa (difference between target and predicted change map), squeeze and excitation (SE), and frequency channel attention (FCA). The evaluation metrics reveal a Dice score of 39.03%, a kappa score of 35.13%, an F1-score of 42.84%, and an overall best accuracy of 94.37% for the ResNeSt block + SE attention.
Table 2.
Comparative analysis of Dice, kappa, F1-score, and accuracy for early fusion and Siam networks with different model architectures and attention mechanisms.
Incorporating performance evaluation, we calculated the training and testing times of the models as represented in Table 3. The highest training time was noted for the model with the residual block + additive attention, which took 237.54 and 158.63 min for the early fusion network and Siamese network, respectively. However, our model (ResNeSt block + SE attention) required only 185.12 and 152.11 min for the early fusion network and Siamese network, respectively, reflecting greater efficiency in allocating computational resources. Additionally, the testing time was nearly two minutes lower in the Siamese network than in the early fusion network. However, the lowest testing time of 3.50 min was recorded for the residual block + FCA attention, while the ResNeSt block + SE attention model consumed 4.43 min. These results underscore the efficacy of our proposed method in enhancing timely detection in forest landscape monitoring.
Table 3.
Comparative analysis of training time and testing time for early fusion and Siam networks with different model architectures and attention mechanisms in minutes.
Additionally, we tracked the loss function to obtain an overall sense of how training is progressing, as depicted in Figure 13. The figure compares four model configurations from two stages of our experiments. Configurations (a) and (b) are the best performers from stage one, where we tested the FCEF and Siam configurations. Configurations (c) and (d) are the best performers from stage two, where we tested different AGs. Among all the best performers from different stages, ResNeSt + SE in the Siam configuration showed the most effective learning, as indicated by lower loss values throughout the validations (d) and superior performance in the metrics used to compare these models.
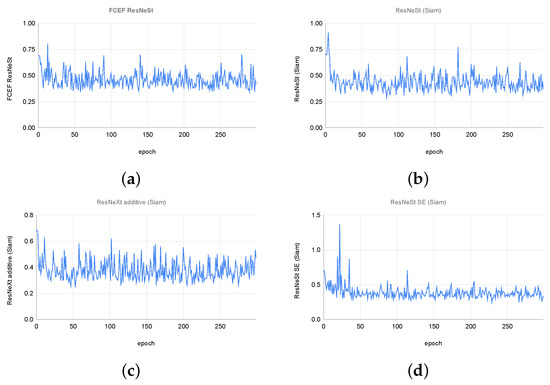
Figure 13.
Validation loss graph for (a) FCEF ResNeSt, (b) ResNeSt (Siam), (c) ResNeXt additive (Siam), (d) ResNeSt SE (Siam).
4.4. Performance Comparison with ONERA and HRSCD Datasets
We conducted an analysis of our method compared with that proposed by Daudt et al. [42]. The dataset was generated using imagery obtained from Sentinel-2 satellites, specifically the ONERA Satellite Change Detection Dataset [43]. Their methodology involved dividing each image into patches with dimensions of 96 × 96 × C. Weights for each class were calculated based on the number of pixels associated with each class, addressing the imbalanced distribution of the dataset. The network was trained using this dataset.
Table 4 presents the results of their study with the different networks—FC-EF: fully convolution early fusion; FC-Siam-conc: fully convolution Siam concatenated; FC-Siam-diff: fully convolution Siam difference; and FC-EF-Res: fully convolution early fusion residual. This demonstrates that our approach yields significantly improved results. Our Siam ResNeSt block [41] with channel attention (SE blocks) [39] outperforms them in terms of precision, Dice coefficient, and total accuracy of the semantic change map (as shown in Table 5). Although they did not use the kappa score, we have included this metric in all our studies to maintain consistency.
Table 4.
Comparison of our results with those of Daudt et al. [42].
Table 5.
Comparison of our results with those of Daudt et al. [44]; Str 1-4.2: Strategies 1-4.2, CNNF-O.
This study compares a methodology developed by Daudt et al. [42] with the HRSCD dataset, which contains 291 pairs of high-resolution images captured six years apart. The study offers four ways to improve the performance of change detection of satellite photos: conventional single-task methods, novel multitasking methods, and integrating land cover map segmentation into change detection (as shown in Figure 6). The first method predicts land cover maps and obtains semantic change maps by calculating the difference between projected maps. The second method directly anticipates semantic change maps without multitask learning, which is incorporated into the study. The third method employs three distinct networks to forecast semantic change maps and land cover change maps using the same input photos. The fourth method integrates land cover map segmentation into change detection, incorporating shared characteristics from two networks into a semantic change detection network. The best results were recorded in strategy four, which was adopted to prove that the approach can improve in situations without supported data for multitask training. Despite direct comparison with strategy two, the approach outperformed strategy four in terms of the Dice coefficient and overall accuracy.
4.5. Visual Representation of Change Detection
Our proposed model identifies changes, as shown in Figure 14, in three different datasets. These images show the correctly identified changes in yellow and the missed detections (false positive) in red. Green areas show false negative, meaning there is actually a change but the model is unable to detect it. We can see that in all three data predictions from the three different datasets here.
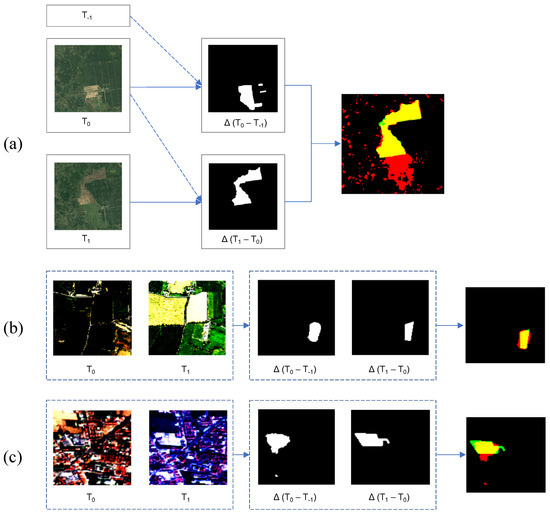
Figure 14.
Illustration of how a sample image is segmented, cropped, and normalized, ready for training at different time points. (a) Our study dataset; (b) HRSCD dataset; (c) ONERA dataset; T—time difference between consecutive frames.
The current study presents two distinct approaches aimed at enhancing the ability to detect subtle changes within an image, which constitute a small portion of the overall composition. The first method involves leveraging LSTM networks, while the second method employs a multitasking strategy that integrates area maps as supplementary inputs to the network, facilitating change detection based on this additional information. However, both approaches are associated with significant drawbacks, including high computational costs and the challenge of sourcing the requisite area maps. Despite these limitations, our study demonstrates that, by leveraging attention mechanisms, we can surpass the performance of models trained without the incorporation of additional information. This represents a significant advancement, as our model not only outperforms existing methods but also offers a more cost-effective solution in terms of computational efficiency and data acquisition.
5. Conclusions
Timely detection and monitoring of changes in forest landscapes pose significant challenges for government agencies worldwide. While deep neural networks excel at detecting deforested areas across different time frames, addressing this challenge requires an effective pipeline for identifying such areas. We propose a pipeline that achieves this by employing various attention techniques on Siamese networks with a backbone of U-Net architecture. The ResNeSt block with SE attention outperforms other attention mechanisms, achieving a Dice score of 39.03%, a kappa score of 35.13%, an F1-score of 42.84%, and an overall accuracy of 94.37% on our newly created forest cover change dataset. Furthermore, our pipeline significantly outperforms the ONERA and HRSCD datasets. These findings underscore the effectiveness of our proposed approach in enhancing forest monitoring and detecting deforested areas in a nation, thereby advancing the progress of deep learning methodologies within this field.
Change detection in forest landscapes is a highly relevant research area given the current global context. There are significant opportunities to improve the results extracted from this study. In the future, the proposed frameworks will be evaluated with self-supervised learning techniques, as these methods have been shown to significantly enhance performance, particularly when dealing with unlabeled data. Additionally, despite high accuracy across all models, including the one that performed best, the F1-score remains low. This suggests that fine-tuning approaches could help improve the F1-score. Furthermore, expanding the dataset to include more diverse environments, such as heavily forested areas and urban areas, could provide more comprehensive insights and enhance the robustness of the models.
Author Contributions
Conceptualization, A.I.H., L.H., J.C., P.V. and S.T.; methodology, A.I.H., J.C., P.V., R.G., C.W. and S.T.; formal analysis, A.I.H., J.C., P.V., R.G., L.H. and B.S.; data curation, A.I.H., J.C. and P.V.; writing—original draft preparation, P.V., R.G. and J.C.; writing—review and editing, J.C., P.V., C.W., S.T. and B.S.; visualization, R.G., C.W. and B.S.; supervision, S.T., C.W. and B.S. All authors have read and agreed to the published version of the manuscript.
Funding
The researchers would like to thank Charles Darwin University for funding open-access publication.
Institutional Review Board Statement
Not applicable.
Informed Consent Statement
Not applicable.
Data Availability Statement
Data supporting this study are available at https://www.kaggle.com/datasets/asheniranga/change-detection-in-forest-covers, accessed on 19 June 2024.
Conflicts of Interest
The authors declare no conflicts of interest.
References
- Silvestro, R.; Zeng, Q.; Buttò, V.; Sylvain, J.-D.; Drolet, G.; Mencuccini, M.; Thiffault, N.; Yuan, S.; Rossi, S. A longer wood growing season does not lead to higher carbon sequestration. Sci. Rep. 2023, 13, 4059. [Google Scholar] [CrossRef] [PubMed]
- He, H.; Yan, J.; Liang, D.; Sun, Z.; Li, J.; Wang, L. Time-series land cover change detection using deep learning-based temporal semantic segmentation. Remote Sens. Environ. 2024, 305, 114101. [Google Scholar] [CrossRef]
- Pardo, A.; Rolo, V.; Carrascosa, A.; Gonzalez-Bornay, G.; Moreno, G. Management linked to ecological intensification supports insect pollinators in Iberian wood-pastures. Landsc. Ecol. 2023, 38, 3389–3403. [Google Scholar] [CrossRef]
- Waters, S.; Atalah, J.; Thompson, L.; Thomson-Laing, G.; Pearman, J.K.; Puddick, J.; Howarth, J.D.; Reyes, L.; Vandergoes, M.J.; Wood, S.A. It’s all in the mud—The use of sediment geochemistry to estimate contemporary water quality in lakes. Appl. Geochem. 2023, 153, 105667. [Google Scholar] [CrossRef]
- Li, C.; Wu, Y.; Gao, B.; Zheng, K.; Wu, Y.; Wang, M. Construction of ecological security pattern of national ecological barriers for ecosystem health maintenance. Ecol. Indic. 2023, 146, 109801. [Google Scholar] [CrossRef]
- Pour, M.D.; Barati, A.A.; Azadi, H.; Scheffran, J.; Shirkhani, M. Analyzing forest residents’ perception and knowledge of forest ecosystem services to guide forest management and biodiversity conservation. For. Policy Econ. 2023, 146, 102866. [Google Scholar] [CrossRef]
- Vacek, Z.; Vacek, S.; Cukor, J. European forests under global climate change: Review of tree growth processes, crises and management strategies. J. Environ. Manag. 2023, 332, 117353. [Google Scholar] [CrossRef]
- Steel, Z.L.; Jones, G.M.; Collins, B.M.; Green, R.; Koltunov, A.; Purcell, K.L.; Sawyer, S.C.; Slaton, M.R.; Stephens, S.L.; Stine, P.; et al. Mega-disturbances cause rapid decline of mature conifer forest habitat in California. Ecol. Appl. 2022, 33, e2763. [Google Scholar] [CrossRef]
- Ullah, S.A.; Asahiro, K.; Moriyama, M.; Tsuchiya, J.; Rahman, M.A.; Mary, M.; Tani, M. Causes and consequences of forest cover transformation on human-wildlife interaction in the Teknaf Wildlife Sanctuary, Bangladesh. Trees For. People 2024, 15, 100476. [Google Scholar] [CrossRef]
- Debebe, B.; Senbeta, F.; Teferi, E.; Diriba, D.; Teketay, D. Analysis of Forest Cover Change and Its Drivers in Biodiversity Hotspot Areas of the Semien Mountains National Park, Northwest Ethiopia. Sustainability 2023, 15, 3001. [Google Scholar] [CrossRef]
- Gaire, A.; Acharya, K.P. Understanding human-wildlife conflict in Nepal and its mitigating measures. Isr. J. Ecol. Evol. 2023, 70, 69–74. [Google Scholar] [CrossRef]
- Seidl, R.; Turner, M.G. Post-disturbance reorganization of forest ecosystems in a changing world. Proc. Natl. Acad. Sci. USA 2022, 119, e2202190119. [Google Scholar] [CrossRef] [PubMed]
- Belete, F.; Maryo, M.; Teka, A. Land use/land cover dynamics and perception of the local communities in Bita district, south western Ethiopia. Int. J. River Basin Manag. 2021, 21, 211–222. [Google Scholar] [CrossRef]
- Li, J.; Qiu, Z.; Cao, K.; Deng, L.; Zhang, W.; Xie, C.; Yang, S.; Yue, P.; Zhong, J.; Lyu, J.; et al. Predicting muscle invasion in bladder cancer based on MRI: A comparison of radiomics, and single-task and multi-task deep learning. Comput. Methods Programs Biomed. 2023, 233, 107466. [Google Scholar] [CrossRef]
- Johnson, D.M.; Haynes, K.J. Spatiotemporal dynamics of forest insect populations under climate change. Curr. Opin. Insect Sci. 2023, 56, 101020. [Google Scholar] [CrossRef]
- Zhu, L.; Xue, Q.; Ma, G.; Ma, C.-S. Climate warming exacerbates plant disease through enhancing commensal interaction of co-infested insect vectors. J. Pest Sci. 2022, 96, 945–959. [Google Scholar] [CrossRef]
- Gao, Y.; Gao, F.; Dong, J.; Wang, S. Transferred Deep Learning for Sea Ice Change Detection From Synthetic-Aperture Radar Images. IEEE Geosci. Remote Sens. Lett. 2019, 16, 1655–1659. [Google Scholar] [CrossRef]
- Wang, Q.; Zhang, X.; Chen, G.; Dai, F.; Gong, Y.; Zhu, K. Change detection based on Faster R-CNN for high-resolution remote sensing images. Remote Sens. Lett. 2018, 9, 923–932. [Google Scholar] [CrossRef]
- Ball, J.E.; Anderson, D.T.; Chan, C.S. Special Section Guest Editorial: Feature and Deep Learning in Remote Sensing Applications. J. Appl. Remote Sens. 2018, 11, 1. [Google Scholar] [CrossRef]
- Geng, J.; Wang, H.; Fan, J.; Ma, X. Change detection of SAR images based on supervised contractive autoencoders and fuzzy clustering. In Proceedings of the 2017 International Workshop on Remote Sensing with Intelligent Processing (RSIP), Shanghai, China, 18–21 May 2017; IEEE: Piscataway, NJ, USA, 2017. [Google Scholar]
- Reichstein, M.; Camps-Valls, G.; Stevens, B.; Jung, M.; Denzler, J.; Carvalhais, N.; Prabhat, F. Deep learning and process understanding for data-driven Earth system science. Nature 2019, 566, 195–204. [Google Scholar] [CrossRef]
- Jiang, H.; Hu, X.; Li, K.; Zhang, J.; Gong, J.; Zhang, M. PGA-SiamNet: Pyramid Feature-Based Attention-Guided Siamese Network for Remote Sensing Orthoimagery Building Change Detection. Remote Sens. 2020, 12, 484. [Google Scholar] [CrossRef]
- Gong, J.; Hu, X.; Pang, S.; Wei, Y. Roof-Cut Guided Localization for Building Change Detection from Imagery and Footprint Map. Photogramm. Eng. Remote Sens. 2019, 85, 543–558. [Google Scholar] [CrossRef]
- Du, Z.; Li, X.; Miao, J.; Huang, Y.; Shen, H.; Zhang, L. Concatenated Deep-Learning Framework for Multitask Change Detection of Optical and SAR Images. IEEE J. Sel. Top. Appl. Earth Obs. Remote Sens. 2024, 17, 719–731. [Google Scholar] [CrossRef]
- Li, T.; Cui, L.; Liu, L.; Chen, Y.; Liu, H.; Song, X.; Xu, Z. Advances in the study of global forest wildfires. J. Soils Sediments 2023, 23, 2654–2668. [Google Scholar] [CrossRef]
- Ma, Y.; Chen, S.; Ermon, S.; Lobell, D.B. Transfer learning in environmental remote sensing. Remote Sens. Environ. 2024, 301, 113924. [Google Scholar] [CrossRef]
- Ren, Y.; Li, Z.; Xu, L.; Yu, J. The data-based adaptive graph learning network for analysis and prediction of offshore wind speed. Energy 2023, 267, 126590. [Google Scholar] [CrossRef]
- Al-Iiedane, H.A.; Mahameed, A.I. Satellite images for roads using transfer learning. Meas. Sens. 2023, 27, 100775. [Google Scholar] [CrossRef]
- Zhu, Q.; Guo, X.; Li, Z.; Li, D. A review of multi-class change detection for satellite remote sensing imagery. Geo-Spat. Inf. Sci. 2022, 27, 1–15. [Google Scholar] [CrossRef]
- Farooq, B.; Manocha, A. Satellite-based change detection in multi-objective scenarios: A comprehensive review. Remote Sens. Appl. Soc. Environ. 2024, 34, 101168. [Google Scholar] [CrossRef]
- Shi, R.; Yang, S.; Chen, Y.; Wang, R.; Zhang, M.; Lu, J.; Cao, Y. CNN-Transformer for visual-tactile fusion applied in road recognition of autonomous vehicles. Pattern Recognit. Lett. 2023, 166, 200–208. [Google Scholar] [CrossRef]
- Gad, E.; Soliman, S.; Darweesh, M.S. Advancing Brain Tumor Segmentation via Attention-Based 3D U-Net Architecture and Digital Image Processing. In Proceedings of the 12th International Conference on Model and Data Engineering, Sousse, Tunisia, 2–4 November 2023; Springer Nature: Cham, Switzerland, 2023; pp. 245–258. [Google Scholar]
- Oktay, O.; Schlemper, J.; Folgoc, L.L.; Lee, M.; Heinrich, M.; Misawa, K.; Mori, K.; McDonagh, S.; Hammerla, N.Y.; Kainz, B.; et al. Attention U-Net: Learning Where to Look for the Pancreas. arXiv 2018, arXiv:1804.03999. [Google Scholar]
- Yeung, M.; Sala, E.; Schönlieb, C.-B.; Rundo, L. Focus U-Net: A novel dual attention-gated CNN for polyp segmentation during colonoscopy. Comput. Biol. Med. 2021, 137, 104815. [Google Scholar] [CrossRef] [PubMed]
- Garnot, V.S.F.; Landrieu, L. Panoptic Segmentation of Satellite Image Time Series with Convolutional Temporal Attention Networks. arXiv 2021, arXiv:2107.07933v4. [Google Scholar]
- Zheng, H.; Cheng, T.; Li, D.; Zhou, X.; Yao, X.; Tian, Y.; Cao, W.; Zhu, Y. Evaluation of RGB, color-infrared and multispectral images acquired from unmanned aerial systems for the estimation of nitrogen accumulation in rice. Remote Sens. 2018, 10, 824. [Google Scholar] [CrossRef]
- Google Earth. Available online: https://www.google.com/earth/ (accessed on 14 June 2024).
- Deforestation Fronts. WWF. Available online: https://shorturl.at/sAOfD (accessed on 14 June 2024).
- Hu, J.; Shen, L.; Sun, G. Squeeze-and-Excitation Networks. In Proceedings of the 2018 IEEE/CVF Conference on Computer Vision and Pattern Recognition, Salt Lake City, UT, USA, 18–22 June 2018; IEEE: Piscataway, NJ, USA, 2018. [Google Scholar]
- Qin, Z.; Zhang, P.; Wu, F.; Li, X. FcaNet: Frequency Channel Attention Networks. In Proceedings of the 2021 IEEE/CVF International Conference on Computer Vision (ICCV), Montreal, BC, Canada, 11–17 October 2021; IEEE: Piscataway, NJ, USA, 2021. [Google Scholar]
- Zhang, H.; Wu, C.; Zhang, Z.; Zhu, Y.; Lin, H.; Zhang, Z.; Sun, Y.; He, T.; Mueller, J.; Manmatha, R.; et al. ResNeSt: Split-Attention Networks. In Proceedings of the 2022 IEEE/CVF Conference on Computer Vision and Pattern Recognition Workshops (CVPRW), New Orleans, LA, USA, 19–20 June 2022; IEEE: Piscataway, NJ, USA, 2022. [Google Scholar]
- Daudt, R.C.; Saux, B.L.; Boulch, A. Fully Convolutional Siamese Networks for Change Detection. In Proceedings of the 2018 25th IEEE International Conference on Image Processing (ICIP), Athens, Greece, 7–10 October 2018; IEEE: Piscataway, NJ, USA, 2018. [Google Scholar]
- Daudt, R.C.; Saux, B.L.; Boulch, A.; Gousseau, Y. OSCD-Onera Satellite Change Detection; IEEE DataPort: Piscataway, NJ, USA, 2019. [Google Scholar]
- Daudt, R.C.; Saux, B.L.; Boulch, A.; Gousseau, Y. Multitask learning for large-scale semantic change detection. Comput. Vis. Image Underst. 2019, 187, 102783. [Google Scholar] [CrossRef]
Disclaimer/Publisher’s Note: The statements, opinions and data contained in all publications are solely those of the individual author(s) and contributor(s) and not of MDPI and/or the editor(s). MDPI and/or the editor(s) disclaim responsibility for any injury to people or property resulting from any ideas, methods, instructions or products referred to in the content. |
© 2024 by the authors. Licensee MDPI, Basel, Switzerland. This article is an open access article distributed under the terms and conditions of the Creative Commons Attribution (CC BY) license (https://creativecommons.org/licenses/by/4.0/).