Computer Vision Technology for Short Fiber Segmentation and Measurement in Scanning Electron Microscopy Images

 , ,
, ,  ,
,  ,
, 
Abstract
1. Introduction
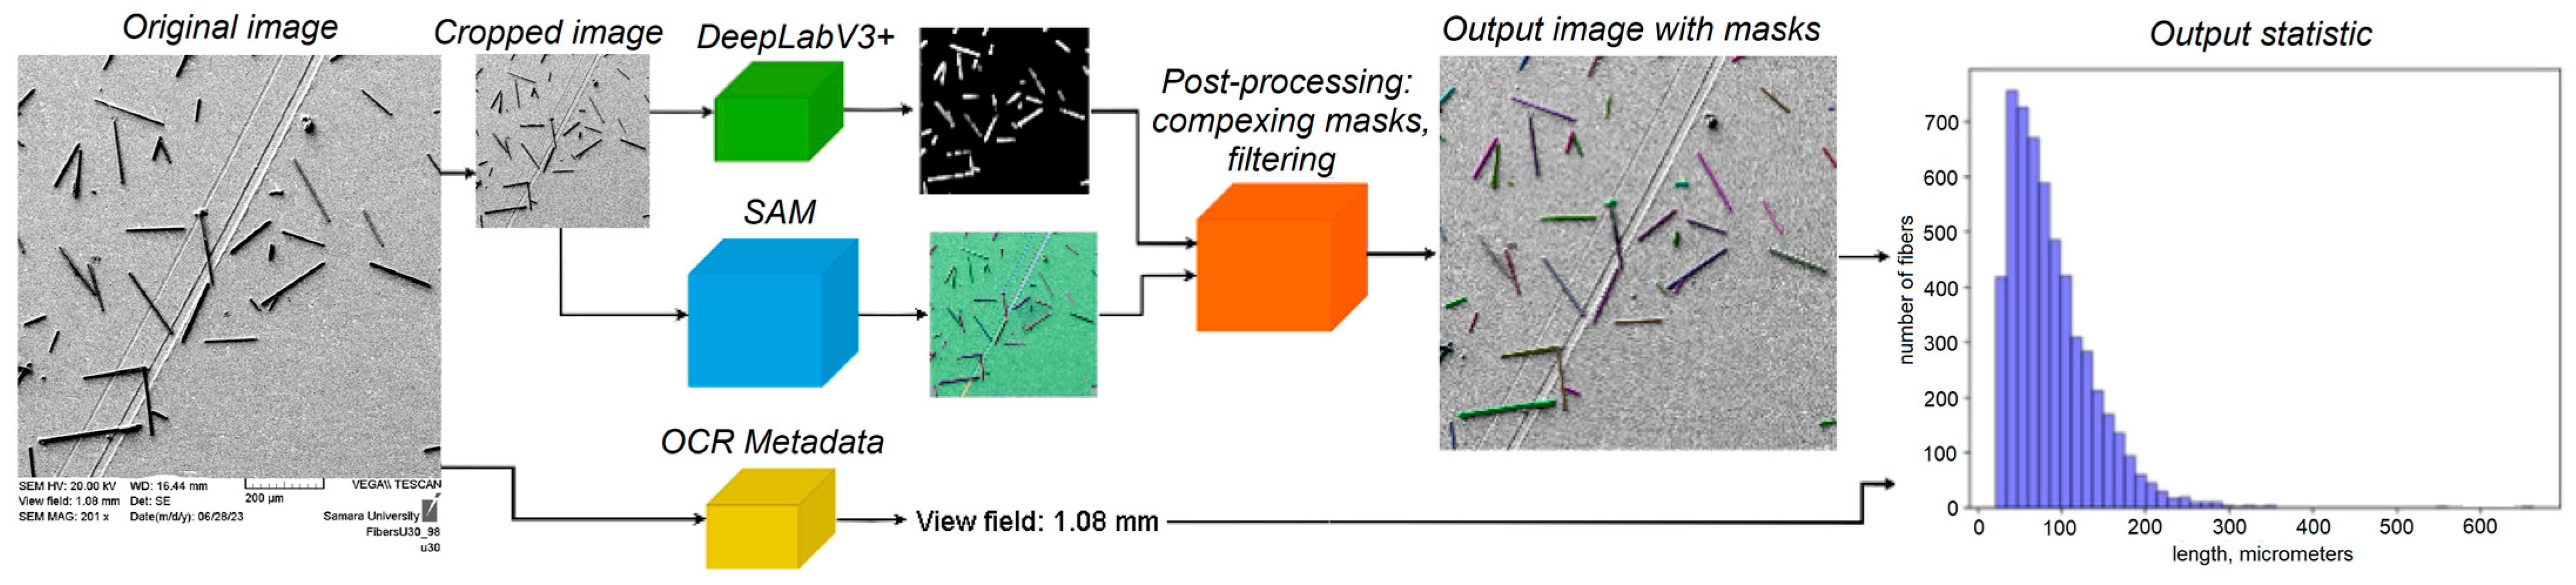
- The two-stage pipeline combining SAM and DeepLabV3+ provides the generalizability and accuracy of the foundational SAM model and the ability to quickly train on a small amount of data from the DeepLabV3+ model (Section 2.5). The pipeline was trained several times more rapidly (~30 min of pipeline vs. ~180 min of SAM) with lower requirements (one RTX 4090 of pipeline vs. 4 Tesla K80 GPUs of SAM) for computing resources than fine-tuning the SAM model but with a comparable inference time (951 milliseconds of pipeline vs. 900 milliseconds of SAM) (Section 3.2).
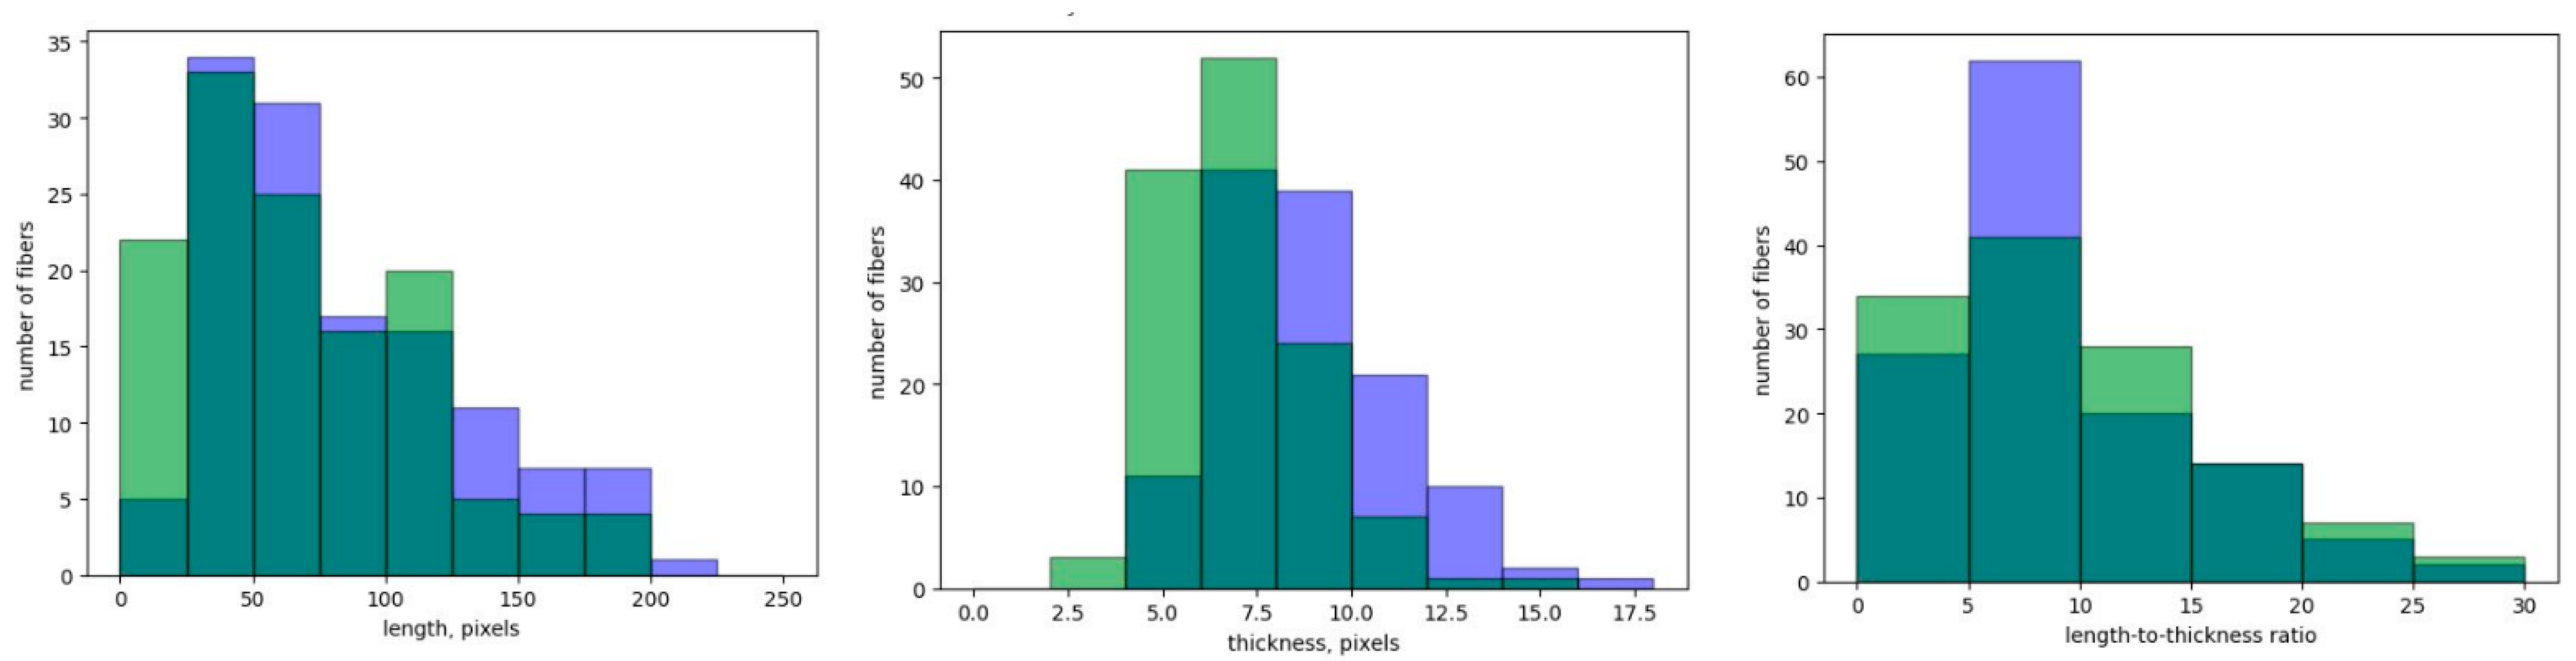
- End-to-end technology for processing images of electron microscope fibers from images with metadata to obtain statistics regarding the distribution of the geometric characteristics of fibers (Section 3.2). The result of this work is statistical data on the distribution of the geometric characteristics of such fibers; this is of great practical importance for modeling the physical characteristics of materials.
- A few-shot training procedure for the DeepLabV3+/SAM pipeline combining training of the DeepLabV3+ model weights and SAM model parameters, making pipeline training possible using only 37 real labeled images. The pipeline was then adapted to a new type of fiber and background using 15 additional real labeled images (Section 3.2).
- A method to generate synthetic data for additional training of neural networks for fiber segmentation (Section 2.4) allowed us to further improve the segmentation quality by 1%.
2. Materials and Methods
2.1. Methodology
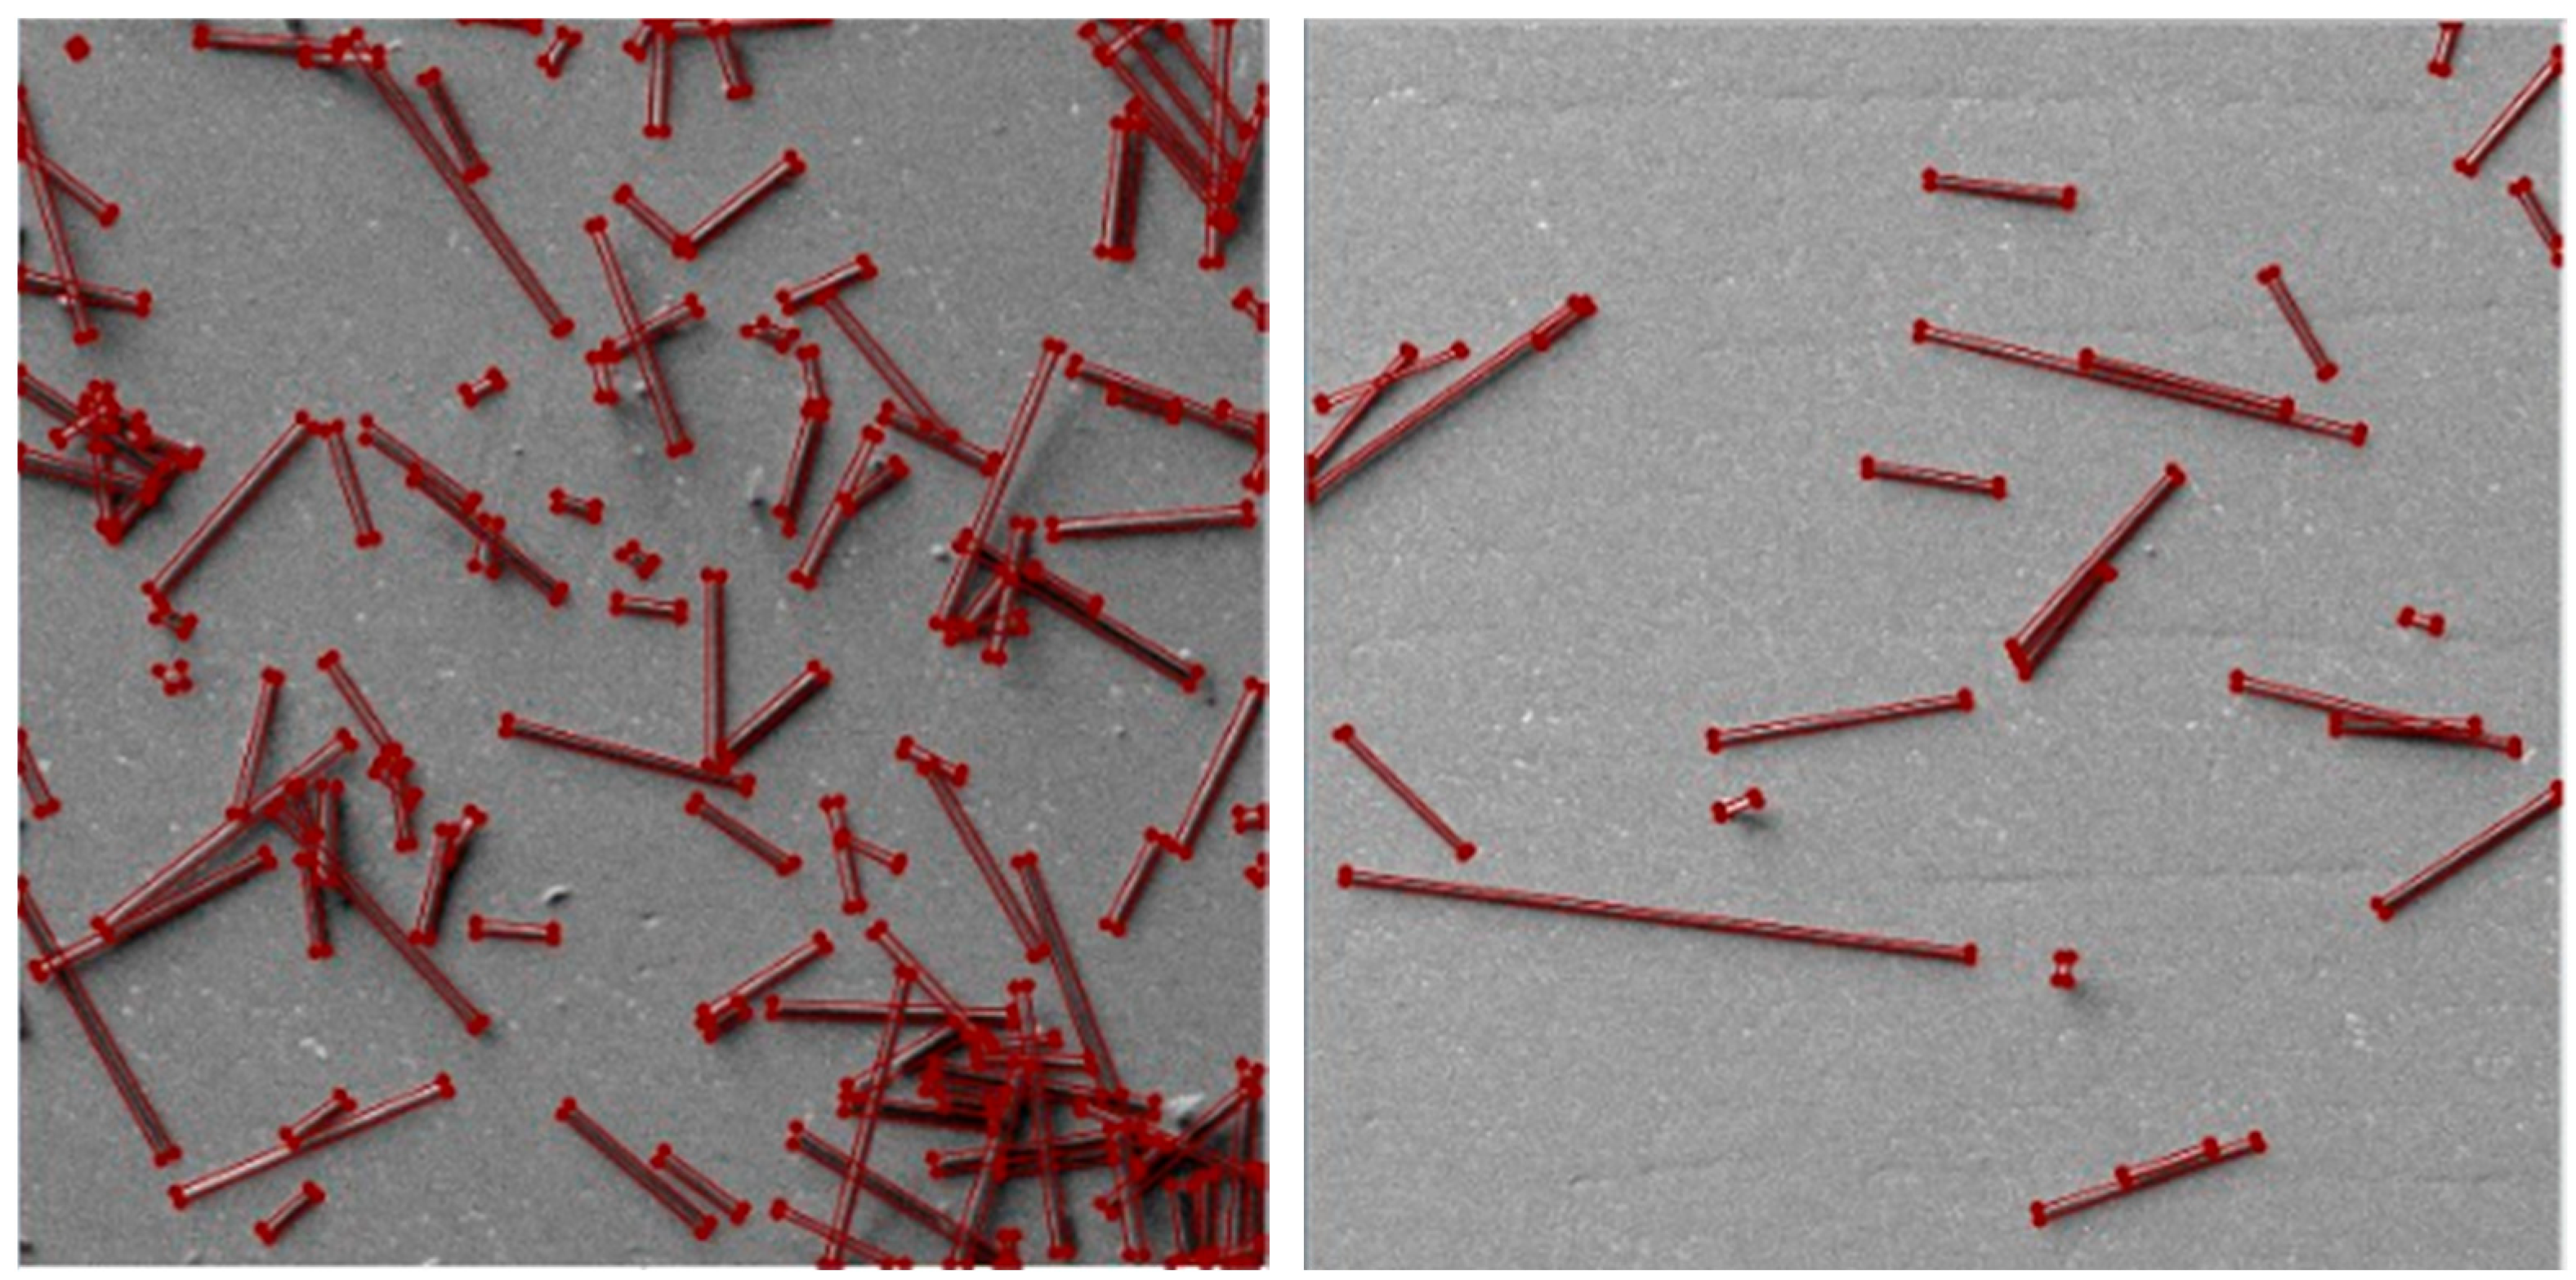
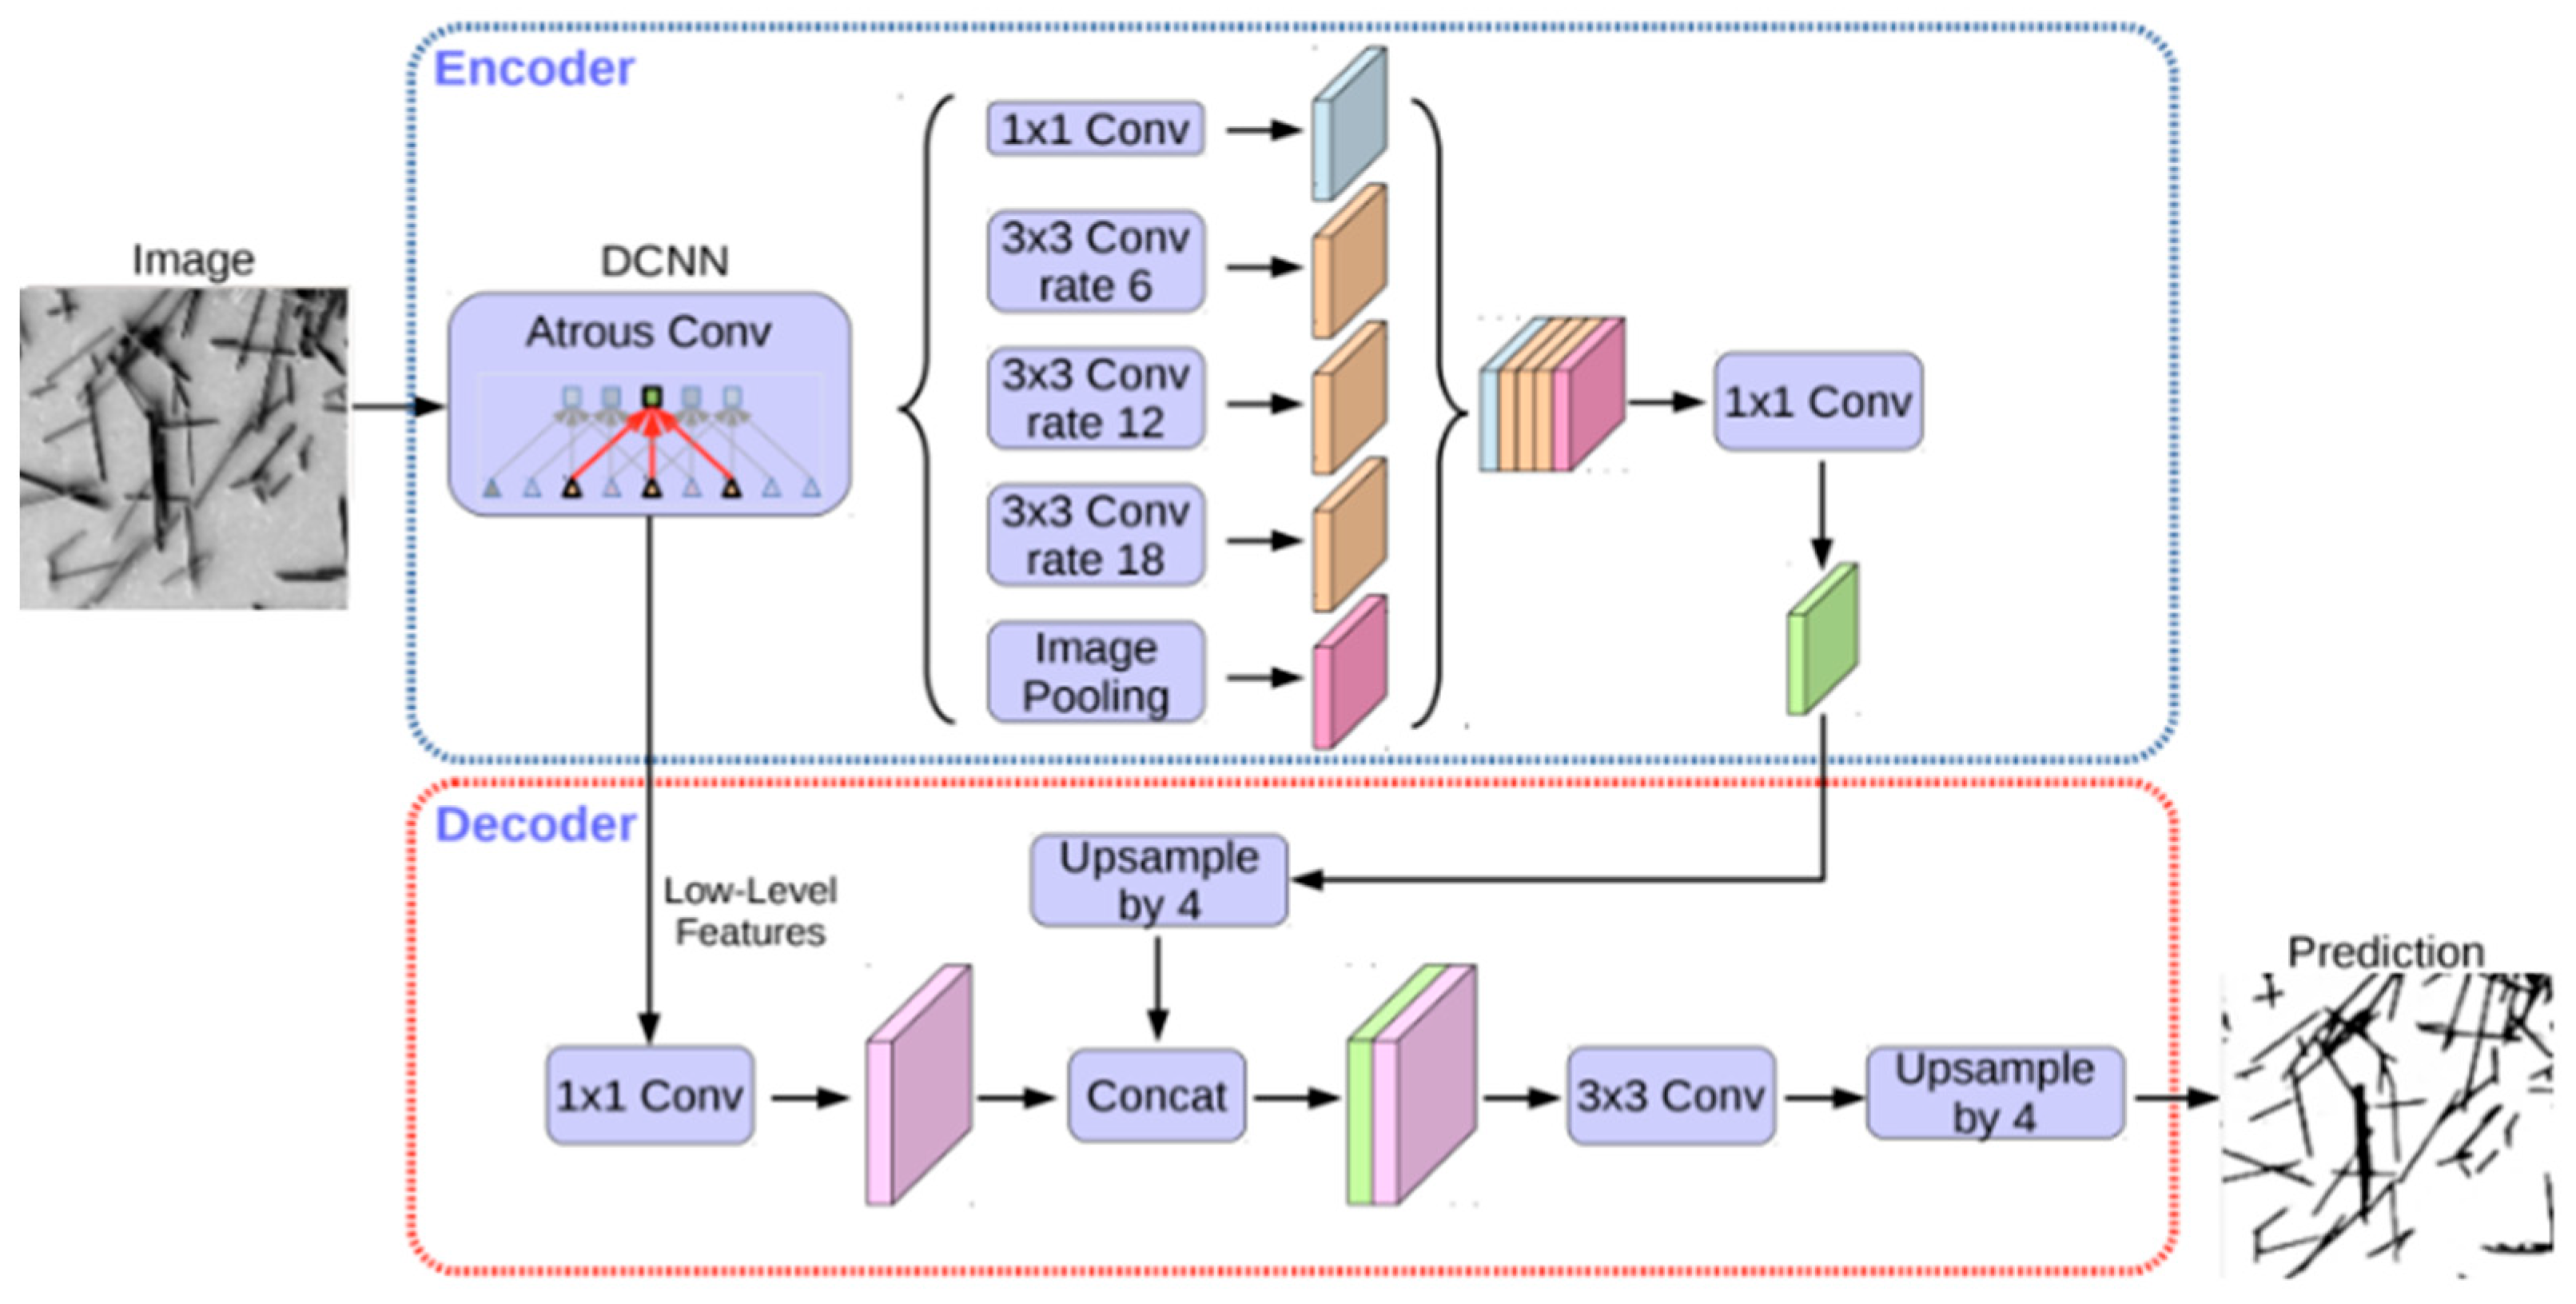
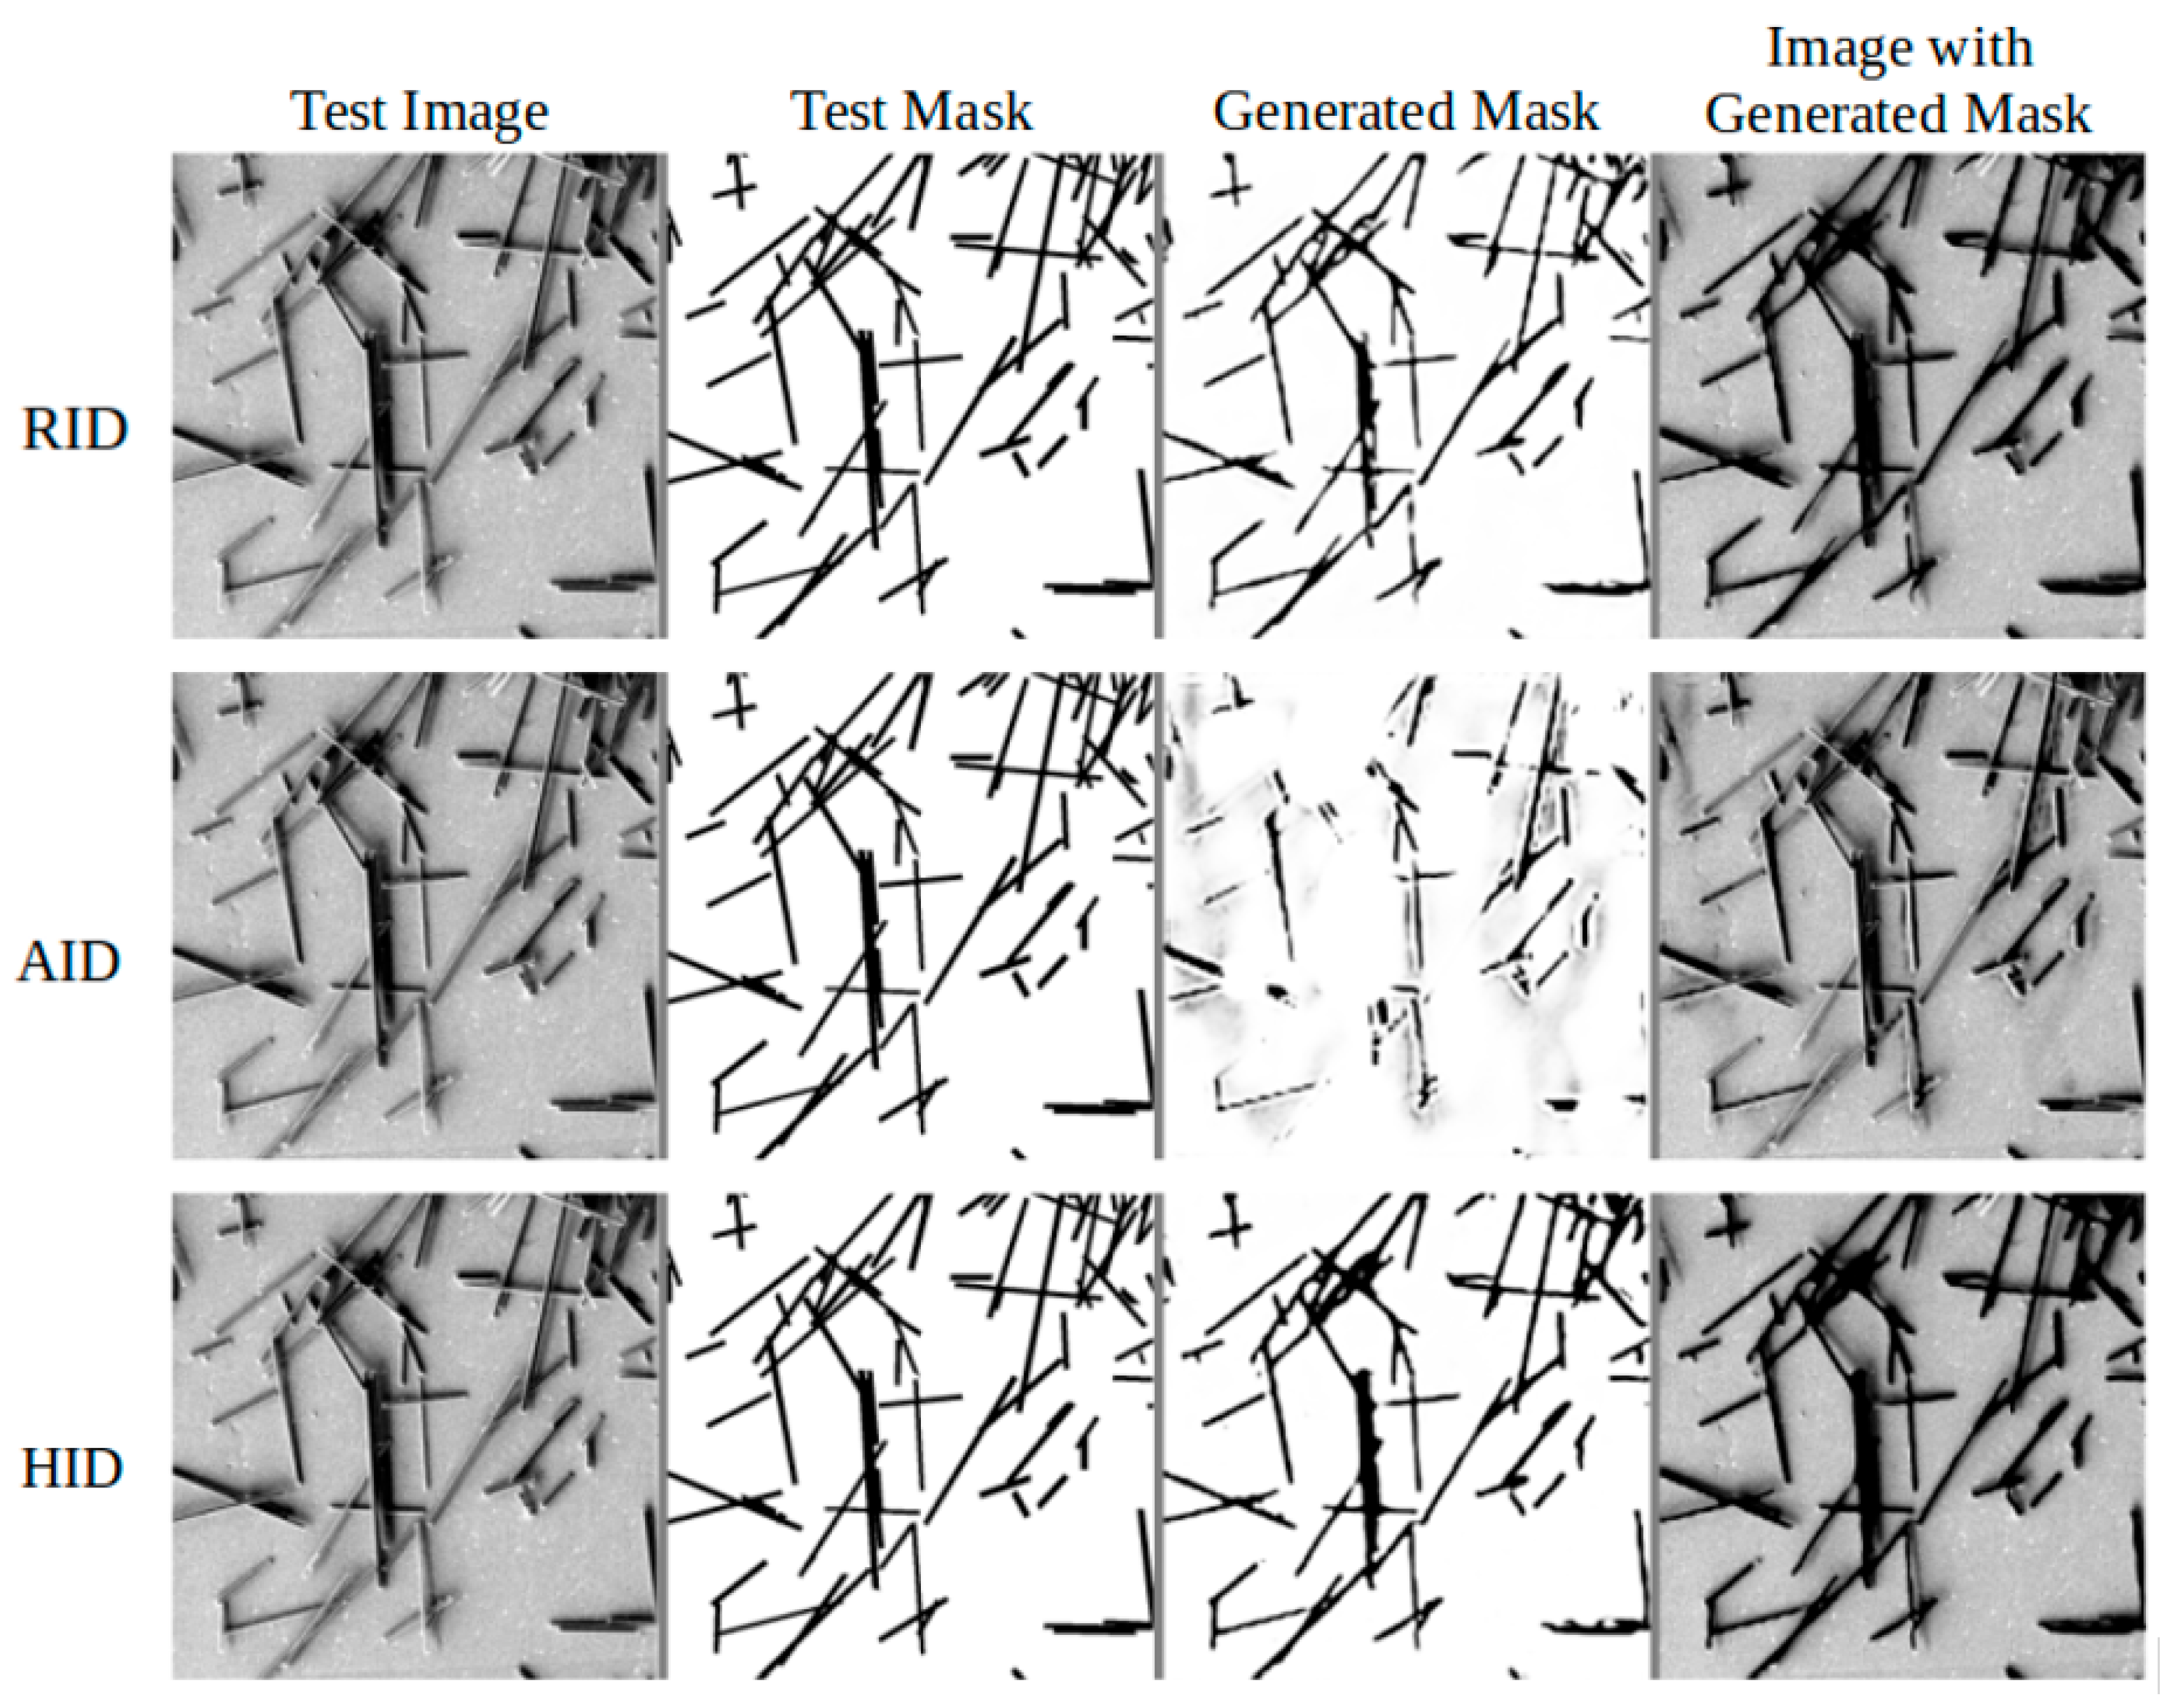
- Semantic segmentation of the original scanning electron microscope image to separate the fibers and the background.
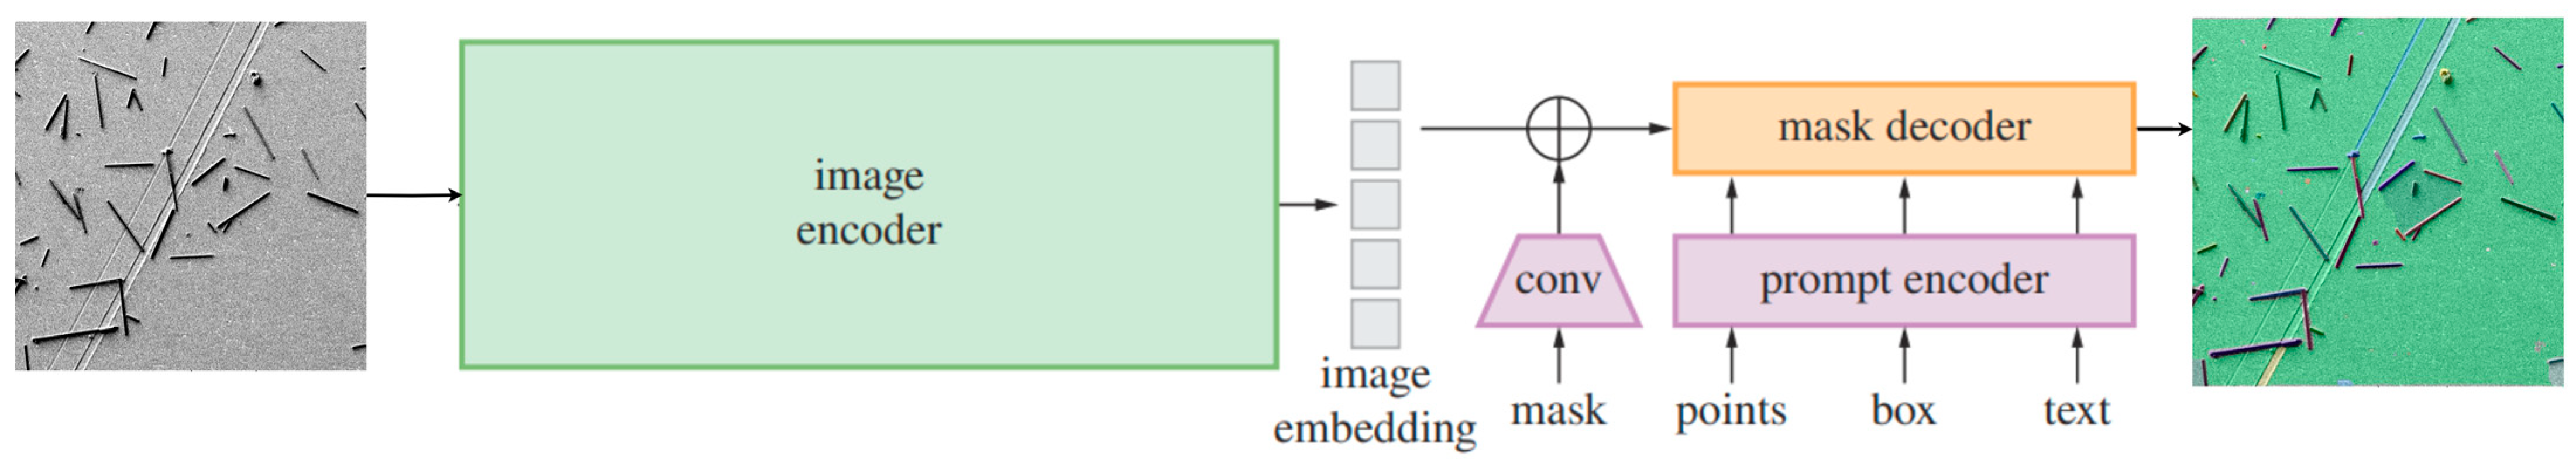
- Segmentation of individual fiber instances in the image using a foundational segmentation model, and filtering of the instance masks using the results of the first stage segmentation.
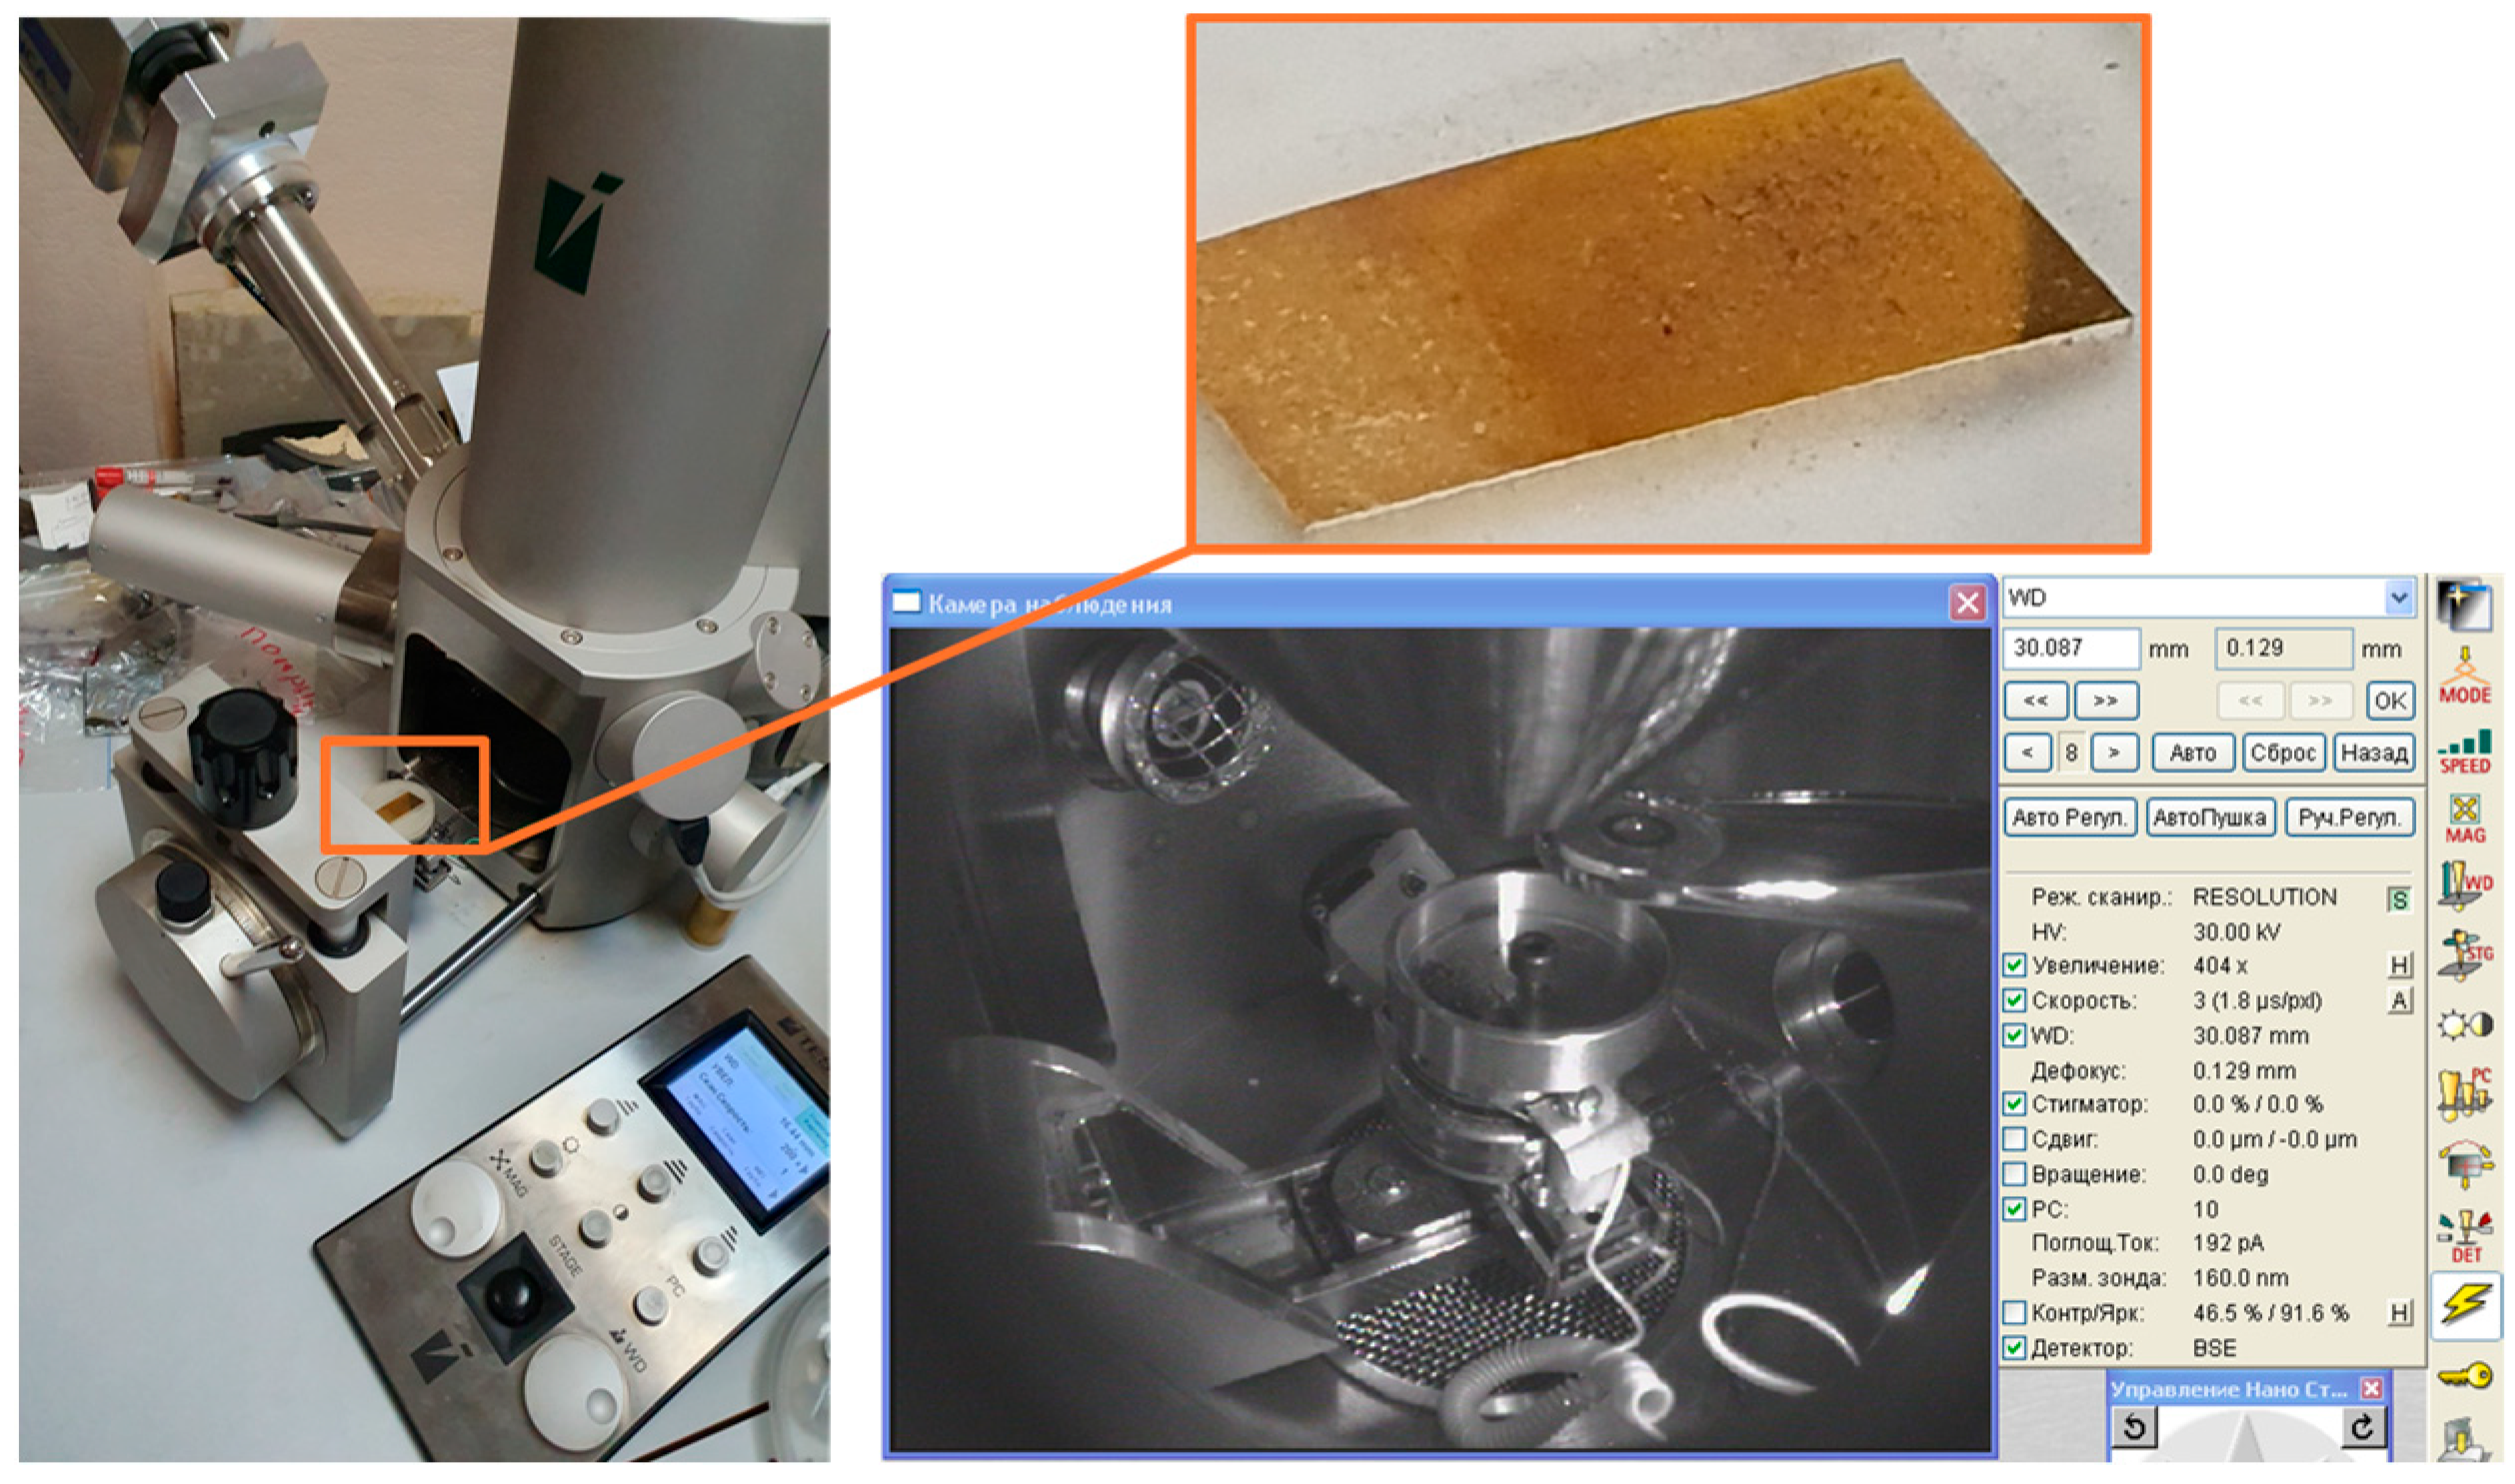
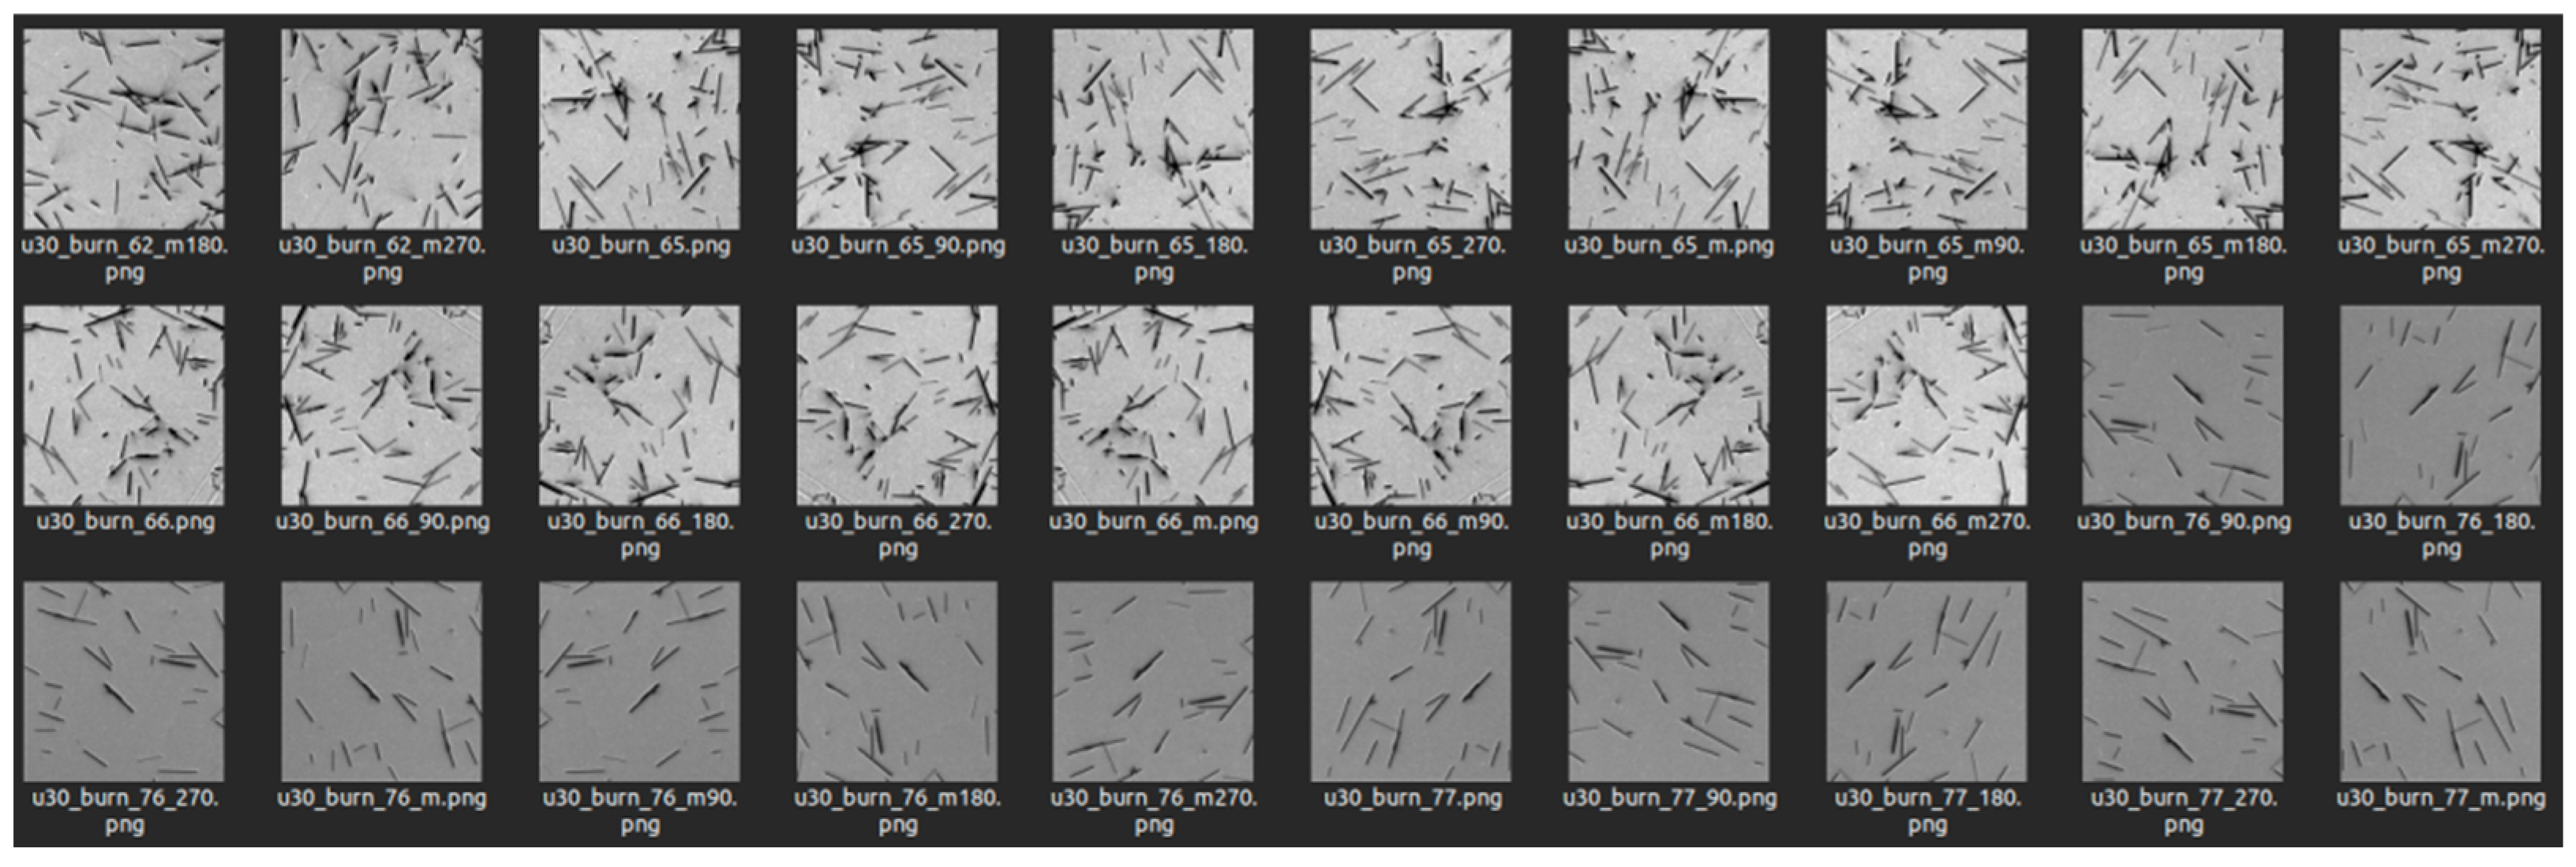
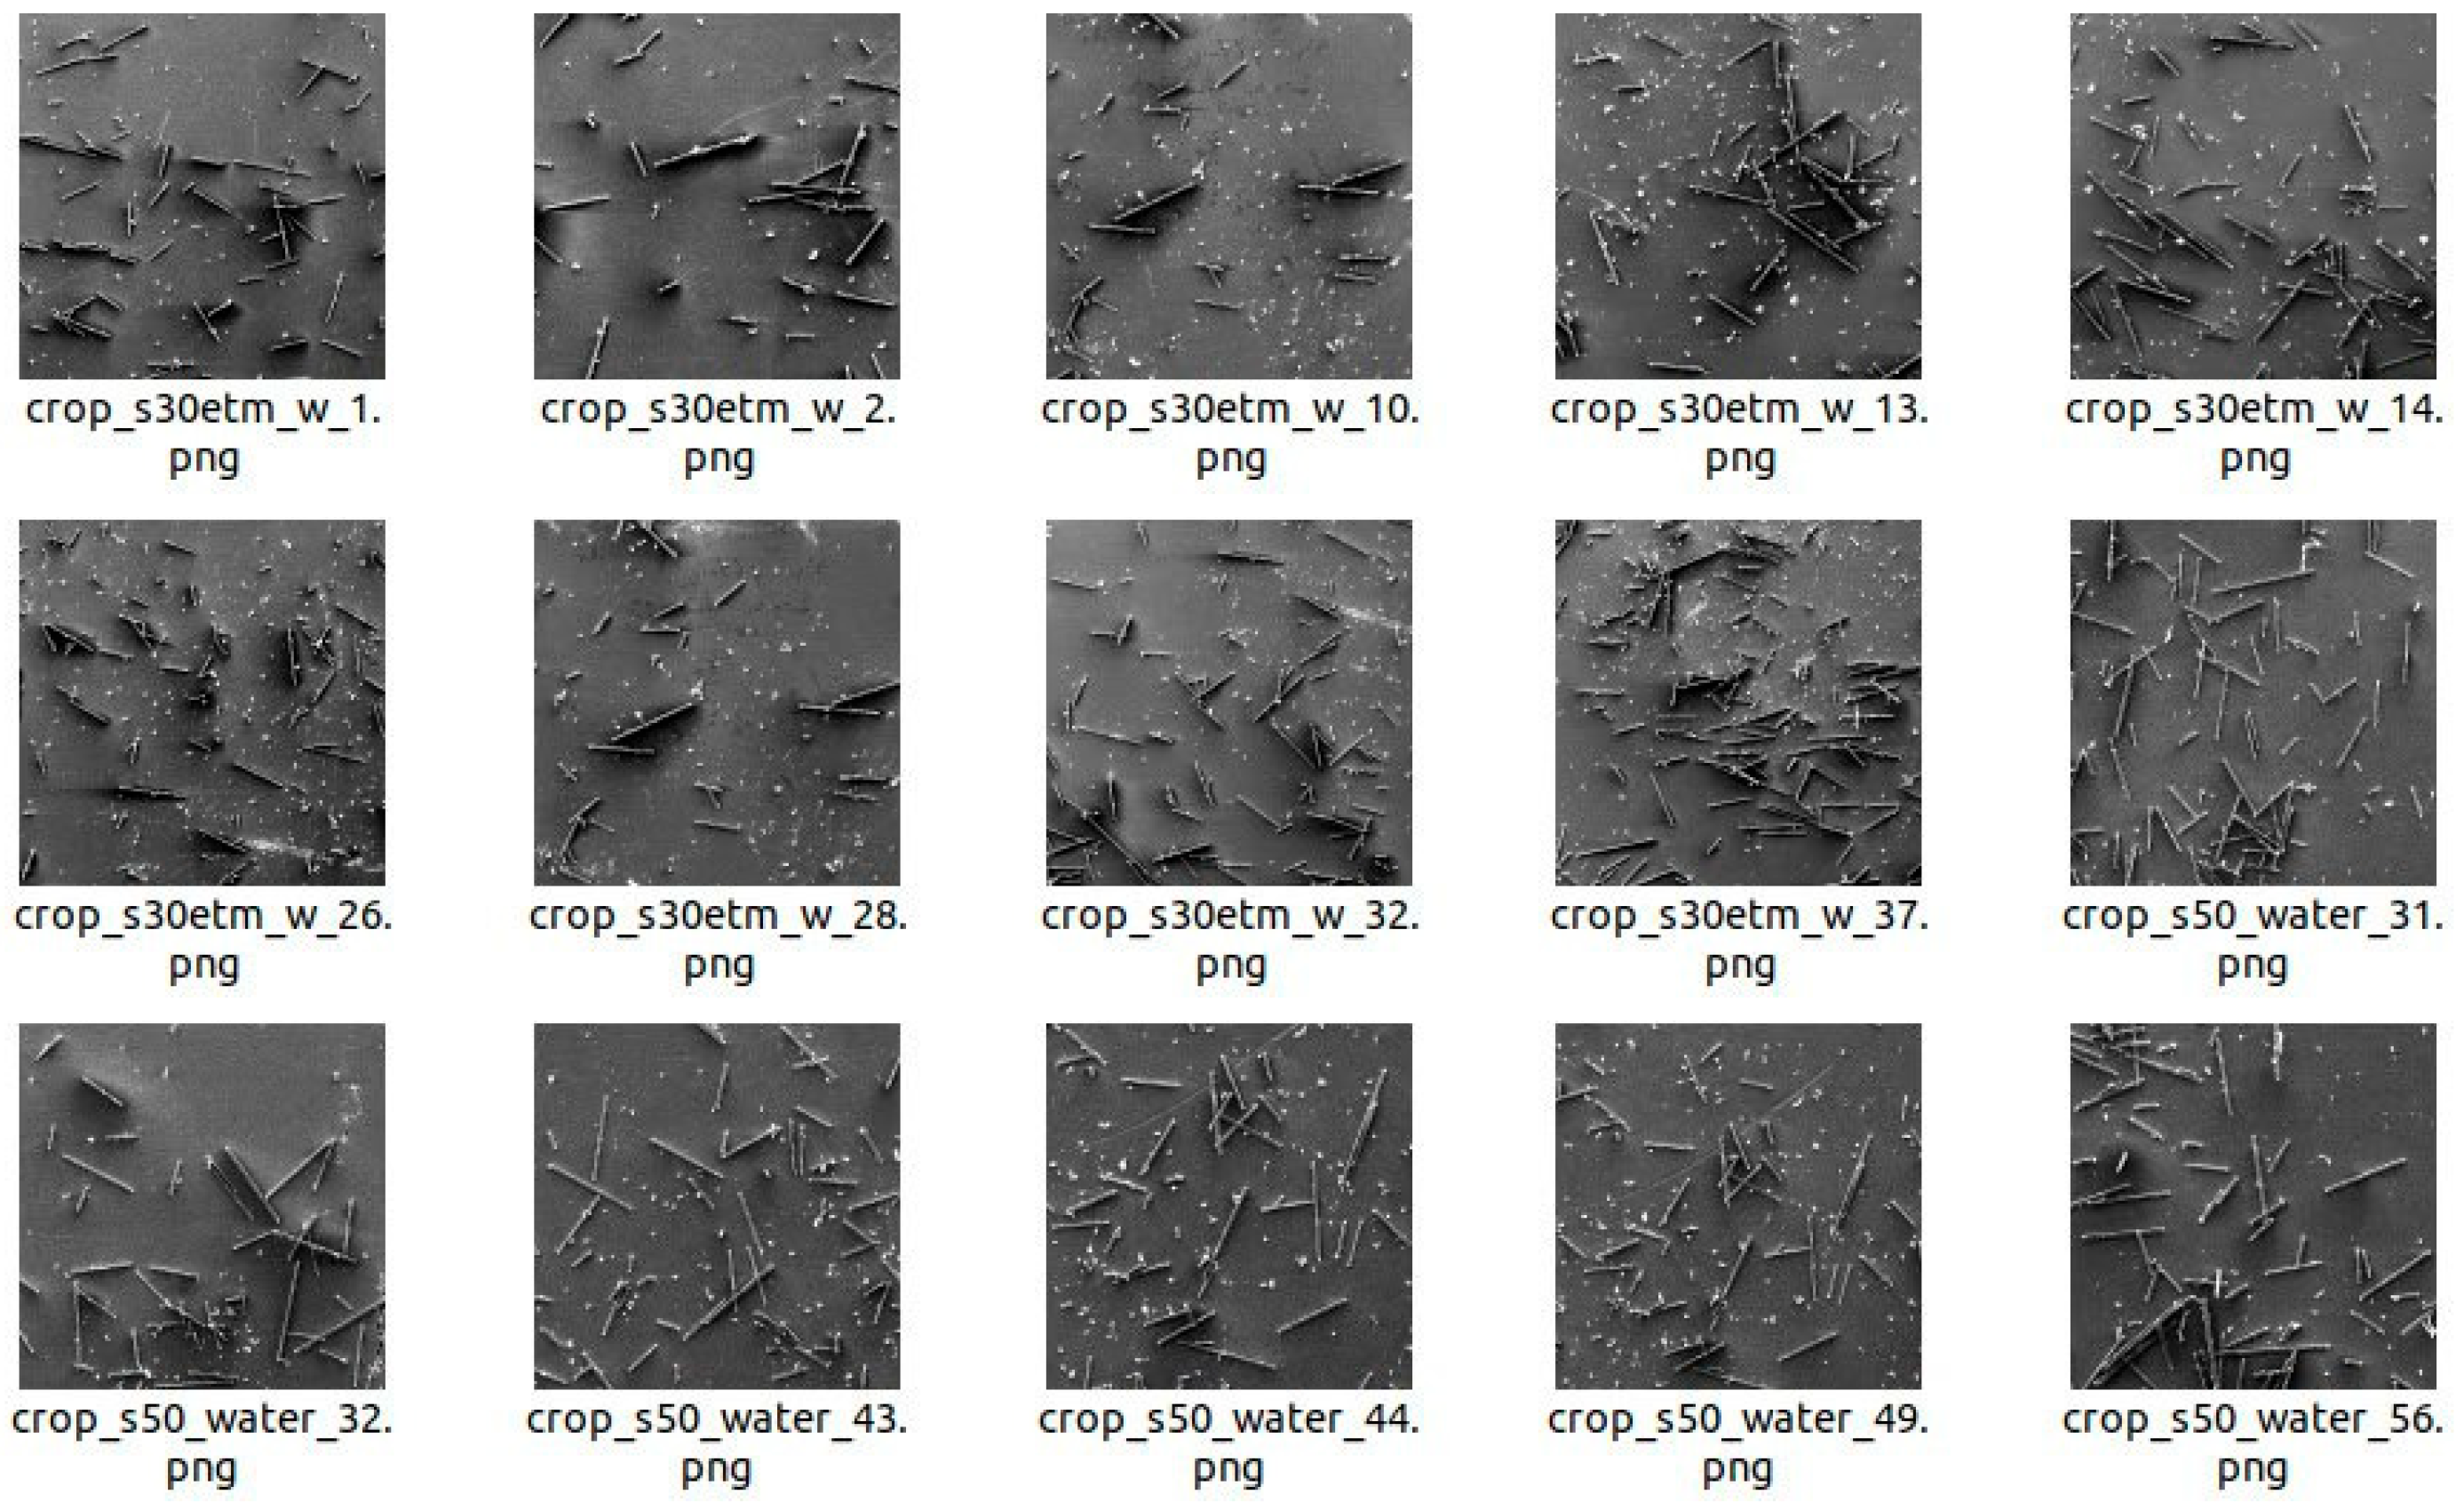
2.2. Creation of Real Images of Short Carbon Fibers
- The arrangement of the fibers in a thin layer, preferably a single layer, so that the underlying substrate is visible. The multilayer arrangement of fibers does not allow reliable separation of one fiber from another, especially when considering multiple superpositions of fibers with each other.
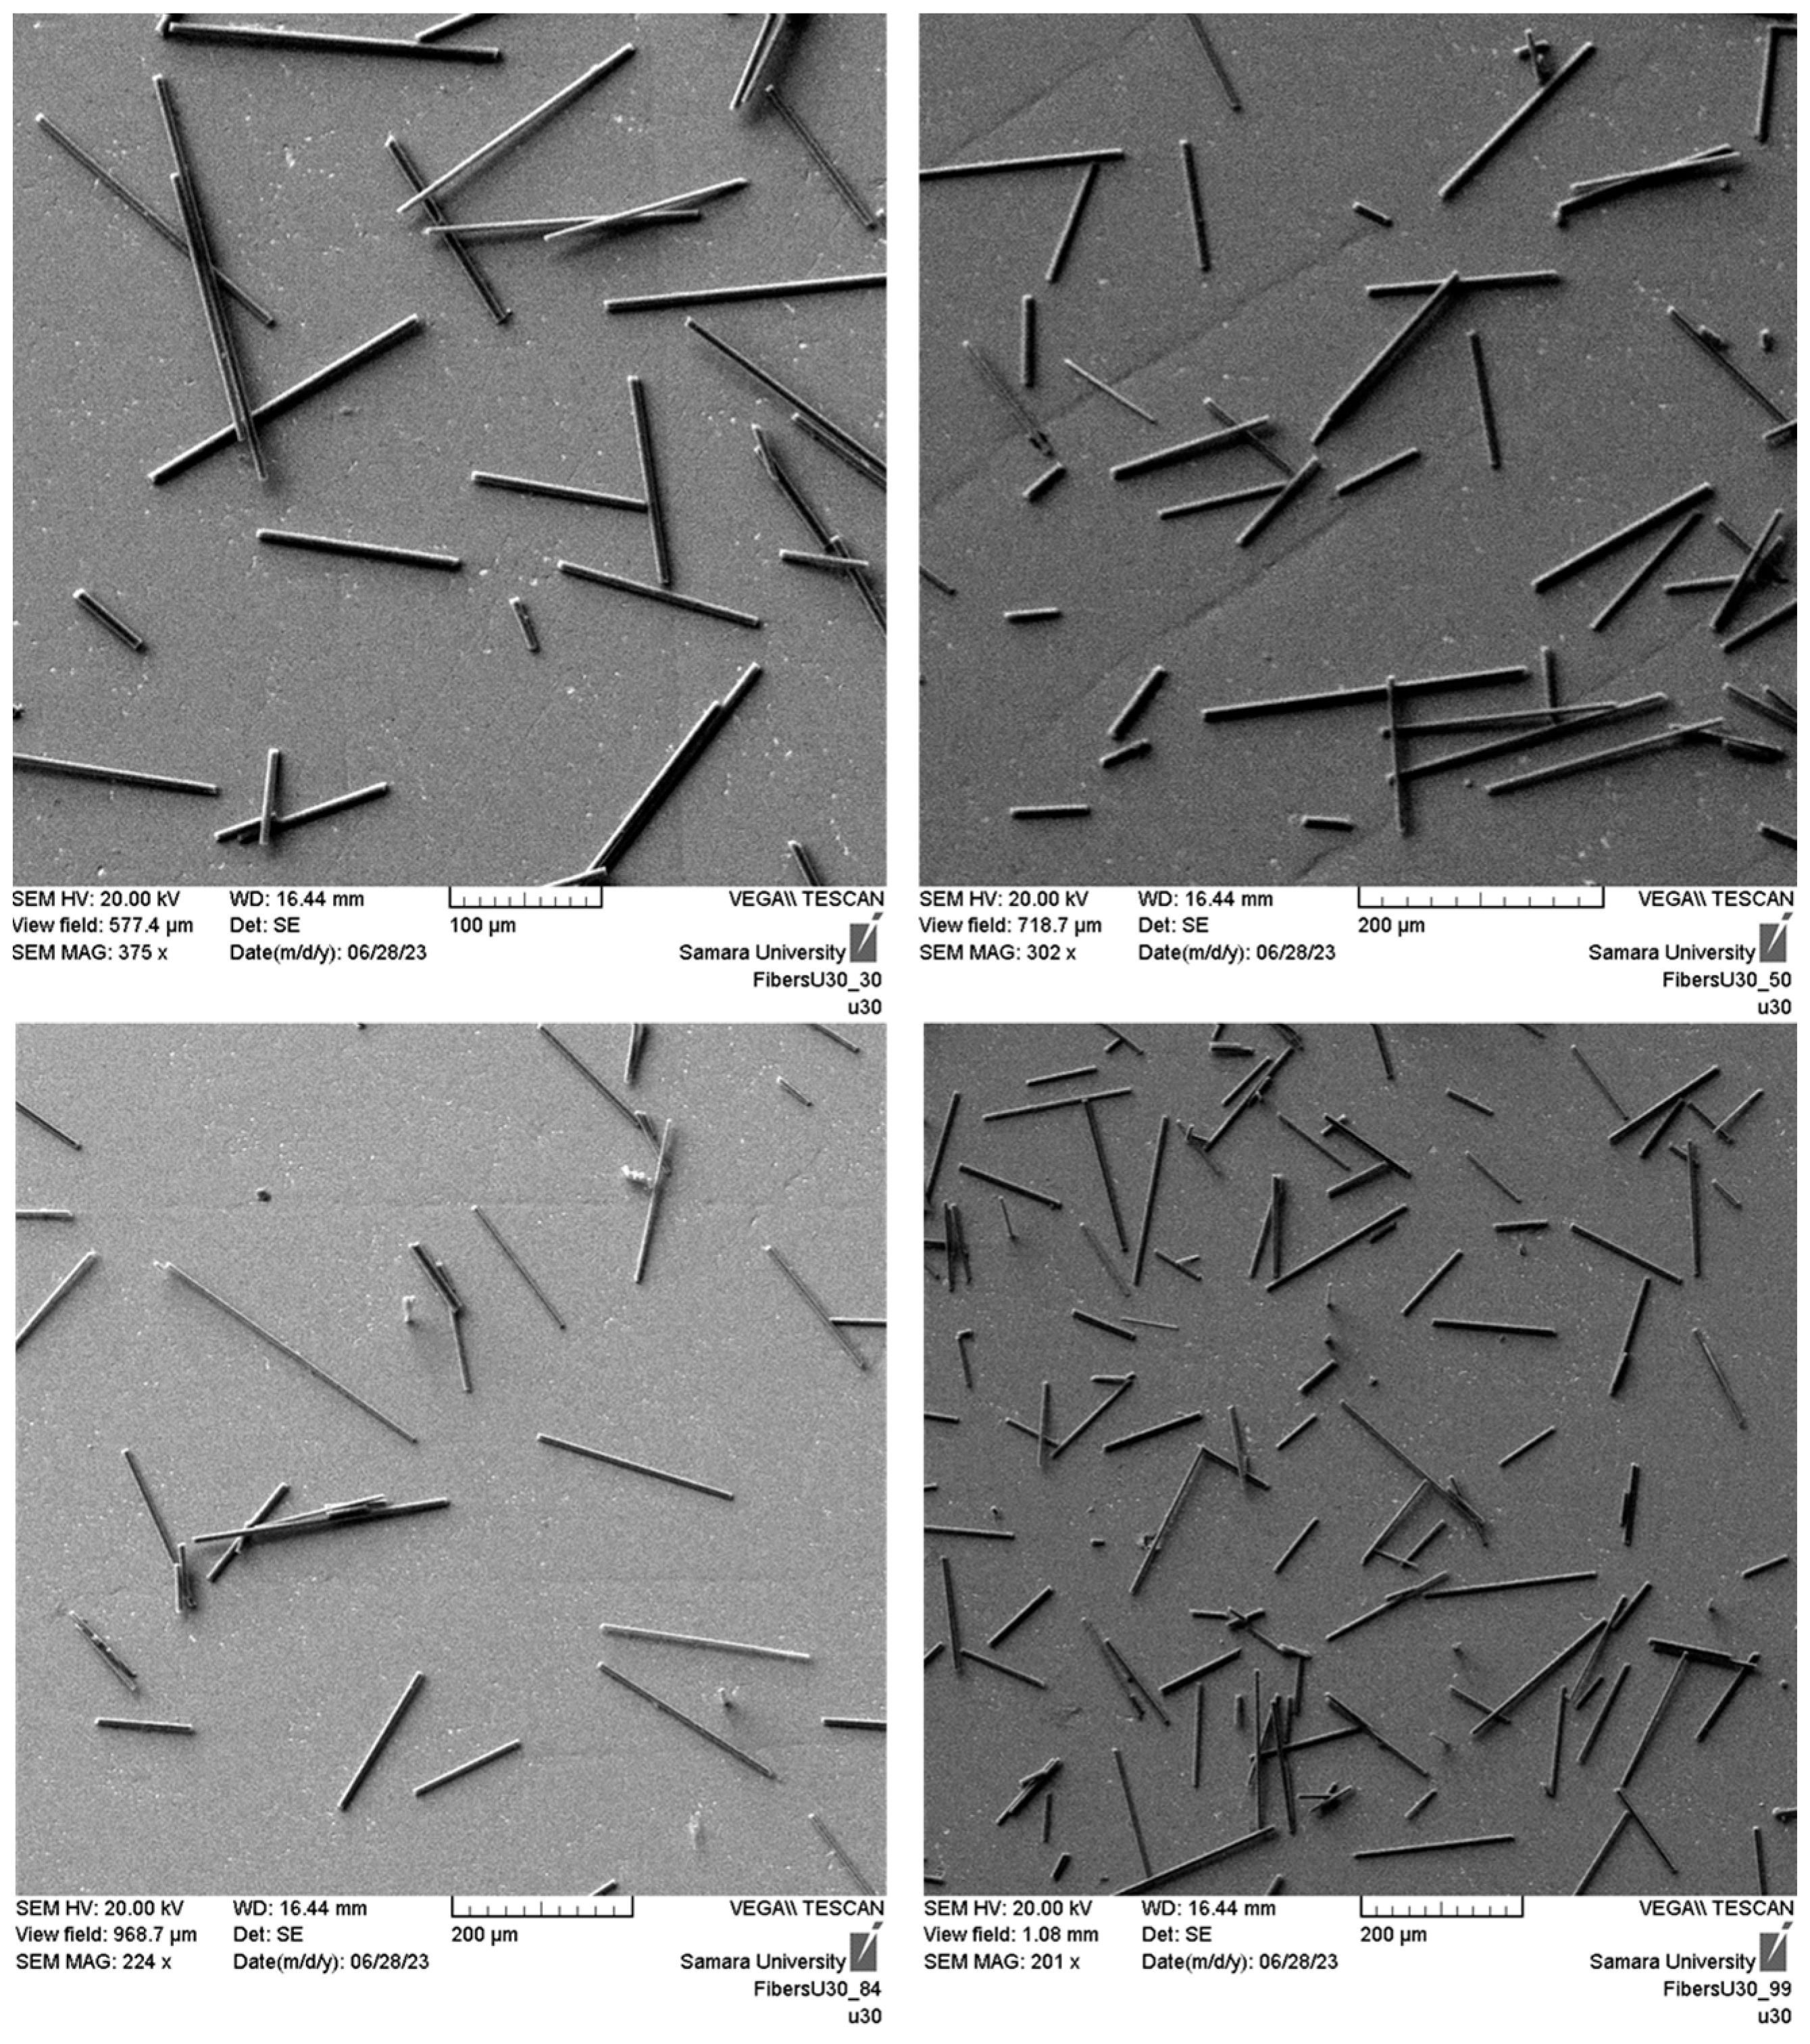
- The fibers were examined on a well-polished background. The presence of background roughness caused, for example, by rough machining or sanding can sometimes cause false positives in subsequent image segmentation (see Figure 5).
- The magnification of the electron microscope should ensure the capture of four to six medium lengths of fibers. On the one hand, this ensures the reliable measurement of their length and, on the other hand, does not cause large deviations due to the effect of incorrect measurement of the length of the fibers extending beyond the boundaries of the frame (see Figure 6).
2.3. Labeling of Images
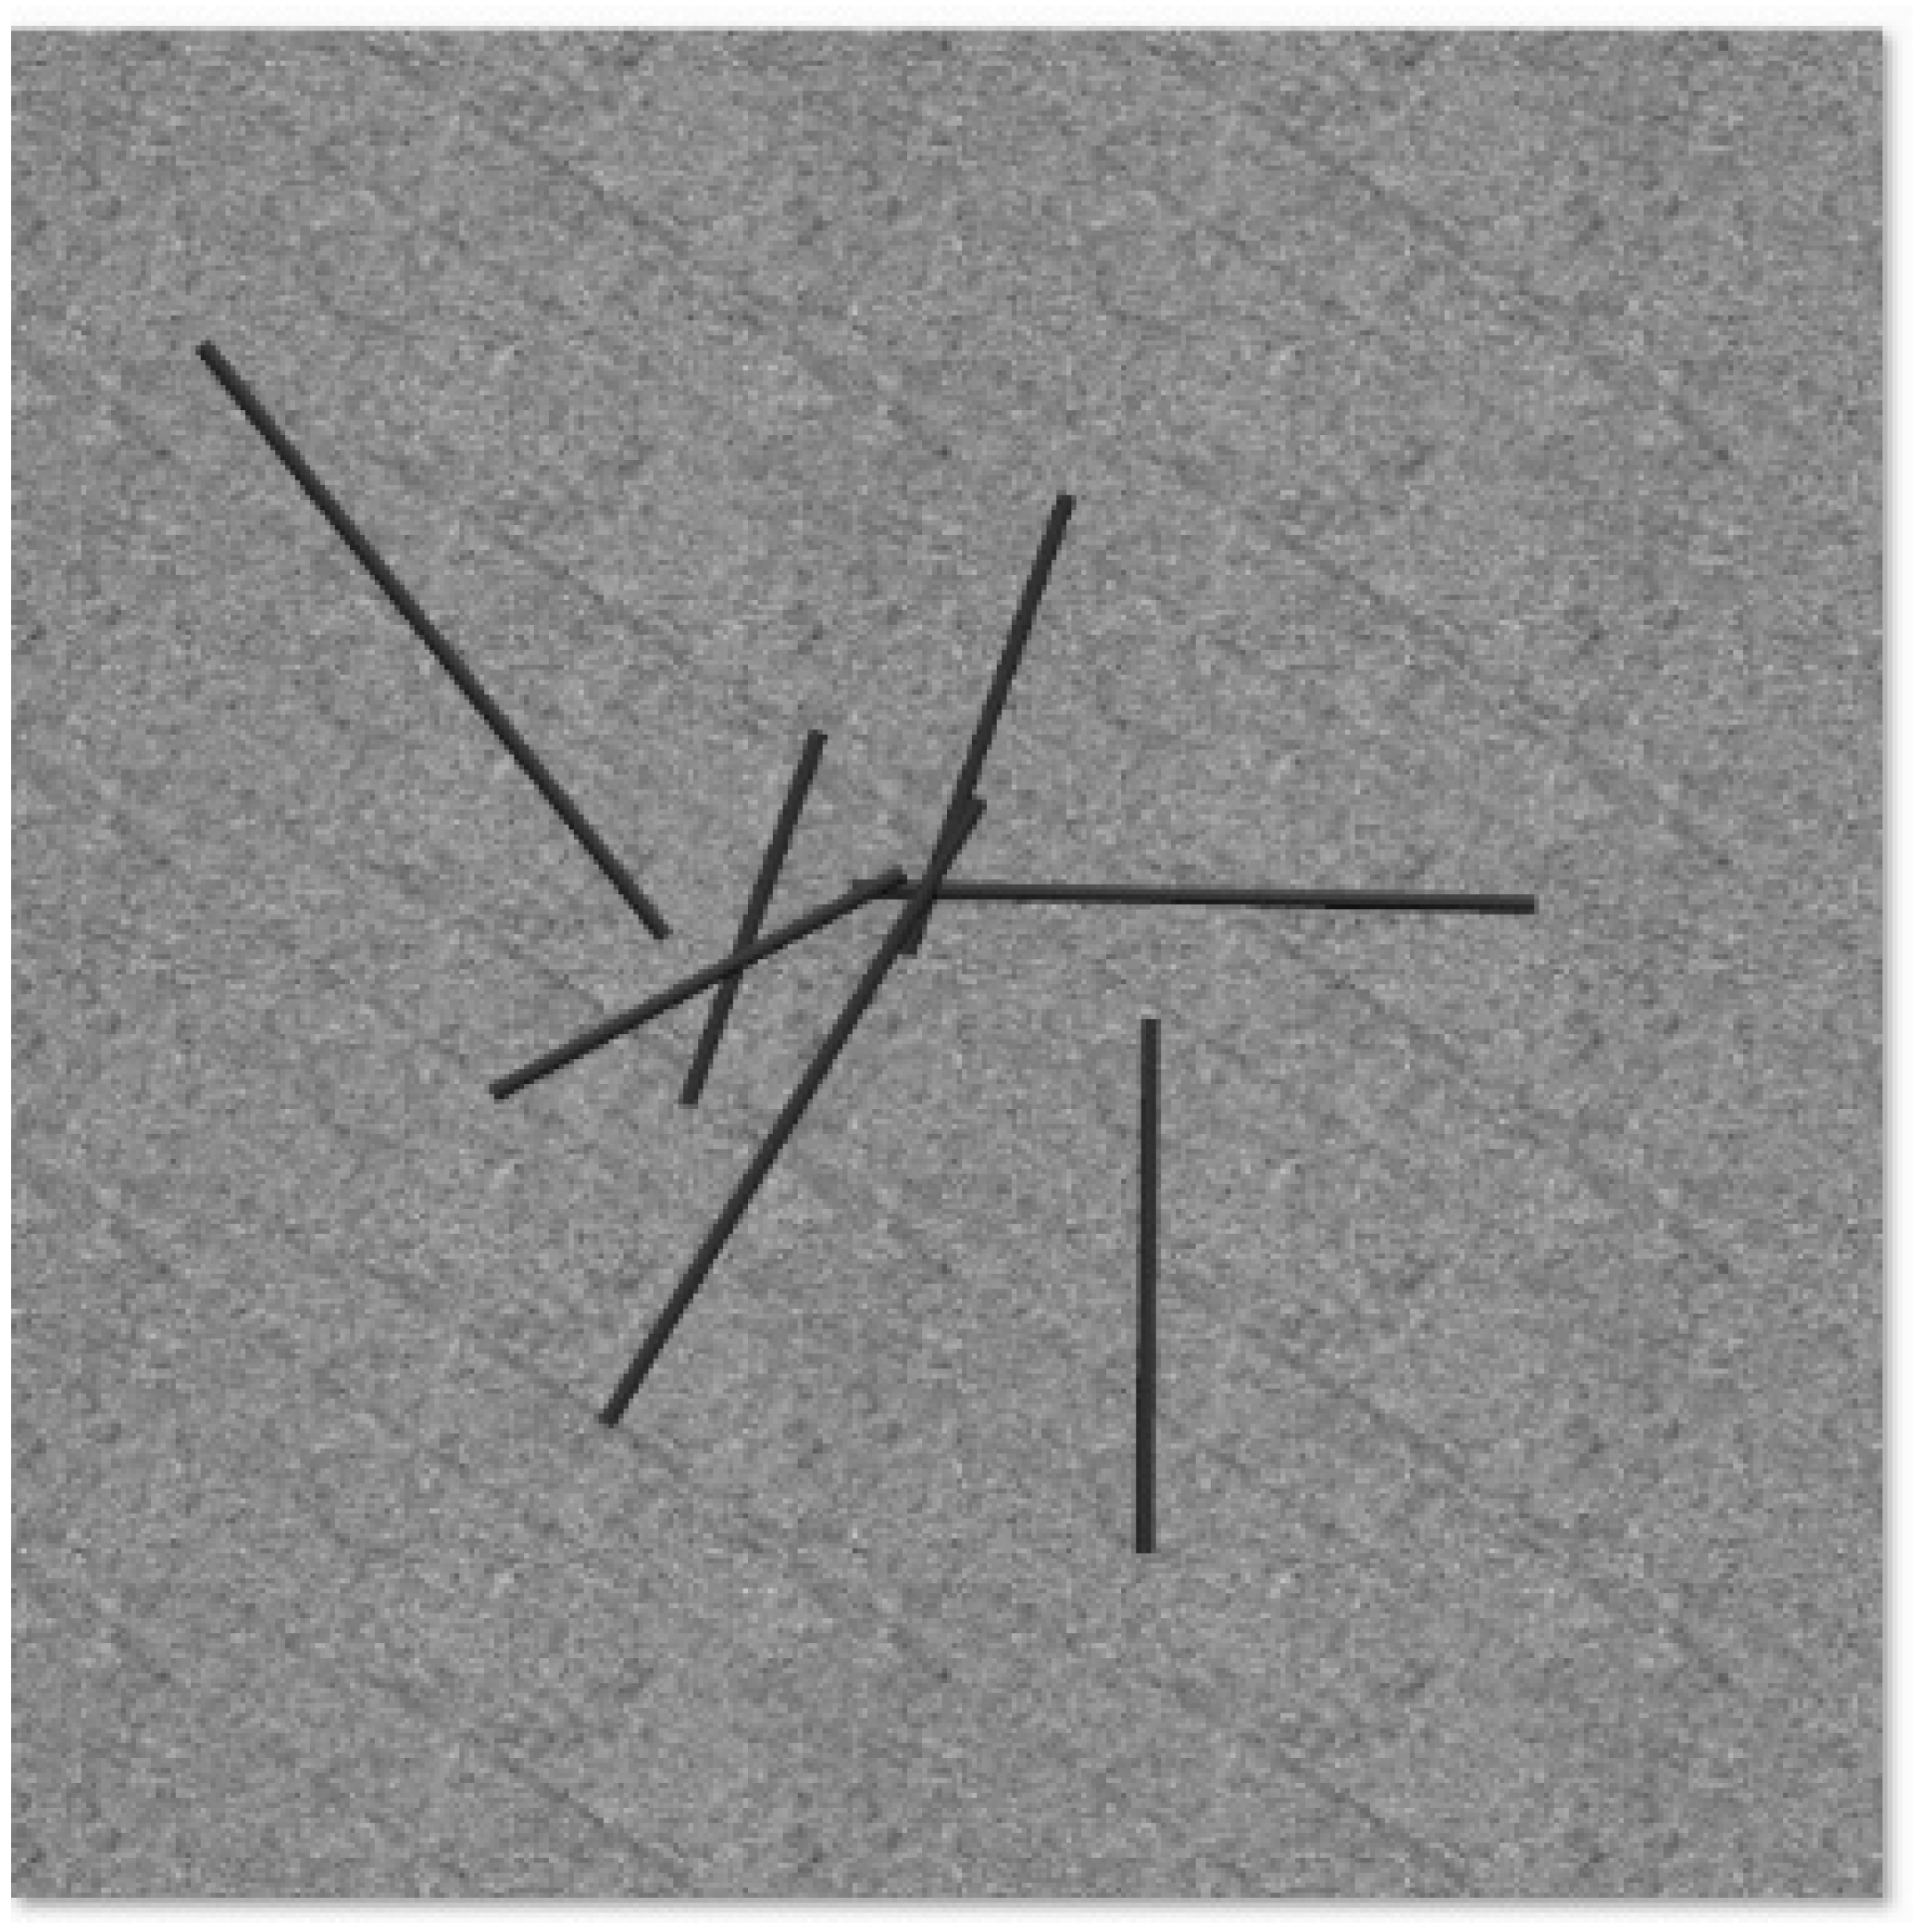
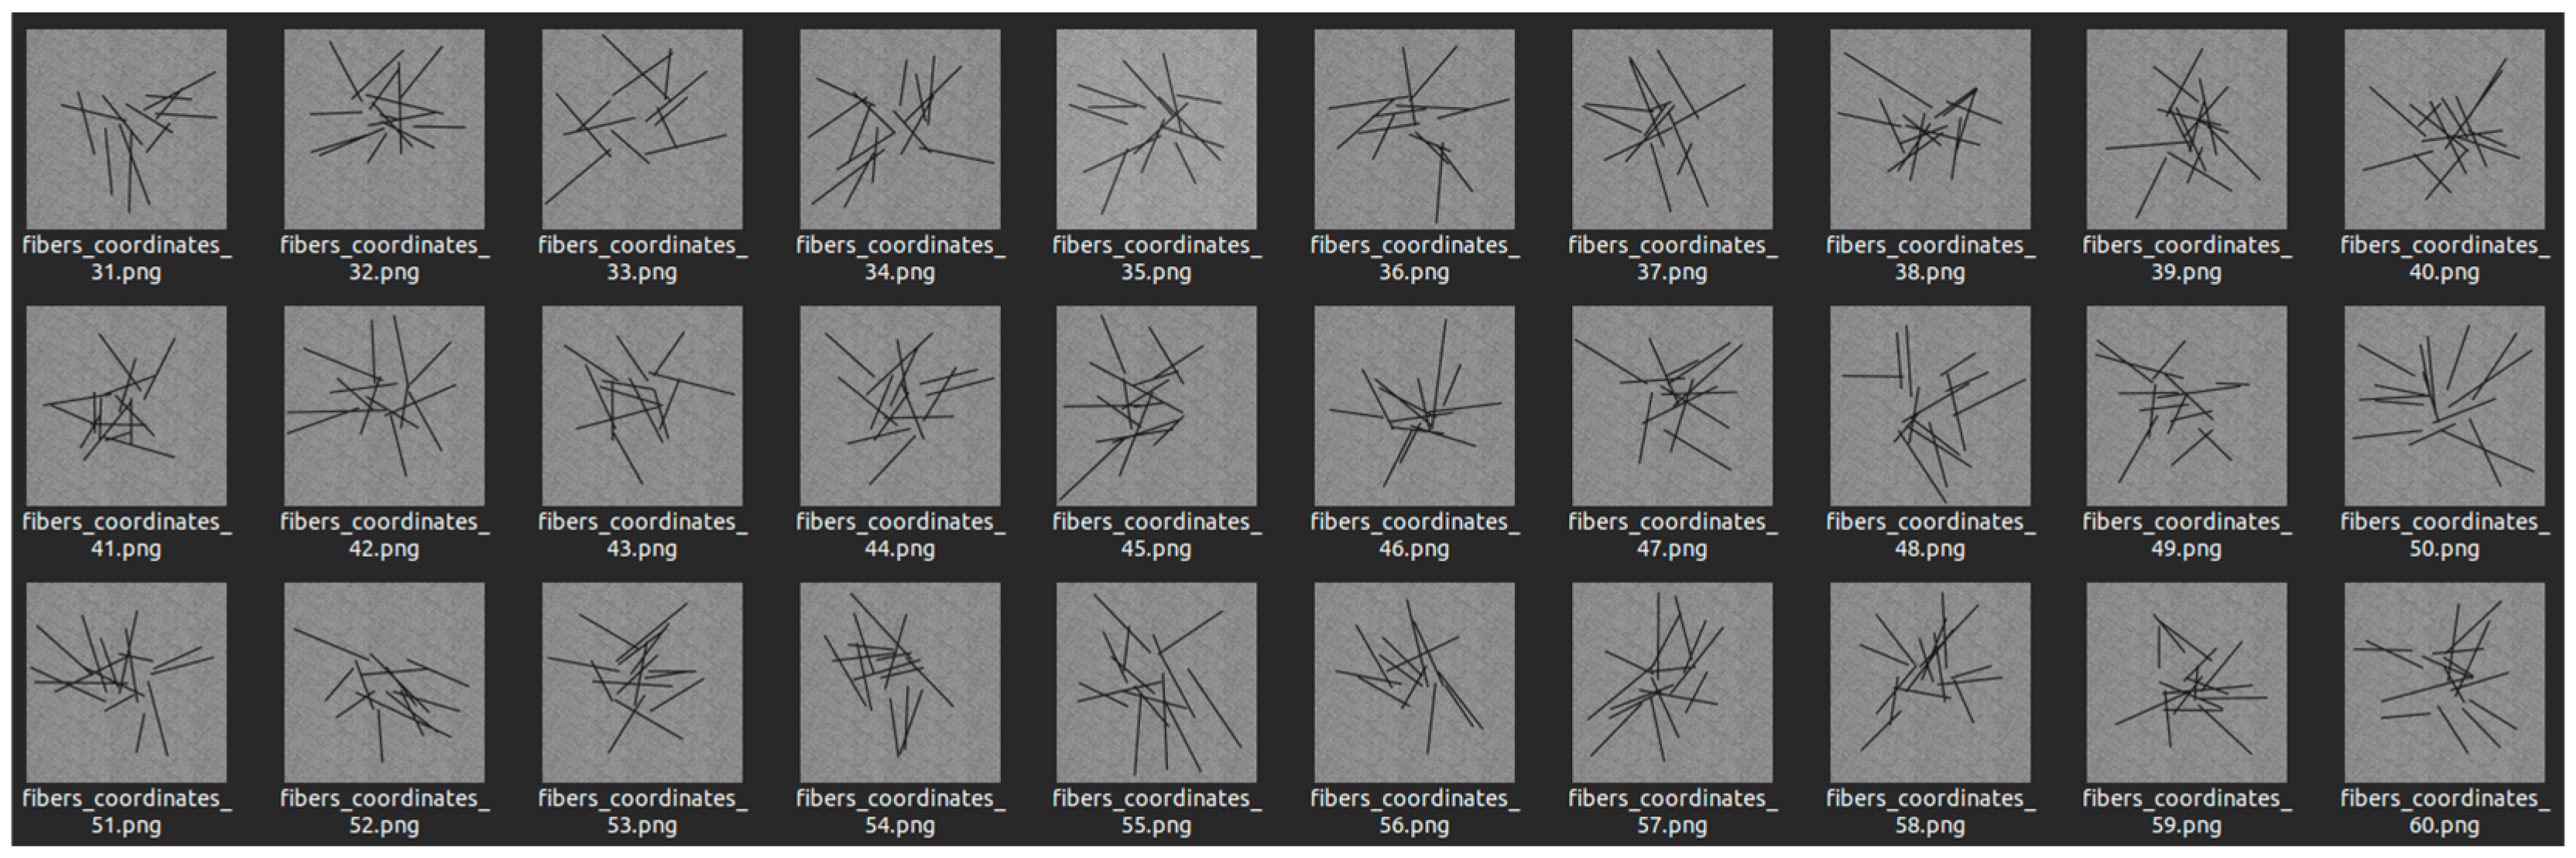
2.4. Creation of Virtual Images of Short Carbon Fibers and Labeling of Virtual Images
| Algorithm 1. Algorithm for the creation of artificial images of short carbon fibers. | |
| Input: Ncyl, Nimg, Pxsize, Llow, Lup, Lleft, Lright, lmin, lmax, Dmin, Dmax, Fjson | |
| Output: Simg, Sjson | |
| 1 | Define the XY plane as the visualization plane; |
| 2 | Set the image size Pxsize × Pxsize pixels; |
| 3 | Delimit the cylinder insertion area (Acyl) of the images with the corners (Lleft, Lup) and (Lright, Llow); |
| 4 | for i = 1 to Nimg do |
| 5 | for j = 1 to Ncyl do |
| 6 | Choose the center of the cylinder randomly delimiting the insertion area; |
| 7 | Determine the cylinder length randomly in range [lmin, lmax]; |
| 8 | Determine the cylinder diameter randomly in range [Dmin, Dmax]; |
| 9 | Randomly determine the angle of rotation with respect to the axis normal to the XY plane; |
| 10 | Randomly determine the angle of rotation with respect to an axis belonging to the XY plane and perpendicular to the longitudinal axis of the cylinder; |
| 11 | Build, position, and rotate cylinder Cj; |
| 12 | Projecting the cylinder onto the XY plane; |
| 13 | if projection ∊ Acyl then |
| 14 | Save coordinates of the projection in Fjson,i; |
| 15 | else |
| 16 | Remove cylinder Cj; |
| 17 | Determine colors of the cylinders, texture of the background and lighting of the image Ii; |
| 18 | Ii → Simg; |
| 19 | Fjson,i → Sjson; |
| 20 | return Output |
2.5. Neural Network Architectures Tested
2.6. Performance Metrics
3. Results
3.1. Database
3.2. Training and Evaluation of Neural Networks
- points_per_side = 30,
- pred_iou_thresh = 0.86,
- stability_score_thresh = 0.89,
- crop_n_layers = 1,
- crop_n_points_downscale_factor = 5,
- min_mask_region_area = 50.
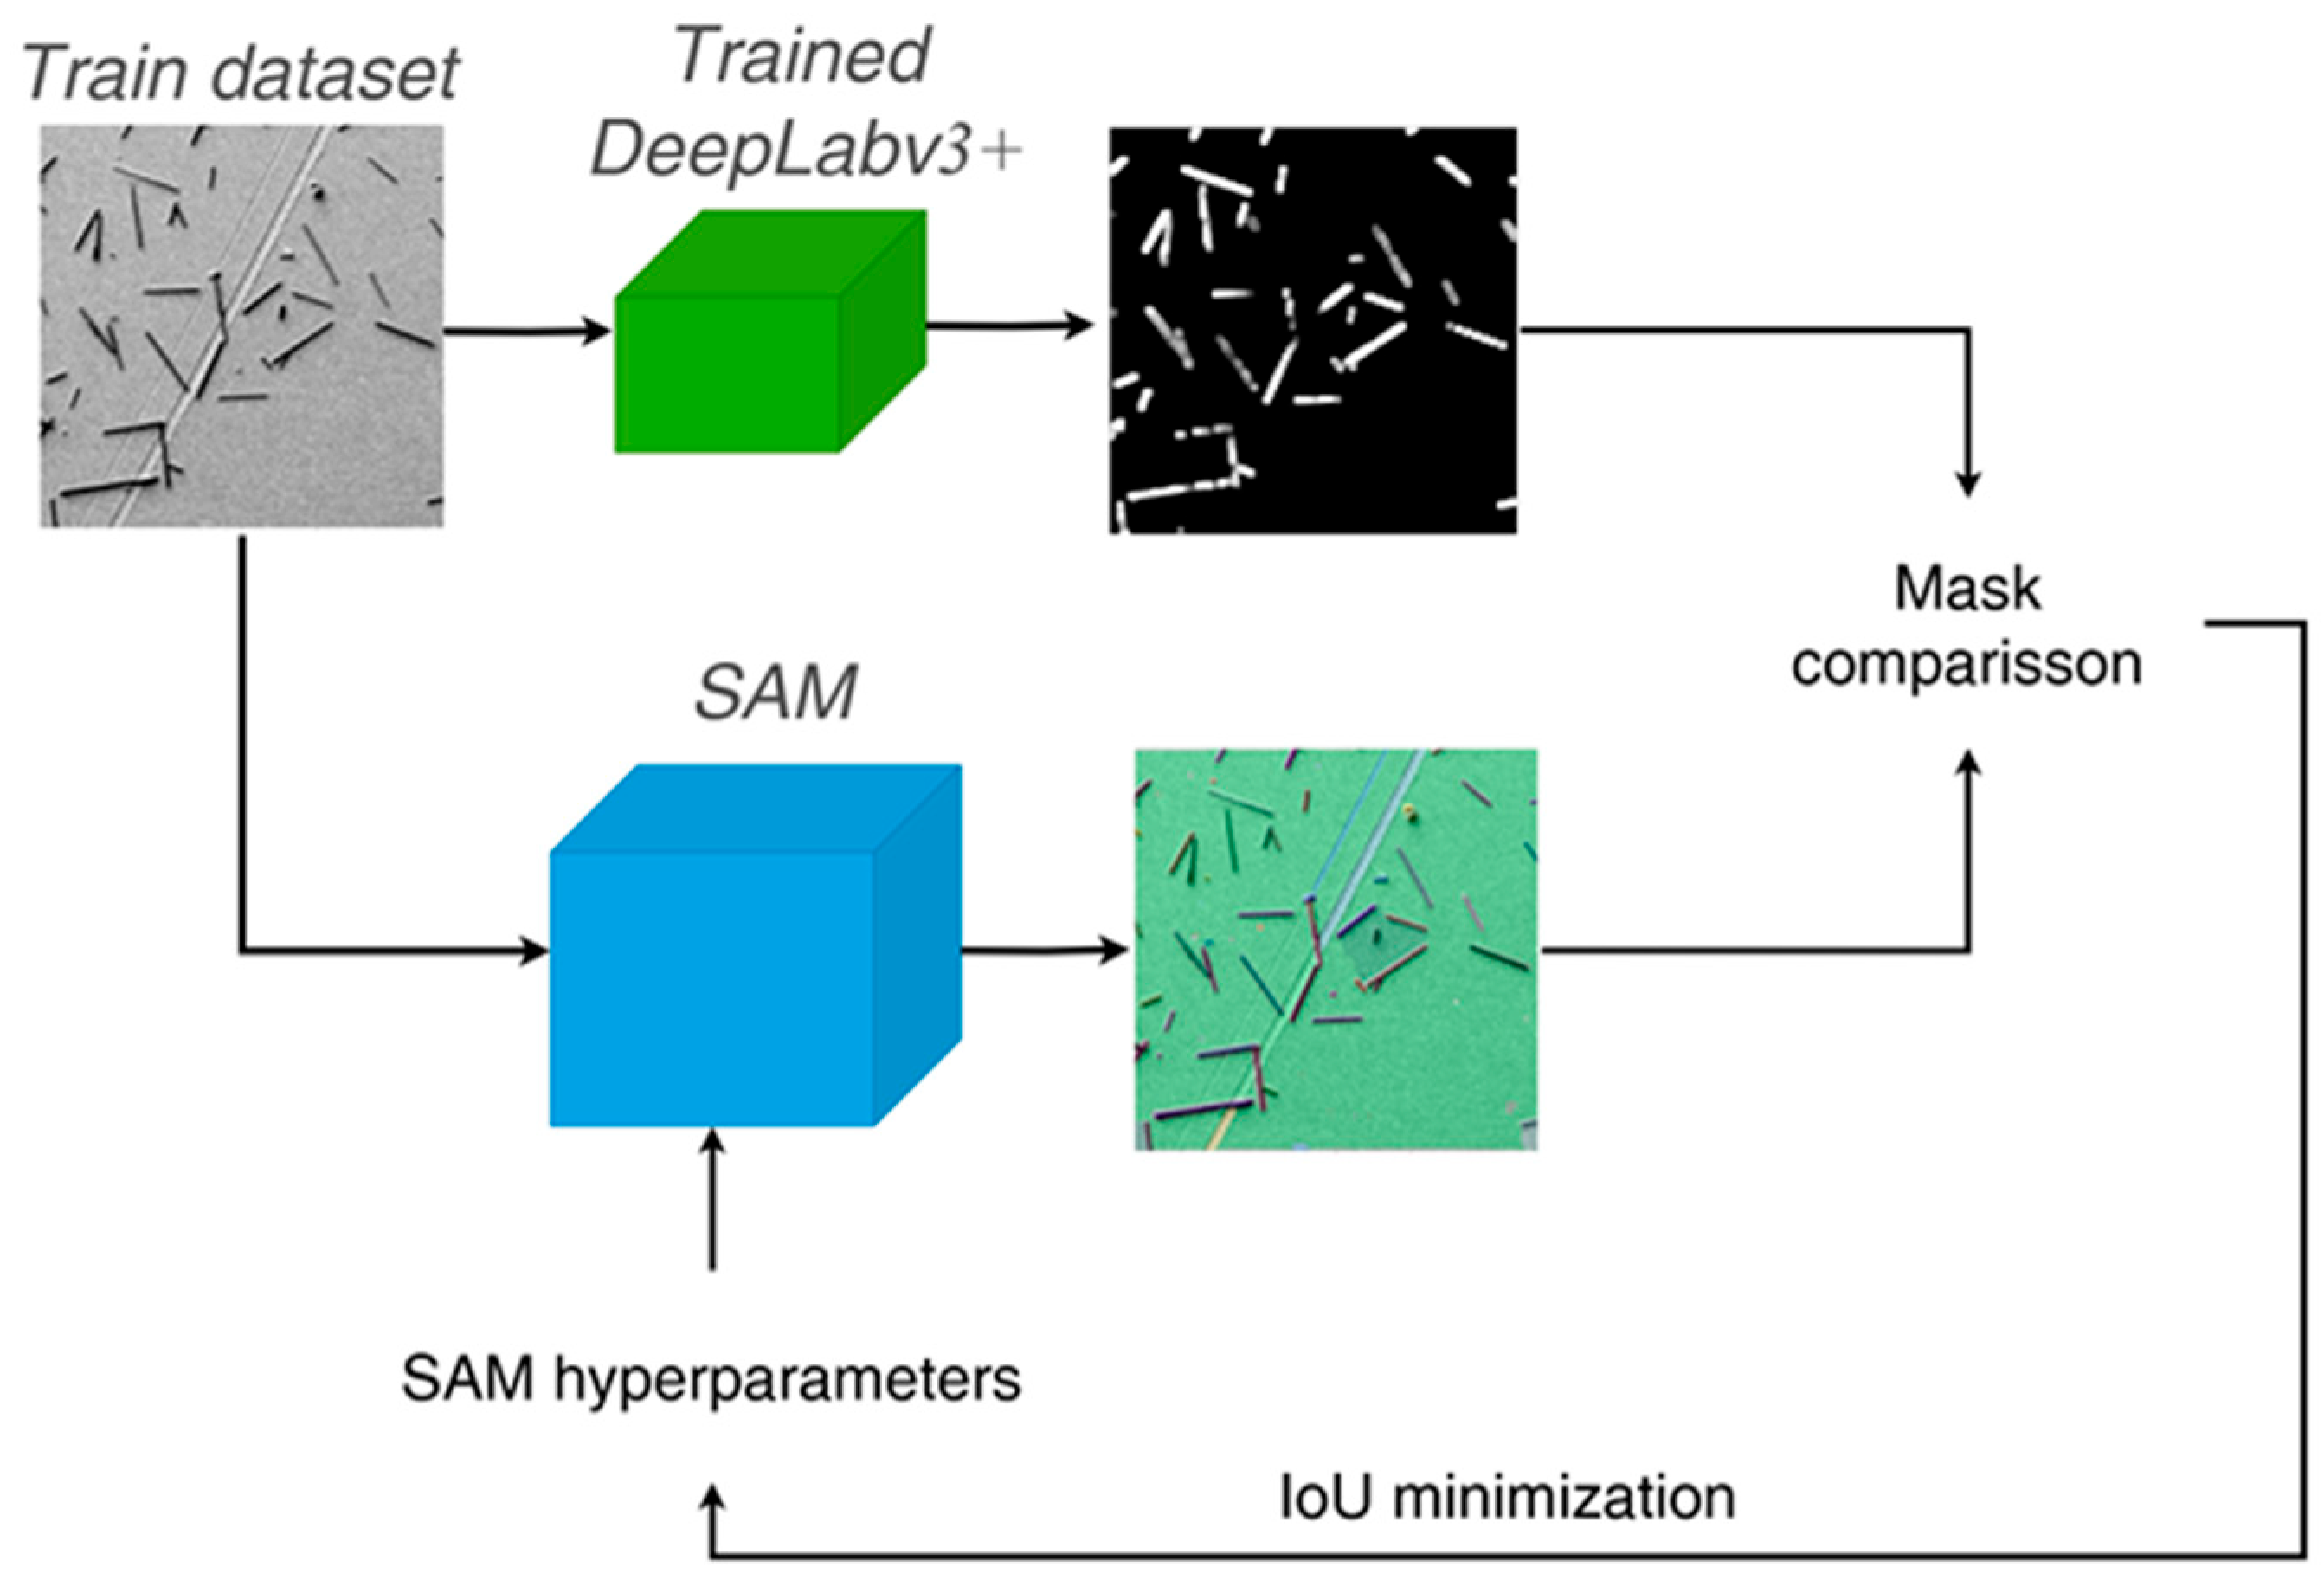
- The DeepLabv3+ model was trained.
- DeepLabv3+ and SAM image segmentation was performed in the validation sample.
- The segmentation results were compared with the IoU metric.
- The SAM parameters were changed by a table search.
- Steps 2–4 were repeated.
- The final parameters of SAM that minimize IoU were selected.
4. Conclusions
- The two-stage pipeline combining SAM and DeepLabV3+ provides the generalizability and accuracy of the foundational SAM model and the ability to quickly train on a small amount of data of the DeepLabV3+ model. The pipeline was trained several times more rapidly with lower requirements for computing resources than fine-tuning the SAM model, with a comparable inference time.
- End-to-end technology for processing images of electron microscope fibers, from images with metadata to statistics of the distribution of geometric characteristics of fibers. The result of this work is statistical data on the distribution of geometric characteristics of fibers, which are of great practical importance for modeling the physical characteristics of materials.
- A few-shot training procedure for the DeepLabV3+/SAM pipeline, combining training of the DeepLabV3+ model weights and SAM model parameters, allowed pipeline training using only 37 real labeled images. The pipeline was then adapted to a new type of fiber and background using 15 additional real labeled images.
- A method to generate synthetic data for additional training of neural networks for fiber segmentation allowed us to further improve the segmentation quality by 1%.
Author Contributions
Funding
Data Availability Statement
Acknowledgments
Conflicts of Interest
References
- Matthews, F.L.; Rawlings, R.D. Composite Materials: Engineering and Science; Woodhead Publishing Series in Composites Science and Engineering; Elsevier: Amsterdam, The Netherlands, 1999; 480p. [Google Scholar]
- Erzen, B.; Karataş, M.; Aydoğmuş, E. Research on Fiber Reinforced Composite Materials and Production Technologies. 2024. Available online: https://www.researchgate.net/publication/379120537_RESEARCH_ON_FIBER_REINFORCED_COMPOSITE_MATERIALS_AND_PRODUCTION_TECHNOLOGIES (accessed on 1 September 2024).
- Ozbakkaloglu, T.; Chen, J.-F.; Smith, S.T.; Dai, J.-G. Applications of Fiber Reinforced Polymer Composites. Int. J. Polym. Sci. 2016, 2016, 5804145. [Google Scholar] [CrossRef]
- Erden, S.; Ho, K. Fiber Reinforced Composites. 2017. Available online: https://www.researchgate.net/publication/317337444_Fiber_reinforced_composites (accessed on 1 September 2024).
- Karsli, N.G.; Aytac, A.; Deniz, V. Effects of initial fiber length and fiber length distribution on the properties of carbon-fiber-reinforced-polypropylene composites. J. Reinf. Plast. Compos. 2012, 31, 1053–1060. [Google Scholar] [CrossRef]
- Cai, H.; Ye, J.; Wang, Y.; Shi, Y.; Saafi, M. Microscopic failure characteristics and critical length of short glass fiber reinforced composites. Compos. Part B Eng. 2023, 266, 110973. [Google Scholar] [CrossRef]
- Yu, S.; Hwang, J.Y.; Hong, S.H. 3D microstructural characterization and mechanical properties determination of short basalt fiber-reinforced polyamide 6, 6 composites. Compos. Part B Eng. 2020, 187, 107839. [Google Scholar] [CrossRef]
- Ye, J.; Qiu, Y.; He, Y.; Ma, J.; Zhang, X.; Huang, C. Studying the nonlinear properties and strain-rate sensitivity of SiC short fiber-reinforced Al matrix composites. Sci. Eng. Compos. Mater. 2017, 24, 521–529. [Google Scholar] [CrossRef]
- Dean, A.; Grbic, N.; Rolfes, R.; Behrens, B. Macro-mechanical modeling and experimental validation of anisotropic, pressure- and temperature-dependent behavior of short fiber composites. Compos. Struct. 2019, 211, 630–643. [Google Scholar] [CrossRef]
- Yu, S.; Hwang, Y.H.; Lee, K.T.; Kim, S.O.; Hwang, J.Y.; Hong, S.H. Outstanding strengthening and toughening behavior of 3D-printed fiber-reinforced composites designed by biomimetic interfacial heterogeneity. Adv. Sci. 2022, 9, 2103561. [Google Scholar] [CrossRef]
- Kurkin, E.; Espinosa Barcenas, O.U.; Kishov, E.; Lukyanov, O. Topology Optimization and Efficiency Evaluation of Short-Fiber-Reinforced Composite Structures Considering Anisotropy. Computation 2024, 12, 35. [Google Scholar] [CrossRef]
- Bondy, M.; Pinter, P.; Altenhof, W. Experimental characterization and modelling of the elastic properties of direct compounded compression molded carbon fibre/polyamide 6 long fibre thermoplastic. Mater. Des. 2017, 122, 184–196. [Google Scholar] [CrossRef]
- Kelly, A.; Tyson, W.R. Tensile properties of fibre-reinforced metals: Copper/tungsten and copper/molybdenum. J. Mech. Phys. Solids 1965, 13, 329–350. [Google Scholar] [CrossRef]
- Bader, M.G.; Bowyer, W.H. An improved method of production for high strength fibre-reinforced thermoplastics. Composites 1973, 4, 150–156. [Google Scholar] [CrossRef]
- Thomason, J.L. Interfacial strength in thermoplastic composites—At last an industry friendly measurement method? Compos. Part A Appl. Sci. Manuf. 2002, 33, 1283–1288. [Google Scholar] [CrossRef]
- Jain, A.; Lomov, S.V.; Mohamed Fouad Hosni Mohamed Abdin, Y.; Van Paepegem, W.; Straesser, S.; Verpoest, I. Model for partially debonded inclusions in the framework of mean-field homogenization. In Proceedings of the 11th International Conference on Textile Composites (TexComp-11), Leuven, Belgium, 19–20 September 2013. [Google Scholar]
- Hwang, D.; Cho, D. Fiber aspect ratio effect on mechanical and thermal properties of carbon fiber/ABS composites via extrusion and long fiber thermoplastic processes. J. Ind. Eng. Chem. 2019, 80, 335–344. [Google Scholar] [CrossRef]
- Mori, T.; Tanaka, K. Average Stress in Matrix and Average Elastic Energy of Materials with Misfitting Inclusions. Acta Metall. 1973, 21, 571–574. [Google Scholar] [CrossRef]
- Gusev, A.A. Finite element estimates of viscoelastic stiffness of short glass fiber reinforced composites. Compos. Struct. 2017, 171, 53–62. [Google Scholar] [CrossRef]
- Eshelby, J.D. The determination of the elastic field of an ellipsoidal inclusion, and related problems. Proc. R. Soc. Lond. A Math. Phys. Sci. 1957, 241, 376–396. [Google Scholar]
- Advani, S.G.; Tucker, C.L., III. The use of tensors to describe and predict fiber orientation in short fiber composites. J. Rheol. 1987, 31, 751–784. [Google Scholar] [CrossRef]
- Fioravante de Siqueira, A.; Ushizima, D.M.; van der Walt, S.J. A reusable neural network pipeline for unidirectional fiber segmentation. Sci. Data 2022, 9, 32. [Google Scholar] [CrossRef]
- Zurawik, R.; Volke, J.; Zarges, J.-C.; Heim, H.-P. Comparison of Real and Simulated Fiber Orientations in Injection Molded Short Glass Fiber Reinforced Polyamide by X-ray. Microtomogr. Polym. 2022, 14, 29. [Google Scholar] [CrossRef]
- Emerson, M.J.; Jespersen, K.M.; Dahl, A.B.; Conradsen, K.; Mikkelsen, L.P. Individual fibre segmentation from 3D X-ray computed tomography for characterising the fibre orientation in unidirectional composite materials. Compos. Part A Appl. Sci. Manuf. 2017, 97, 83–92. [Google Scholar] [CrossRef]
- Mishurova, T.; Rachmatulin, N.; Fontana, P.; Oesch, T.; Bruno, G.; Radi, E.; Sevostianov, I. Evaluation of the probability density of inhomogeneous fiber orientations by computed tomography and its application to the calculation of the effective properties of a fiber-reinforced composite. Int. J. Eng. Sci. 2018, 122, 14–29. [Google Scholar] [CrossRef]
- Pinter, P.; Dietrich, S.; Bertram, B.; Kehrer, L.; Elsner, P.; Weidenmann, K.A. Comparison and error estimation of 3D fibre orientation analysis of computed tomography image data for fibre reinforced composites. NDT E Int. 2018, 95, 26–35. [Google Scholar] [CrossRef]
- Nciri, M.; Notta-Cuvier, D.; Lauro, F.; Chaari, F.; Maalej, Y.; Zouari, B. Modelling and characterisation of dynamic behaviour of short-fibre-reinforced composites. Compos. Struct. 2017, 160, 516–528. [Google Scholar] [CrossRef]
- Belmonte, E.; De Monte, M.; Riedel, T.; Quaresimin, M. Local microstructure and stress distributions at the crack initiation site in a short fiber reinforced polyamide under fatigue loading. Polym. Test. 2016, 54, 250–259. [Google Scholar] [CrossRef]
- Quijada-Pioquinto, J.G.; Kurkin, E.I.; Minaev, E.Y.; Gavrilov, A.V. Technique of the identification, quantification and measurement of carbon short-fibers in SEM images using the instance segmentation. In Proceedings of the IX International Conference on Information Technology and Nanotechnology (ITNT), Samara, Russia, 17–21 April 2023. [Google Scholar] [CrossRef]
- Lukyanov, O.E.; Kurkin, E.I.; Espinosa Barcenas, O.; Quijada Pioquinto, J. Developing a dataset for training of a convolutional neural network for the short-carbon fibers identification. In Proceedings of the 20th international Conference “Aviation and Cosmonautics” (AviaSpace-2021), Moscow, Russia, 22–26 November 2021. [Google Scholar]
- He, K.; Gkioxari, G.; Dollár, P.; Girshick, R. Mask R-CNN. In Proceedings of the IEEE International Conference on Computer Vision, Venice, Italy, 22–29 October 2017. [Google Scholar]
- Padma, E.; Ronith, D.N.V.; Sai Charan, E.V. Mask RCNN: Object detection approach using machine learning techniques. J. Eng. Sci. 2022, 13, 488–498. [Google Scholar]
- Nanni, L.; Fusaro, D.; Fantozzi, C.; Pretto, A. Improving existing segmentators performance with zero-shot segmentators. Entropy 2023, 25, 1502. [Google Scholar] [CrossRef]
- Chen, L.C.; Zhu, Y.; Papandreou, G.; Schroff, F.; Adam, H. Encoder-decoder with atrous separable convolution for semantic image segmentation. In Proceedings of the European conference on computer vision (ECCV), Munich, Germany, 8–14 September 2018. [Google Scholar]
- Wang, W.; Xie, E.; Li, X.; Fan, D.P.; Song, K.; Liang, D.; Lu, T.; Luo, P.; Shao, L. PVT v2: Improved baselines with pyramid vision transformer. Comput. Vis. Media 2022, 8, 415–424. [Google Scholar] [CrossRef]
- Kirillov, A.; Mintun, E.; Ravi, N.; Mao, H.; Rolland, C.; Gustafson, L.; Xiao, T.; Whitehead, S.; Berg, A.C.; Lo, W.Y.; et al. Segment anything. In Proceedings of the IEEE/CVF International Conference on Computer Vision, Paris, France, 2–6 October 2023. [Google Scholar]
- Zou, X.; Yang, J.; Zhang, H.; Li, F.; Li, L.; Wang, J.; Gao, J.; Lee, Y.J. Segment Everything Everywhere All at Once. In Advances in Neural Information Processing Systems 36 (NeurIPS 2023), New Orleans, FL, USA, 10–16 December 2023. 2024. Available online: https://proceedings.neurips.cc/paper_files/paper/2023/file/3ef61f7e4afacf9a2c5b71c726172b86-Paper-Conference.pdf (accessed on 1 September 2024).
- Liu, R.; He, D. Semantic segmentation based on Deeplabv3+ and attention mechanism. In Proceedings of the 2021 IEEE 4th Advanced Information Management, Communicates, Electronic and Automation Control Conference (IMCEC), Chongqing, China, 18–20 July 2021. [Google Scholar]
- Luo, H.; Lu, Y. DeepLabv3-SAM: A novel image segmentation method for rail transportation. In Proceedings of the 2023 3rd International Conference on Electronic Information Engineering and Computer Communication (EIECC), Wuhan, China, 22–24 December 2023. [Google Scholar]
- Xie, W.; Willems, N.; Patil, S.; Li, Y.; Kumar, M. Sam fewshot finetuning for anatomical segmentation in medical images. In Proceedings of the IEEE/CVF Winter Conference on Applications of Computer Vision, Waikoloa, HI, USA, 3–8 January 2024; pp. 3253–3261. [Google Scholar]
- Illingworth, J.; Kittler, J. A survey of the Hough transform. Comput. Vis. Graph. Image Process. 1988, 44, 87–116. [Google Scholar] [CrossRef]
- Kurkin, E.; Spirina, M.; Espinosa Barcenas, O.U.; Kurkina, E. Calibration of the PA6 Short-Fiber Reinforced Material Model for 10% to 30% Carbon Mass Fraction Mechanical Characteristic Prediction. Polymers 2022, 14, 1781. [Google Scholar] [CrossRef]
- Wada, K.; Buijs, M.; Kubovčík, M.; Myczko, A.; Zhu, L.; Yamaguchi, N.; Clauss, C.; Kuroiwa, E.; Iyengar, R.; Shilin, S.; et al. Labelme: Image Polygonal Annotation with Python [Computer Software]. 2021. Available online: https://zenodo.org/records/5711226 (accessed on 1 September 2024).
- Ravi, N.; Gabeur, V.; Hu, Y.T.; Hu, R.; Ryali, C.; Ma, T.; Khedr, H.; Rädle, R.; Rolland, C.; Gustafson, L.; et al. Sam 2: Segment anything in images and videos. arXiv 2024, arXiv:2408.00714. [Google Scholar]
- Rahman, M.A.; Wang, Y. Optimizing intersection-over-union in deep neural networks for image segmentation. In International Symposium on Visual Computing; Springer: Cham, Switzerland, 2016. [Google Scholar]
- Nawaz, M.; Uvaliyev, A.; Bibi, K.; Wei, H.; Abaxi, S.M.D.; Masood, A.; Yuan, W. Unravelling the complexity of Optical Coherence Tomography image segmentation using machine and deep learning techniques: A review. Comput. Med. Imaging Graph. 2023, 108, 102269. [Google Scholar] [CrossRef] [PubMed]

| Method | IoU | PixAcc |
|---|---|---|
| DeepLabv3+ (RID) | 0.943 | 0.949 |
| DeepLabv3+ (AID) | 0.851 | 0.854 |
| DeepLabv3+ (HID) | 0.953 | 0.959 |
| Method | Test Data | IoU | PixAcc |
|---|---|---|---|
| DeepLabv3+ (HID) | Carbon fibers | 0.953 | 0.959 |
| DeepLabv3+ (HID + GF) | Carbon fibers | 0.958 | 0.963 |
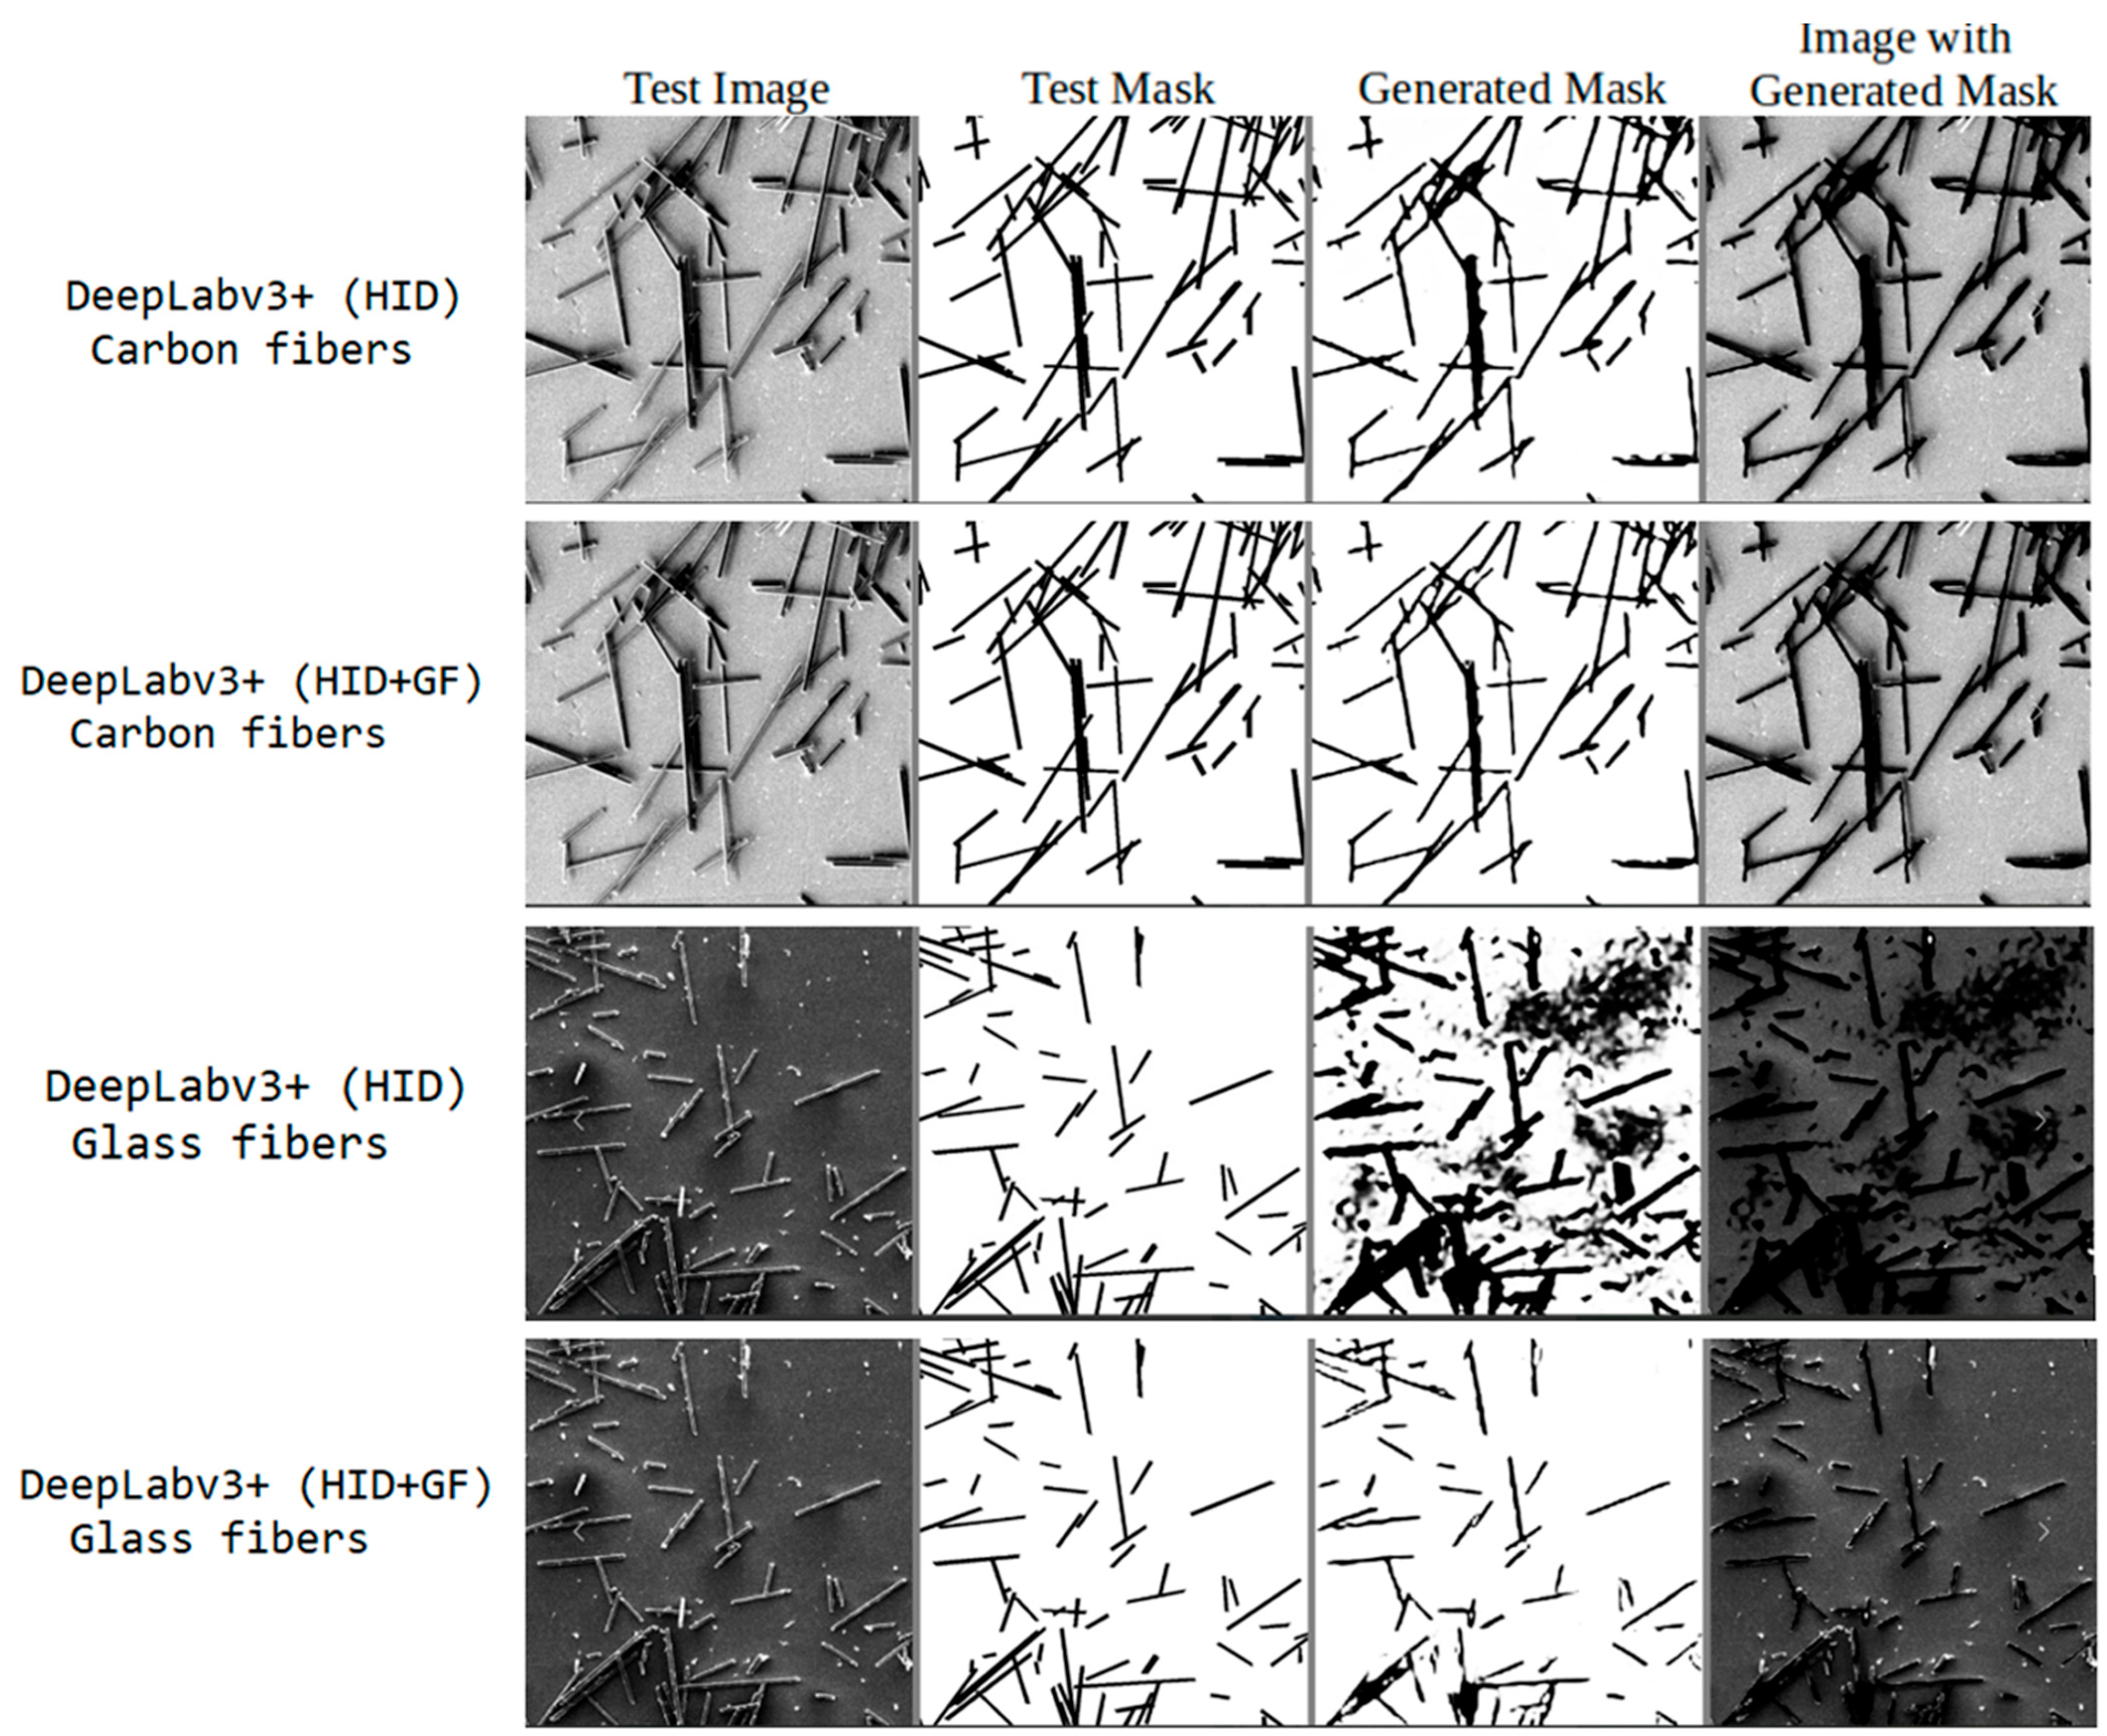
| DeepLabv3+ (HID) | Glass fibers | 0.734 | 0.757 |
| DeepLabv3+ (HID + GF) | Glass fibers | 0.960 | 0.963 |
| DeepLabv3+ (HID) | All | 0.883 | 0.892 |
| DeepLabv3+ (HID + GF) | All | 0.959 | 0.963 |
| Architecture | IoU | Pix Acc |
|---|---|---|
| DeepLabv3+/Hough | 0.915 | 0.911 |
| SAM | 0.873 | 0.877 |
| DeepLabv3+/SAM | 0.953 | 0.959 |
| Mask R-CNN | 0.723 | 0.724 |
| SAM2 | 0.877 | 0.879 |
| Architecture | Training Time (min) | Inference Time (ms) | GPU/CPU |
|---|---|---|---|
| DeepLabv3+/Hough | ~20 | 127 | RTX 4090/Ryzen 9 |
| SAM (fine-tuning [38]) | ~180 | ~900 | 4 NVIDIA Tesla K80 GPUs, 24 CPU cores |
| DeepLabv3+/SAM | ~30 | 951 | RTX 4090/Ryzen 9 |
| DeepLabv3+ | ~20 | 51 | RTX 4090/Ryzen 9 |
Disclaimer/Publisher’s Note: The statements, opinions and data contained in all publications are solely those of the individual author(s) and contributor(s) and not of MDPI and/or the editor(s). MDPI and/or the editor(s) disclaim responsibility for any injury to people or property resulting from any ideas, methods, instructions or products referred to in the content. |
© 2024 by the authors. Licensee MDPI, Basel, Switzerland. This article is an open access article distributed under the terms and conditions of the Creative Commons Attribution (CC BY) license (https://creativecommons.org/licenses/by/4.0/).
Share and Cite
Kurkin, E.; Minaev, E.; Sedelnikov, A.; Pioquinto, J.G.Q.; Chertykovtseva, V.; Gavrilov, A. Computer Vision Technology for Short Fiber Segmentation and Measurement in Scanning Electron Microscopy Images. Technologies 2024, 12, 249. https://doi.org/10.3390/technologies12120249
Kurkin E, Minaev E, Sedelnikov A, Pioquinto JGQ, Chertykovtseva V, Gavrilov A. Computer Vision Technology for Short Fiber Segmentation and Measurement in Scanning Electron Microscopy Images. Technologies. 2024; 12(12):249. https://doi.org/10.3390/technologies12120249
Chicago/Turabian StyleKurkin, Evgenii, Evgenii Minaev, Andrey Sedelnikov, Jose Gabriel Quijada Pioquinto, Vladislava Chertykovtseva, and Andrey Gavrilov. 2024. "Computer Vision Technology for Short Fiber Segmentation and Measurement in Scanning Electron Microscopy Images" Technologies 12, no. 12: 249. https://doi.org/10.3390/technologies12120249
APA StyleKurkin, E., Minaev, E., Sedelnikov, A., Pioquinto, J. G. Q., Chertykovtseva, V., & Gavrilov, A. (2024). Computer Vision Technology for Short Fiber Segmentation and Measurement in Scanning Electron Microscopy Images. Technologies, 12(12), 249. https://doi.org/10.3390/technologies12120249