Article

Field Ion Microscopy of Tungsten Nano-Tips Coated with Thin Layer of Epoxy Resin

1
Institute of Physics of Materials, Czech Academy of Sciences, Žižkova 22, 61662 Brno, Czech Republic
2
Department of Physics, Faculty of Electrical Engineering and Communication, Brno University of Technology, 61600 Brno, Czech Republic
3
Institute of Scientific Instruments of Czech Academy of Sciences, Kralovopolska 147, 61264 Brno, Czech Republic
4
Department of Physics, Faculty of Science, The Hashemite University, P.O. Box 330127, Zarqa 13133, Jordan
5
Department of Renewable Energy Engineering, Jadara University, Irbid 21110, Jordan
*
Authors to whom correspondence should be addressed.
Technologies 2024, 12(10), 193; https://doi.org/10.3390/technologies12100193
Submission received: 5 August 2024 / Revised: 26 September 2024 / Accepted: 3 October 2024 / Published: 9 October 2024
(This article belongs to the Section Manufacturing Technology)

Abstract

:
This paper presents an analysis of the field ion emission mechanism of tungsten–epoxy nanocomposite emitters and compares their performance with that of tungsten nano-field emitters. The emission mechanism is described using the theory of induced conductive channels. Tungsten emitters with a radius of 70 nm were fabricated using electrochemical polishing and coated with a 20 nm epoxy resin layer. Characterization of the emitters, both before and after coating, was performed using electron microscopy and energy-dispersive X-ray spectroscopy (EDS). The Tungsten nanocomposite emitter was tested using a field ion microscope (FIM) in the voltage range of 0–15 kV. The FIM analyses revealed differences in the emission ion density distributions between the uncoated and coated emitters. The uncoated tungsten tips exhibited the expected crystalline surface atomic distribution in the FIM images, whereas the coated emitters displayed randomly distributed emission spots, indicating the formation of induced conductive channels within the resin layer. The atom probe results are consistent with the FIM findings, suggesting that the formation of conductive channels is more likely to occur in areas where the resin surface is irregular and exhibits protrusions. These findings highlight the distinct emission mechanisms of both emitter types.

1. Introduction

The term “field emission” refers to both the electron and ion emission mechanisms. Based on Fermi–Dirac statistics, field emission theory was developed in the 1920s and the 1930s as a major application of quantum mechanical tunneling and free-electron theories of condensed matter [1,2,3,4]. Cold-field electron emission occurs when electrons transition through a reduced potential energy barrier from the surface of a micro/nano-pointed emitter (tip) into a vacuum. According to the Fowler–Nordheim theory, when two electrodes (typically separated by a small distance of no more than 10 mm), with one being a micro/nano-pointed emitter, are subjected to an intense electric field (usually around 3 V/nm), electrons can quantum-tunnel through a triangular potential energy barrier from energy levels near the Fermi level of the material used [1,2,3,4]. Nanocomposite cold-field emitters are very important in many scientific applications, such as scanning electron microscopy, atomic force microscopy, and electron probe microanalysis [5,6,7,8,9].
In the FIM, the system is filled with a low-pressure gas (such as helium or neon), with the nano-tip acting as the anode. The gas atoms near the apex of the tip become ionized as their electrons tunnel through a reduced potential energy barrier, resulting in positively charged ions (e.g., N e + ). These ions are accelerated by the extraction electric field toward the cathode, which is typically an imaging screen (often fluorescent). The emitted photons create a field ion microscope (FIM) pattern, displaying a magnified image of the surface atomic distribution corresponding to the ion emission from the tip surface [10,11,12]. Field ion emitters are widely used in applications such as scanning ion microscopy, owing to their favorable emission properties and straightforward operation [13,14].
In the case of the FIM, the system is usually filled with gas at low pressure (such as He or Ne). The nano-tip was set as the anode, allowing the used gas atoms to be ionized near the apex surface. Electrons from the gas atoms can tunnel through the reduced potential energy barrier, providing positively charged ions (such as N e + ). These ions are then accelerated within the extraction electric field applied to the cathode, which is an imaging screen (usually a fluorescent screen). The observed photons form what is known as the FIM pattern, which describes the ion emission distribution (a magnified image of the surface atomic distribution) as emitted from the surface of the tip [10,12,15]. Field ion emitters are particularly attractive sources of ion beams. Owing to their suitable emission properties and simple operating principle, these types of emitters have been used in several applications such as scanning ion microscopy [13,14].
In the field of electron emission, a substantial body of the literature has studied the effects of epoxy coatings on emission patterns. Al Soud et al. [16] investigated electron emissions from composite emitters, and the results obtained from field emission microscopy (FEM) experiments showed unusual and intriguing behavior. Notably, the emitted current was exceptionally high at elevated values, with the emission process starting abruptly in the range of a few μA. Additionally, the corresponding current–voltage characteristics exhibited a lower threshold voltage. Panda et al. [17] investigated the effect of implanting silver (Ag) ions into ultra-nanocrystalline diamond (UNCD) films to enhance the electron field emission properties, achieving a low operating field of 8.5 V/μm and a high electron current density of 6.2 mA/cm2 at an applied field of 20.5 V/μm. Li et al. [18] reported a different behavior in the emission pattern observed in field emission electron microscopy, where the emitted current density displayed a more concentrated and brighter pattern compared to uncoated emitters. Ji et al. [19] proposed a self-compensating electron emission mechanism for bulk graphene to explain its improved field emission performance.
Moreover, to explain the mechanism of electron emission from nanocomposite emitters, Latham and Mousa [2] proposed a model in 1986 for hot electron emissions and the formation of conductive crystal channels within a dielectric coating. More recently, in 2023, Knápek et al. [20] introduced a new model to explain the behavior of composite emitters. This model treats composite emitters as capacitors, in which the switching phenomenon is viewed as a post-collapse discharge effect in the dielectric layer. Abuamr et al. [21] studied the effect of traps produced by the oxide layer on the emission current.
In the field of FIM, several studies have explored the effects of polymers on ion emission. Moussa et al. [22] reported findings from composite emitters showing randomly distributed locations of intense and bright spots within the FIM pattern. Velikodnaya et al. [23] presented a multi-emitter ion source based on a carbon nanomaterial consisting of a tungsten dot with a sphere of aluminum-filled epoxy resin composite formed at the tip. In addition, Oberdorfer et al. [24] introduced a computer model to simulate field evaporation by focusing on dielectric materials. Starting with a known sample structure, the simulation replicated evaporation and volumetric reconstruction from the data, similar to real measurements, and identified and quantified artifacts arising from the procedure. Other studies have explored the application of composite emitters in helium-ion microscopy [25].
The aim of this work is to investigate the multi-switch-on behavior observed during the testing of tungsten–epoxy nanocomposite emitters in FIM. The FIM and atom probe topography (APT) results offer additional evidence for the formation of induced tunneling conductive channels, similar to those observed in composite emitters during cold-field emission.

2. Sample Preparation

Tungsten (W) is one of the materials frequently used for manufacturing field emitter tips [26] because of its favorable properties, including a high melting point of 3414 °C, high stiffness, strength, density, and chemical stability, along with the lowest vapor pressure at 1650 °C [27]. In addition, tungsten allows for the simple preparation of micro/nano-tip emitters using an electrolytic polishing technique for cathode production [1,28]. In this experiment, high-purity (99.99%) polycrystalline tungsten wires with a diameter of 0.1 mm and a work function value of 4.66 eV were used [29], provided by Goodfellow Cambridge Ltd. (Huntingdon, UK). The W tip was prepared via electrolytic etching. The process involved placing a straight tungsten wire, 1 cm in length and 0.1 mm in diameter, into a copper tube measuring 0.5 cm in length and 0.4 mm in diameter. The samples were attached as the anode in a specialized instrument with the cathode set as a nickel plate. This setup produces field emission nano-tips with an apex radius of approximately 20 nm using the drop-off method of the electrochemical polishing technique. A 5 M solution of sodium hydroxide (NaOH) was used as the etchant, which was most effective after being left for 4–7 h to allow the NaOH particles to fully dissolve and the solution to cool down. To begin the polishing process, approximately 10 mL of the solution was placed in a special plastic container within the instrument, where the two electrodes were immersed in NaOH solution. The setup was connected to a power supply that provided a polishing AC voltage of 20 V. As the tungsten wire began to corrode, the applied AC voltage was gradually reduced until it reached 2 V. This step is crucial because the timing of the etching circuit cutoff significantly affects the sharpness of the tip generated. The prepared samples were thoroughly cleaned to remove any residual hydroxide solution from the tip surface. The prepared samples were cleaned to remove any residual hydroxide solution from the tip surface. The cleaning process involved immersing the polished samples in alcohol, followed by a 20-min ultrasonic bath in distilled water. The etching procedure used in this experiment met the diameter requirement for the FIM experiments, as the radius of the FIM tip should not be lower than 100 nm. This procedure produces field emission tips with radii of approximately 20 nm before coating. The prepared tips had a radius of curvature of 70 nm. Figure 1 illustrates the electrochemical etching device and etching steps. When the tip detaches, the resistance in the etching circuit suddenly increases, prompting the AC voltage source to quickly switch off. The timing of this shutdown is critical for the sharpness of the tip. Subsequently, the tungsten wire was carefully removed from the solution and immediately cleaned by dipping it in alcohol and distilled water for a few seconds, followed by a 10-min ultrasonic bath.
For the coating layer, we used a single-component epoxy resin branded as “Epoxylite 478 (E-478)”, produced by Elantas Europe. The electrical properties of E478 were previously reported, with a local work function value of 3.42 eV, an energy gap of 3.94 eV, and an electron affinity of 2.16 eV [29]. To apply the coating layers on the tip surface, the NaOH solution container was replaced with an epoxy resin container. The coating process involves controlled tip dipping and generally consists of two main steps. The first step involved immersing the cleaned tip slowly and perpendicularly into the epoxy resin. Repeating this step creates thicker coating layers, as each dip results in a coating layer 20 nm in thickness. The second step involved heating the coated tips in a vacuum furnace for 5 h at 423 K (Memmert UN 55; Büchbach, Germany). This step was crucial for expelling the solvent and curing the epoxy resin on the surface of the coated tip. Achieving defined immersion and precise perpendicularity during the coating (and etching) processes is very important. Therefore, the etching device was connected to a digital visible light microscope to closely monitor the etching/coating process. This combination is recommended for a more controllable and precise etching and coating procedure.

3. Methodology

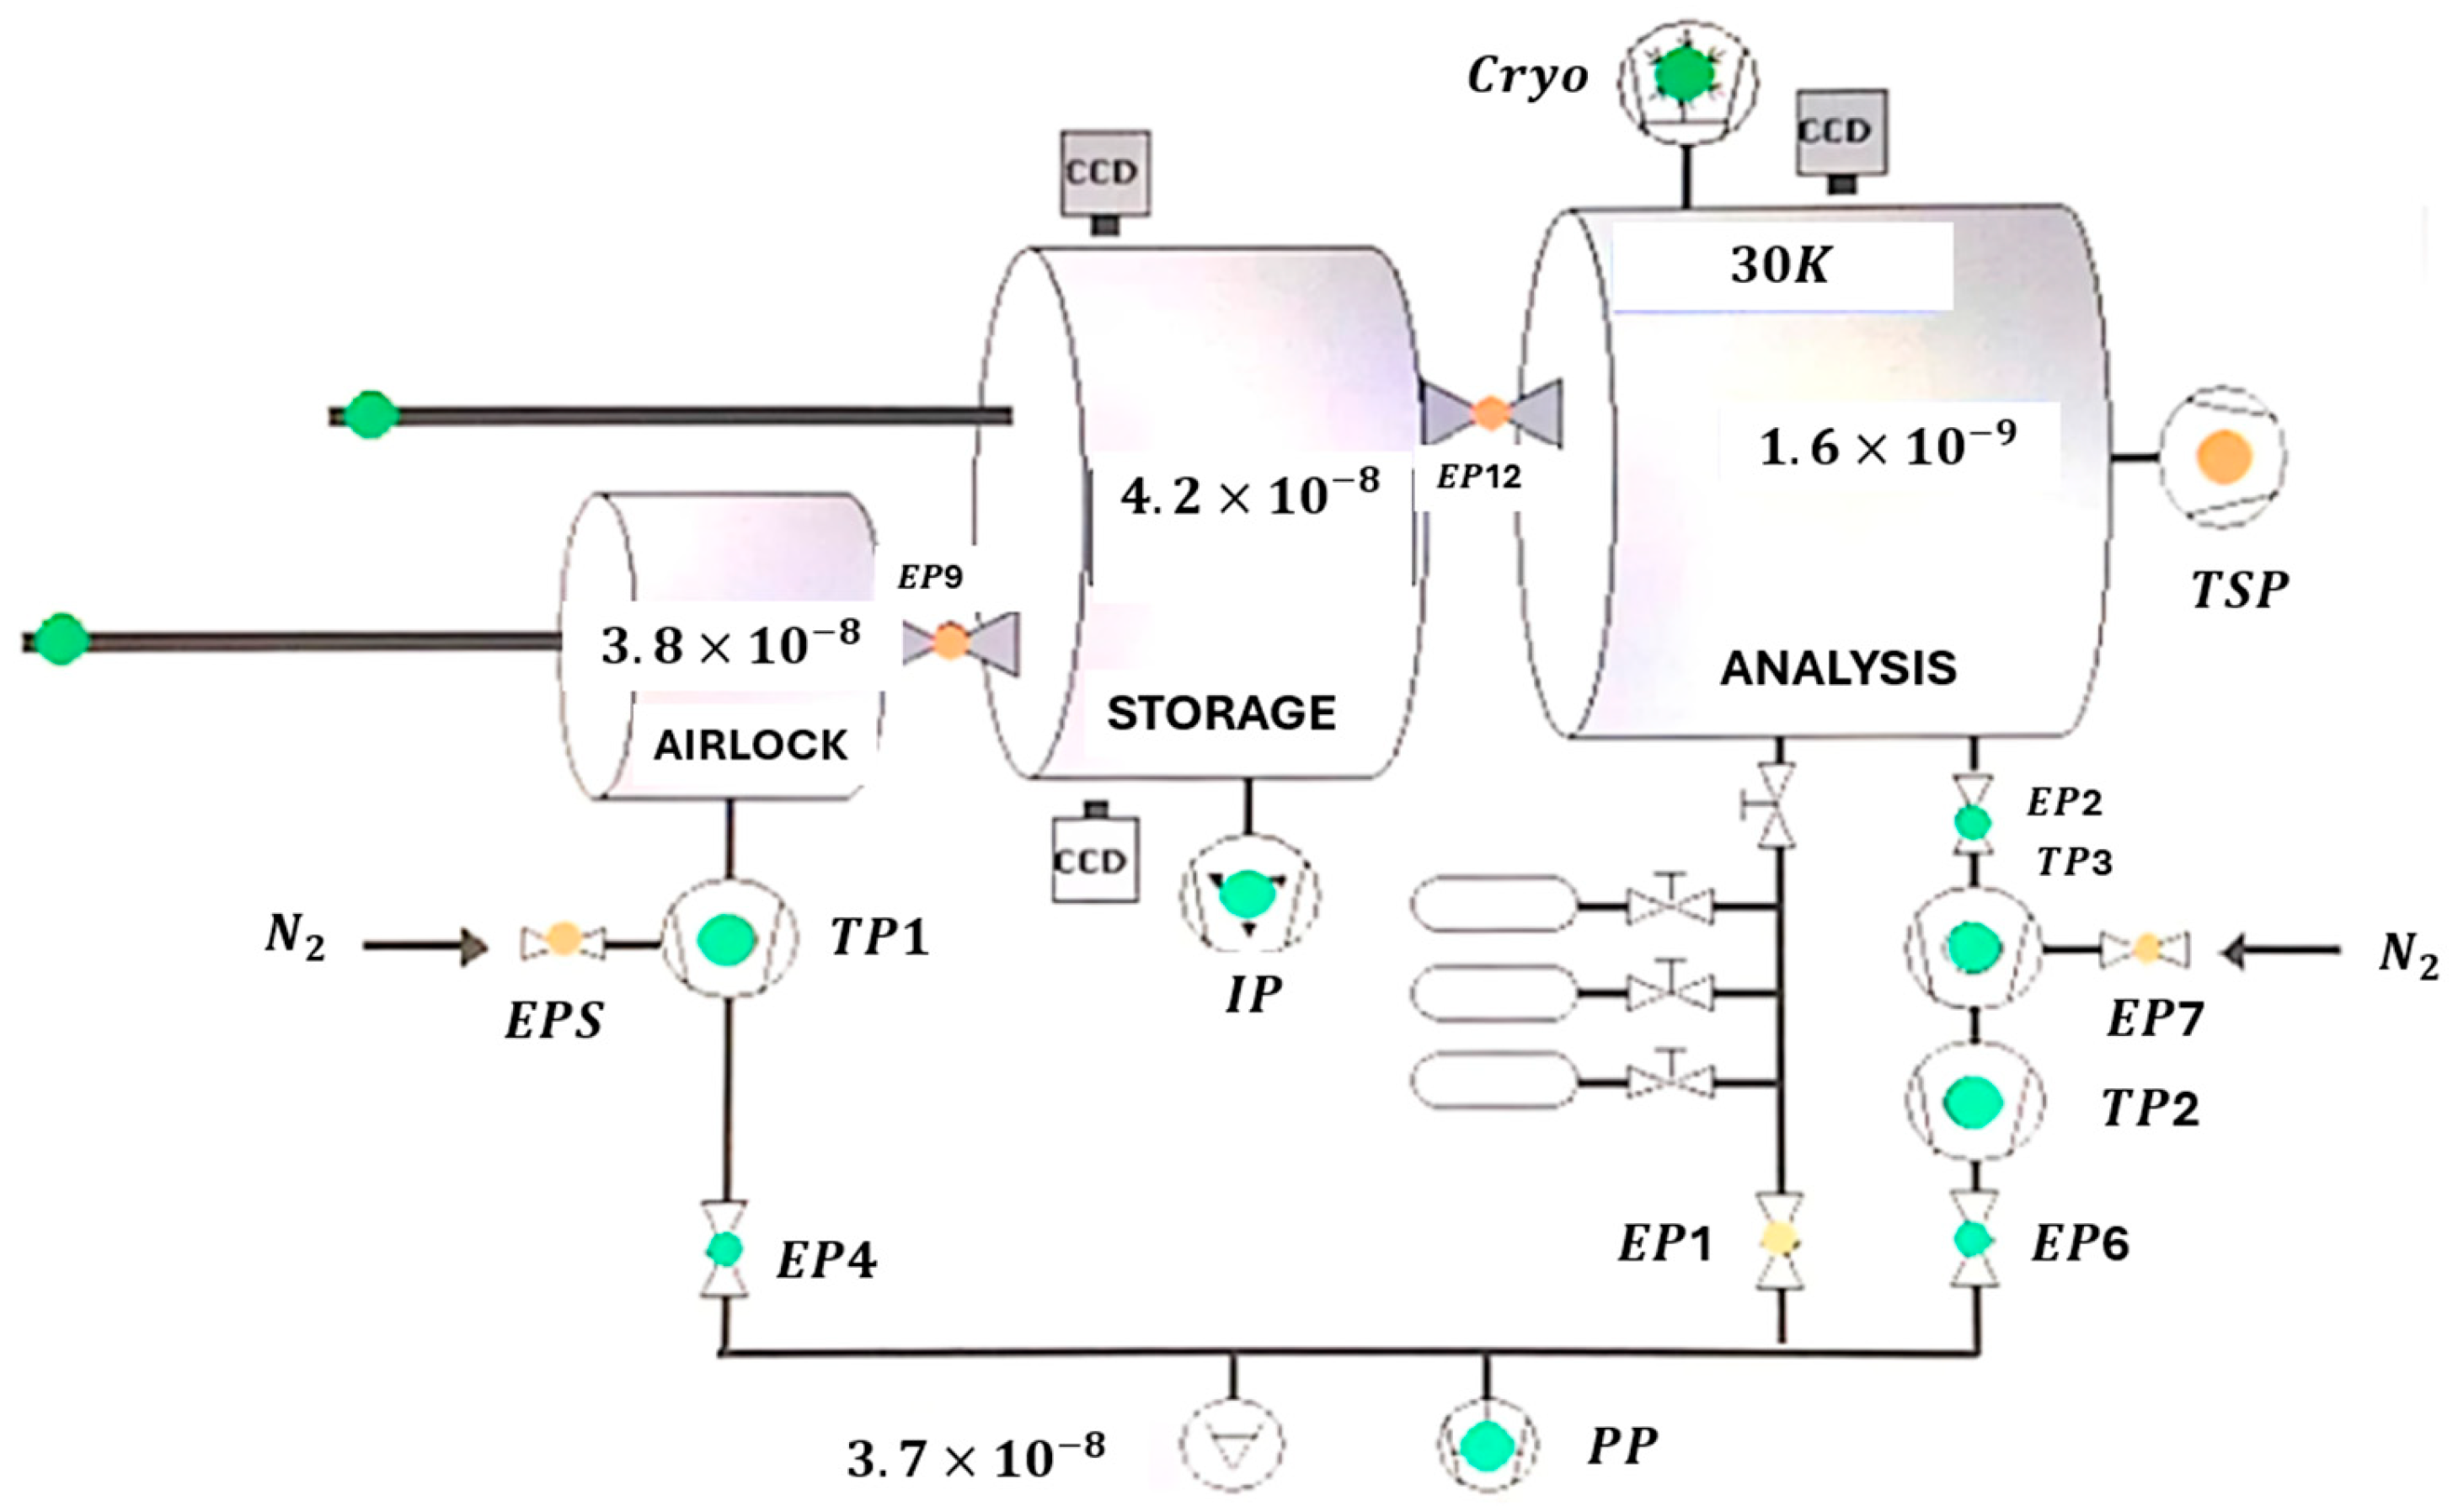
The tested emitters were used as standard FIM ion sources. The separation distance between the sample and FIM imaging screen was set to 10 mm. The samples were installed inside a laser-assisted wide-angle tomographic atom probe (LaWaTAP) developed by Cameca (Gennevillier, France). In this experiment, neon (Ne) gas was utilized as the imaging gas for FIM investigations. In this configuration, the cathode was a phosphorescent screen, and the anode was used as the sample. Consequently, Ne ions were generated near the apex surface of the samples under the influence of a strong electric field, and these ions were projected towards the phosphorescent screen [30,31]. The phosphorescent screen was made from transparent glass coated with a thin layer of tin oxide, which was subsequently covered by a layer of phosphorus to interact with the incident ions and record the ion emission microscopy patterns. The system temperature must be maintained at very low levels, ranging from 30 to 90 K, to reduce the surface diffusion of the sample atoms and improve the control of the field evaporation process. The FIM experiments were conducted under ultra-high-vacuum conditions, where the background chamber pressure was kept below 10 9 Pa, and the pressure of the Ne imaging gas was set to 10 5 Pa [32,33]. Figure 2 illustrates the LAWATP system.

4. Characterization

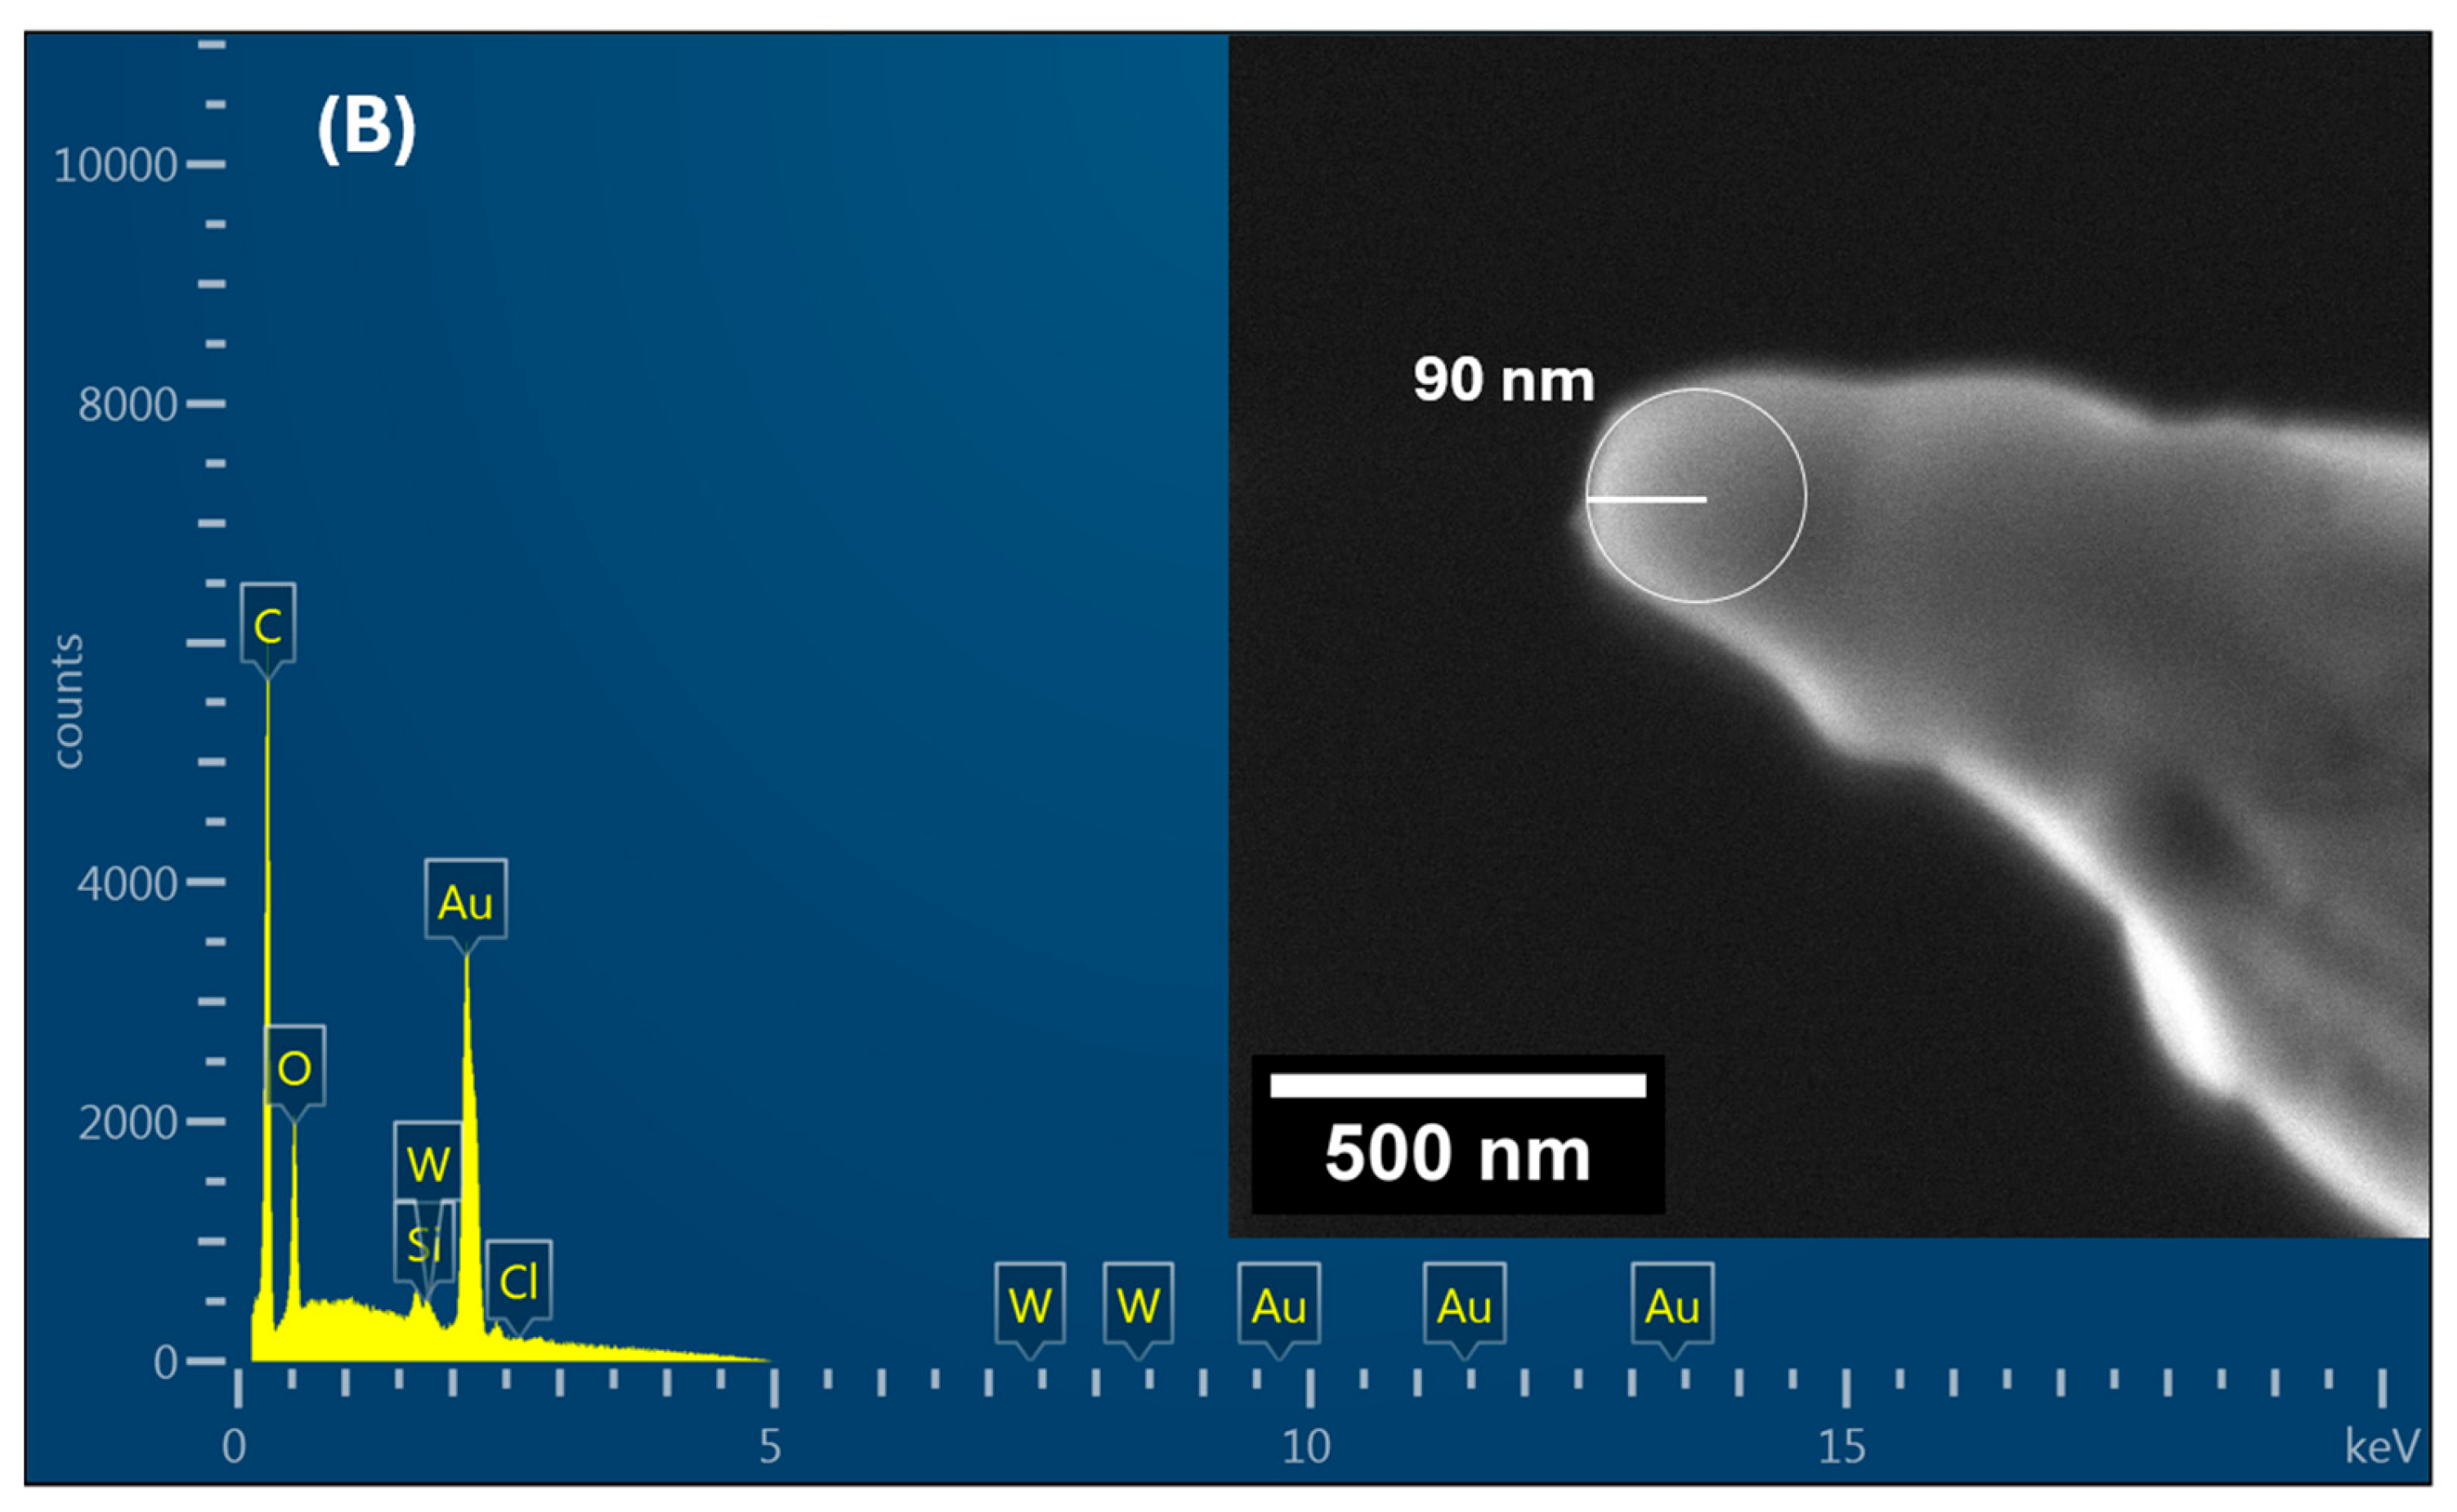
In this study, the purity times of the uncoated tungsten nanocomposite emitter and W nanocomposite emitter were studied to determine the composition of the coating material using scanning electron microscopy with energy-dispersive spectroscopy (MIRA-TESCAN, Czech Republic). Figure 3 shows an SEM micrograph with EDS of nanocomposite emitter W and nanocomposite W. A secondary electron detector with a primary electron beam energy of 5 keV was used to obtain the SEM micrographs. The radius of the uncoated W nano-emitter was approximately 70 nm, whereas that of the nanocomposite W nano-emitter was approximately 90 nm. The thickness of the epoxy layer was ~20 nm. Figure 3 shows the EDS results for a point on the tips of both the W nanocomposite emitter and W nanocomposite emitter. As shown in Figure 3A, tungsten predominated, indicating the effectiveness of the cleaning process during fabrication. The EDS analysis in Figure 3B reveals that the epoxy components consisted of carbon, oxygen, and chlorine. Gold was used as the coating material for the SEM-EDS measurements.

5. Results and Discussion

5.1. FIM Results

The structure of the FIM patterns for uncoated tungsten samples is well known [34,35]. For the sample discussed in this article, a high-resolution FIM image revealing the atomic structure was obtained at 7.5 kV, as shown in Figure 4. The image shows the surface atomic distribution, highlighting the different facets of polycrystalline tungsten at the center of the field of view.
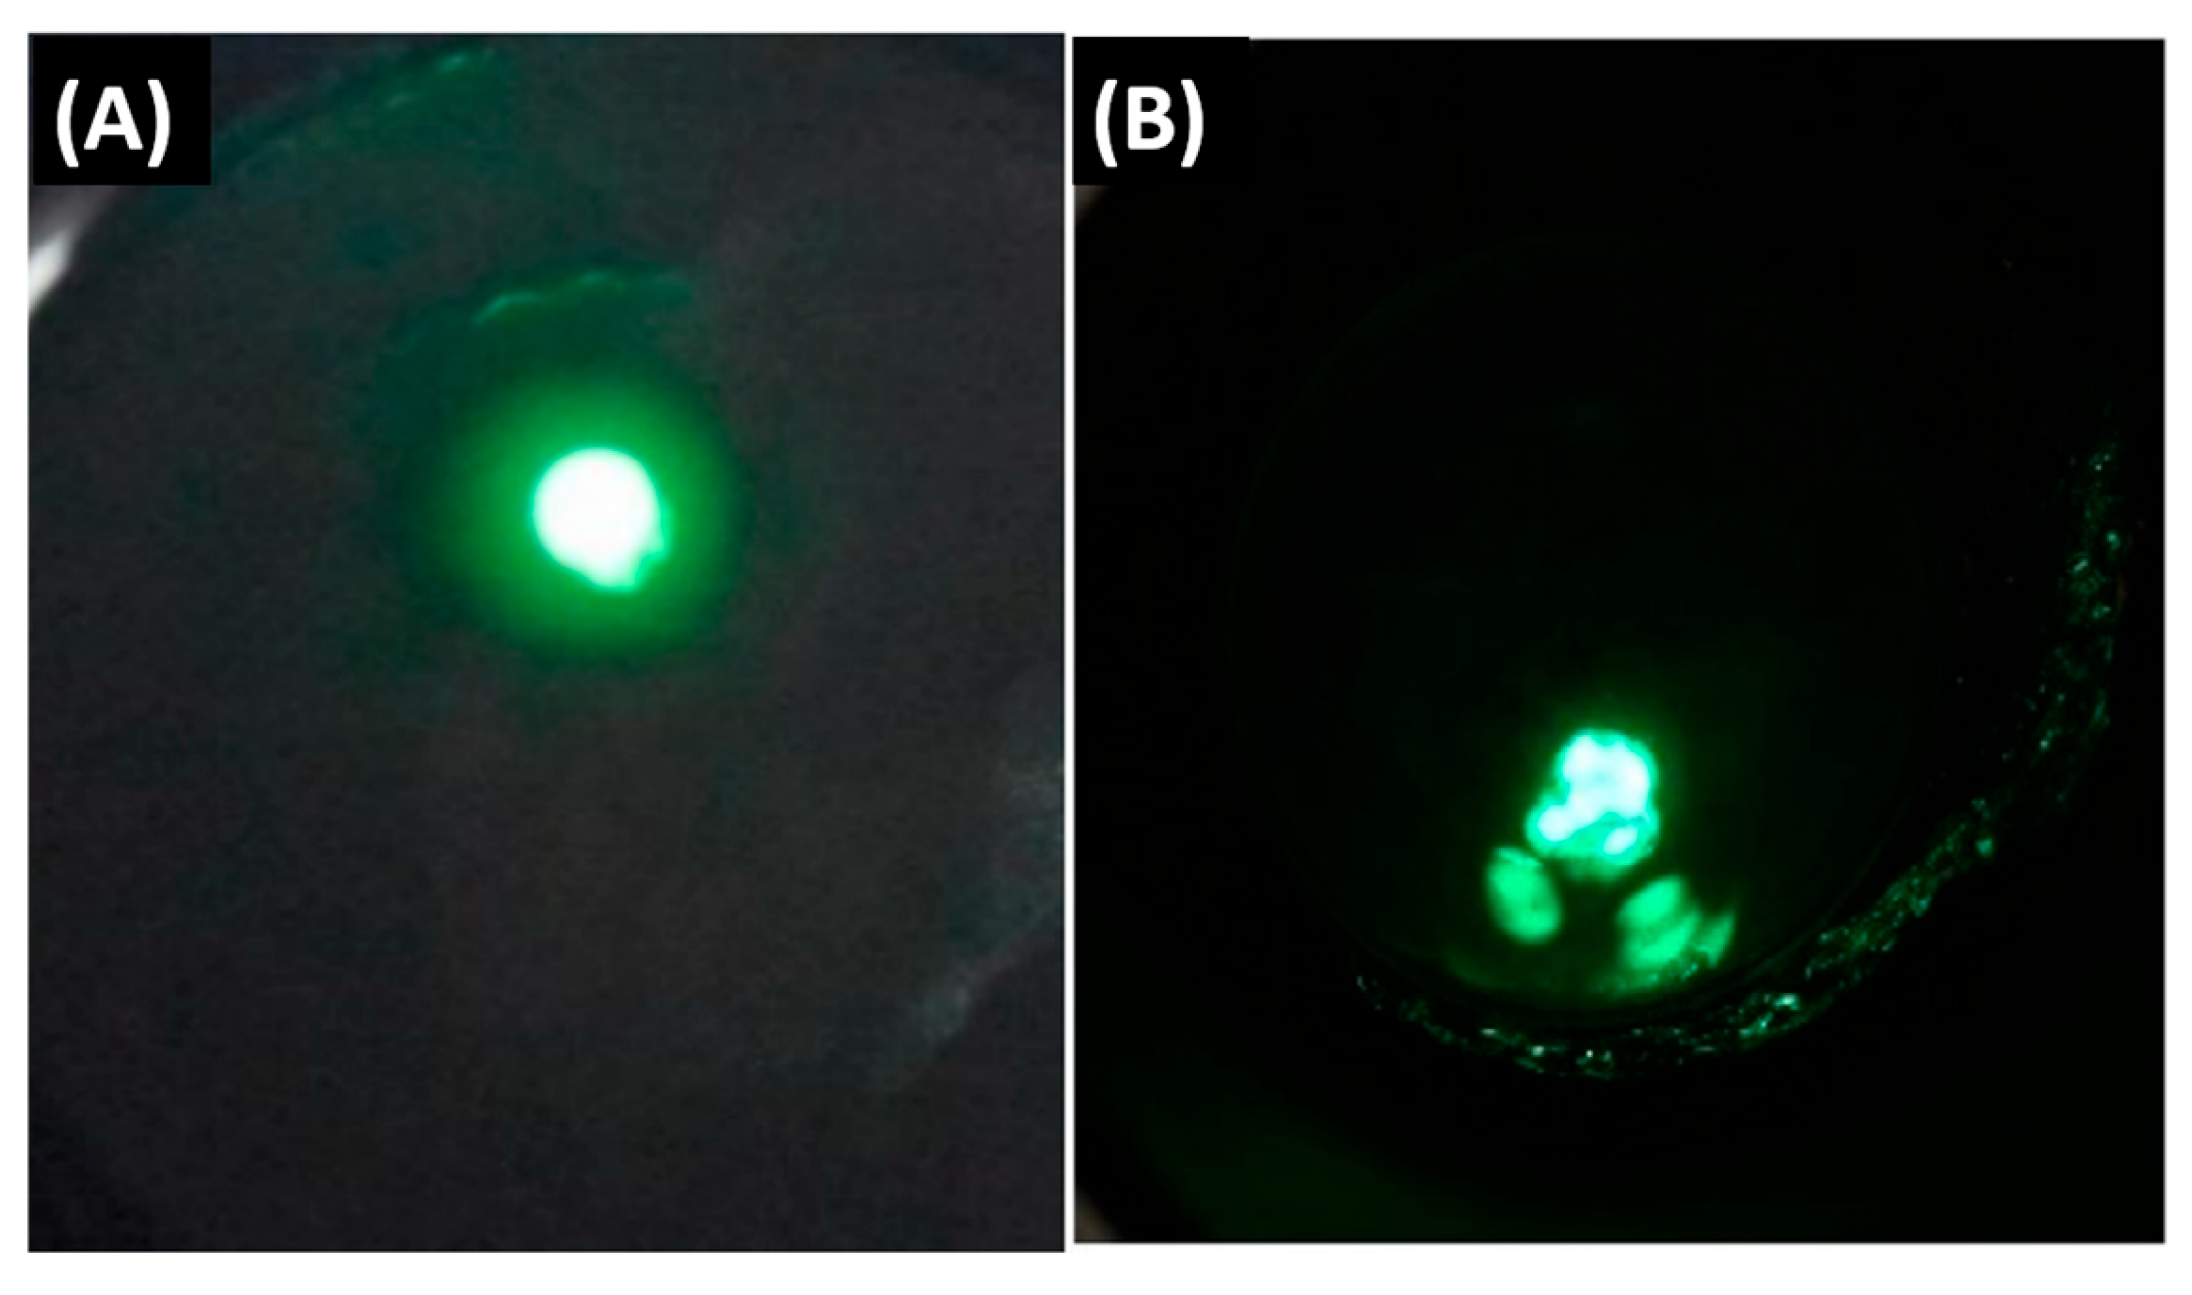
For the coated tungsten samples, the detected FEM behavior was characterized by a switch-on phenomenon and a focused single bright spot. This behavior was previously explained by Mousa in 1986, who described the creation of crystallized channels that allow electrons to pass to and from vacuum to the tungsten surface [2]. The difference in the FEM behavior between the uncoated and coated tungsten samples is presented in Figure 5, as observed in previous studies [16,26].
In this study, the tip was connected to a high-voltage power supply. The applied voltage was gradually increased until the first ion emission was observed at 5 kV. The resulting FIM data were divided into three phases. The first phase (erosion phase), which spans the voltage range of 5–7.2 kV, is illustrated in Figure 6. In this set of figures, the yellow-highlighted regions (bright spots) represent the imaging of the molecular distribution of the resin layer, while the red regions (dull spots) indicate the atomic distribution of the tungsten surface, as seen through the resin layer.
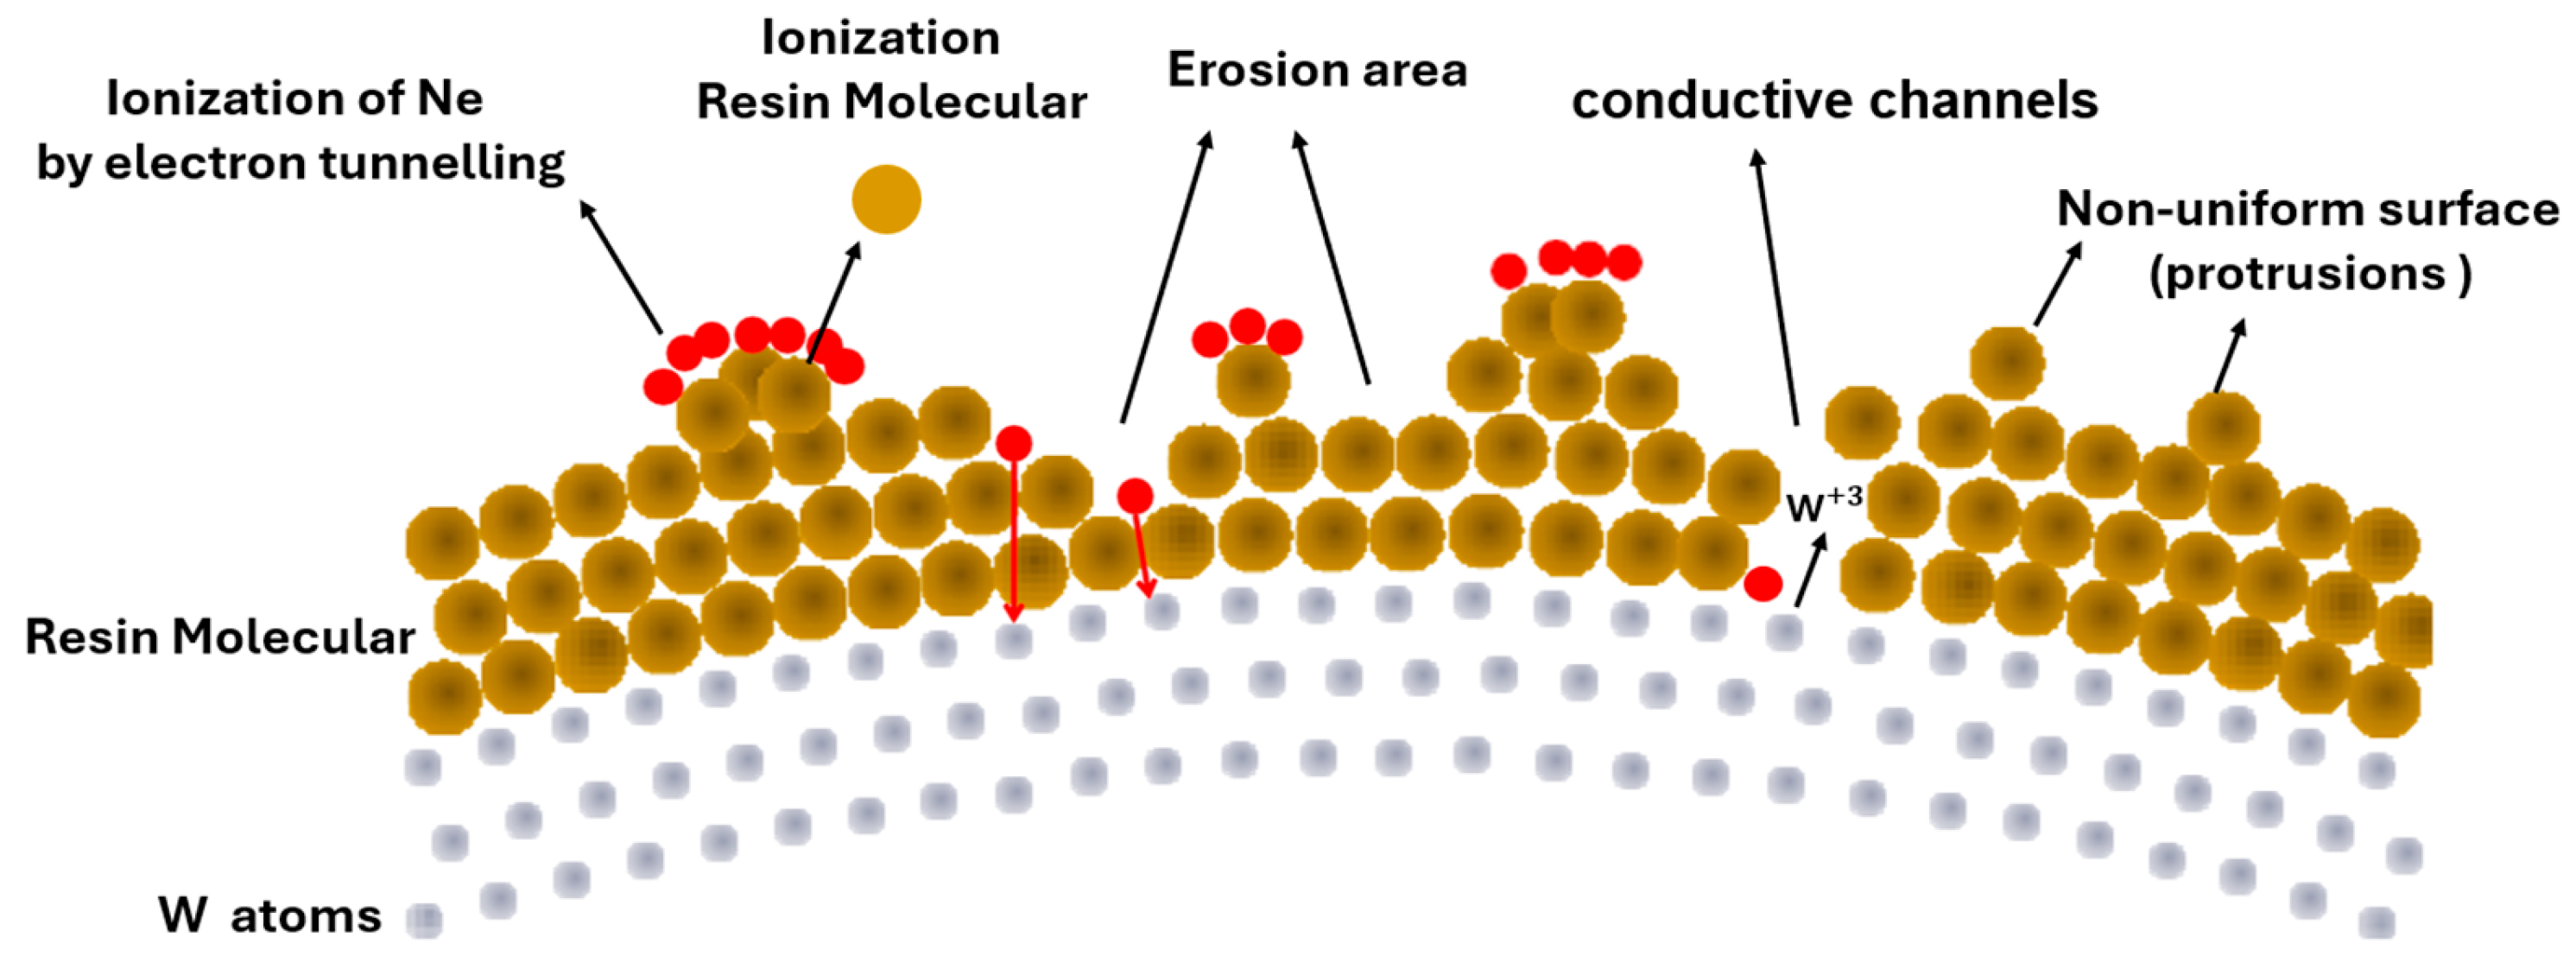
The appearance of bright spots (yellow-highlighted regions) was associated with N e + ions generated through direct ionization by organic molecules at the resin surface. Because the surface of the epoxy layer is uneven, the ionization intensity at the protrusions is the highest at this stage. This was accompanied by erosion of the epoxy layer. In this context, brighter spots indicate a higher density of emitted N e + , whereas larger spots, often with multiple connected circular regions (or spots with tails), suggest the imaging of more atoms within the same molecule. In contrast, the dull spots (red-highlighted regions) resulted from the indirect ionization of N e + . This occurs in surface regions with a thin resin layer, where electrons from Ne atoms tunnel through the resin molecules to reach the tungsten surface atoms. This tunneling process facilitates the localization and imaging of tungsten atoms, albeit with a lower density of emitted N e + . Because molecules are composed of multiple atoms, the production of N e + ions increases with the number of ionization spots supplied. Moreover, molecules have more atoms available for capturing and imaging. This explains the differences in size and brightness between the yellow and red regions, which correspond to the imaged elements, thus providing support for the proposed theory. A schematic of this process is shown in Figure 7.
To simplify the detection and differentiation between resin surface molecules and tungsten surface atoms, we utilized the brightness levels of the imaging spots. Because molecules are larger in size than atoms, the concentration of ionized Ne atoms is higher when detected at the molecules, resulting in brighter spots.
The second phase of the results was obtained within the voltage range 7.2–9.6 kV. At this stage, erosion areas develop and form channels that facilitate the transport of tungsten ions. In this range, the FIM images revealed only the atomic distribution of the tungsten surface through the resin layer, as evidenced by the dull spots in Figure 8. The bright spots in this case are smaller than those described earlier, indicating that they represent tungsten surface atoms, but with a more intense ionization process for the Ne gas.
The third and last phases of the results were obtained in the voltage range 10.0–15.0 kV. At this stage, the formation of conductive channels increased and depended on the topography and the thickness of the epoxy layer. The FIM images (Figure 9) show new active resin surface regions that contribute to the Ne ionization process. Again, the bright large spots are related to the resin surface molecules, whereas the small bright and dull spots are related to the tungsten surface atoms. In addition, Figure 9A–C show blurred large bright spots, which are believed to be obtained for inner resin surface molecules that were imaged by the tunneling ionization process, where the N e + ions were ionized by losing their electrons when tunneled to the inner surface molecule, and the gradient in brightness is related to the intensity of the ionization of Ne gas.
At some regions, where the epoxy layer was very thin, it was possible to image the tungsten surface atoms when the N e + ions are created through tunneling currents. Ne electrons were charging the resin molecules, which are in turn discharged through the close tungsten atom. This process helps to locate these atoms in addition to the inner resin surface molecules, as seen from the blurred spots in Figure 9D–F.
Achieving brighter and more concentrated emission spots in the case of imaging the resin surface is related to the high concentration of N10e gas ions in small areas within the resin surface molecules, allowing for the creation of a large density of N e + at these spots owing to an intense thermal transition of the Ne gas electrons to the resin surface. These electrons can easily flyover above the reduced potential energy barrier (PEB), which is reduced because of two factors: The first is because of a lower local work function value for the epoxy coating layer (2.97 eV), which reduces the height of the PEB and so also the vacuum level. Second, when an external electrostatic field is applied in the space between the two electrodes, the PEB’s shape changes to a reduced image-rounded PEB, which is known as the Schottky–Nordheim SN-PEB. The top of this SN-PEB can be reduced by increasing the intensity of the electrostatic field, and when applying extremely intense fields, the top of the SN-PEB will be lower than the Fermi level of the used material, allowing the electrons to thermally transfer from above the reduced SN-PEB [36]. This can help increase the density of N e + to be created at small spots, and then emitted at higher densities, providing brighter spots on the imaging screen.
This theory is valid to explain why the field ion emission process started at lower voltages for the case of coated samples (at 5.0 kV) in comparison with the case of uncoated samples (at 7.2 kV). In addition, the coated regions of the coated samples could operate at higher voltages (15.0 kV) than the uncoated samples (12.0 kV). This provides further evidence of the longer lifetime and durability of the coated samples. To prove this result, atom probe tomography analysis was performed at 15.0 kV for the coated samples, and the results are discussed in the next subsection.
Another possible explanation can be discussed within this context, as the Ne ions will be concentrated within a small volume above the surface. This may allow for secondary N e + ions to be created by the collisions between the created N e + ions and the Ne ions, which, of course, can increase the density of the created ions at the bright regions and thus the ions impacted on the imaging screen.

5.2. Atom Probe Tomography Analysis

The nano-emitter was examined before and after coating using atomic probe tomography (APT) (Figure 10) to understand the distribution of E-478 epoxy resin and the formation of conductive channels. APT can provide quantitative information and the exact positions of the resin molecules at grain boundaries; the results can be obtained with the highest available spatial resolution. APT measurements were performed using the same instrument as that used for FIM measurements. The measurements were carried out in the voltage mode at a temperature of 75 K and pulse fractions of 5–15 kV with evaporation rates of 1–3%. The data were evaluated using Cameca’s TAP3D software v2.2.
As shown in Figure 10A, tungsten ions were predominant and formed a polycrystalline tungsten structure. These results were consistent with Figure 4. In Figure 10B, the epoxy components of carbon, silicon, and oxygen can be observed in small proportions, while noise refers to the ionized resin molecules, and their concentration is observed to be higher than that of the other ions. This indicated the erosion phase of the epoxy layer. On the other hand, tungsten ions were concentrated at specific locations. This indicated the formation of conductive channels in these areas. This is consistent with Figure 6, Figure 8 and Figure 9. In addition, the presence of white areas is attributed to the lack of ionization of the resin molecules. This indicates that the formation of conductive channels has a higher probability at protrusions, as illustrated in Figure 7.
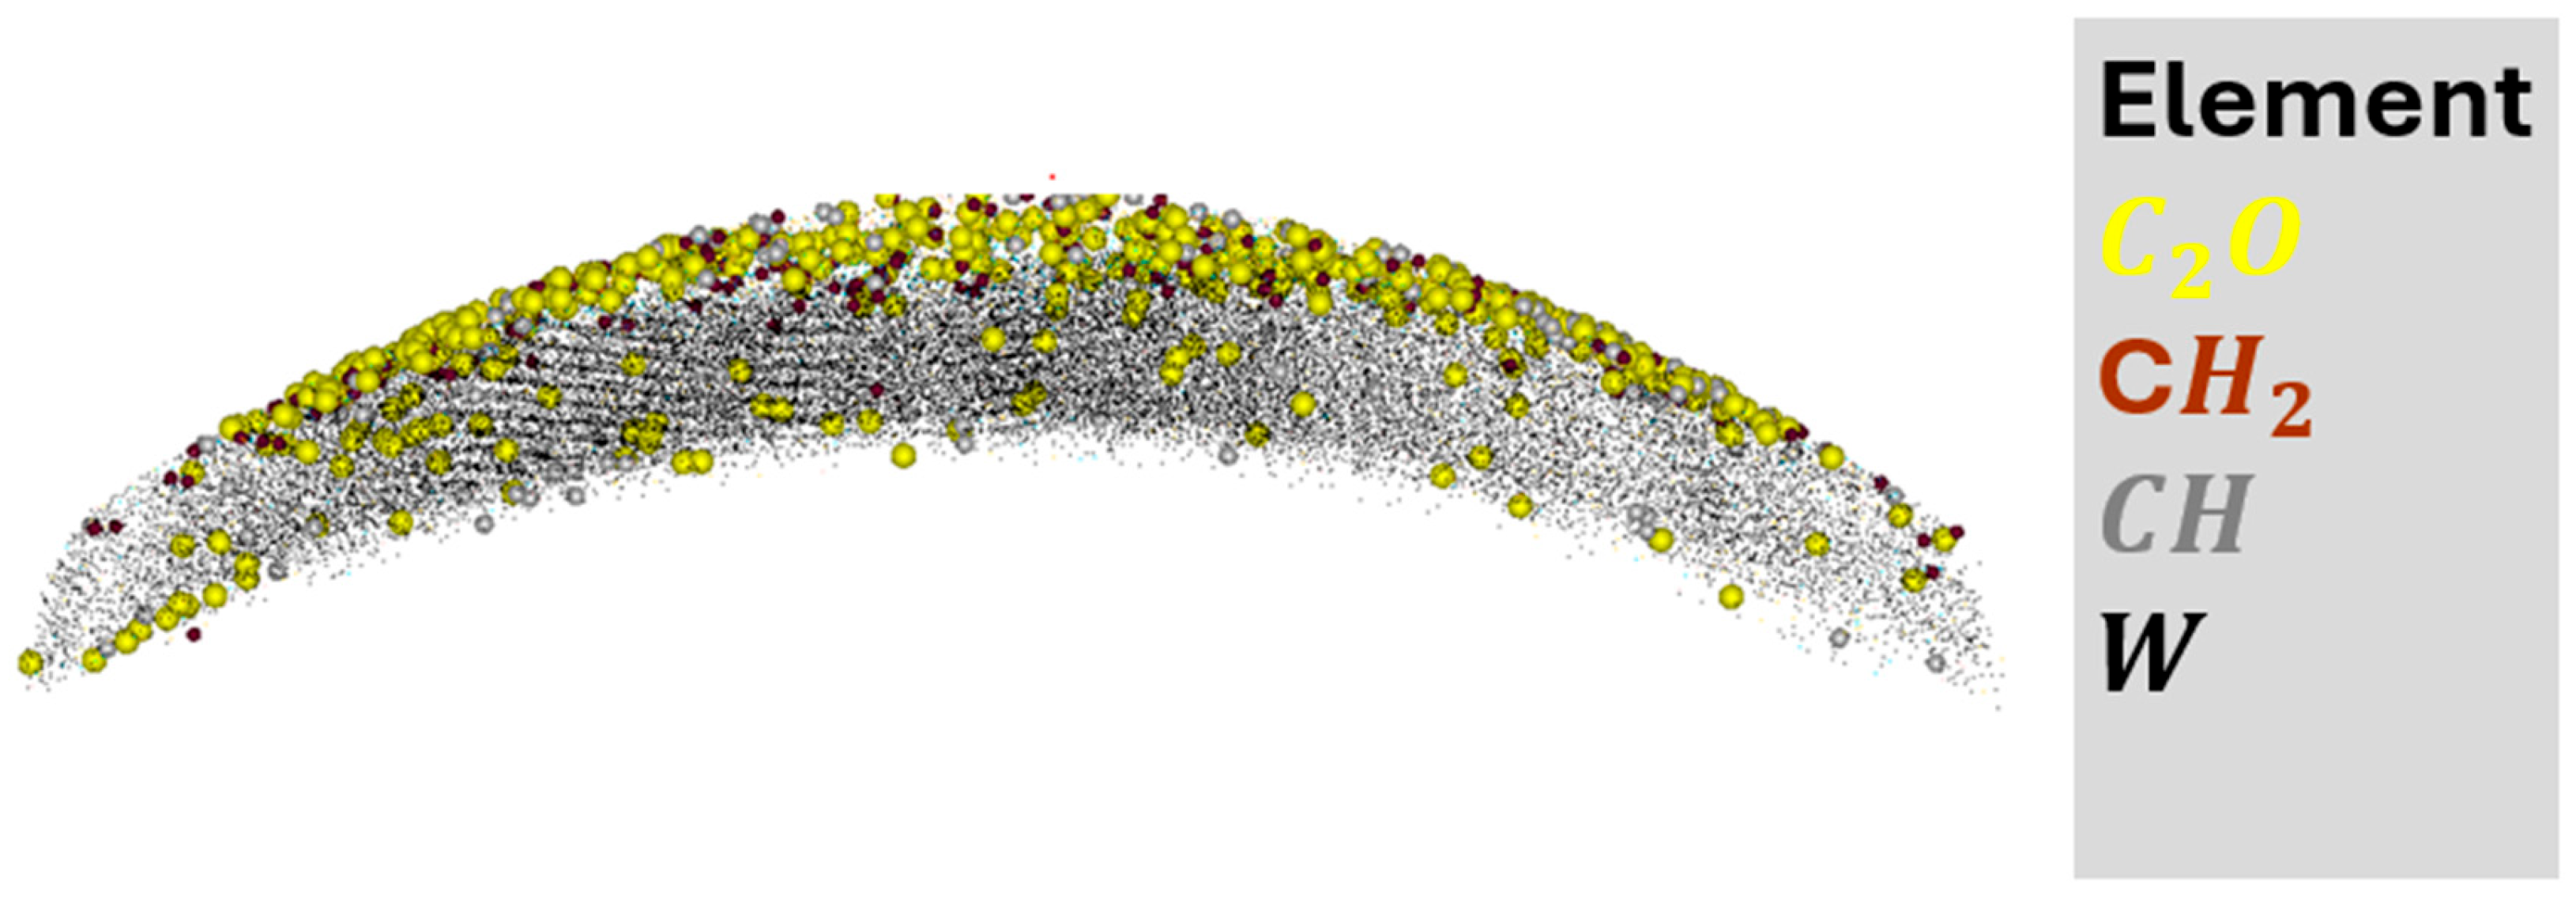
Figure 11 illustrates the distribution of epoxy layers on the surface of the nanocomposite emitter. Various resin-forming molecules, including C 2 O , C H 2 , and CH, were analyzed. This confirms that the noise observed in Figure 10B is attributable to the presence of the epoxy molecules. These results are consistent with those of many previous studies on epoxy in more detail [37,38,39].

6. Conclusions

In the context of this research, it has been proven that composite sources produce bright and concentrated emission spots. In both emission techniques (FEM and FIM), these spots were characterized by higher emission densities than those obtained from the emission process from a regular tungsten tip.
The emission process was discussed in the context of the creation of induced conductive channels through the coating layer by charging the resin molecules through the ionization of Ne gas, after which the induced charge is discharged when the electrons tunnel through the resin layer to the conductive region of the tungsten surface. The results obtained from FEM and FIM studies show that using composite metal-dielectric field emitters is a promising methodology for producing electron/ion beam sources, which will add several benefits to the technology of electron/ion beam instruments, such as scanning electron/ion microscopy and focused electron/ion beam lithography devices. This type of electron/ion beam source has several advantages, such as focused and concentrated beams.
Moreover, APT analysis provided strong evidence of the durability of the coated samples, as the resin layer did not evaporate even at high voltages.

Author Contributions

A.A., M.S.M., A.K., D.S. and P.Š.; methodology, A.A., M.S.M., A.K., D.S. and S.M.H.; software, A.A., R.S. and P.K.; formal analysis, A.A., A.K., S.M.H., M.S.M. and P.Š.; investigation, S.M.H., M.S.M. and D.S.; data curation, R.S., P.K. and A.A.; writing—original draft preparation, A.A.; writing—review and editing, A.A., A.K., S.M.H., R.S., P.Š. and M.S.M. All authors have read and agreed to the published version of the manuscript.

Funding

The research described in this article was financially supported by the Czech Academy of Sciences (RVO:68081731) and the Internal Grant Agency of Brno University of Technology, grant No. FEKT-S-23-8228.

Institutional Review Board Statement

Not applicable.

Informed Consent Statement

Not applicable.

Data Availability Statement

Data are contained within the article.

Acknowledgments

We would like to thank Torben Boll from KIT, who was at the genesis of this work and was very helpful in the experimental part of this publication.

Conflicts of Interest

The authors declare no conflicts of interest.

References

  1. Alsoud, A.; Mousa, M.S.; Abuamr, A.M.; Fawaeer, S.H.; Ronoh, K.; AlQaisi, A.F.; Liedermann, K.; Knápek, A.; Al-Akhras, M.-A.H.; Sobola, D. Field Electron Emission from a Tungsten Cathode Coated with Silica. Jordan J. Phys. 2024, 17, 187–196. [Google Scholar] [CrossRef]
  2. Latham, R.V.; Mousa, M.S. Hot electron emission from composite metal-insulator micropoint cathodes. J. Phys. D Appl. Phys. 1986, 19, 699–713. [Google Scholar] [CrossRef]
  3. Forbes, R.G.; Deane, J.H.B.; Fischer, A.; Mousa, M.S. Fowler-Nordheim Plot Analysis: A Progress Report. arXiv 2015, arXiv:1504.06134. [Google Scholar]
  4. Shao, X.; Khursheed, A. A Review Paper on “Graphene Field Emission for Electron Microscopy”. Appl. Sci. 2018, 8, 868. [Google Scholar] [CrossRef]
  5. Chen, L.; Yu, H.; Zhong, J.; Wu, J.; Su, W. Graphene based hybrid/composite for electron field emission: A review. J. Alloys Compd. 2018, 749, 60–84. [Google Scholar] [CrossRef]
  6. Winnicki, M.; Łapa, W.; Znamirowski, Z. Field Electron Emission Experiments with Cold-Sprayed Cu-SiC Composite Coatings. Coatings 2021, 11, 134. [Google Scholar] [CrossRef]
  7. Raimondo, M.; Naddeo, C.; Vertuccio, L.; Lafdi, K.; Sorrentino, A.; Guadagno, L. Carbon-Based Aeronautical Epoxy Nanocomposites: Effectiveness of Atomic Force Microscopy (AFM) in Investigating the Dispersion of Different Carbonaceous Nanoparticles. Polymers 2019, 11, 832. [Google Scholar] [CrossRef]
  8. Dai, Y.; Xu, Y.; Shi, C.; Liu, Y.; Bi, S. Formation mechanism and functional properties of walnut protein isolate and soy protein isolate nanoparticles using the pH-cycle technology. Front. Nutr. 2023, 10, 1135048. [Google Scholar] [CrossRef]
  9. Jaber, A.M.D.; Alsoud, A.; Al-Bashaish, S.R.; Al Dmour, H.; Mousa, M.S.; Trčka, T.; Holcman, V.; Sobola, D. Electron Energy-Loss Spectroscopy Method for Thin-Film Thickness Calculations with a Low Incident Energy Electron Beam. Technologies 2024, 12, 87. [Google Scholar] [CrossRef]
  10. Boll, T.; Al-Kassab, T.; Yuan, Y.; Liu, Z. Investigation of the site occupation of atoms in pure and doped intermetallic. Ultramicroscopy 2007, 107, 796–801. [Google Scholar] [CrossRef]
  11. Müller, E.; Tsong, T. Field ion microscopy, field ionization and field evaporation. Prog. Surf. Sci. 1974, 4, 1–139. [Google Scholar] [CrossRef]
  12. Hashizume, T.; Wang, X.-D.; Nishina, Y.; Shinohara, H.; Saito, Y.; Kuk, Y.K.Y.; Sakurai, T.S.T. Field Ion-Scanning Tunneling Microscopy Study of C60 on the Si(100) Surface. Jpn. J. Appl. Phys. 1992, 31, L880. [Google Scholar] [CrossRef]
  13. Maris, H.J.; Seidel, G.M.; Stein, D. Dark Matter Detection Using Helium Evaporation and Field Ionization Stein. Phys. Rev. Lett. 2017, 119, 181303. [Google Scholar] [CrossRef] [PubMed]
  14. Lagally, M.G. Atom Motion on Surfaces. Phys. Today 1993, 46, 24–31. [Google Scholar] [CrossRef]
  15. Viskadouros, G.M.; Stylianakis, M.M.; Kymakis, E.; Stratakis, E. Enhanced Field Emission from Reduced Graphene Oxide Polymer Composites. ACS Appl. Mater. Interfaces 2013, 6, 388–393. [Google Scholar] [CrossRef]
  16. Al Soud, A.; Knapek, A.; Mousa, M.S. Analysis of the Various Effects of Coating W Tips with Dielectric Epoxylite 478 Resin or UPR-4 Resin Coatings under Similar Operational Conditions. Jordan J. Phys. 2020, 13, 191–199. [Google Scholar] [CrossRef]
  17. Panda, K.; Hyeok, J.J.; Park, J.Y.; Sankaran, K.J.; Balakrishnan, S.; Lin, I.-N. Nanoscale investigation of enhanced electron field emission for silver ion implanted/post-annealed ultrananocrystalline diamond films. Sci. Rep. 2017, 7, 16325. [Google Scholar] [CrossRef]
  18. Li, J.; Wang, Y.; Ran, Z.; Yao, H.; Du, B.; Takada, T. Molecular Structure Modulated Trap Distribution and Carrier Migration in Fluorinated Epoxy Resin. Molecules 2020, 25, 3071. [Google Scholar] [CrossRef]
  19. Ji, Q.; Wang, B.; Zheng, Y.; Zeng, F.; Lu, B. Field emission performance of bulk graphene. Diam. Relat. Mater. 2022, 124, 108940. [Google Scholar] [CrossRef]
  20. Knápek, A.; Allaham, M.M.; Burda, D.; Sobola, D.; Drozd, M.; Horáček, M. Explanation of the quasi-harmonic field emission behaviour observed on epoxy-coated polymer graphite cathodes. Mater. Today Commun. 2023, 34, 105270. [Google Scholar] [CrossRef]
  21. Abuamr, A.M.; Mousa, M.S.; Al-Bashaish, S.R.; Madanat, M.A.; AlSoud, A.; Jaber, A.M.D.; AlQaisi, A.F.; Al-Anber, M.A.; Barzinjy, A.A.; Arrasheed, E.A.; et al. Characterization of field emission from oxidized copper emitters. Phys. Scr. 2024, 99, 105029. [Google Scholar] [CrossRef]
  22. Mousa, M.; Karpowicz, A.; Surma, S. ‘Switch-on’ phenomena in field-electron and field-ion microscopy. Vacuum 1994, 45, 249–254. [Google Scholar] [CrossRef]
  23. Velikodnaya, O.A.; Gurin, V.A.; Gurin, I.V.; Kolosenko, V.V.; Ksenofontov, V.A.; Mikhailovskij, I.M.; Sadanov, E.V.; Bukolov, A.N.; Mazilov, A.A. Multi-emitter field ion source based on a nanostructural carbon material. Tech. Phys. Lett. 2007, 33, 583–585. [Google Scholar] [CrossRef]
  24. Oberdorfer, C.; Schmitz, G. On the Field Evaporation Behavior of Dielectric Materials in Three-Dimensional Atom Probe: A Numeric Simulation. Microsc. Microanal. 2010, 17, 15–25. [Google Scholar] [CrossRef] [PubMed]
  25. Bliznyuk, V.N.; LaJeunesse, D.; Boseman, A. Application of helium ion microscopy to nanostructured polymer materials. Nanotechnol. Rev. 2014, 3, 361–387. [Google Scholar] [CrossRef]
  26. Soud, A.A.; Buqain, R.N.A.; Mousa, M.S. Composite Metallic Nano Emitters Coated with a Layer of Insulator Covered by Au. Jordan J. Phys. 2020, 13, 253–262. [Google Scholar]
  27. Lunk, H.-J.; Hartl, H. Discovery, properties and applications of tungsten and its inorganic compounds. ChemTexts 2019, 5, 15. [Google Scholar] [CrossRef]
  28. Knápek, A.; Sýkora, J.; Chlumská, J.; Sobola, D. Programmable set-up for electrochemical preparation of STM tips and ultra-sharp field emission cathodes. Microelectron. Eng. 2017, 173, 42–47. [Google Scholar] [CrossRef]
  29. Allaham, M.M. Comprehensive Analysis of E478 Single-Component Epoxy Resin and Tungsten-E478 Interface for Metallic-Polymer Composite Electron Source Applications. ACS Omega 2024, 9, 30975–30985. [Google Scholar] [CrossRef]
  30. Boll, T.; Unocic, K.A.; Pint, B.A.; Stiller, K. Interfaces in Oxides Formed on NiAlCr Doped with Y, Hf, Ti, and B. Microsc. Microanal. 2017, 23, 396–403. [Google Scholar] [CrossRef]
  31. Bogdanowicz, J.; Kumar, A.; Fleischmann, C.; Gilbert, M.; Houard, J.; Vella, A.; Vandervorst, W. Laser-assisted atom probe tomography of semiconductors: The impact of the focused-ion beam specimen preparation. Ultramicroscopy 2018, 188, 19–23. [Google Scholar] [CrossRef] [PubMed]
  32. Seol, J.B.; Kwak, C.M.; Han, J.C.; Baek, K.H.; Jeong, Y.K. Correlative transmission electron microscopy and atom probe tomography on field evaporation mechanism of a bulk LaAlO3 oxide. Appl. Surf. Sci. 2019, 479, 828–834. [Google Scholar] [CrossRef]
  33. Seol, J.-B.; Kim, Y.-T.; Kim, B.-H.; Park, C.-G. Novel approach for observing the asymmetrical evolution and the compositional nonuniformity of laser pulsed atom probe tomography of a single ZnO nanowire. Met. Mater. Int. 2016, 22, 34–40. [Google Scholar] [CrossRef]
  34. Ivchenko, V.A. Atomic Structure of the Pt Surface after Bombardment with Ar+ Ions (E~30 keV). Adv. Mater. Phys. Chem. 2023, 13, 77–84. [Google Scholar] [CrossRef]
  35. Al Soud, A.; Daradkeh, S.I.; Knápek, A.; Holcman, V.; Sobola, D. Electrical characteristics of different concentration of silica nanoparticles embedded in epoxy resin. Phys. Scr. 2023, 98, 125520. [Google Scholar] [CrossRef]
  36. Allaham, M.M.; Forbes, R.G.; Knápek, A.; Sobola, D.; Burda, D.; Sedlák, P.; Mousa, M.S. Interpretation of field emission current–voltage data: Background theory and detailed simulation testing of a user-friendly webtool. Mater. Today Commun. 2022, 31, 103654. [Google Scholar] [CrossRef]
  37. Cheng, Y.; Yu, G. Effects of Varying Nano-Montmorillonoid Content on the Epoxy Dielectric Conductivity. Molecules 2024, 29, 4650. [Google Scholar] [CrossRef]
  38. AlSoud, A.; Daradkeh, S.I.; Shaheen, A.A.; Al-Hroub, Q.A.; Knápek, A.; Mousa, M.S.; Sobola, D. Electrical properties of epoxy/graphite flakes microcomposite at the percolation threshold concentration. Phys. Scr. 2024, 99, 055955. [Google Scholar] [CrossRef]
  39. Alsoud, A.; Daradkeh, S.I.; Al-Bashaish, S.R.; Shaheen, A.A.; Jaber, A.M.D.; Abuamr, A.M.; Mousa, M.S.; Holcman, V. Electrical Characterization of Epoxy Nanocomposite under High DC Voltage. Polymers 2024, 16, 963. [Google Scholar] [CrossRef]
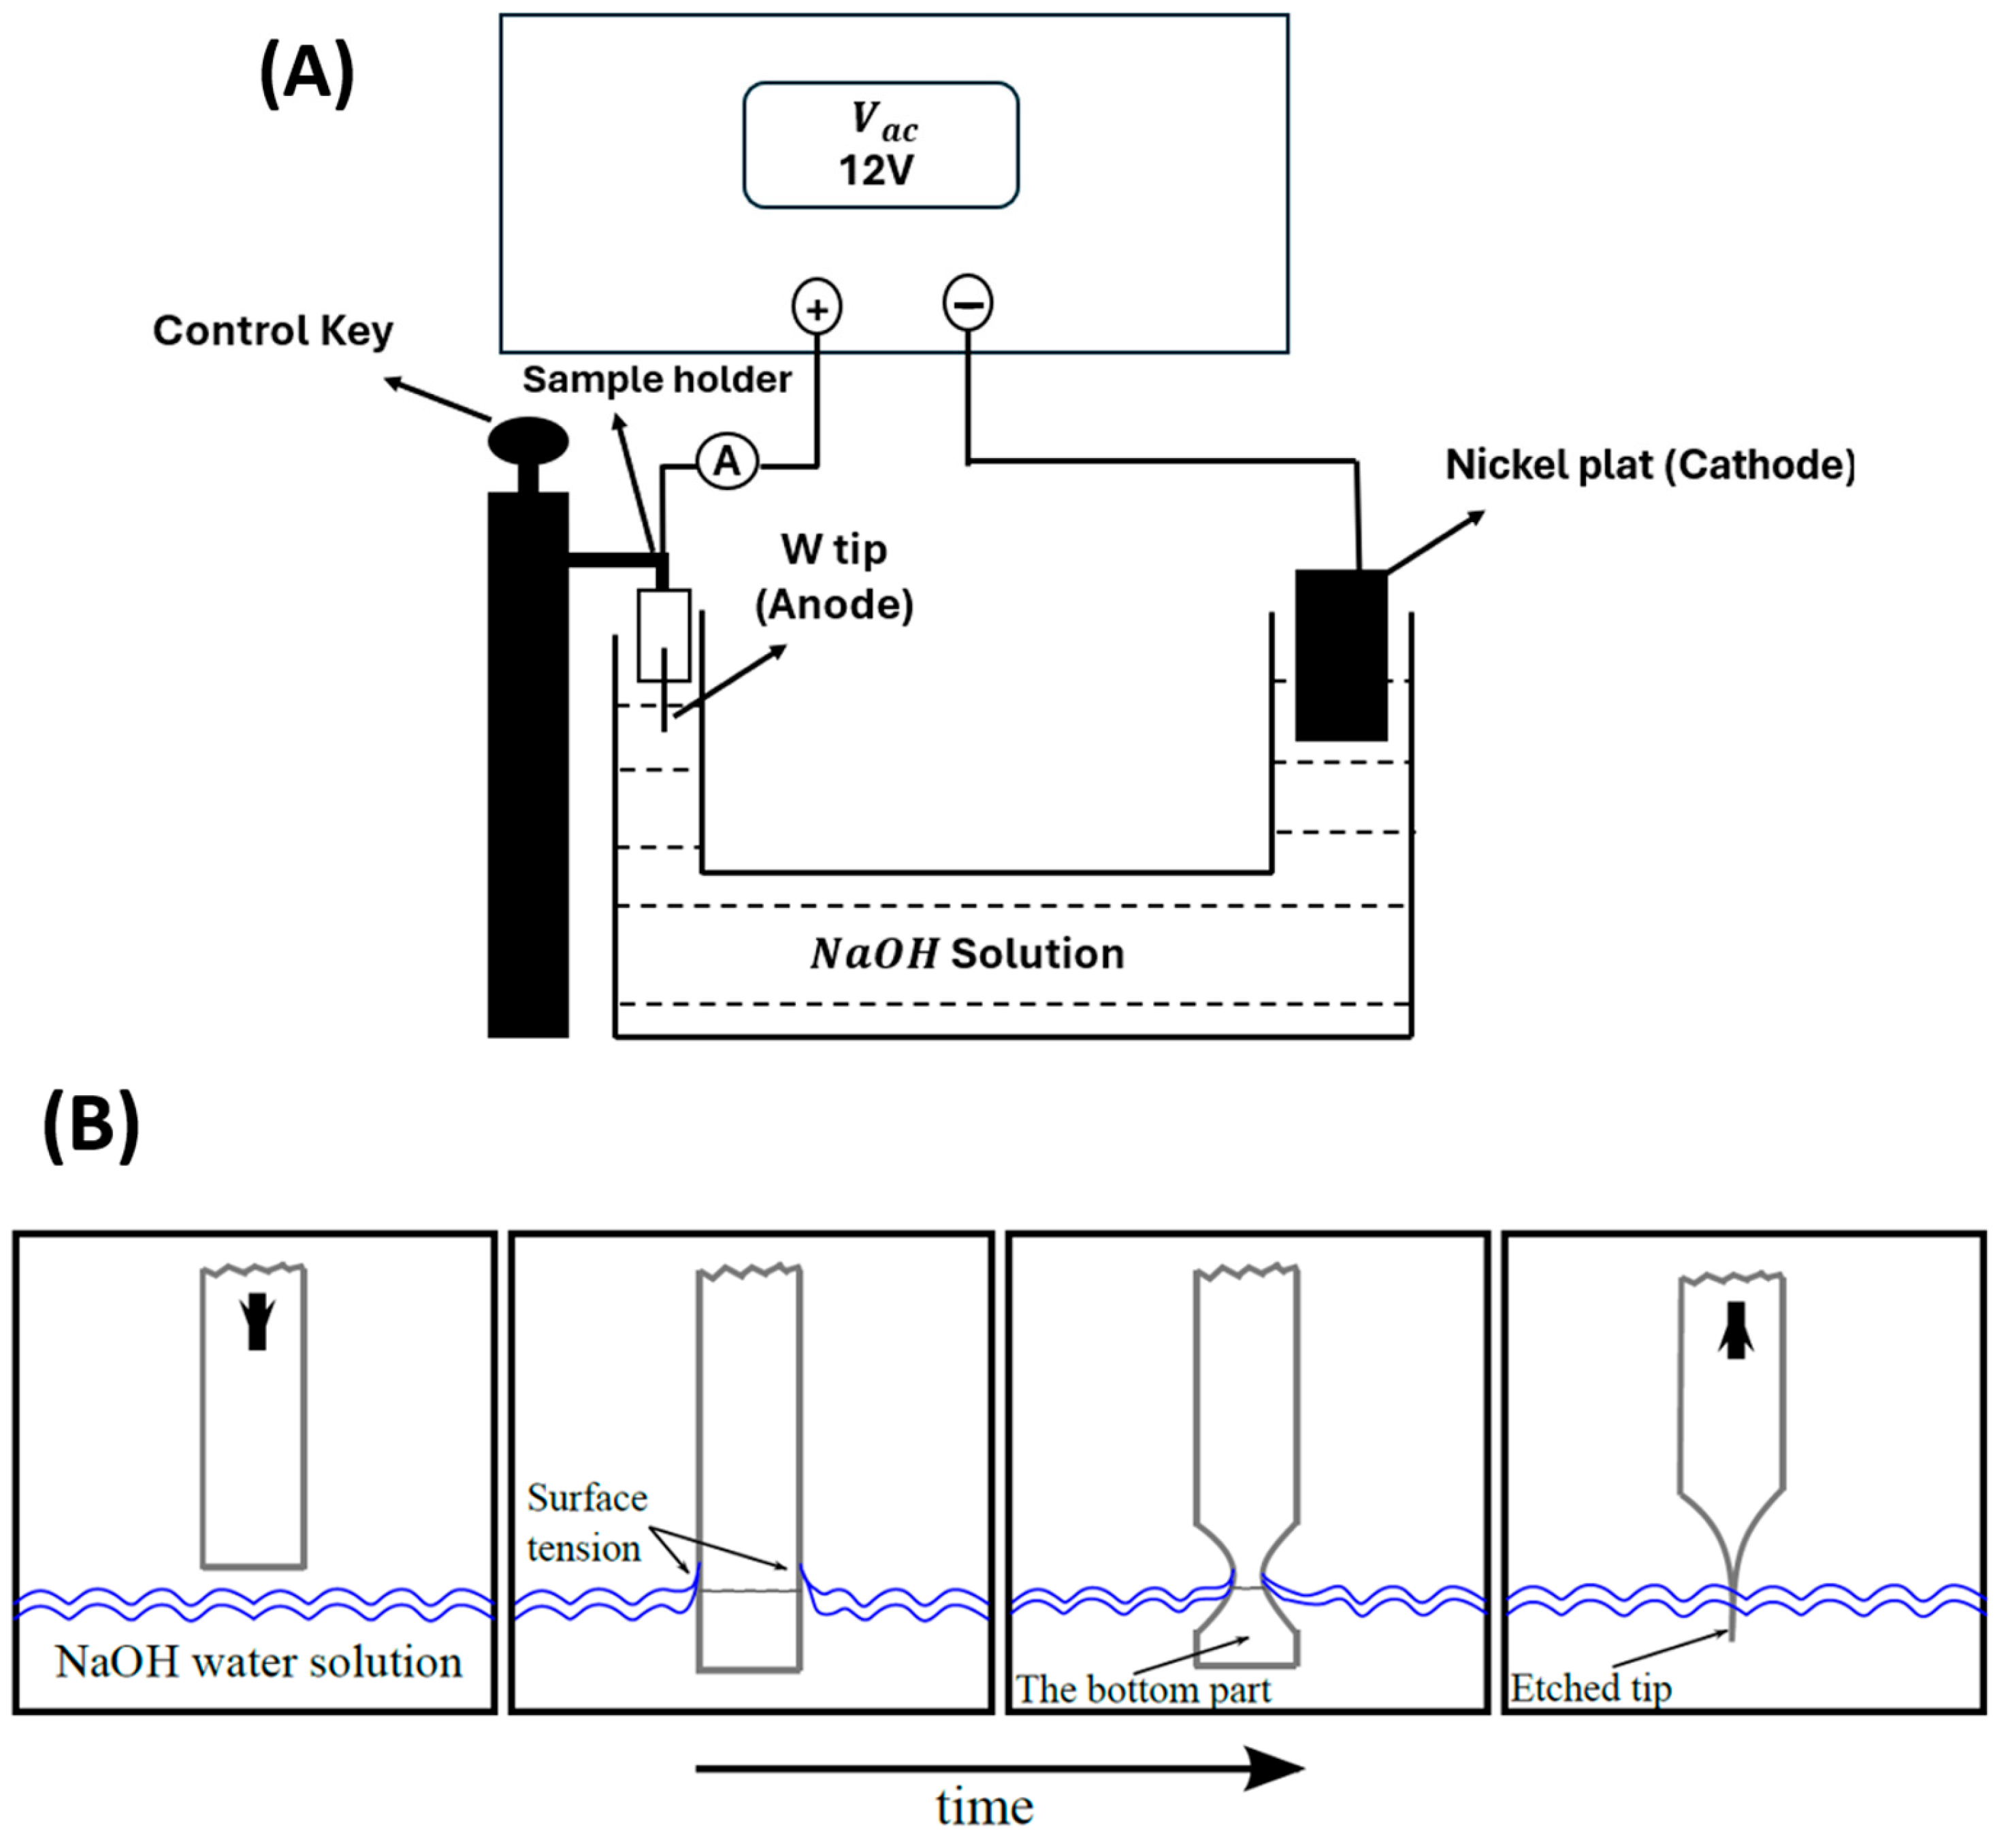
Figure 1. (A) Illustration of the electrochemical etching system. (B) The etching procedure.
Technologies 12 00193 g001
Figure 2. Schematic diagram of LWATAP system.
Technologies 12 00193 g002
Figure 3. SEM-EDS micrograph of (A) uncoated W nano-emitter. (B) W nanocomposite emitter.
Technologies 12 00193 g003aTechnologies 12 00193 g003b
Figure 4. The surface atomic distribution of polycrystalline tungsten nano-tip as obtained from field ion emission microscopy at 7.5 kV.
Technologies 12 00193 g004
Figure 5. The field electron emission pattern of (A) coated tungsten tip and (B) same uncoated tip.
Technologies 12 00193 g005
Figure 6. The surface molecular (bright or yellow-highlighted) and atomic (dull or red-highlighted) distributions of coated polycrystalline tungsten nano-tip, as obtained from field ion emission microscopy at (A) 5.0 kV, (B) 5.5 kV, (C) 6.0 kV, (D) 6.4 kV, (E) 6.0 kV, (F) 7.0 kV.
Technologies 12 00193 g006
Figure 7. A schematic diagram of the ionization process of Ne gas on the surface of coated tungsten samples.
Technologies 12 00193 g007
Figure 8. The surface molecular (bright) and atomic (dark) distributions of “coated” polycrystalline tungsten nano-tip as obtained from field ion emission microscopy at (A) 8.6 kV, (B) 9.0 kV, and (C) 9.6 kV.
Technologies 12 00193 g008
Figure 9. The surface molecular and atomic distributions of coated polycrystalline tungsten nano-tip as obtained from field ion emission microscopy at (A) 10.0 kV, (B) 11.6 kV, (C) 12.8 kV, (D) 14.0 kV, (E) 14.6 kV, and (F) 15.0 kV. The yellow-highlighted regions indicate inner resin surface molecules imaged by tunneling ionization currents.
Technologies 12 00193 g009
Figure 10. (A) Atom probe tomography analysis of (A) uncoated nano-emitter and (B) nanocomposite emitter.
Technologies 12 00193 g010
Figure 11. The distribution of epoxy layers on the nanocomposite emitter apex.
Technologies 12 00193 g011
Disclaimer/Publisher’s Note: The statements, opinions and data contained in all publications are solely those of the individual author(s) and contributor(s) and not of MDPI and/or the editor(s). MDPI and/or the editor(s) disclaim responsibility for any injury to people or property resulting from any ideas, methods, instructions or products referred to in the content.