1. Introduction
The thermal management of energy systems represents a fundamental scientific issue in the field of sustainable development [
1], in particular to increase the eco-efficiency in the various fields of use such as aeronautics [
1], solar energy [
2], or building glazing. Controlling the radiative properties of the surface enables optimization of thermal management systems, and offers an important perspective for improving collection performance by enhancing the emission or the reflection of the surface over specific wavelength range. The thermal radiation depends mainly on the nature of the radiating surface. Actually, the emission of gray surfaces is evaluated by the energy emitted by a black body (Plank’s law) [
3] corrected by its emissive factor (
). Its emissivity depends on the wavelength (
), temperature (
), angle of incidence (
), and roughness value. For other rough surfaces due to surface slopes such as periodic surfaces (periodic V-grooves, semicircular gratings, photonic crystals, etc.) or multiple thin films [
4], the emission geometry and scattering properties of the medium change and affect both the directional and spectral properties of emitted thermal radiation [
3,
4,
5,
6,
7]. V-groove geometries are found in a variety of mechanical designs such as deployable mechanisms [
8], solar absorbers [
8,
9], emitters [
8], solar cells [
9], and thermal radiators [
8]. For these complex surfaces, the emissivity depends on the geometric properties of the surface. When radiant energy is emitted from the surface of a cavity or enters a cavity, the resulting multiple reflections increase the absorption and thus, according to the Kirchhoff’s law of thermal radiation, increase the emission of the open cavity compared to a flat surface due to the cavity effect [
8]. Sparrow and Lin [
10,
11] initially studied the apparent radiative properties of V-grooved surface. Later, Kanayama [
12] studied the apparent directional emittances of V and circular grooved surfaces. He experimentally validated the theoretical calculations by testing an aluminum V-groove for several geometric opening angles. Recent new studies published by Rydge et al. [
8,
13,
14] have considered the total hemispherical apparent radiative properties of the infinite V-groove. These studies discuss the methodology for calculating the apparent emissivity for an isothermal cavity and present some numerical results of the apparent emissivity of a groove as a function of the intrinsic emissivity for different opening angles using a Monte Carlo ray tracing algorithm. The Monte Carlo ray tracing algorithm is a direct numerical method that can be used to quantify the apparent emissivity and apparent absorptivity of arbitrarily shaped cavities [
3,
15,
16]. It is worth noted that surfaces are made directionally selective by altering mechanically their finishing on a microscopic (microgrooves) or macroscopic scale. For example, large V grooves-compared to the wavelengths of the radiation-tend to reflect the incoming radiation several times for near-normal incidence [
17]. The number of reflections decreases with the increase of the incidence angle.
In the presented works, the apparent emissivity of V-groove shapes is evaluated using geometric methods that take into account the intrinsic emissivity of the radiating cavity surface, but without considering the directional and specular dependence of the reflections produced by the groove facets. The novelty of this paper lies in the new approach that allows to study new arrangements such as a V-shape with two facets made of different materials where each reflection or absorption by a facet of the groove depends on both the complex optical index of the material and the angle of incidence. A new model considering the calculations of the reflection and emission coefficient of a V-groove using ray tracing is presented.
2. Theoretical and Numerical Methods
A multi-path ray tracing method to calculate and find the apparent directional emissivity of a V-groove shape is developed. The calculations of the coefficients of reflection and specular absorption of the various rays as a function of angles of incidence are made using the Fresnel formulas between a homogeneous and isotropic medium [
3]. In this study, only perfect smooth conductive or dielectric surfaces are considered, i.e., diffraction and diffusion are considered negligible. In this study, we were interested in determining the radiative behavior of V-shape cavity emitters whose facets are considered perfectly smooth producing a specular reflection. In this case, the reflection and absorption coefficients are described by the Fresnel equations deduced from Maxwell’s electromagnetic theory. The optical properties of a material are linked to its refractive index, real index if it is a dielectric without loss, complex index if it exhibits absorption or conduction [
17]. The complex refractive index (Equation (1)) of a conducting material depends on the wavelength (
) and the angle of incidence (
):
All optical and radiative properties-reflectivity, absorptivity and emissivity (resp.
)-can be calculated using Fresnel’s formulas, for a given wavelength, temperature and angle of incidence. We present in
Figure 1 the variation of the real and imaginary parts of the complex refractive index of gold, platinum, silicon and aluminum [
18,
19]. In order to calculate the optical properties for a given temperature, it is necessary to know the evolution of the real and imaginary parts of the complex refractive index for this temperature.
The amount of light reflected at an interface depends on the polarization (perpendicular or parallel to the incident plane wave), the angle of incidence and the refractive indices of the two media. For the simulations, an interface between a perfect dielectric and an absorbing medium is considered. In this case, the plane wave is incident from a perfect dielectric (air) on an absorbing medium. By solving the following system of Equations (2)–(4), the two reflection coefficients of perpendicular and parallel polarizations [
4] are calculated:
and
are the energy reflection coefficients in the polarized directions, parallel and perpendicular to the incident plane, respectively [
4]. These two coefficients are defined as the square of the ratio of the parallel or perpendicular component of the electric field by the incident electric field. In this study,
and
are the refractive and extinction coefficients of the complex refractive index of the absorbing material
and
is the real refractive index of the incident medium (air). Since thermal radiation is an unpolarized wave, then the average unpolarized reflectivity
) and emissivity (
) are given by the following Equations (5) and (6):
Indeed, for thermal emission, emissivity is analogous to an unpolarized electromagnetic coefficient [
3].
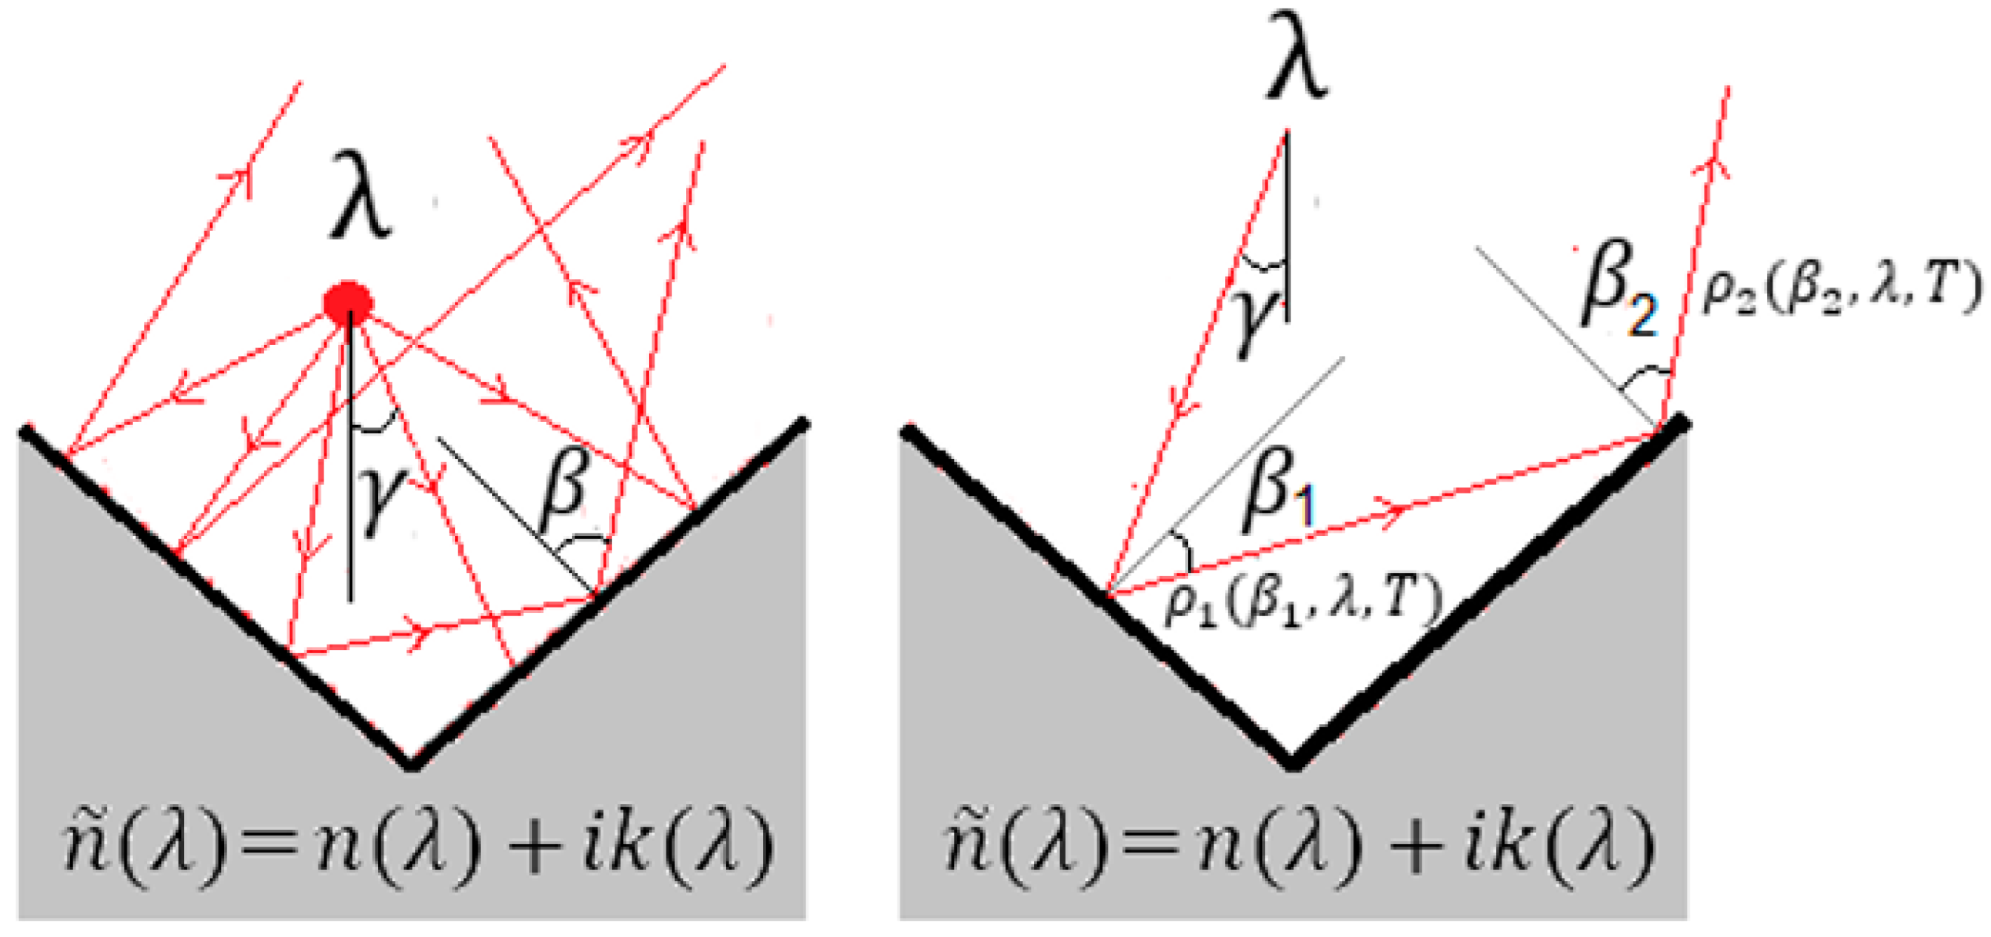
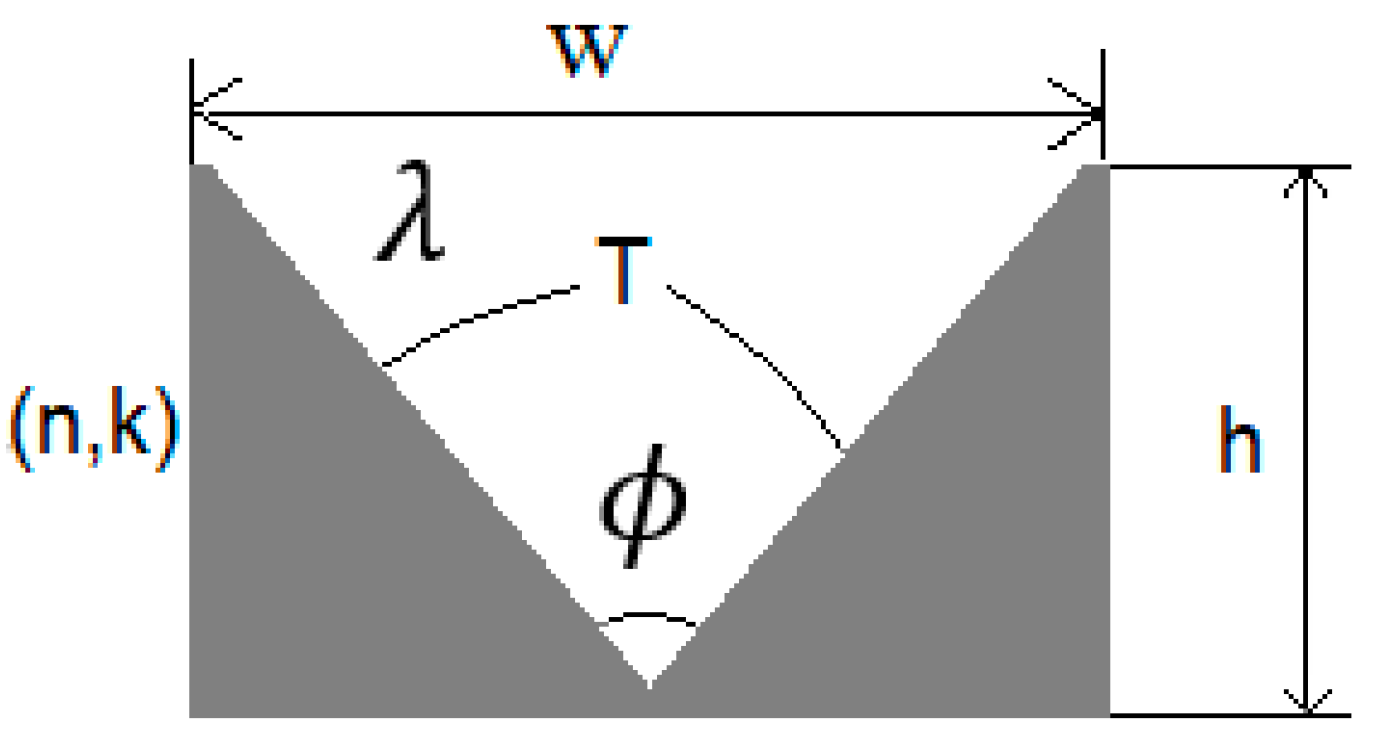
The radiative heat transfer analysis of a V-groove geometry (or any other cavity geometry) is much more complicated than that of a normal flat surface due to the multiple reflections that occur within the cavity walls. The sides of the V-groove are assumed as two flat surfaces forming an angle (
). The parameters are depicted in
Figure 2. The apparent radiative properties of a cavity are function of the intrinsic radiative properties of the cavity walls, the type of reflection (specular or diffuse), the wavelength (
), the overall shape and geometry of the cavity (
), and the cavity material (
n,
k) [
17]. They are affected by the temperature (T) of the cavity walls [
8]. In this study, materials are considered at room temperature.
The apparent directional emittance is calculated based on the following assumptions:
- (1)
The dimensions of the groove surface are much larger than the wavelength of the radiation [
12].
- (2)
The inner surface of the groove is optically smooth, and its material has a specific property of the specular reflection.
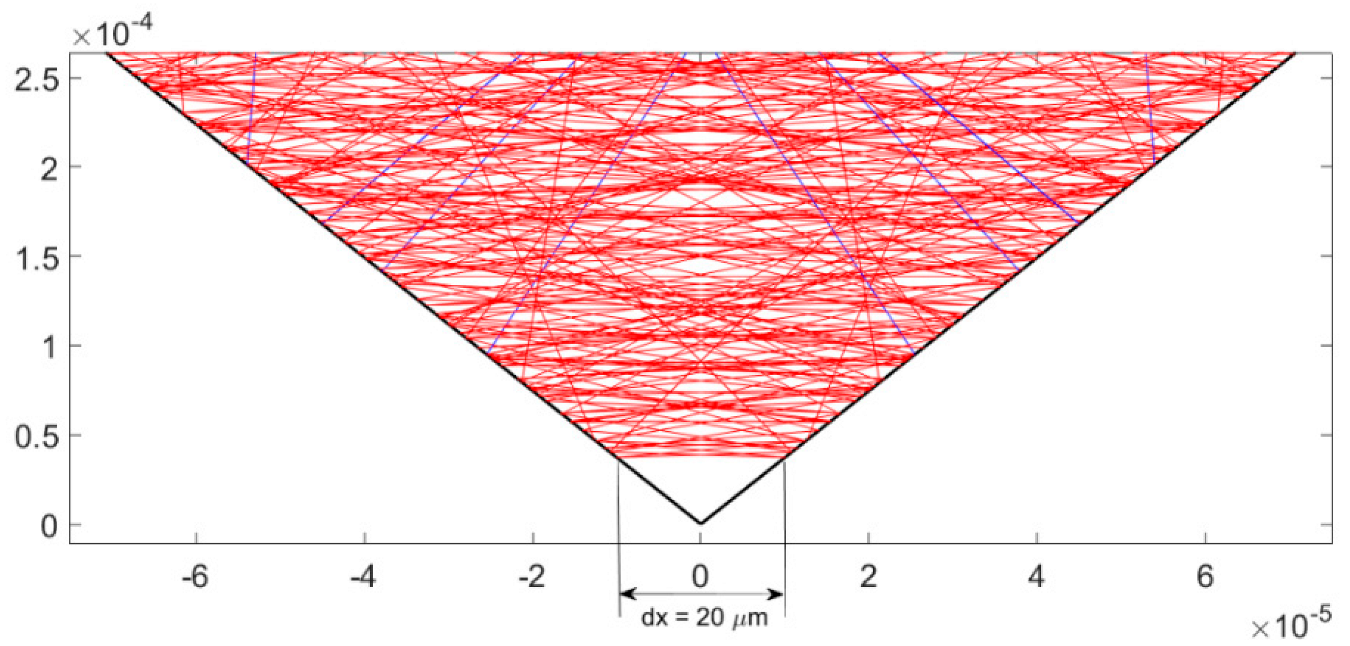
Figure 3 presents the ray tracing diagram of a V-cavity showing the minimum distance dx at which the algorithm works, verifying the two important assumptions above. The simulations are performed in the solar spectral range [
], for a maximum wavelength of
,
.
Homogeneous, isotropic materials with a perfectly defined chemical composition are considered. The separation surface between the media is considered optically smooth. The energy propagation medium between the reflecting and collecting surfaces is not diffusive. These conditions are ideal; they allow us to determine the influence of the optical properties of complex and real index materials on the radiative properties. Several functions were implemented to determine the intersections, angles, and reflection coefficients of the reflected rays inside the V- cavity; the sides of the V-cavity are treated as two flat surfaces forming an angle . The sides of the cavity are discretized into different facets. Simulations of the emitted and reflected rays inside the groove are done by choosing a large width with respect to the wavelength (a minimum ratio = 10 for the study case considering infrared wavelength of 10 µm).
The groove is illuminated by a wavelength
, beams of rays are projected onto the cavity for different angles and in all directions (diffuse irradiation) [
8]. Equation (8) explains how the emission components for rays of different reflection numbers were calculated using our bi-directional tracing algorithm. For each ray, the reflection coefficient was evaluated by considering the angle of incidence (
) for all reflections within the cavity, as shown in
Figure 4. It is noted that for each number of reflections (the beam of rays that are emitted and having the same number of reflections inside the cavity), there is a different emission behavior. From the calculation of the maximum number of reflections inside the cavity, the variation of the maximum number of reflections as a function of the opening angle of the cavity and the incident rays on the cavity are studied. The maximum number of reflections (nmax) can also be calculated using the following equation [
8]:
where
is the incident angle, and
is the cavity opening angle. The maximum number of reflections should be rounded to the nearest integer value. If the initial evaluation is exactly a whole number, then the number of reflections must be increased by one. The apparent directional emittance of the radiation is calculated using Equation (8) [
12]:
where:
; : is the angle of emission or reflection; : is the emission component (rays emitted without any reflections); : is for one-reflection component (rays emitted with a single reflection inside the groove). : is for a two-reflections component (rays emitted with two successive reflections inside the groove); and : is for (i − 1) component of the reflections (rays emitted with i − 1 reflections), where (i − 1) is the maximum number of reflections that occurred inside the groove at a specific opening angle.
4. Results and Discussions
In the following, we present and discuss various results obtained using the ray tracing method [
21]. The calculations and simulations were performed in the spectral band of solar radiation (
). The reflectivity of several materials suitable for the design of a V-groove solar concentrator was evaluated under normal incidence. The behaviors show their spectral dependence on different parts of the electromagnetic spectrum (visible to near infrared NIR).
Figure 6 presents the evolution of the spectral reflectivity of several materials at normal incidence. Results show the responses of different materials on the solar spectrum. As can be seen, for instance, gold has a lower reflectivity in the ultraviolet and in a small part of the visible region (~0.38 of
). However, it tends to have a high reflectivity in other regions. Both gold and aluminum have perfect reflectivity over the infrared part of the solar spectrum about 0.95 for
, while Si and Pt have about 0.3 and 0.7, respectively on the same spectrum.
The optical properties of these materials are well known. Since they have different behaviors in the solar spectrum, they are good candidates to simulate the angular and spectral change of the emission of a V-groove surface made of these materials. It is also very interesting to find the change in spectral and directional emission using V cavity formed by two of these materials. The reflection coefficients
as a function of the angle of incidence were calculated using Fresnel equations. Based on the spectral distribution of the different materials in the solar spectrum, we chose to divide the spectrum into two different parts
, as there is a noticeable difference in reflectivity between these two regions, as shown in
Figure 5. The directional and spectral dependence are well known. For instance, the reflectivity of gold in the first spectral range (
) increases from 0.4 to one, when the angle of incidence increases from 0° to 90°, while in the second spectral range (
), gold shows high reflectivity close to unity for all angles of incidence. The large variation in reflection coefficients was recorded at grazing angles in the range [70
to 90
] for all materials. Therefore, it was important to take this dependence and variation into account in the calculations of the different reflections in our V-groove model.
4.1. Influence of the Angle of Incidence and the Opening Angle
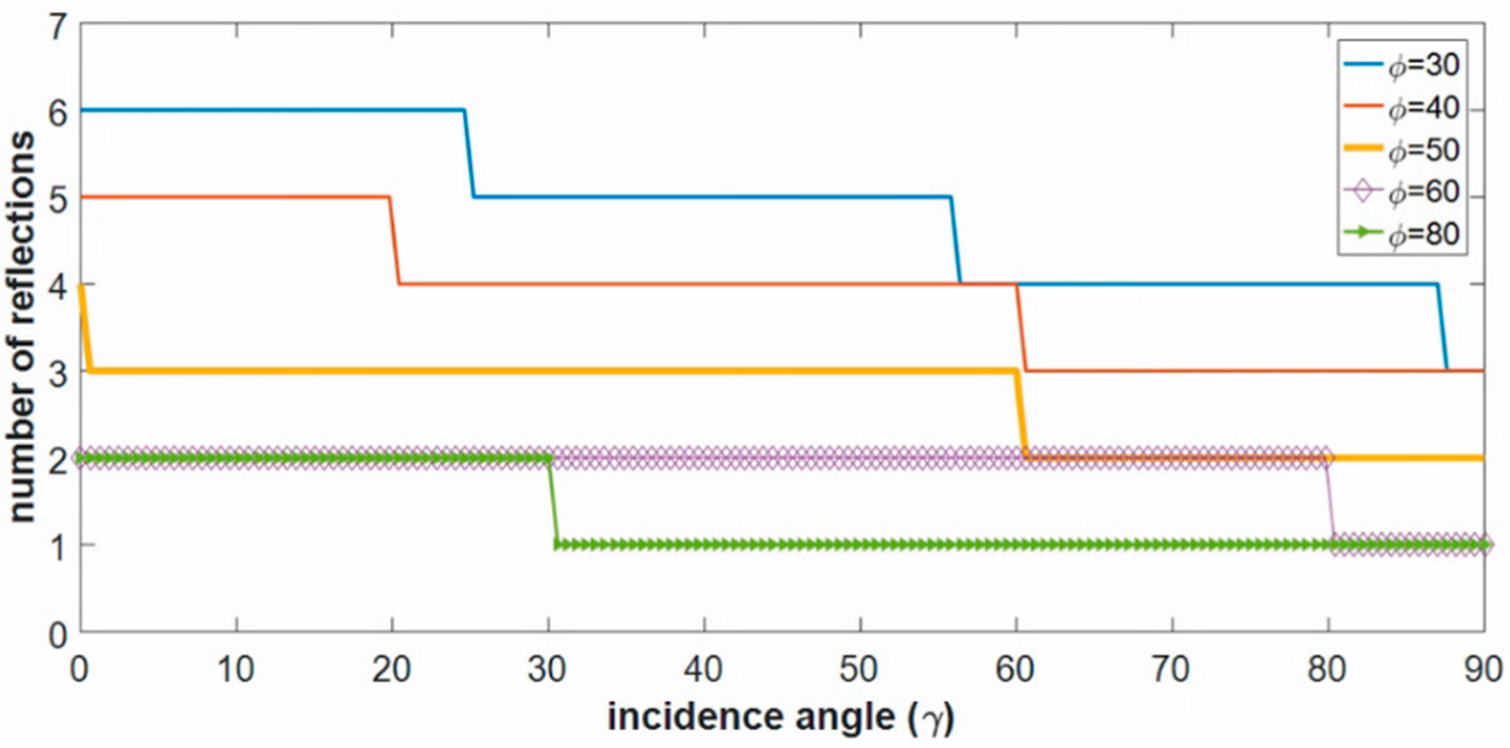
The study of the influence of the angle of incidence and the angle of the opening groove on the number of reflections have been performed. A parametric study on V-cavity has been done. At a first stage, the maximum number of reflections as a function of incident angles for different opening angles of the V-groove was calculated using Equation (7) and compared to our ray-tracing program. In this way, the maximum number of reflections that occur inside the cavity was recorded for different angles of the cavity.
Figure 7 reveals the evolution of the total number of reflections calculated. It was noted that the largest number of reflections occurs for the smallest opening angle. Furthermore, for a specific aperture angle the number of reflections that occur inside the cavity gradually decreases as the angle of incidence increases. For example, at
, a maximum of 6 reflections occur for rays of incidence angle
, and a maximum of 5 reflections occur for rays of incidence angle
, and when the incident angles increase to
, a maximum of 4 reflections occur inside the cavity.
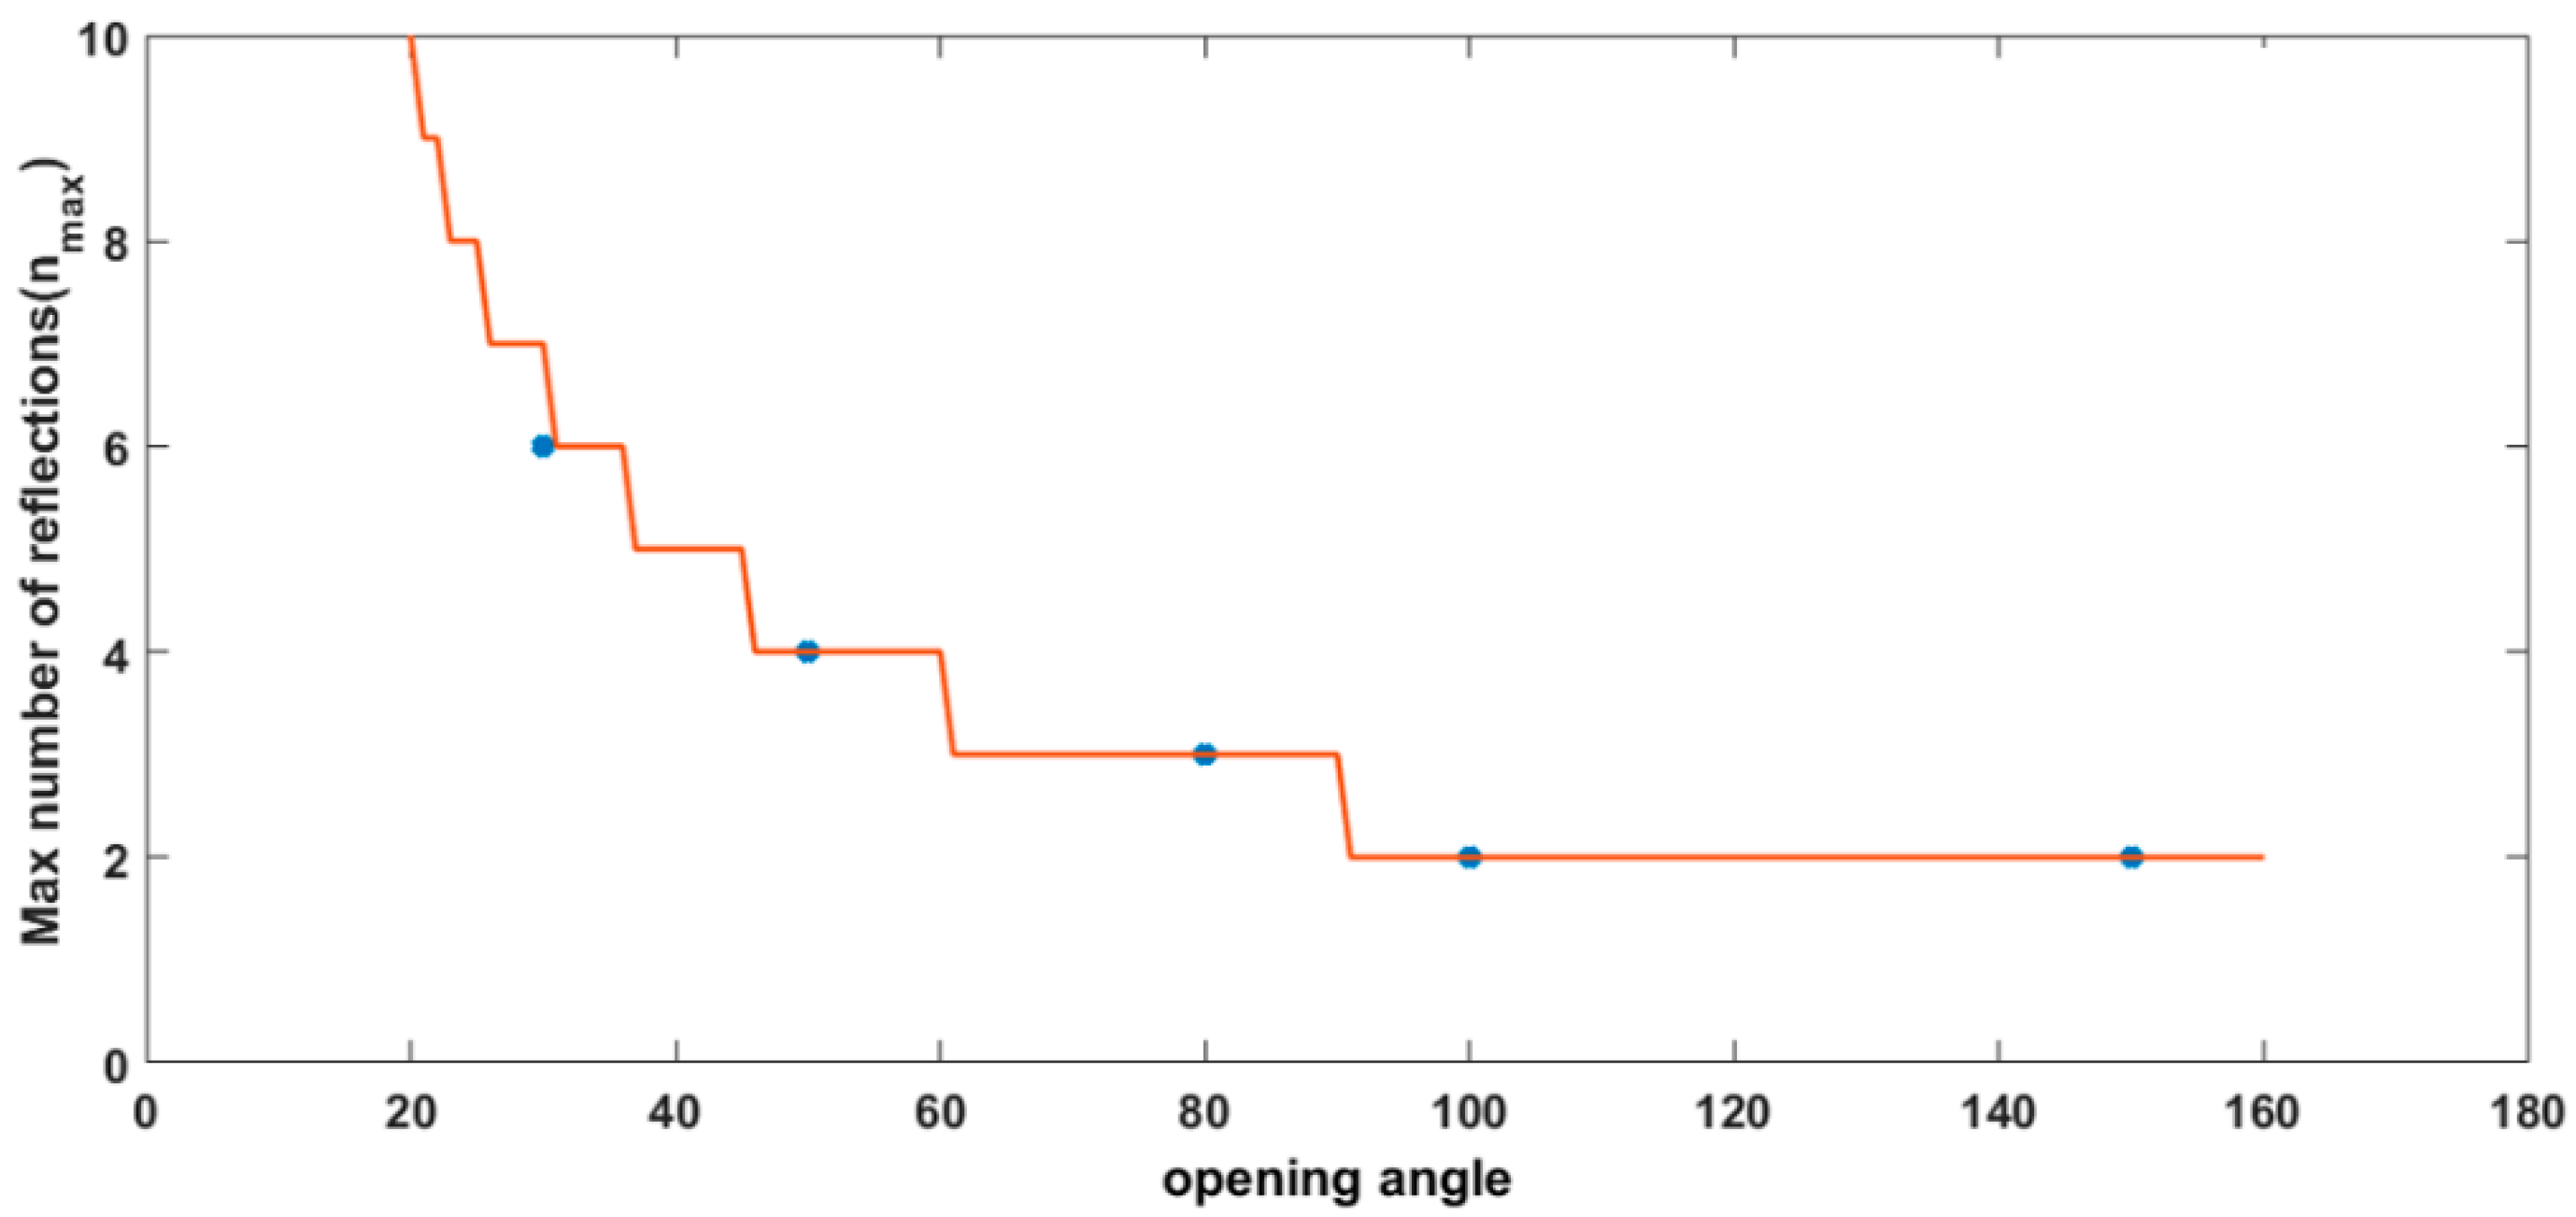
Figure 8 was obtained by recording the maximum total number of reflections that occur as a function of the opening angle, and for different emission angles inside the cavity. Obviously, it has been observed that as the opening angle increases, the number of reflections inside the groove gradually decreases. For instance, for a specific angle of 30°, a maximum of six reflections occurred within the groove, whereas when the angle increased to 100°, only two reflections were encountered.
4.2. Total Number of Reflections and Light-Matter Interaction
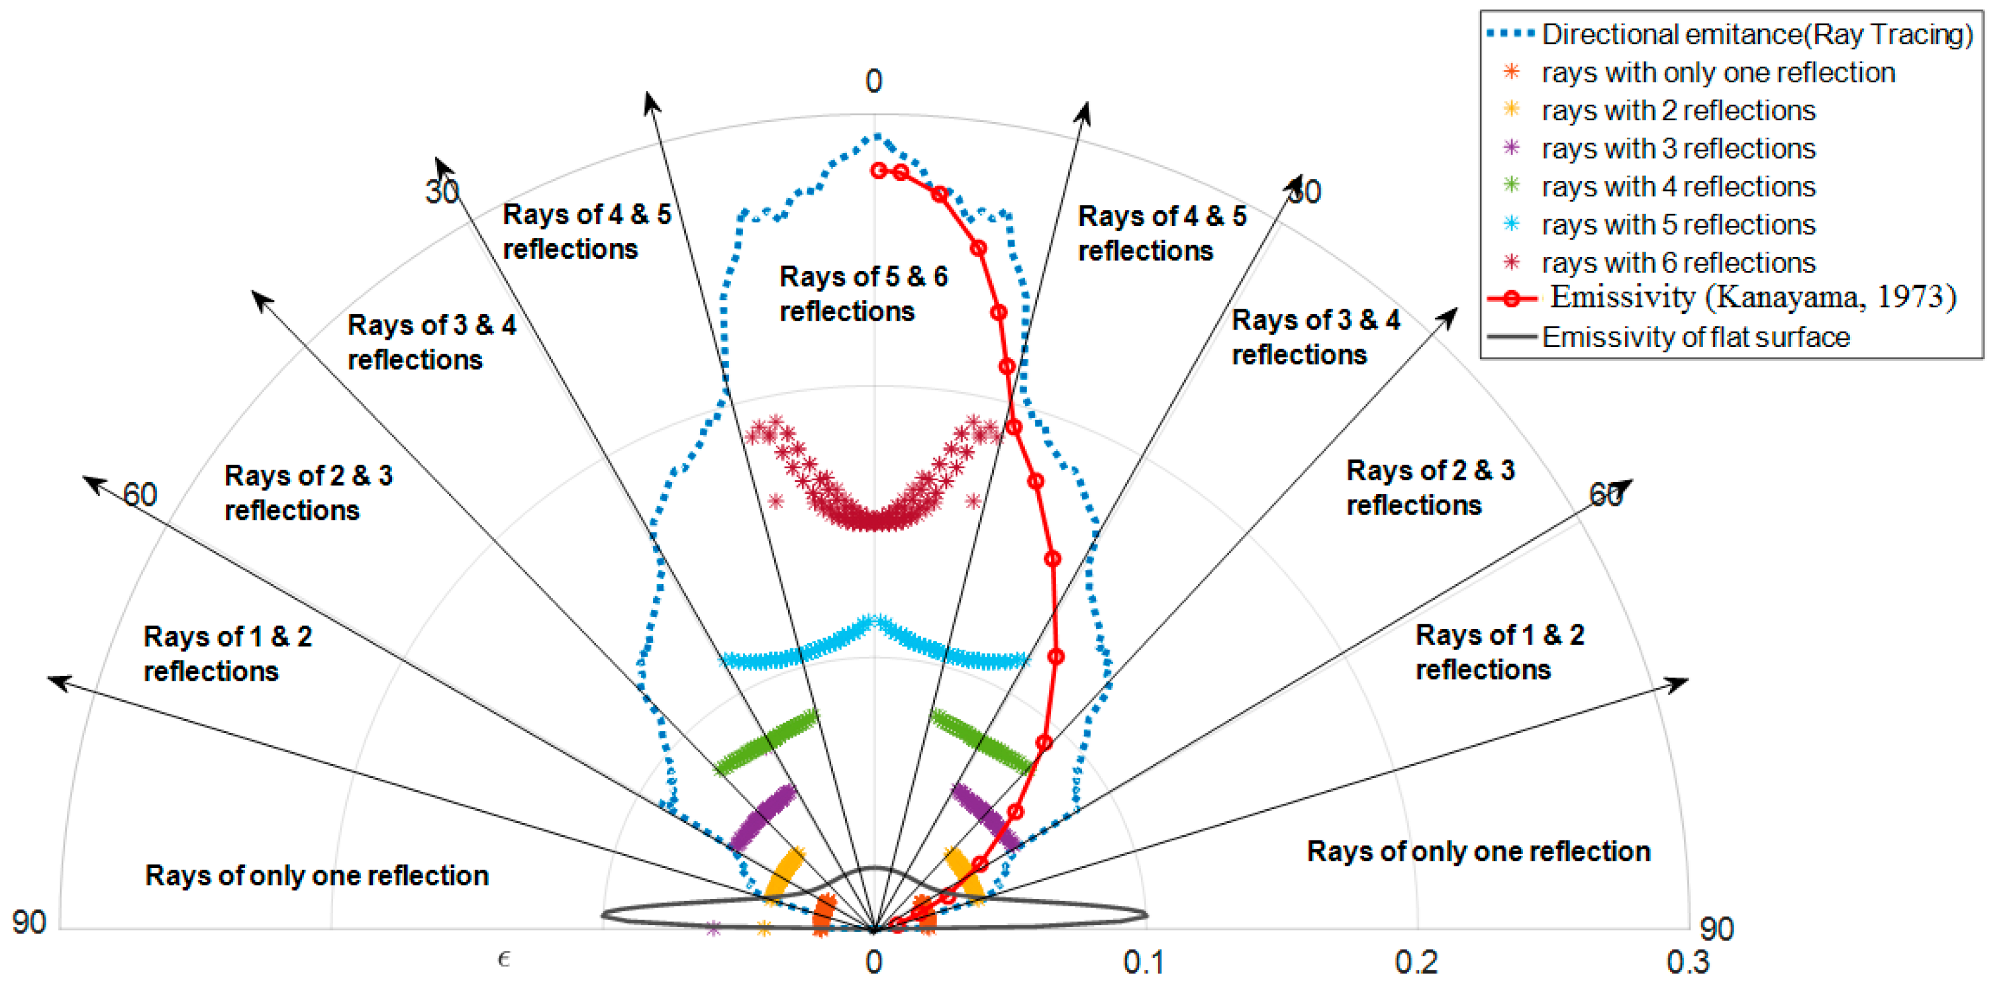
The components of the emission by considering the total number of reflections and the light-matter interaction are here presented. The total directional emissivity of the cavity depends on the number of reflections that occur within the groove. The emission components of the rays of different numbers of reflections have been calculated and show the influence of the number of reflections on the emission diagram for a typical V-groove.
Figure 9 shows the emission components of an aluminum V-groove for different numbers of reflections. Data for all rays of a single reflection inside the groove are extracted and considered to compute the polar diagram of the thermal emission. The same is done for the rays present in a second reflection, third, and so on. Then, the data of all the different reflection beams are collected alone. Finally, all data collected for a small solid angle are summarized. The maximum value of the emissivity (
0.19) occurs for rays of 6 reflections, and it decreases to a minimum value of 0.022 for rays with only one reflection which means that about 88.42% of the energy was absorbed by the cavity due to the 6 consecutive reflections.
4.3. Total Directional Apparent Emissivity
In the following, the total directional apparent emissivity is evaluated. The apparent directional emittance was calculated by summing the emission components of the different reflections as presented in
Figure 10 for a small solid angle. In order to validate our method, we compared our results to those of Kanayama [
12] and found a very good agreement. The directional variation of emission and reflection from different angles was accurately calculated and using ray tracing, all components of the reflection and emission were recorded as a function of angle of incidence. Finally, the emission components of the different reflections were summed in all directions to obtain the apparent emissivity of a groove with an opening angle
. The emissivity was enhanced from 0.022 to 0.28 in the normal direction by using an aluminum V-groove surface with a 30° opening angle compared to a normal flat surface.
4.4. Influence of the Opening Angle on the Thermal Emission Diagram
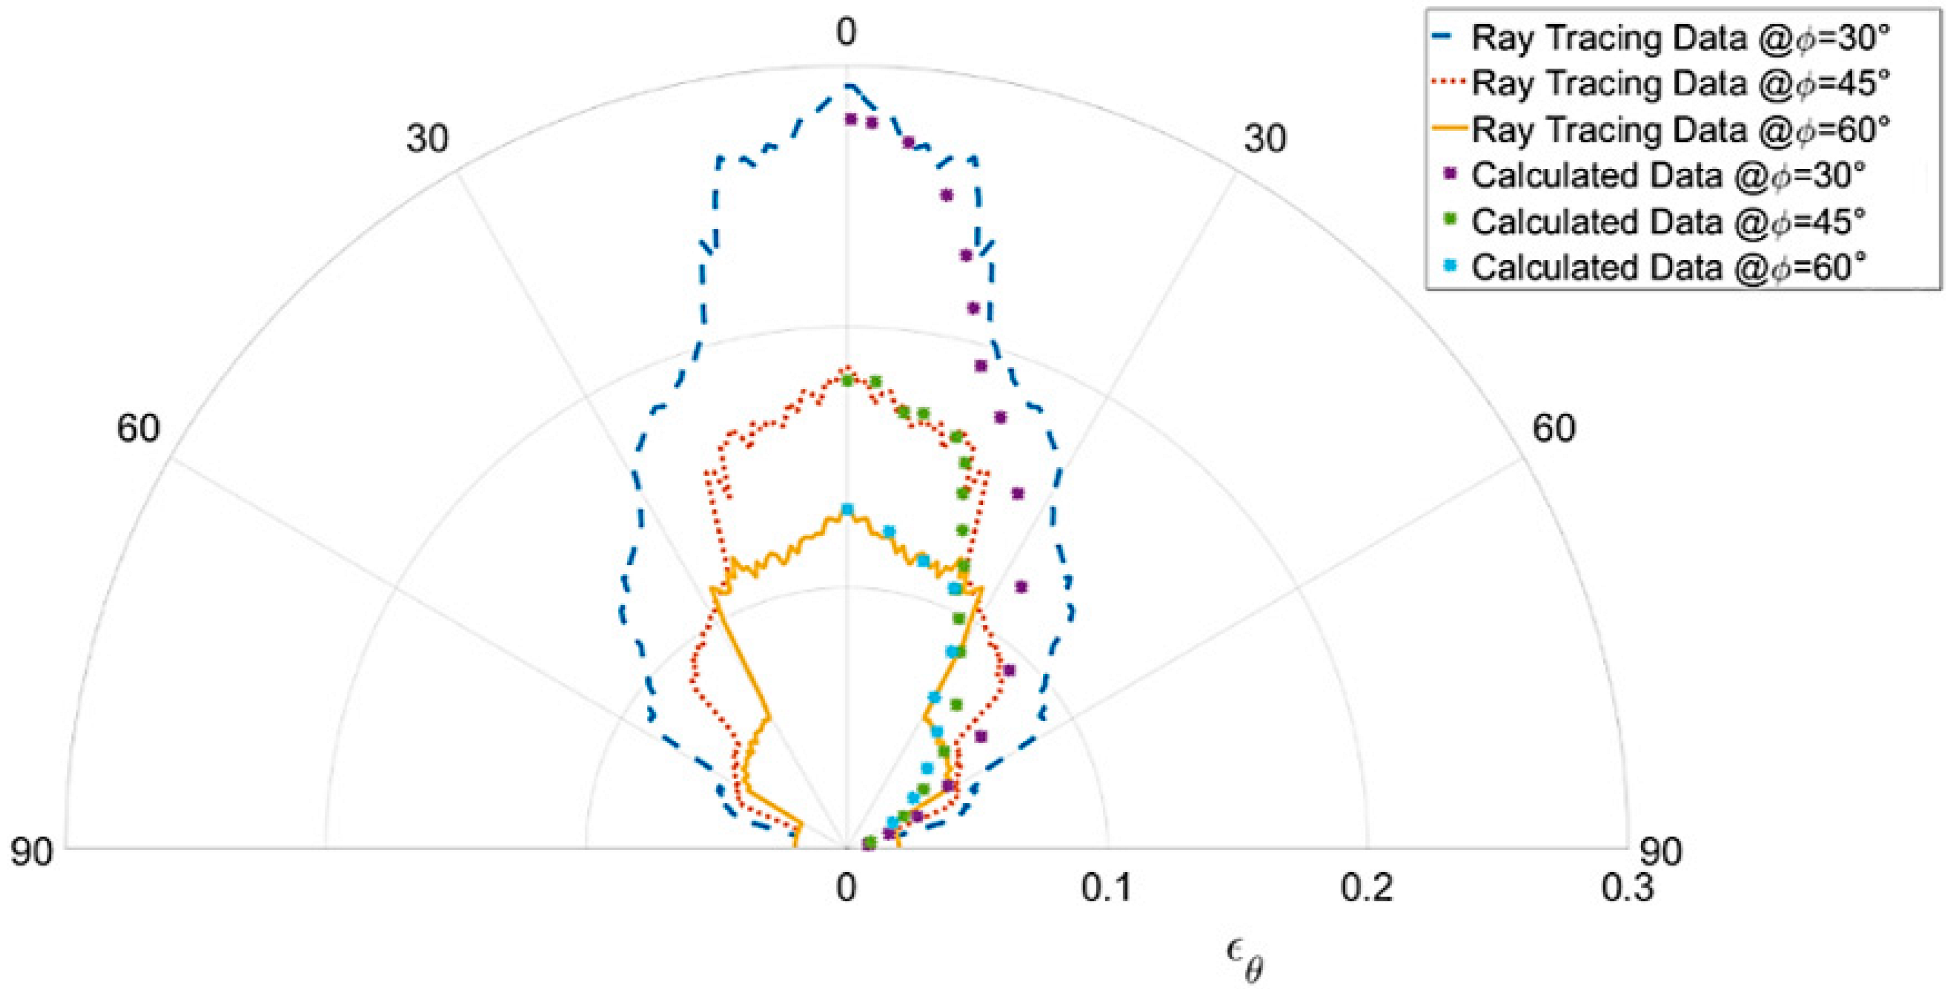
The influence of the opening angle on the thermal emission diagram is here studied. Several simulations of the aluminum V-groove were performed at different opening angles. The results from three different angles are presented in
Figure 11. It can be clearly seen that for the smallest angle between the sides of the groove, it tends to focus more energy in the normal direction.
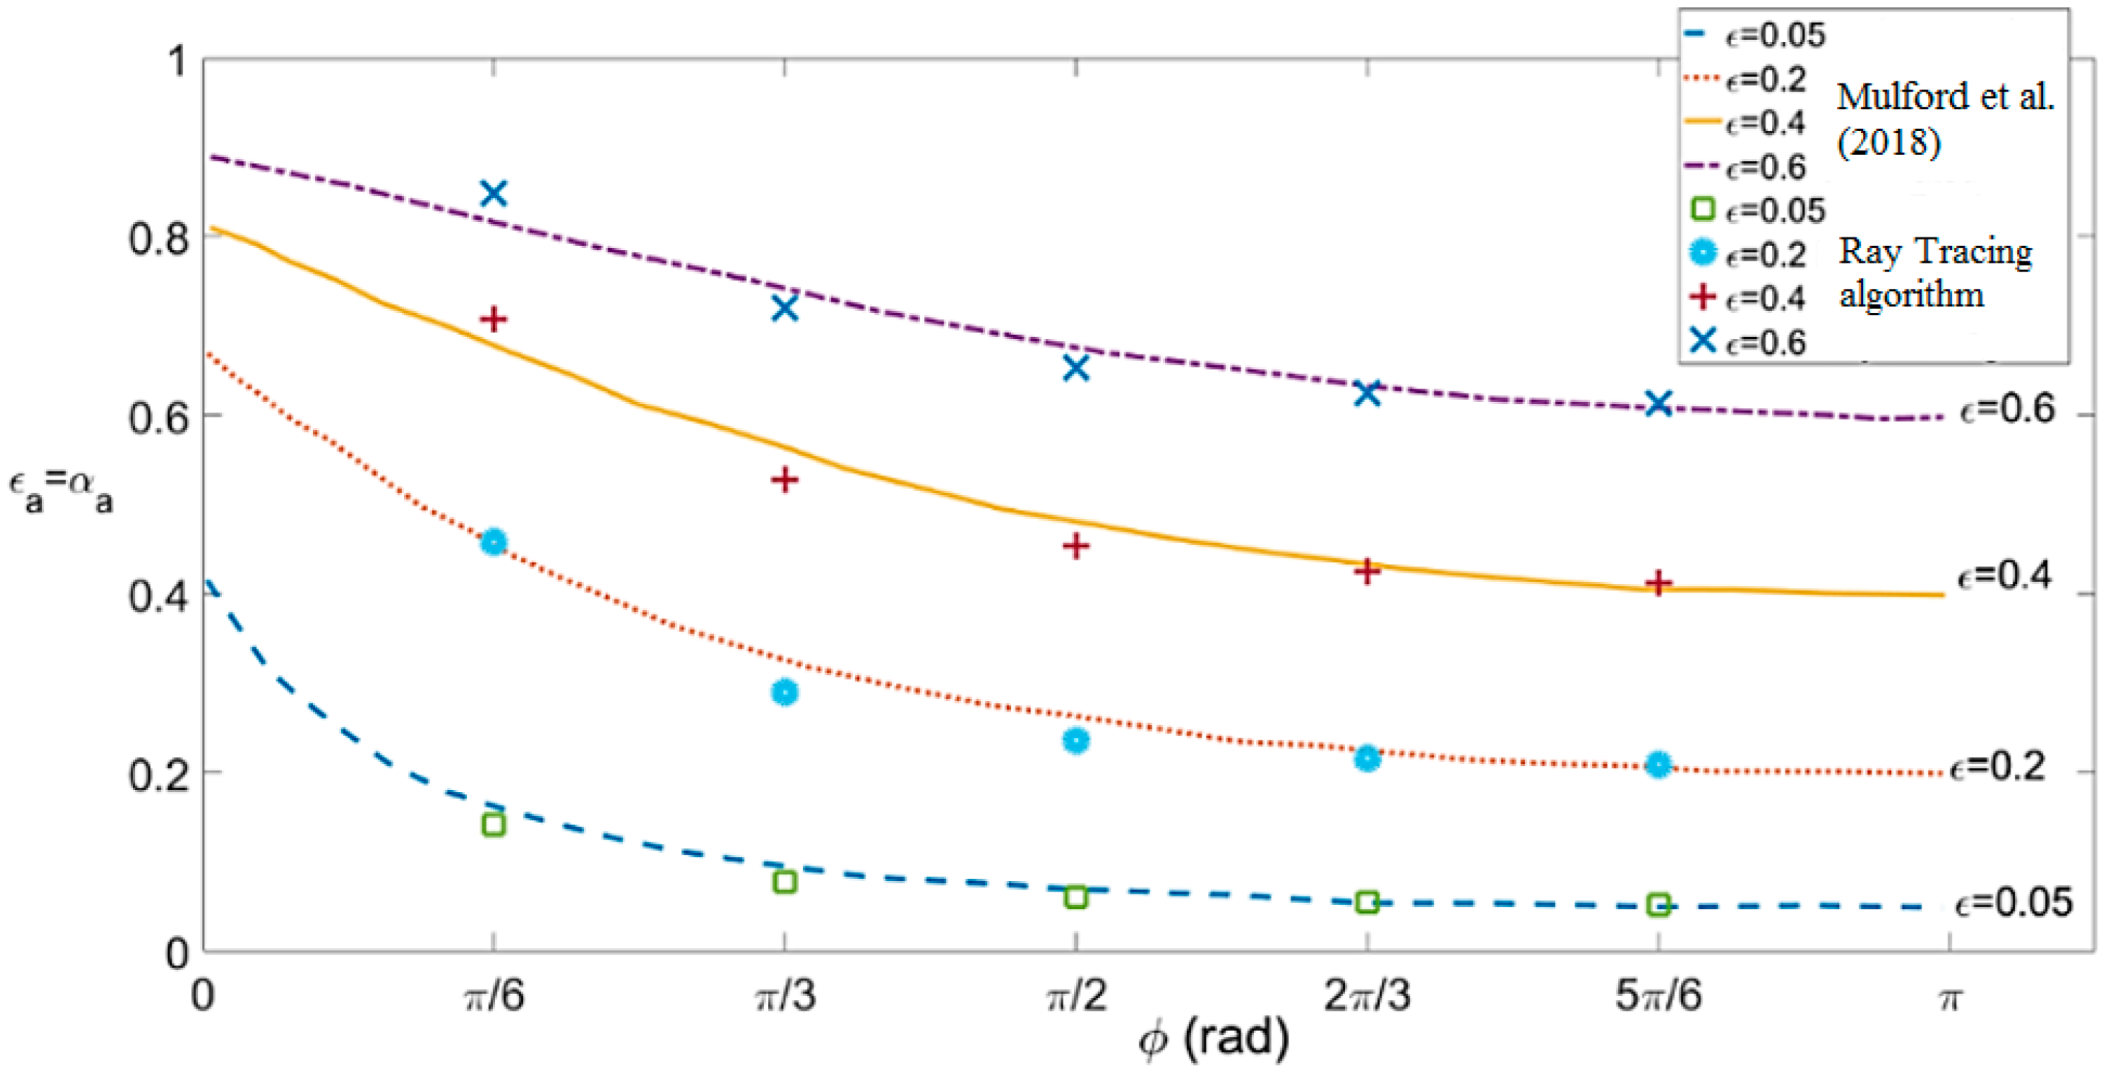
Figure 12 shows the results of the average apparent emissivity or absorptivity (
) of V-groove subjected to diffuse irradiation at different groove angles (
), calculated for different intrinsic surface emissivities
) [
13], and compared to the results obtained by our ray tracing algorithm. The emissivity of each side surface of the groove is assumed to be constant in all directions.
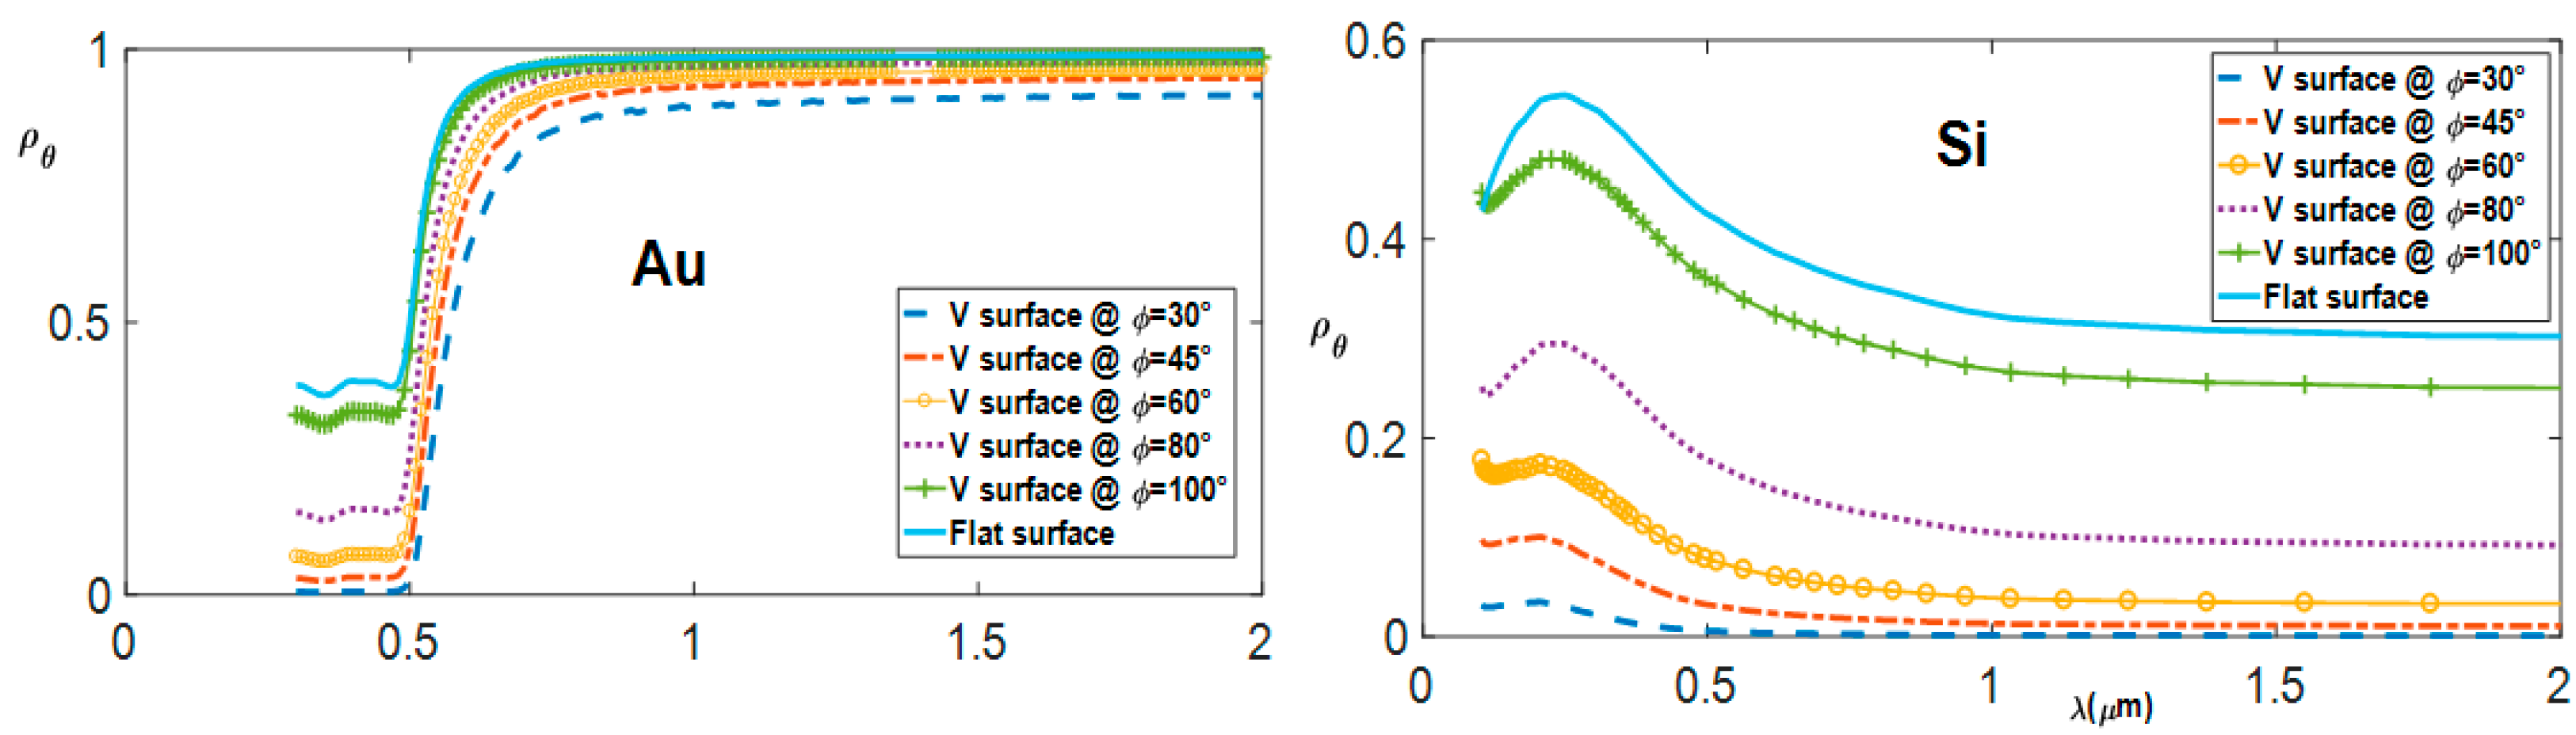
4.5. Comparison of Spectral Reflectivity
A comparison of the spectral reflectivity between symmetric V-cavities of different aperture angles and a flat surface is done in this section. After validation of the model, different simulations on a V-cavity with different aperture angles were performed, in order to study the spectral distribution of the reflectivity of V-cavities at different aperture angles.
Figure 13 depicts the spectral reflectivity results in the normal direction (
), of V-shaped surfaces at different angles and a flat surface, for two different study materials (Au and Si), respectively. By comparing the results in
Figure 12, we have highlighted that V-shaped surfaces always have a lower reflectivity than a flat surface, especially for small opening angles. In addition, for spectral regions of lower reflectivity, there is a greater decrease or decline in the reflective coefficient. For instance, the reflectivity of gold in the spectral band where
is 0.4 for a flat surface, whereas for a groove surface it gradually decreases from 0.33 to 0 as the angle of the groove decreases from 100° to 30°. While, in the other NIR spectral bands
, there is a slight decrease in the reflection coefficient, about 0.075 drop. This decrease is due to the consecutive reflections that occur inside the cavity, because for small angles of the groove, the number of consecutive reflections is high. Similarly, for spectral regions with low reflection coefficients, the absorption is higher than that of high reflection coefficients. Thus, for a higher number of consecutive reflections, there is a sharp increase in absorption, and this is the reason of a sharp drop observed in the reflection coefficient in these regions, in contrast to the other high reflection coefficient region.
4.6. Influence of Parameters on the Reflection and Directional Emission Diagram
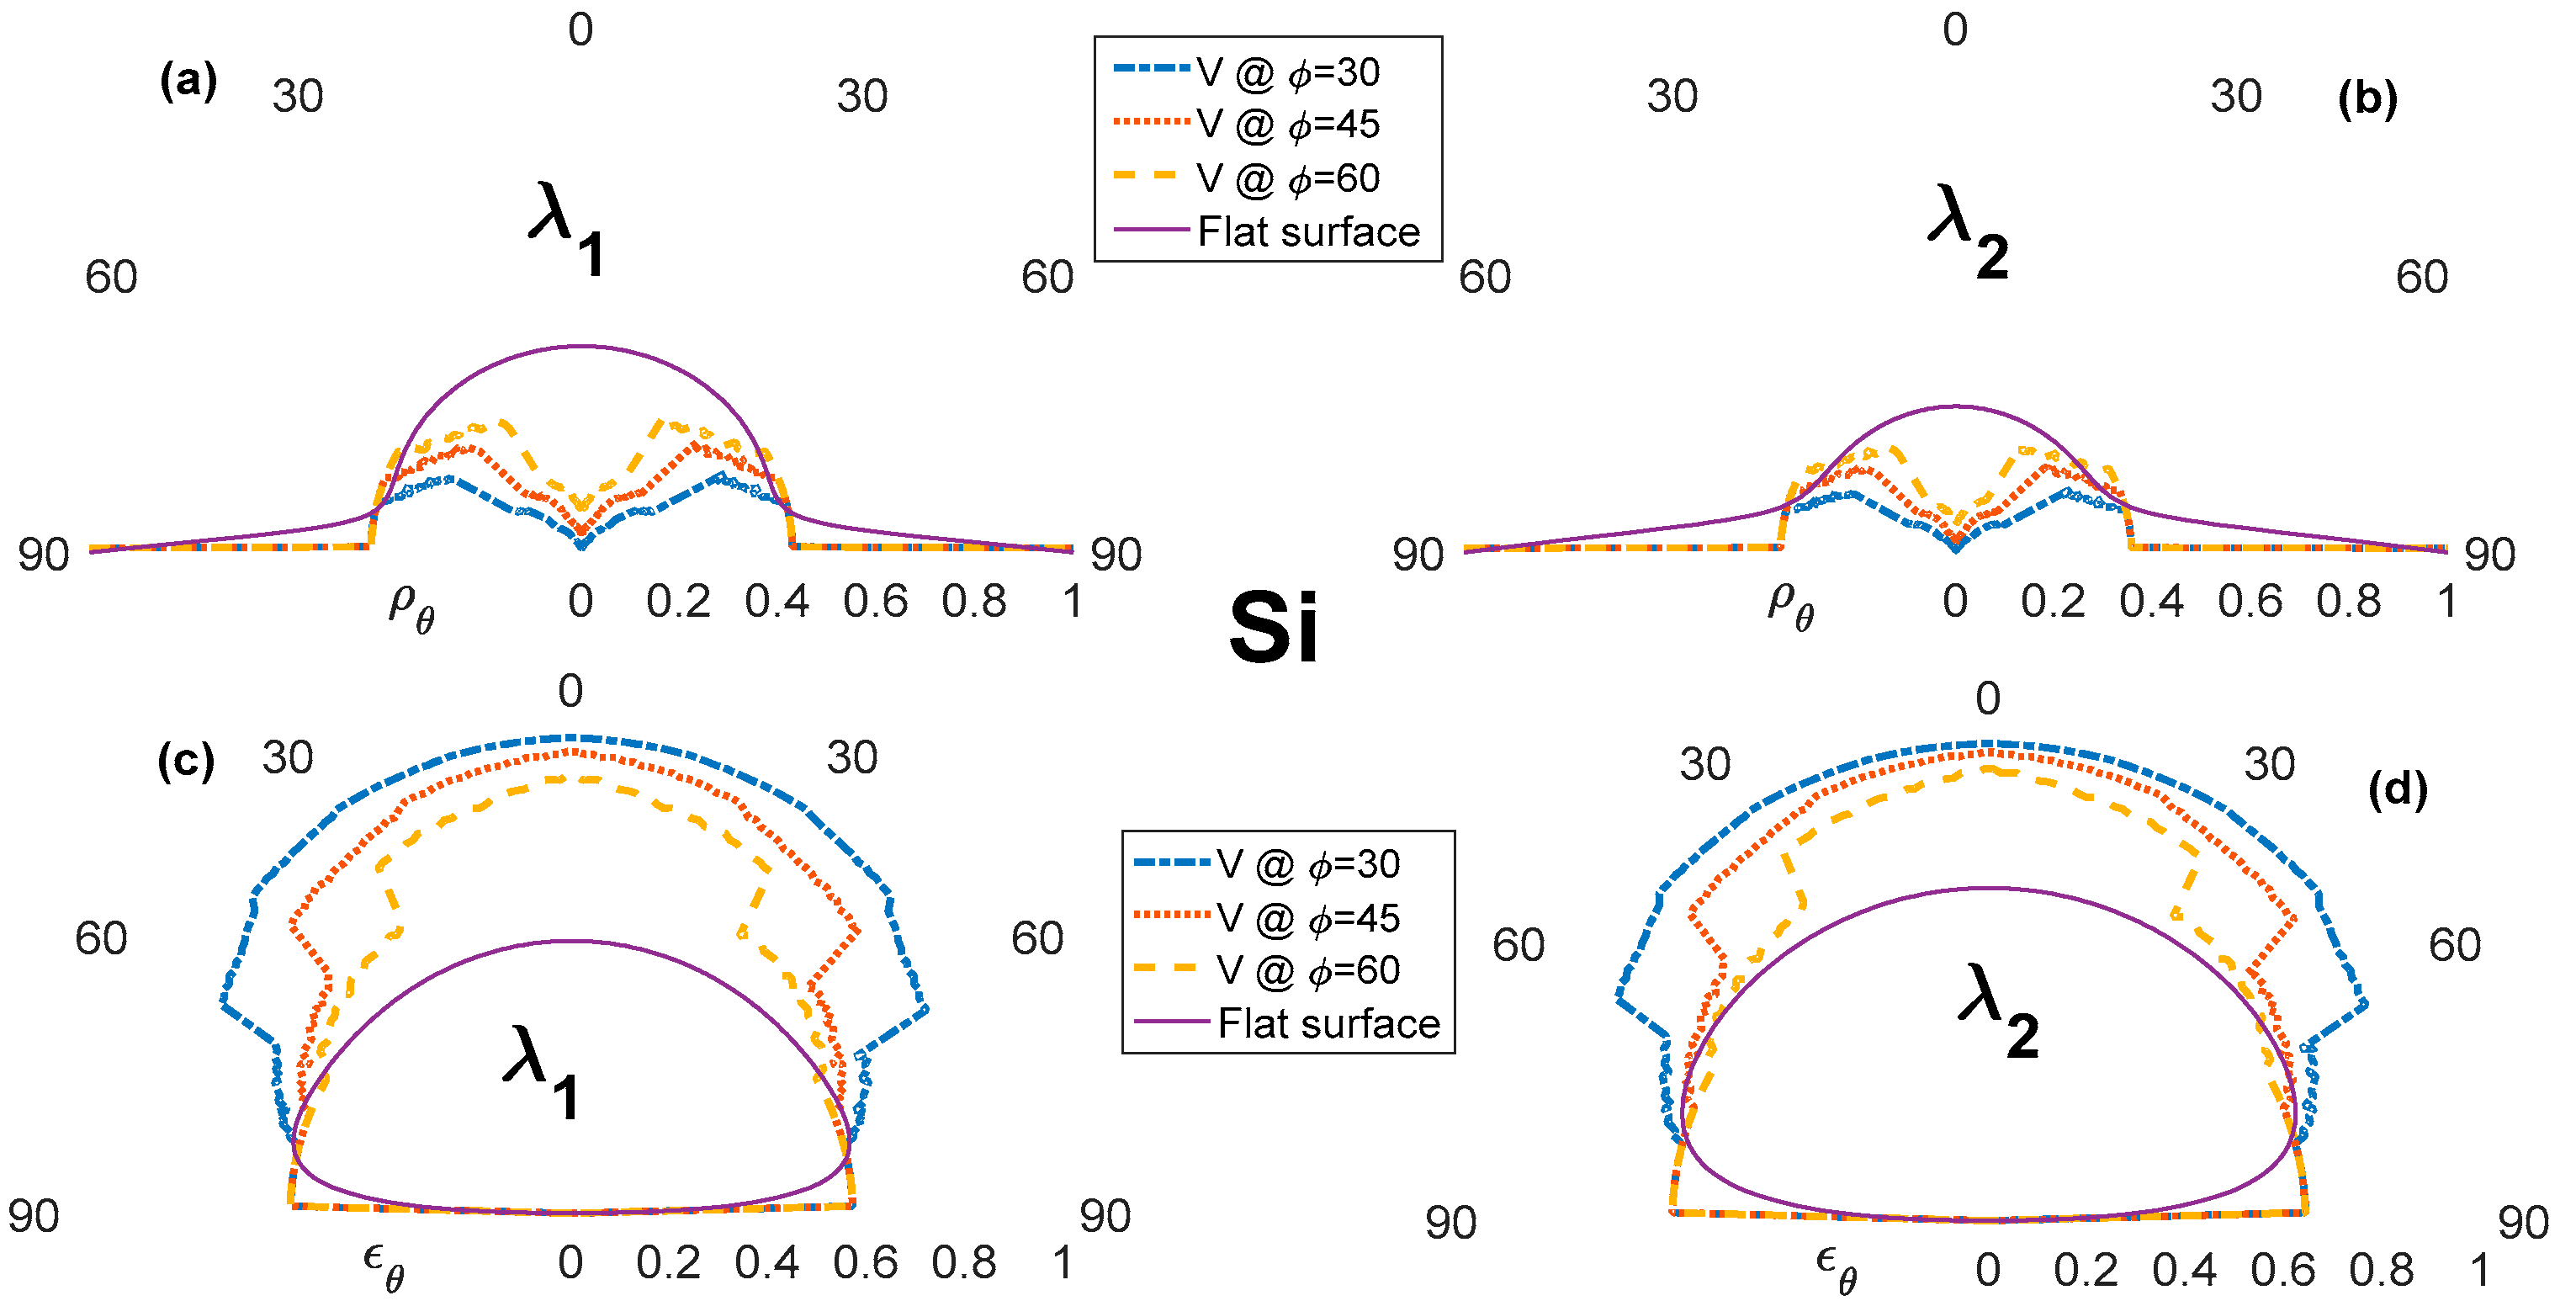
The influence of spectral distribution and opening angle on the directional reflection and emission diagram of symmetrical V-shaped cavities has also studied. The results for Au and Si are presented in
Figure 14 and
Figure 15. Each Figure presents four polar diagrams; (a) and (b) are for the directional reflectivity in the two spectral regions
respectively, (c) and (d) are for directional emissivity in the two spectral regions
, respectively. Each material has different directional behavior for the different spectral bands. Comparing the results of the V-shaped surface and the flat surface, it can be seen that the use of a V- shaped surface leads to a decrease in directional reflectivity in all directions and in all spectral bands, especially in the normal direction with small aperture angles.
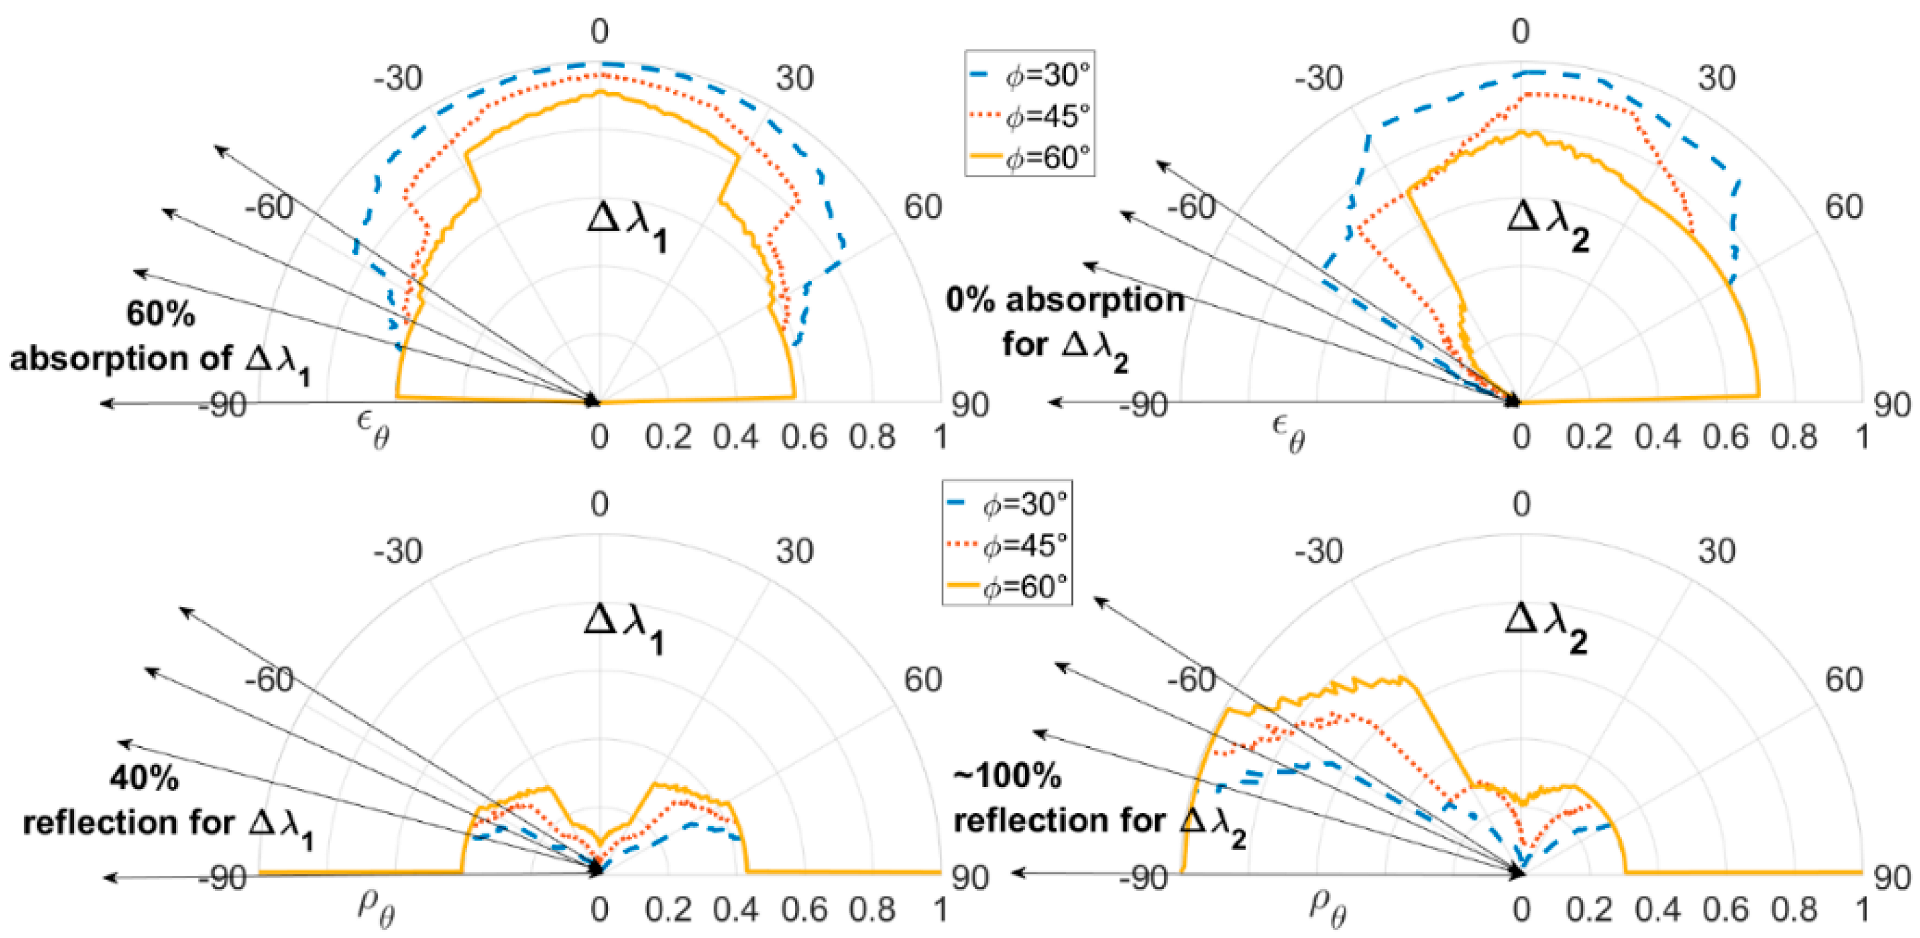
4.7. Design of Asymmetric Materials
Directional thermal emission can be controlled by using an asymmetric V-groove materials design. The structure is depicted in
Figure 16. Our model was used to simulate the radiative behavior of an asymmetric sided V-groove cavity, composed of the good conductor (Au) and the dielectric (Si), and presented in
Figure 16, in the spectral of wavelength range between 0.1 and 2 µm. These two materials are available in micro technology and could be easily implemented in more elaborate structures, in particular to define optimized assemblies to separate angularly the wavelengths, infrared and visible range for example.
For
Figure 17, calculations were performed on two parts of the solar spectrum
, and for different cavity opening angles
. As expected, they show an asymmetric emission in the second wavelength band
, which is distributed in different directions depending on the opening angle. Compared to the directional emission distribution of the two spectral bands, we see that there is an angular separation for these bands. For instance, for an opening angle of 30°, there is 60% absorption and 40% reflection for the first spectral band
in the angular range
, while there is no absorption for the second spectral band
, and about 100% of this band reflected in the same angular range. This means that this surface is able to absorb 60% of the first spectral band and reflect all the other bands in a specific angular direction. These combinations of material in a V-shaped surface are able to separate angularly two different spectral bands by absorption and reflection.
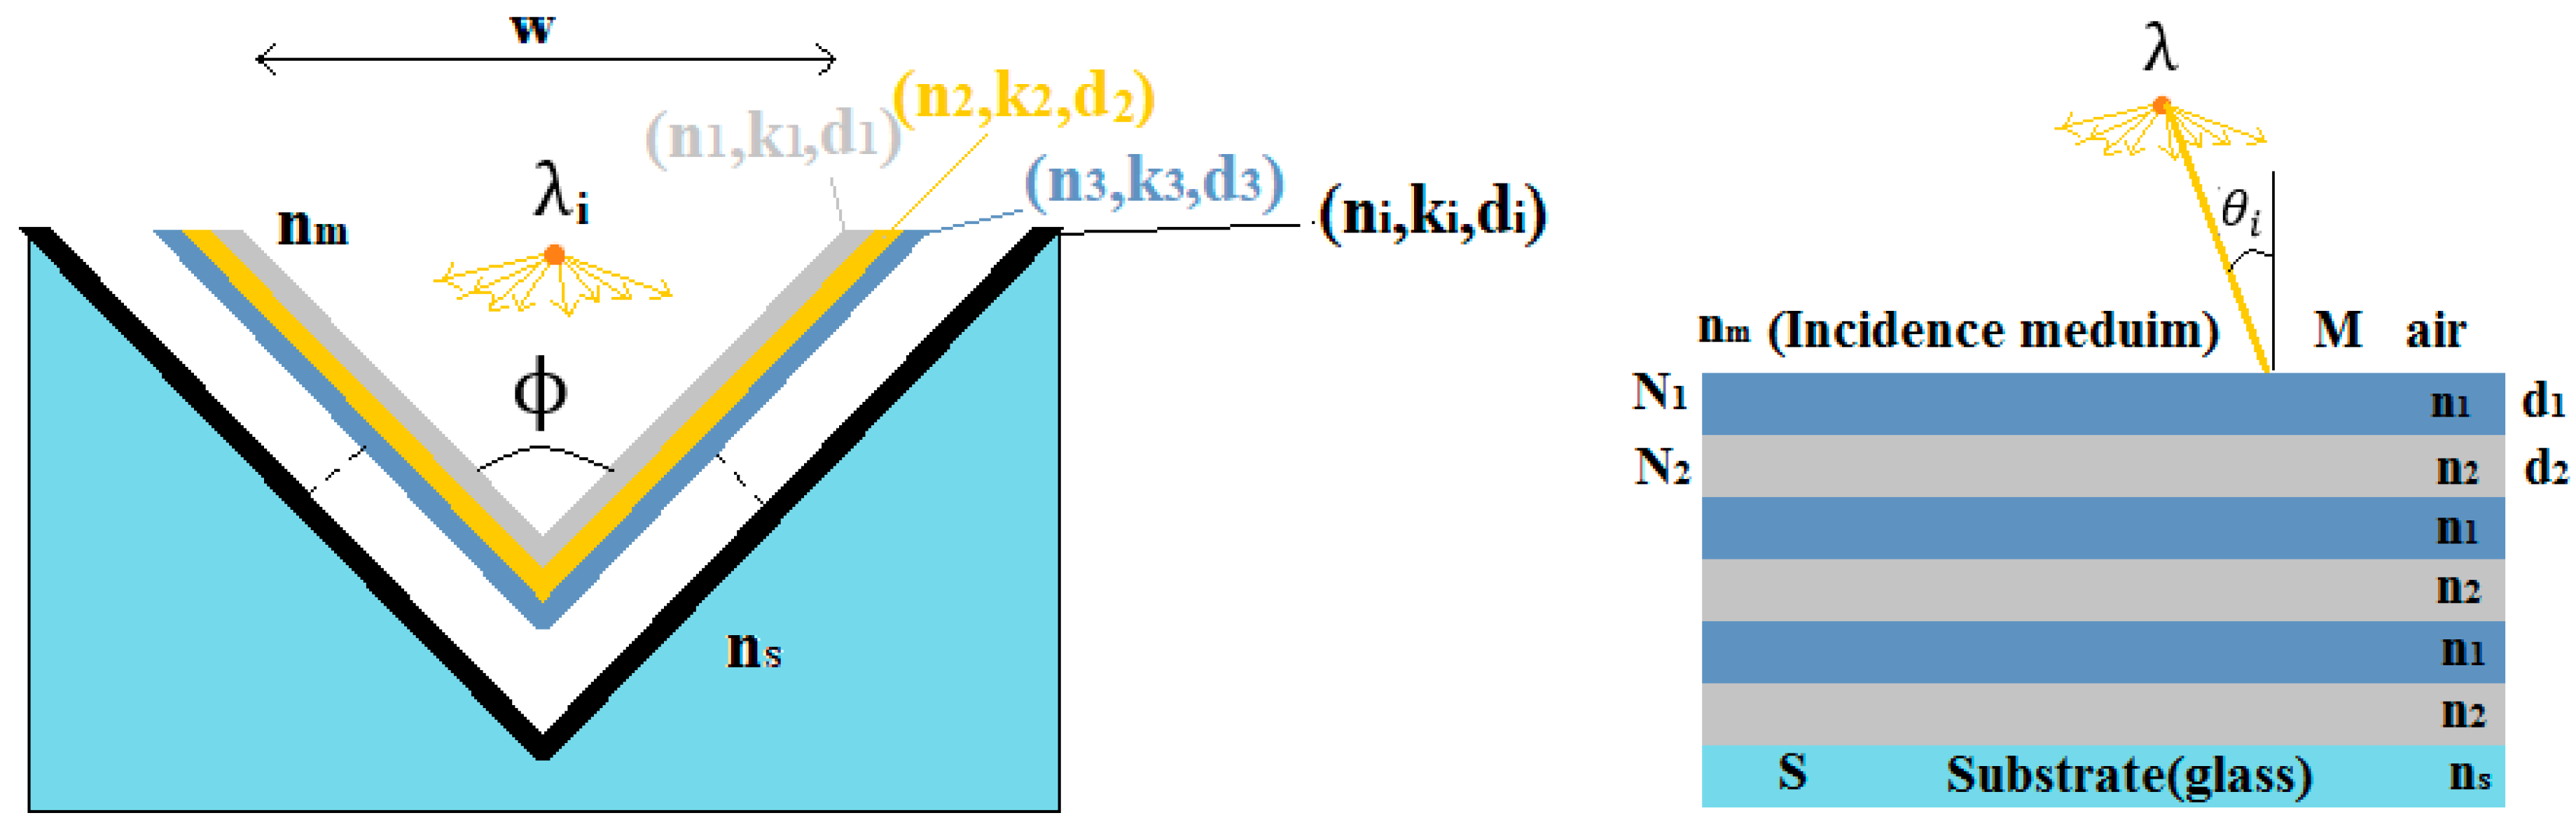
4.8. Multilayers on the Facets of a V-Groove
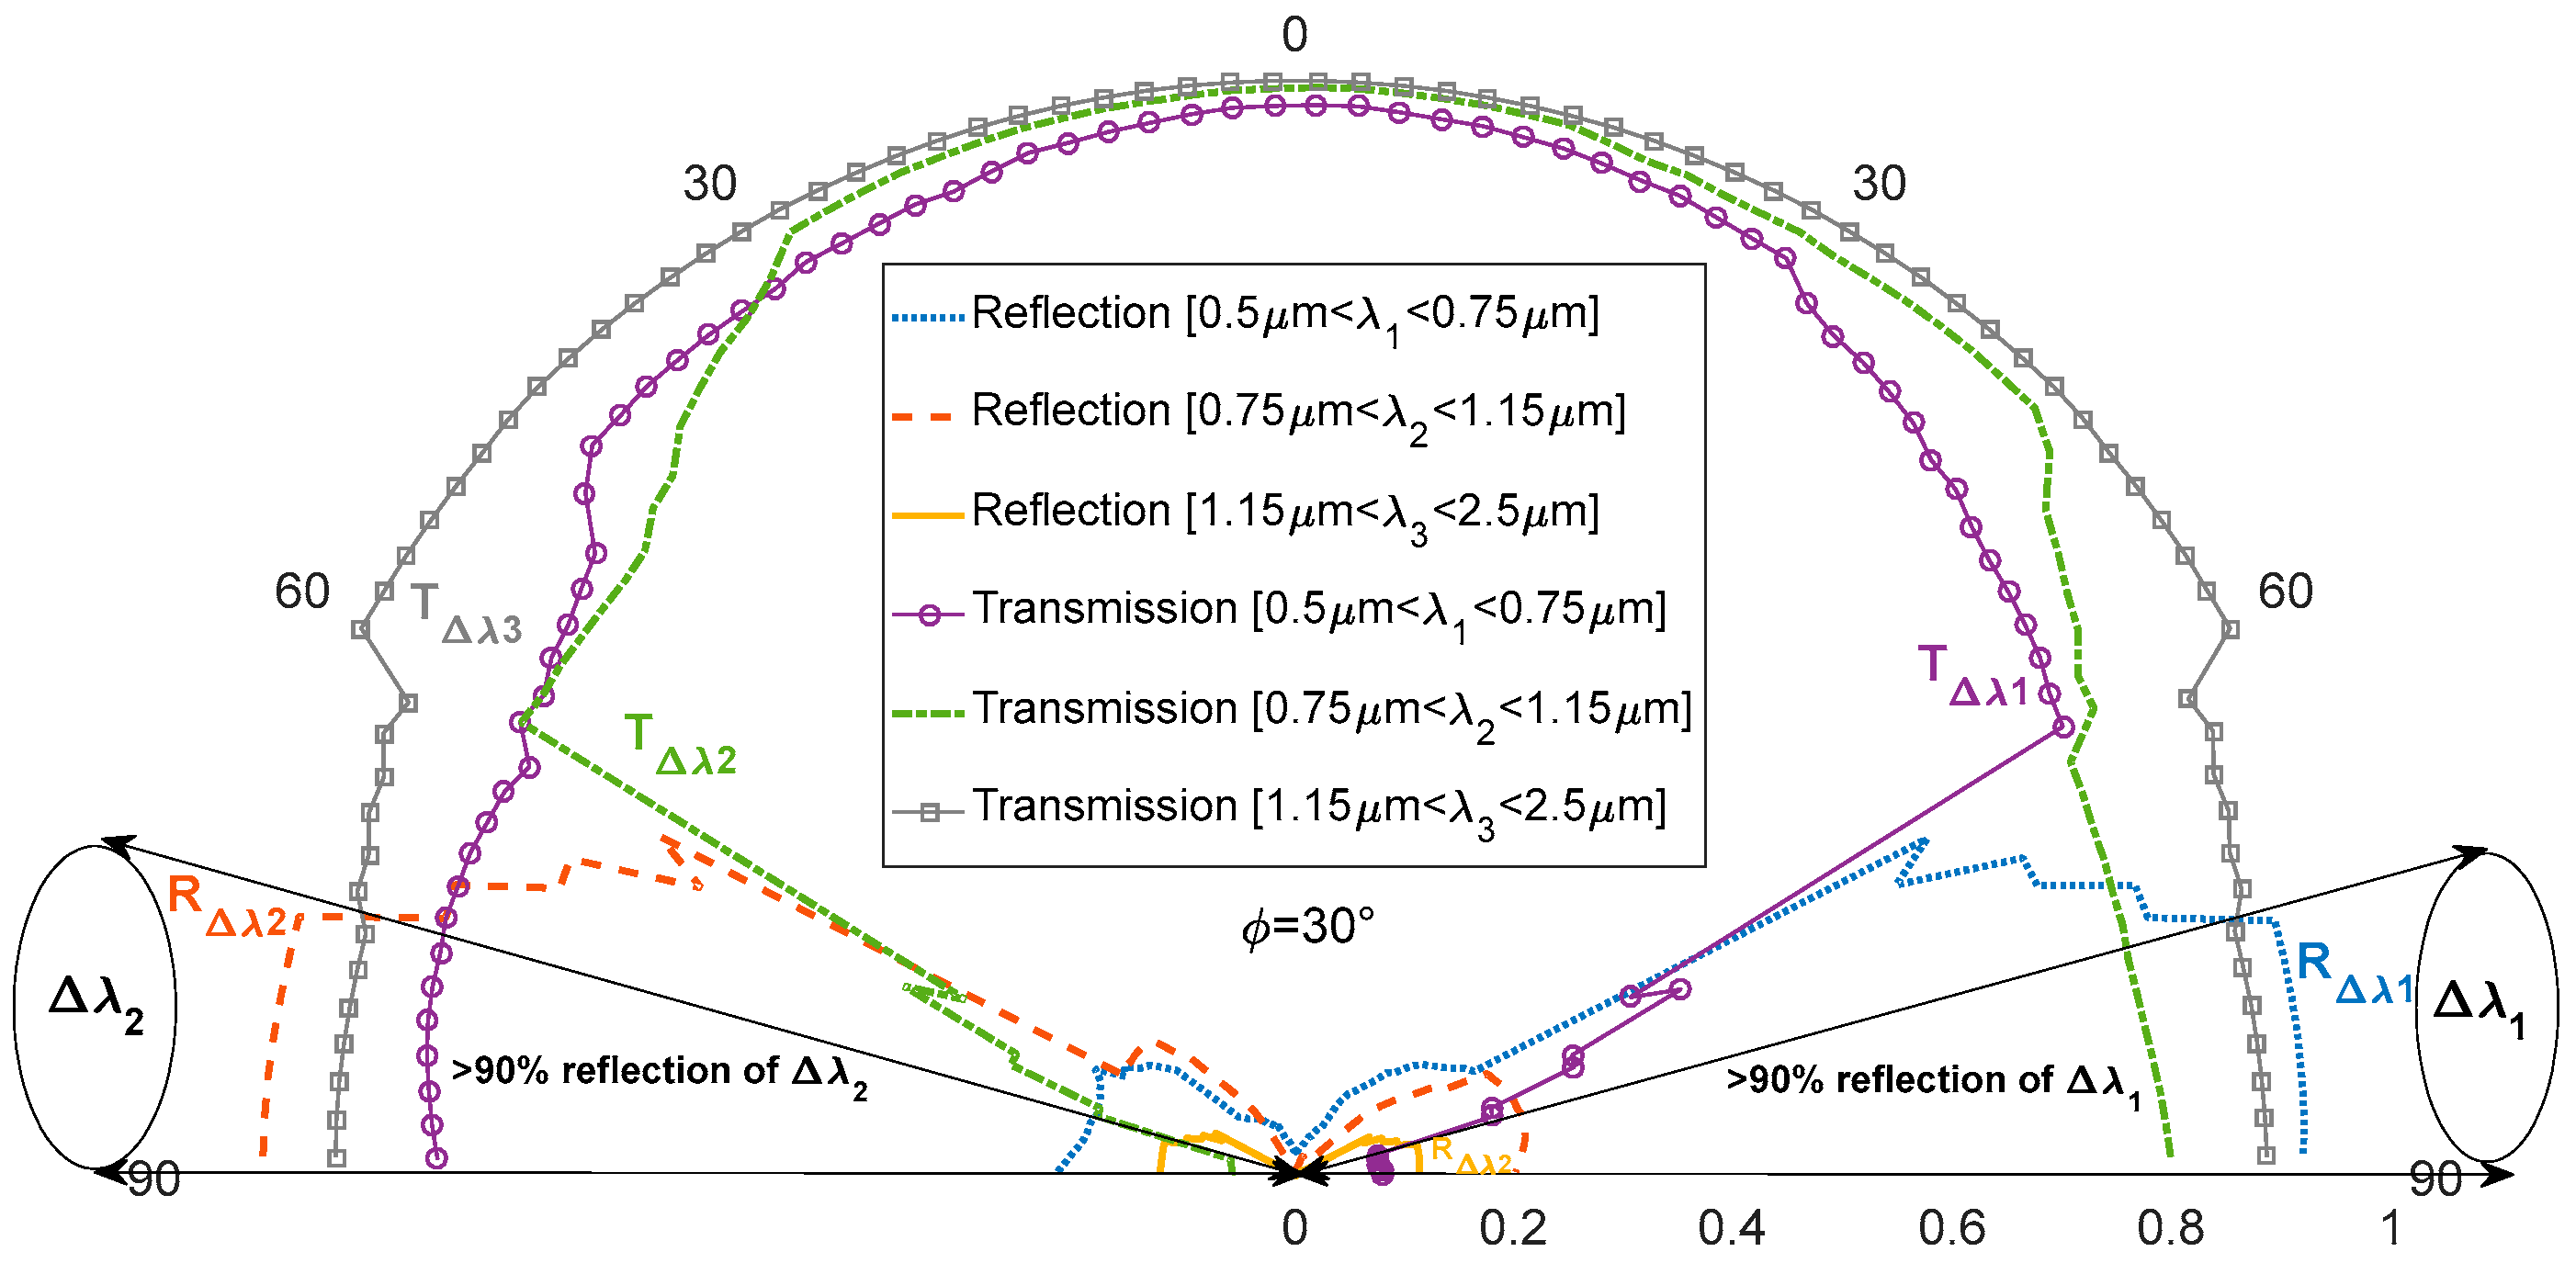
In order to well separate the solar spectrum, we used the model shown in
Figure 5. We have alternated the stacking of layers with refractive indices of 2.36 and 1.38 on a glass substrate (n = 1.52) and we have calculated separately for the main regions of the solar spectrum, for an opening angle equal to 30°.
Figure 18 reveals that the angular separation for the reflection between the visible range (λ between 0.5 and 0.75 µm) and the near infrared range (1.15 µm > λ > 0.75 µm) is excellent. Indeed, the reflection is about 90% in the direction for the visible range (between 75° and 90°) and about 90% in the direction between 0° and 25° for the near infrared range. It is then possible, for example, to redirect the solar energy to the right for photovoltaic cells (visible) and to the left for water heating (near infrared).
5. Conclusions
In this paper, we have discussed and presented a way to calculate the reflection and emission diagrams of V-grooved surfaces, using an algorithm dealing with the different reflections that occur in a V-groove for different angles, materials and at different wavelengths. A Matlab program has been developed for this purpose. It allows to model the emission of different rough surfaces (sloped surfaces) and complex periodic structured surfaces simulated for different dependent parameters (geometrical aperture, materials combinations with respect to the spectral bandwidth separation). It is very interesting to study the emission from these surfaces, since they could play an important role in thermal management by controlling the thermal emission in a directional or spectral. Simulations of a V-groove showed that due to the different reflections occurring inside an aluminum V-cavity with an aperture angle of 28°, the emissivity was well enhanced by 86% in the normal direction compared to a flat surface made of the same material. In addition, it was demonstrated that by using original asymmetric opposite-sided materials (Al and Si) in a V- groove, it was possible to separate and control the emission by focusing the radiation or directing different spectral bands in different directions depending on the opening angle of the cavity.
Moreover, with the algorithm, we are able to simulate different wavelength ranges (Visible, and near infrared), and different complex surface designs (asymmetric sides, circular cavities, and multiple thin films), which will be crucial to find, compare, and then design spectrally selective surfaces. That is useful for directional and spectral control of thermal emission, and for improving the collection performance of solar electromagnetic radiation by separating different parts of the solar spectrum in different direction. The separation of the solar spectrum, using multilayer stacks on the both sides of the V-groove, is evidenced in this paper.


 ,
, 