Article

Efficient Supervised Machine Learning Network for Non-Intrusive Load Monitoring

by
Muhammad Usman Hadi
1,*,
Nik Hazmi Nik Suhaimi
1 and
Abdul Basit
2
1
School of Engineering, Ulster University, Newtownabbey BT37 0QB, UK
2
Department of Computer Engineering, Khawaja Farid University of Engineering and Information Technologies (KFUEIT), Rahim Yar Khan 64200, Pakistan
*
Author to whom correspondence should be addressed.
Technologies 2022, 10(4), 85; https://doi.org/10.3390/technologies10040085
Submission received: 19 April 2022 / Revised: 23 May 2022 / Accepted: 14 July 2022 / Published: 16 July 2022
(This article belongs to the Special Issue 10th Anniversary of Technologies—Recent Advances and Perspectives)

Abstract

:
From a single meter that measures the entire home’s electrical demand, energy disaggregation calculates appliance-by-appliance electricity consumption. Non-intrusive load monitoring (NILM), also known as energy disaggregation, tries to decompose aggregated energy consumption data and estimate each appliance’s contribution. Recently, methodologies based on Artificial Intelligence (AI) have been proposed commonly used in these models, which can be expensive to run on a server or prohibitive when the target device has limited capabilities. AI-based models are typically computationally expensive and require a lot of storage. It is not easy to reduce the computing cost and size of a neural network without sacrificing performance. This study proposed an efficient non-parametric supervised machine learning network (ENSML) architecture with a smaller size, and a quick inference time without sacrificing performance. The proposed architecture can maximise energy disaggregation performance and predict new observations based on past ones. The results showed that employing the ENSML model considerably increased the accuracy of energy prediction in 99 percent of cases.

1. Introduction

Artificial Intelligence (AI) has grown fast in recent decades, and it is no longer confined to science fiction literature and films. By 2030, AI is quite likely to exceed humans in the majority of cognitive skills. According to the World Economic Forum’s latest study on the future of jobs, AI will create 58 million new jobs by 2022. Home automation is now used largely to provide a quick and efficient manner of integrating and connecting household equipment. AI may be used in a variety of ways, such as monitoring our daily utilisation of current or voltage in each device in a building. As an example, in a recent article, AI-generated simulations were demonstrated using MATLAB/SIMULINK.
AI is the greatest option for handling big data flows and storage in Internet of Things (IoT) networks [1]. Energy Efficiencies (EE) can provide a slew of benefits to energy customers and providers as a result of IoT demand. In 2011, homes utilised 21.54 percent of total energy consumption in the United States [2]. This solution is meant to minimise energy usage by utilising powerful optimisation algorithms to establish a better resource management system and flatten consumption peaks for each home.
Energy management systems to regulate peak energy demand [3] are examples of new technologies that have been developed to enhance EE. With a population of 67.22 million (2020), increasing the overall efficiency of the electricity grid by boosting EE in residential areas may be crucial [3]. Furthermore, giving precise information on the energy use of consumer appliances will enhance the EE. When considering the disaggregation of load consumption and the increased energy awareness of particular equipment, users can change their consumption behaviour, replace equipment, or install energy management systems to save energy or money [3,4].
The development of new buildings in cities throughout the world has transformed dwelling arrangements and boosted the demand for end-use appliances with energy conservation and control [5]. Furthermore, the move was accompanied by Smart Meter (SM), which enabled the computation of individual appliance power usage based on the building’s aggregate measurements. The placement of current and voltage sensors at the SM is used to monitor energy usage and identify loads in a load disaggregation system [6]. This framework is far more proficient than the old intensive monitoring systems because it can reduce installation costs. By analysing the energy usage of each major appliance, inefficiencies in energy consumption of large appliances may be identified and eliminated [7]. These apps will provide useful information on the appliances that are being utilised. Figure 1 shows a categorical hierarchy of load disaggregation classes.
Load disaggregation is divided into two categories: hardware techniques and software approaches. Hardware-based techniques are simple to create, but they are limited by a number of factors, including implementation cost, reliability, and scalability. As a result, because it uses non-intrusive load monitoring, the software-based solution is preferred. Using a single primary metering point to aggregate load usage and dissect it into individual appliance use has grown common in recent years [8]. The benefits of adopting SM include (i) accurate billing; (ii) detecting defective appliances; and (iii) receiving detailed information on current appliance consumption.
Housing arrangements across the world have changed as a result of increased urbanisation, necessitating the development of high-rise buildings. Changes in dwelling patterns have also resulted in a system for breaking down the building’s aggregate energy use at the appliance level. It is now feasible to estimate an appliance’s energy use based on a building’s overall energy data using smart meters [5].
Hart established a system in the 1950s that disaggregated electrical measurements such that the power consumption of each device could be discovered sequentially by reviewing load data gathered over time [9]. The suggested approach was deemed non-intrusive because no equipment had to be put on the customer’s premises. The aggregated energy usage statistics may be gathered from the building or residence’s main electrical panel. The separation of the total home construction data into its key energy components is a broad objective of this approach. Appliance monitoring may be conducted in two ways: intrusive appliance monitoring (ILM) or non-intrusive appliance monitoring (NIAM). NIAM, also known as Non-Intrusive Load Monitoring (NILM), is a technique for calculating energy disaggregation that may calculate device-specific energy disaggregation based on aggregate measurements gathered at a single site [5]. ILM necessitates the installation of hardware on each appliance, such as sensors and processors, in order to monitor each item independently. Meanwhile, NILM works on software algorithms that examine the resident’s interior appliance functioning state using power data from the service panel.
Non-intrusive load monitoring is a technique for identifying and estimating the energy usage of each electrical item in a facility. It allows a homeowner to break down their home’s energy use into specific appliances, allowing them to be recognised and conserved [10]. The operation of NILM is depicted in Figure 2.
Measurement kinds, sample rates, and sensing types are all key aspects to consider while designing NILM algorithm steps. The power on the line(s) of interest is measured first by NILM algorithms. While it is critical to keep an eye on the load on a home’s main bus, it is also crucial to determine whether an incident has happened. Finding an event is difficult since a home’s main bus is made up of several sorts of equipment. The NILM algorithm gathers data from several power signal monitoring systems to evaluate whether an incident has happened. When the proper characteristics are retrieved and matched to the labelled data, the classification process will be able to accurately identify appliances that have generated events.
Because SM is so commonly utilised, the NILM algorithm will be more beneficial to the customer. NILM is a device that analyses variations in the voltage and current entering a home. This approach may be used to detect appliances that are not performing well. The purpose of NILM is to minimise energy use by increasing user awareness. When one sensor is installed in an SM, it reads all of the appliances’ energy use and sends it to the cloud. This installation differs from Intrusive Load Monitoring (ILM), in which each device requires its own sensor. The difference in installation between ILM and NILM is seen in Figure 3.
This article primarily focused on the appliance event detection and appliance usage prediction. The following list summarises the most important contributions:
  • An efficient non-parametric supervised machine learning network (ENSML) was proposed with fast inference speed and low storage requirements. The proposed method was used to create a realistic and adaptable NILM formulation model, with the parameter values following a supervised learning strategy.
  • The proposed ENSML has a lowered learning parameter; therefore, it takes up less space while performing as well as other state-of-the-art NILM systems.
  • The suggested ENSML methodology with the NILM system could recognise newly installed appliances, filling a critical research need.
  • A public dataset was used to validate the provided model and approach. All of the hypothesised potentials have been shown to be genuine, in addition to the high precision of load disaggregation.
The remainder of the paper is divided into the following sections. Section 2 presents the literature review while Section 3 highlights the visualisation of dataset and its preparation. Section 4 presents the ENSML model methodology while Section 5 presents the simulation method followed by results in Section 6. Finally, article is concluded in Section 7.

2. Literature Review

Table 1 in this section contains all of the data from prior NILM research. This will help us to have a better understanding of the algorithm. Machine learning (ML) is a forward-thinking method for predicting customer behaviour based on appliance usage.
Deep learning in non-intrusive appliance monitoring learning techniques is now classified into three categories: supervised, unsupervised, and semi-supervised learning. Supervised algorithms can either learn from training data or build a model and then guess a new instance based on it. It offers the advantages of being simple to use, quick to calculate, compact to store, and yielding accurate analytical findings. There are, however, some issues. The performance of logistic regression is bad when the geographical features are considerable, for example. There are certain drawbacks, such as under- or over-fitting, and a lack of self-learning capacity.
The unsupervised algorithm is a data-processing approach that classifies samples without using category information by analysing data from multiple samples of the study item. It has a great ability to self-learn, and fresh data may be immediately added to the data set without retraining, but it also has the drawback of low analytical result accuracy. Semi-supervised learning is the most promising learning algorithm branch because it employs a huge quantity of unlabelled data while also using labelled data for pattern recognition. However, there is a scarcity of research on semi-supervised regression issues.
To identify variations in the electrical consumption signal owing to appliance on/off events, early NILM approaches analysed the electricity mains measurement and applied statistical techniques. The active and reactive power signatures were then matched to the right appliance using a best likelihood method, and similar “steady-state” elements of the power signal were grouped together. Certain two-state (on/off) appliances have been identified with good accuracy using such clustering approaches [10,11]. These methods, on the other hand, have major trouble detecting more complicated appliances with numerous states (e.g., washing machines) and have a tendency to fail in situations when multiple appliances are operating and switching at the same time [12]. Clustering approaches have also been used to uncover household features and trends in electricity use data [13,14].
Graph signal processing is another contemporary technique to NILM in the literature. Refs. [15,16] present a low-complexity unsupervised NILM technique based on entropy index limitations competitive agglomeration, a fuzzy clustering algorithm. This approach yielded encouraging results for NILM implementation in practice.
Ref. [17] described a spectrum-smoothing-based load disaggregation strategy for dealing well with many appliances turning on and off at the same time. There have also been proposals for NILM algorithms based on integer programming [18] and mixed-integer linear programming [19].
Since it may provide a considerably less intrusive and lower-cost solution than sub-metering, NILM has been included in a substantial number of mass-market home energy management products and services. Sense [20] employs NILM to discover trends in home energy usage in order to provide users advice on how to make their homes more energy efficient. Smappee [21] focuses on how to use NILM to provide precise feedback and advice on reducing energy and carbon footprints. A NILM device for commercial buildings has been developed by SmartB [22]. A variety of mass-market NILM gadgets are used to identify possible safety hazards when home appliances, such as the oven or iron, are left switched on and/or unattended [23]. Several commercial vendors claim to incorporate machine learning or artificial intelligence in their algorithms in their goods and services [24,25]. Bidgely et al. [24] has a number of patents in the field of machine learning-based NILM methods. Verv et al. [25] is a home energy management solution that uses high-resolution mains electricity measurements and artificial intelligence methodologies to perform NILM, with the output from the NILM classifier being used to offer advice and suggestions to consumers.
The use of deep learning techniques from other domains, such as image processing, to solve the NILM problem was presented in ref. [12], where preliminary findings revealed that deep learning approaches outperformed other approaches in the literature on unseen residential smart meter data sets. In several fields, such as image classification, automated speech recognition, and machine language translation, deep learning is currently the standard technique [26,27,28,29,30,31]. Deep learning approaches are expected to increase NILM performance, as one of the main challenges in NILM is selecting the most discriminative features to extract from a given household data set. Deep learning approaches can learn which characteristics to extract from a data set automatically and generalise to new and unknown data sets. This enables the creation of an unsupervised solution to the NILM issue, with the least amount of user involvement necessary to set up and train the system. Table 2 highlights the most important previous studies in the area.
Early NILM methods relied on statistical approaches to detect variations in the energy usage caused by both on/off appliances and electrical main readings. Based on identical steady-state components of the data, an algorithm matches the real and reactive power signatures of the data with the suitable appliance. The use of such ensemble methods for identifying certain two-state appliances has been found to be extremely accurate [32,33]. However, the technique has significant problems detecting devices with more intricate state-dependent behavior and in scenarios when many appliances are operating at the same time [34].
Graph signal processing, which was described in ref. [35], is another new technique to NILM. The NILM method [36] presents a flexible and low-complexity entropy index constraint competitive agglomeration technique. The findings of this technique seemed promising for NILM application in the real world. A Cepstrum-based strategy for disaggregation load is described in ref. [37] to manage simultaneous on or off of several appliances. NILM has also been proposed using mixed-integer linear programming [38] and integer programming algorithms [39].
Hidden Markov Models (HMMs) are used to solve energy disaggregation problems [40,41]. Markovian models have hidden and visible states, with the hidden state being the appliance state. However, such approaches may be suitable for applications involving relatively continuous durations of time between states, such as speech recognition. As a result, energy disaggregation is impeded by the notion that run times might differ dramatically from one run to the next (and hence state durations). In addition, the HMM should include any appliances in the house that are either undesired or practical.
The implementation of machine learning by NILM to forecast what the SM will do based on data acquired from it is discussed in this section. Figure 4 depicts the entire operation of the system. The primary power distribution board has an acquisition circuit that gathers continuous data on current and voltage at the board (number one). The obtained data demonstrates a change in power at stage (2), when the appliance is turned on. The current and voltage behavior at the main distribution board can be used to determine this shift.
Aggregate data is collected whenever an appliance electrical signature is selected. Electrical signatures are the most important component of a NILM system at stage 3. Because the first form of signature requires a high sampling frequency, most home NILM systems use the steady-state type. The initial step in determining steady states is to recognise stable value sequences in the signal. This paper describes an approach for detecting Steady-State signatures using rectangular regions formed by successive data.
This approach enables the identification of a complete steady state from start to finish. The smart energy monitor can identify all monitored equipment using data from the NILM. A time-stamped active aggregate load is provided into the disaggregation process as well as the efficient non-parametric supervised machine learning network model for the household. During the disaggregation time, this method generates a comprehensive report for each appliance or event. This project can anticipate additional houses using only the same data set as the NILM data.
Stage (4) is where all of the data are kept. This is where the appliances from the energy disaggregation are labelled. This will also provide historical data logging, allowing the user to review the appliance’s history when it is turned on or off. When the user is gone at stage (5), this is critical. This is where the appliance utilisation is monitored and managed. While the user is away from home, the user may keep an eye on what is going on at home. This is where the Internet of Things comes into play in the last stage (6). This is where all of the IoT-enabled appliances are installed. The gadgets can be used even while the user is not at home.

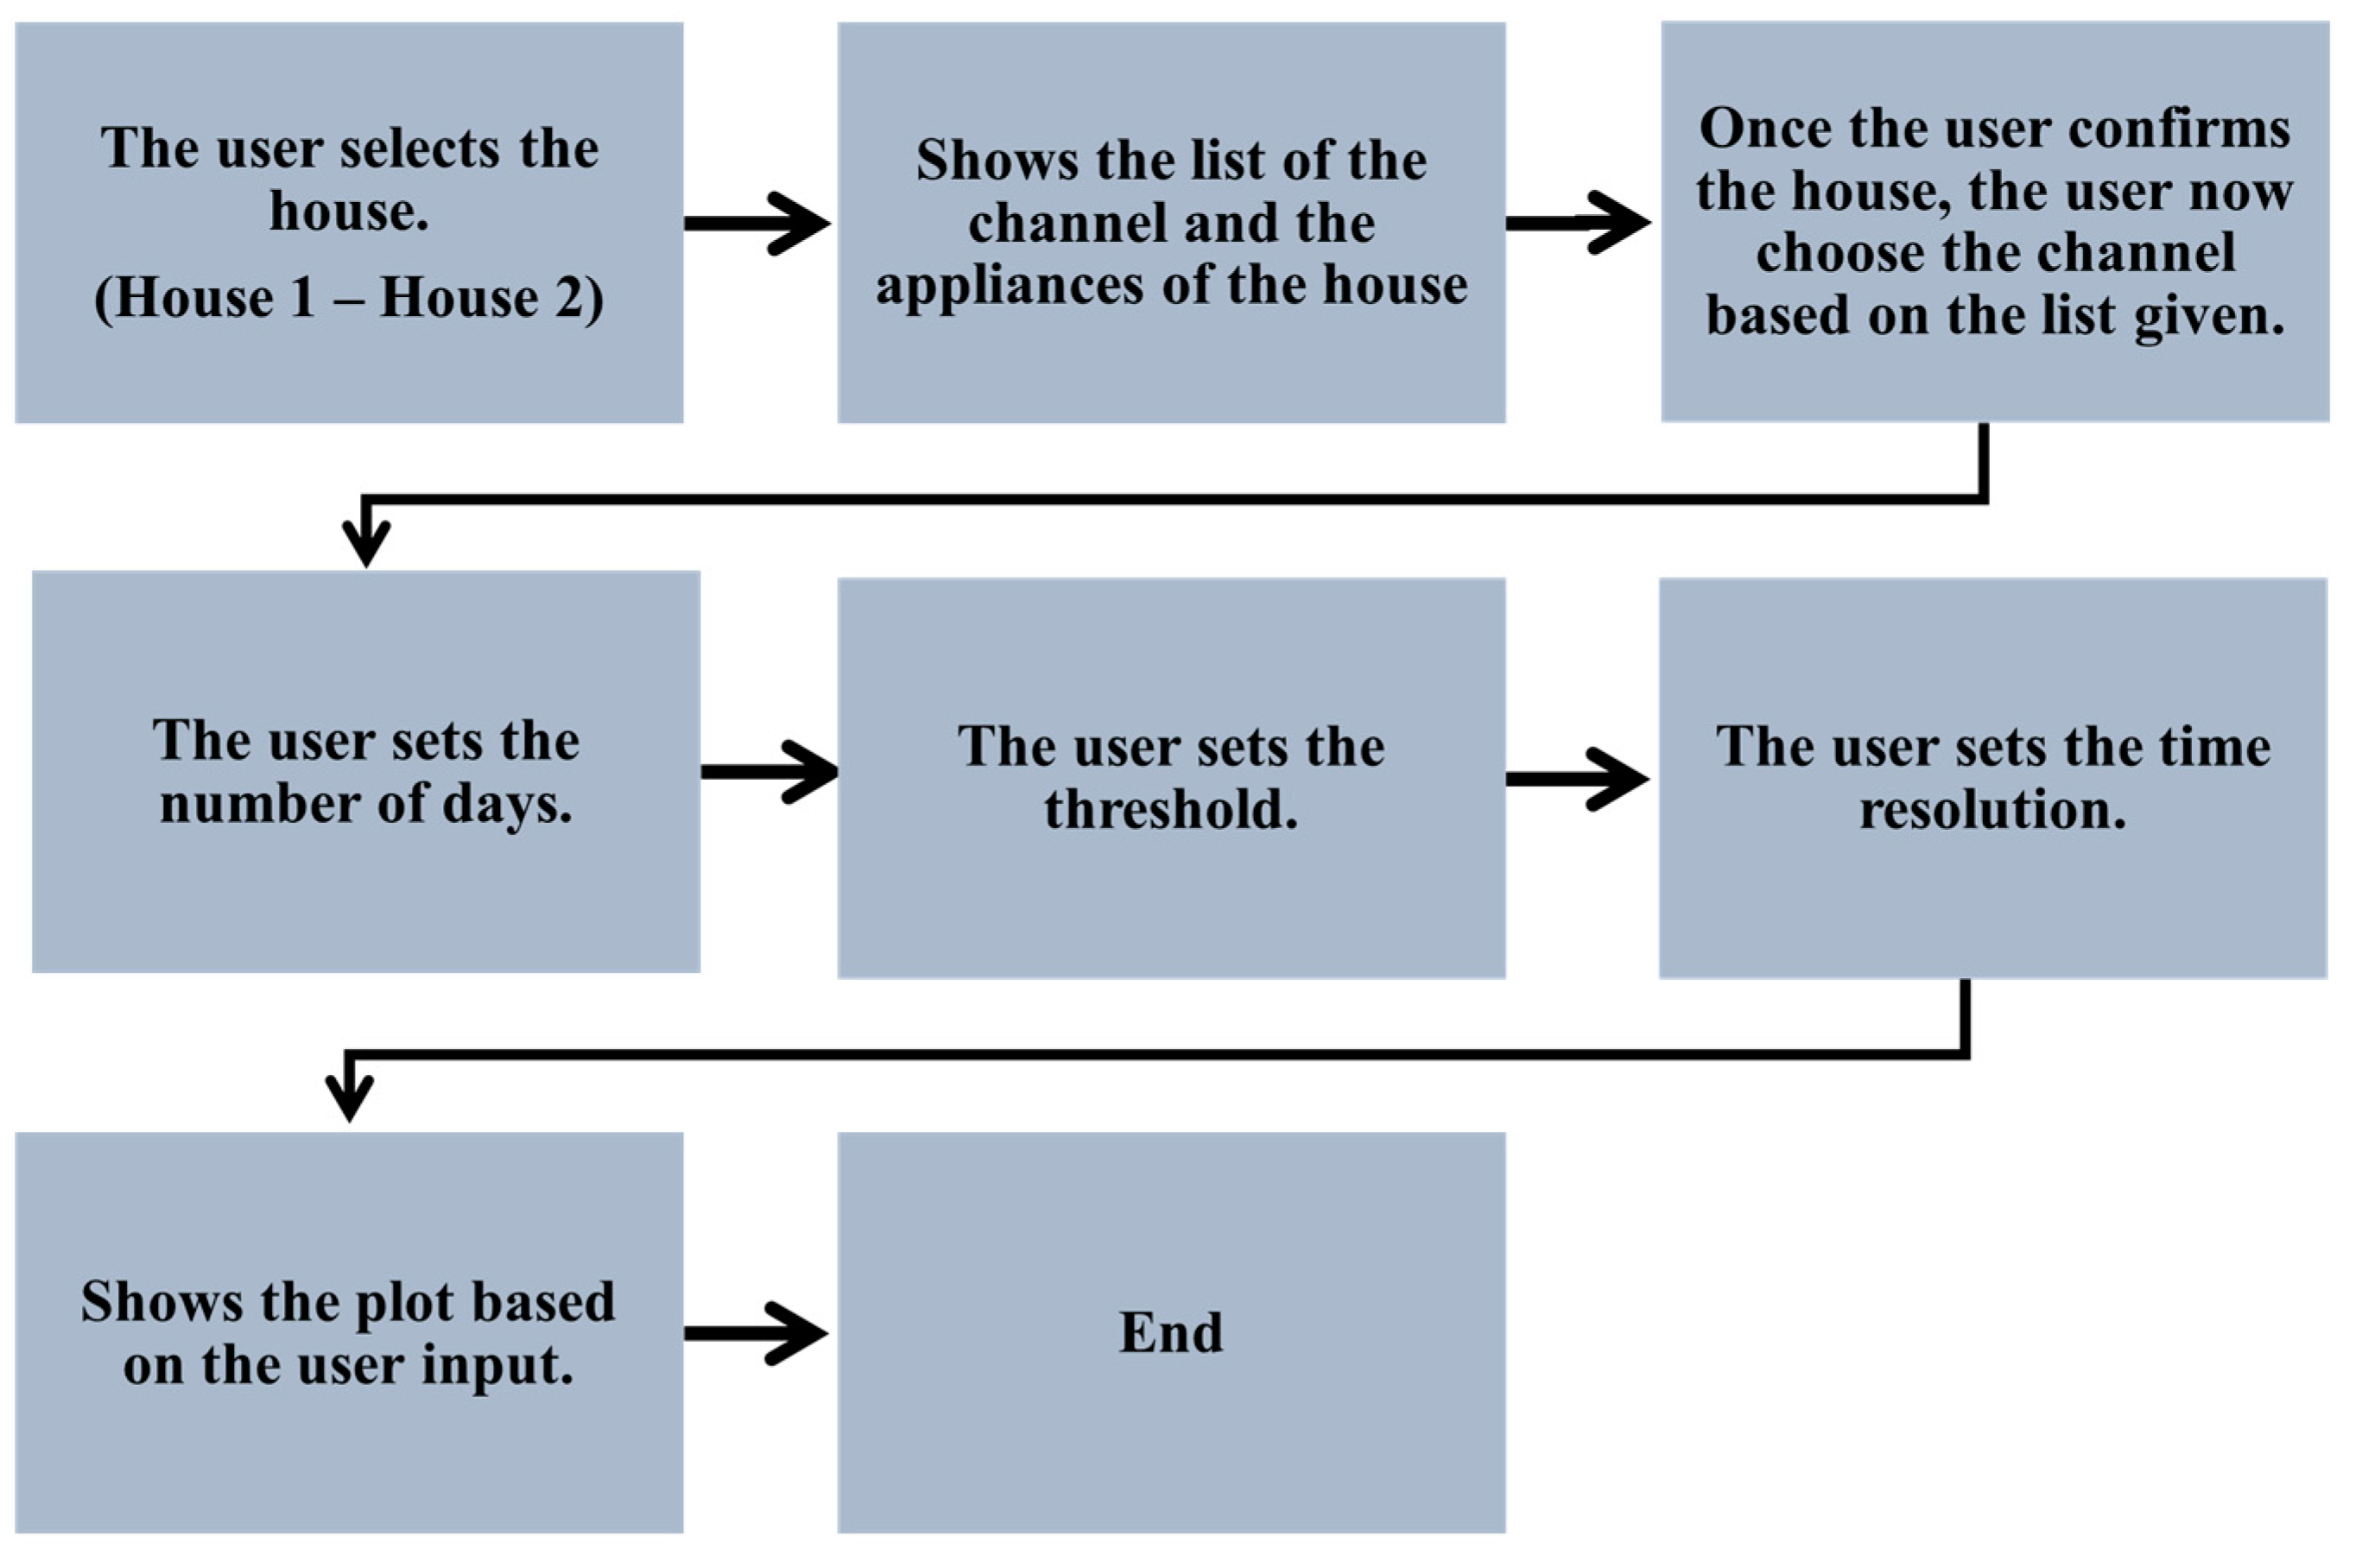
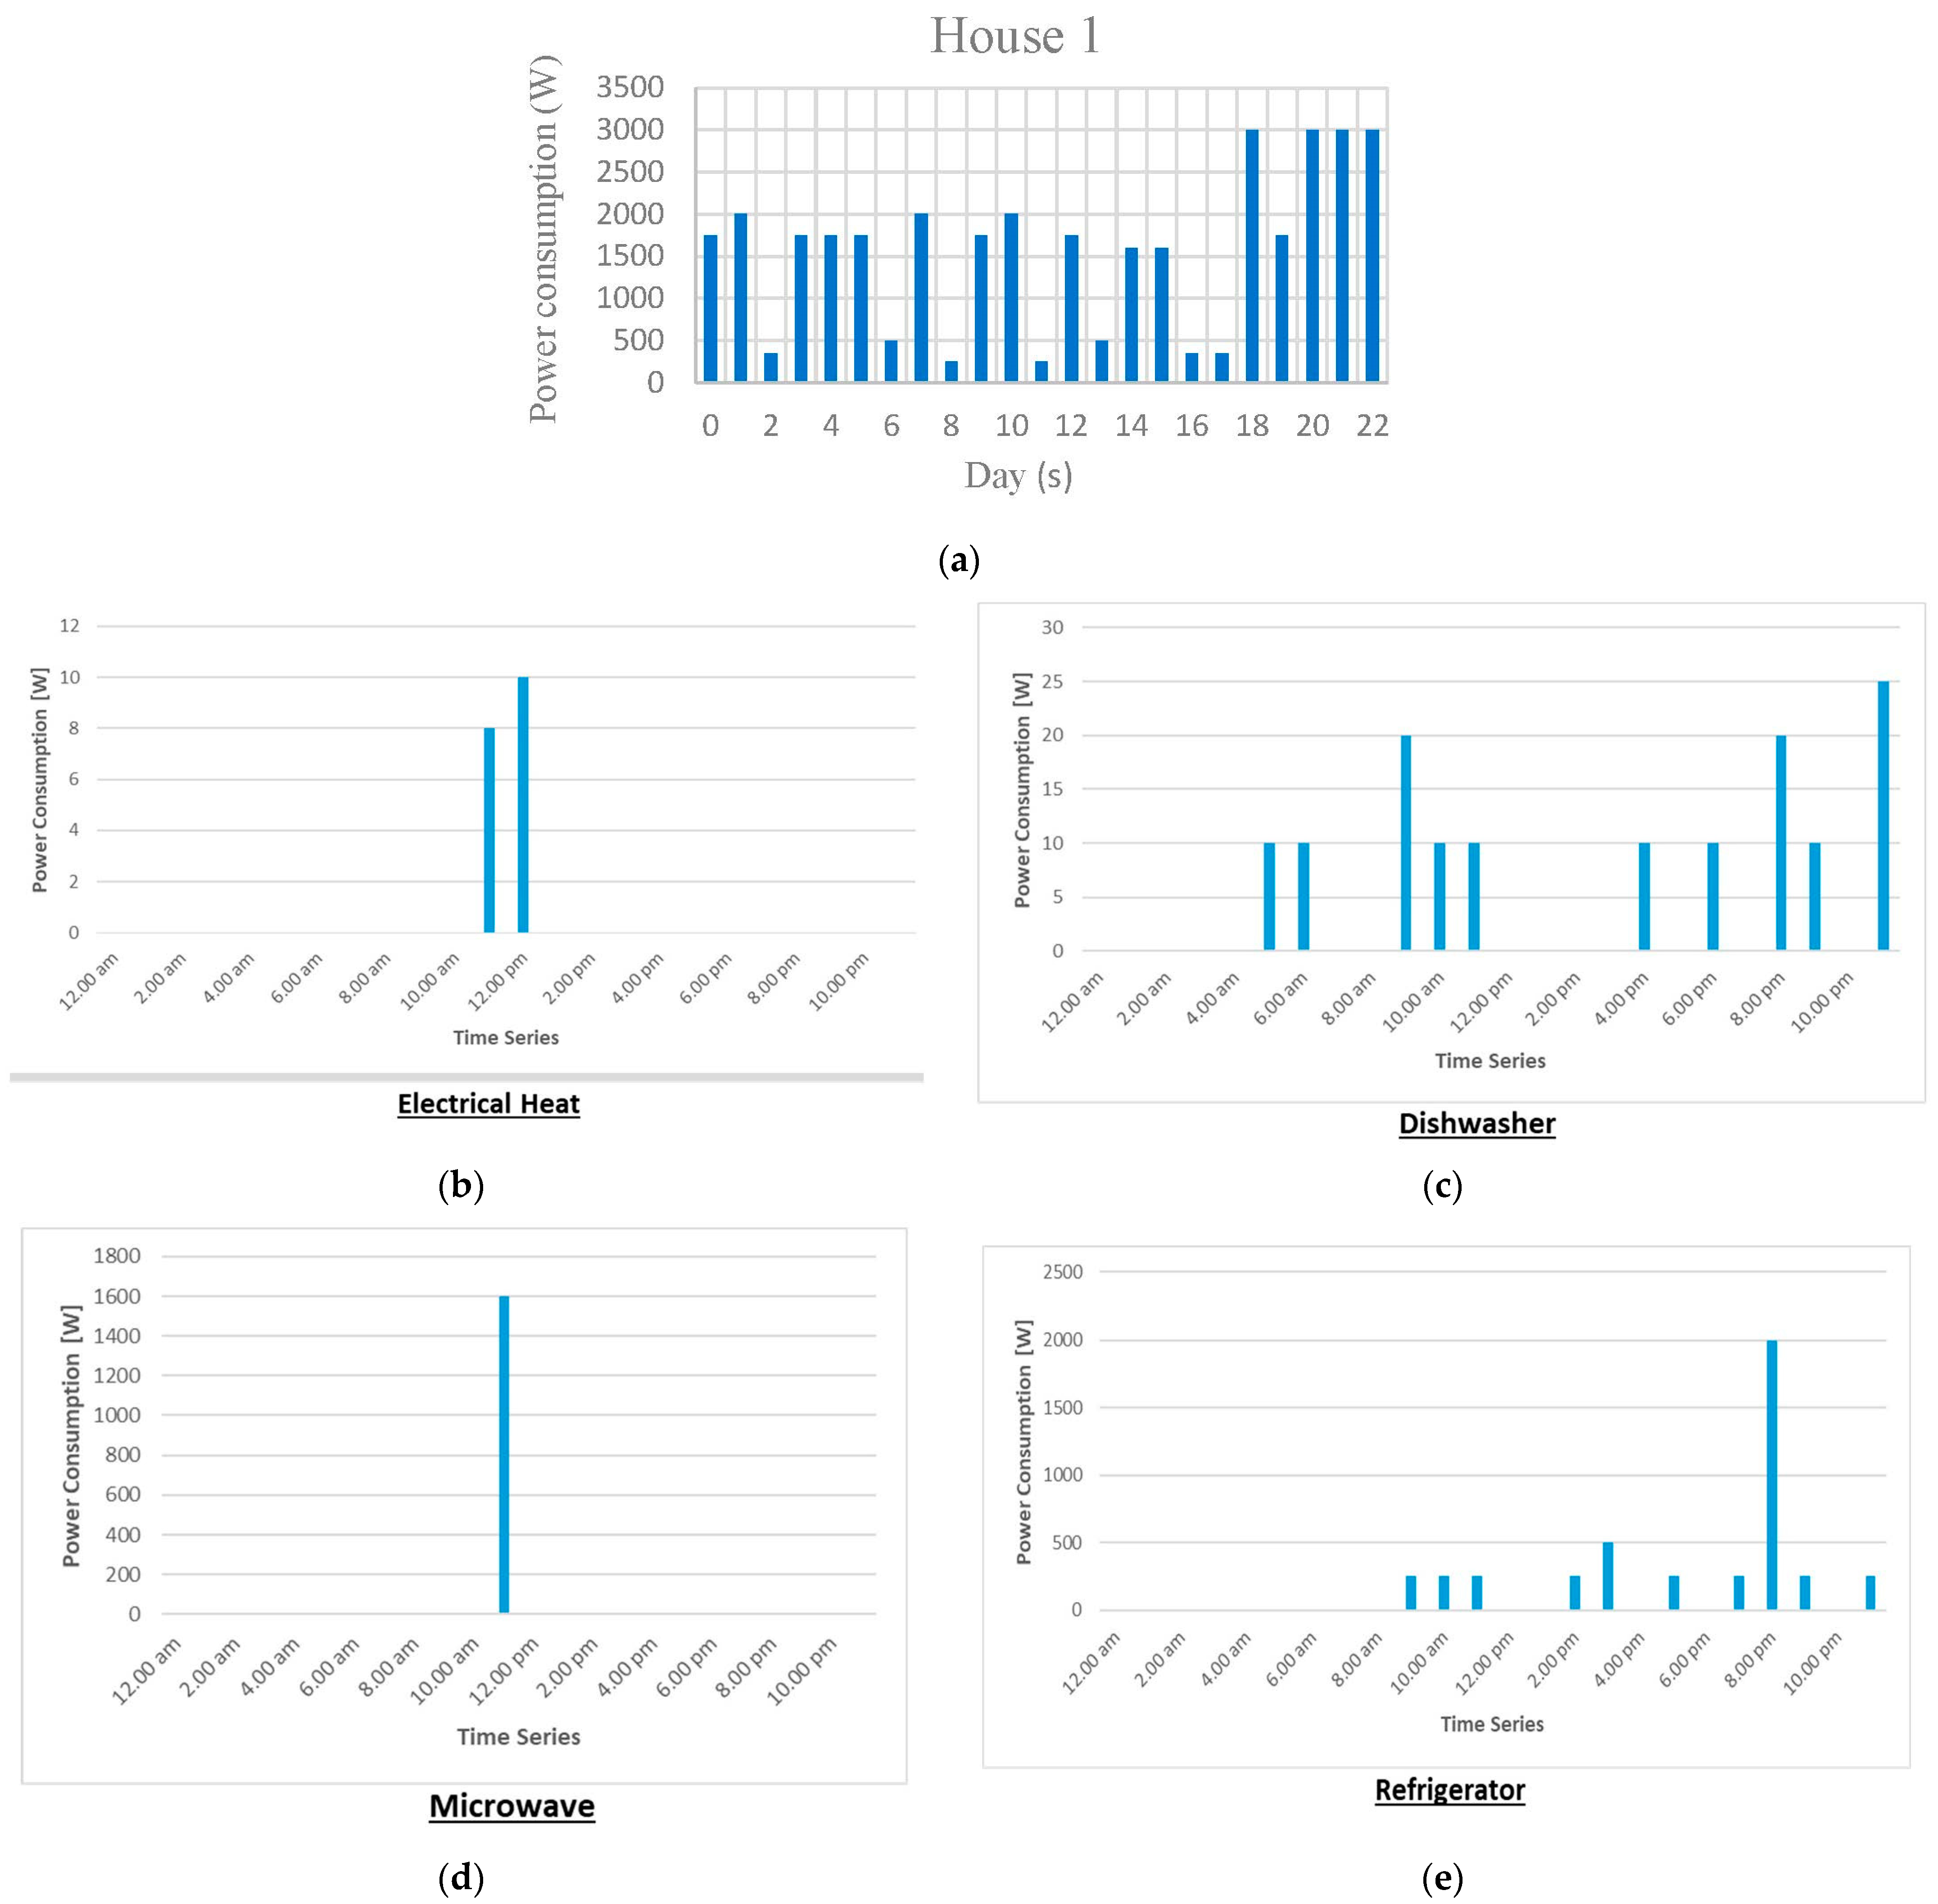
3. Visualisation of Dataset

REDD is acronym that stands for Reference Energy Disaggregation Data, created and managed by Massachusetts Institute of Technology (MIT). This aggregated data collection [5] contains extensive information on energy usage from a number of homes. REDD was used to monitor around 40 residences in Massachusetts and California. Monitoring devices were put in 30 residences around the state in 18 months. Each circuit breaker in each residence was obtained for two to four weeks. Having access to historical data helps to examine how the energy in a home has changed over time. Devices may be identified using the whole-home signal, which is made up of machine-readable waveforms, while devices with specialised data can offer information on behavior inside the house. These data were collected in six family households in the United States during a short period of time. This dataset is commonly used to assess NILM algorithms [5]. The process of creating REDD dataset for the project is shown in Figure 5.

4. Efficient Non-Parametric Supervised Machine Learning (ENSML) Network as a Predictive Agent

One of the most widely used branches of networks comes from supervised learning. This paper proposed an efficient non-parametric supervised machine learning network (ENSML) having decision tree algorithm as the basic block that can be used to tackle both regression and classification problems. ENSML predictive models are created by combining a set of binary rules to calculate an objective value. Figure 6 shows the diagram of ENSML network while Table 3 summarises the explanation.
The hierarchical classifier has three types of nodes. The Root Node is the graph’s initial node, and it symbolises the whole sample. It can be subdivided further into nodes. The inner nodes indicate the properties of a data collection, while the branches represent the decision criteria. Finally, the Leaf Nodes indicate the outcome. This strategy is quite useful for addressing challenges with decision-making.
The pseudocode and the process chart (Figure 7) explaining the ENSML Algorithm procedure is given below (Algorithm 1).
Algorithm 1 ENSML Algorithm
Technologies 10 00085 i001

Advantages and Disadvantages

The ENSML methods are supervised learning algorithms that are mostly used for classification problems (because they have a predefined target variable). These models are used only in regression problems if and only if the target variable falls within the range of values seen in train data. Table 4 shows the advantages and disadvantages of using the ENSML method.

5. Setup Experiment

The power under 1 Hz for total signals and 0.2–0.3 Hz for individual appliances makes up the REDD low-frequency dataset. Individual appliance data were augmented to 1 Hz to ensure consistency. The REDD dataset utilising the NILM method deaggregated the lower and higher frequencies in the lower and higher frequencies. To examine the proposed study, with a reasonably basic appliance operation condition, the Dataset for House 1 was used. House 1 contains 23 days. To make the prediction successful, House 1 should have enough data. Figure 8a shows the power consumption (W) for House 1 while Figure 8b–e represents different appliances usage recorded at the simulator. The considered day was Monday, which is a working day.
This shows that House 1 had enough data to train, validate, and test for this experiment as it contains 23 days; therefore, House 1 had appropriate data for training, validation, and testing. Continued with the setup, the input for training data, validation data, and test data were 1–10 days, 11–16 days, and 17 days onwards respectively. This shows that it had 10 days for training, 6 days for validation, and 7 days for testing.

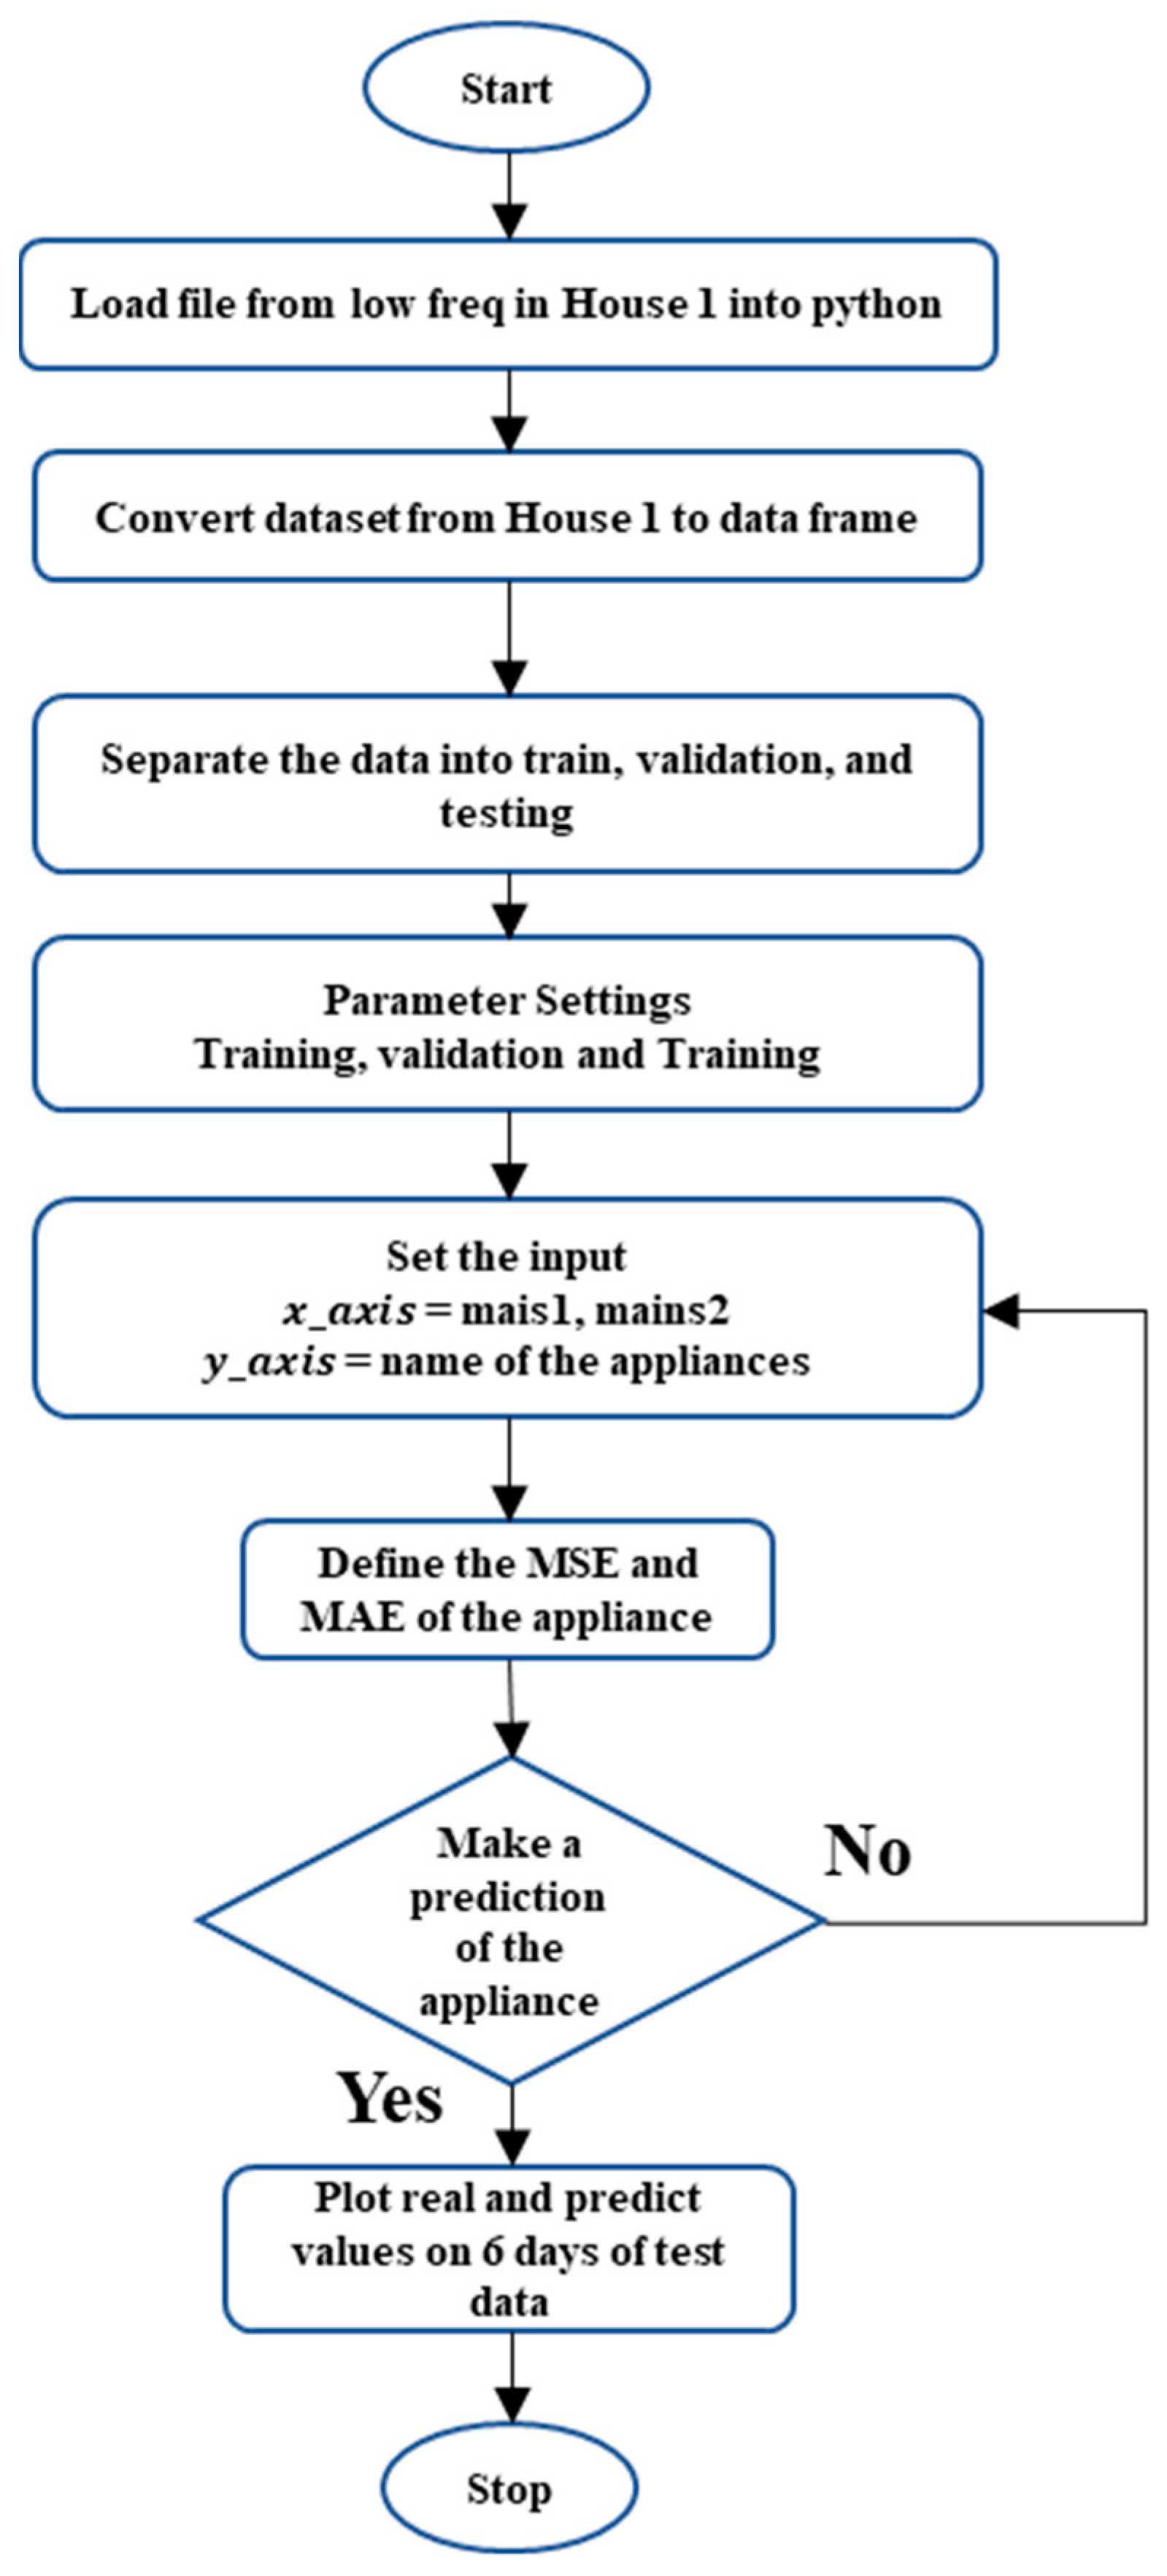
5.1. ENSML Regression Model for Prediction

From these 20 appliances in House 1, this experiment used some of the appliances to make a prediction using the ENSML algorithm as explained in Section 4. Refrigerator, microwave, and electric heat are the appliances that were used for this experiment. The process flow diagram shown in Figure 9 summarises the process followed for the prediction of the power usage utilised by each appliance respectively.

5.2. Performance Metrics

The proposed system’s performance metrics are defined below. Here, precision, recall rate, F1 score, and absolute errors were used as the evaluation indicators.
P r e c i s i o n = T P T P + F P
R e c a l l   R a t e = T P T P + F N
A c c u r a c y = T P + T N T N + F P + T P + F N
F 1 s c o r e = 2 ( P r e c i s i o n × R e c a l l   R a t e ) 2 ( P r e c i s i o n + R e c a l l   R a t e )
M A E = 1 T 1 T 0 t = T 0 T 1 | ( y t ˜ y t y t ) |
where TP means the number of True Positives; FP stands for the number of False Positives; and FN means the number of False Negatives. T P represents the total number of sequence points for which the electrical appliance is truly operating and for which the disaggregation result is likewise working. The number of sequence points when the electrical appliance is truly operating but the outcome is non-functional is represented by FP. The number FN denotes the total number of sequence points, indicating that the electrical appliance is not in use but that the model decomposition result is. At time t, y t reflects the real power of the electrical equipment. M A E is the average absolute error of the power disaggregation in the time period from T 0 to T 1 . The disaggregated power y t at time t, and MAE represents the average absolute error of the power disaggregation in the time period from T 0 to T 1 . The P r e c i s i o n , R e c a l l   R a t e , A c c u r a c y , F 1 s c o r e , and M A E are the fundamental indications of non-intrusive load disaggregation and can represent the model’s accuracy in evaluating if the electrical appliance is in a functional state. The precision of the disaggregated power value at each time period can be reflected by MAE. The better the precision of the power decomposed value, the lower the value.

6. Results

In this section, results for refrigerator, microwave, and electrical heat showed some promising values on six test days. However, others showed spikes for predicting values caused by overfitting.
The performance characteristics for a refrigerator, microwave, and electrical heat are shown in Table 5. With excellent accuracy, recall rate, precision, and F1-score, the true category was predicted. The MAE prediction for the appliances was less than 1%. The results shown in Figure 10a,b presents the day 1 and day 6 usage by the refrigerator. This clarifies that the utilised ENSML model prediction and true value of the power usage by the refrigerator is accurate. Looking at Figure 11, at epoch 125, the acquired training and validation accuracy were 99.2 percent and 98.1 percent, respectively. Similarly, the training and validation losses were 0.04 and 0.05, respectively.
The results presented showed that prediction of the house is very near to the true values of the aggregated powers. The reason for choosing refrigerator, microwave, and electrical heat as the appliances is that the pattern of data and aggregated powers is different. If we consider the refrigerator, the pattern was repetitive and was in the form of a square wave. The prediction of the data was accurately detected. However, if we consider the microwave, the usage was around 3500 W and is not repetitive; still, the prediction was in good proportions. A little dip in the shape of the predicted value was seen due to underfitting as these instances are quite fewer and data are scarce in this situation.
The performance of proposed method is compared with some recent methodologies that have been proposed in the recent past. The Table 6 summarises the contributions with respect to precision obtained by the proposed technique. The settings, appliance under test and dataset are similar. Table 6 shows that the proposed method has the best performance as compared to other methodologies.
Hardware cost is an important factor that needs to be taken into consideration. This is a cost that is usually proportional to the data resolution, i.e., higher resolutions mean higher costs [47,48]. In addition to the hardware expenditures, there are also training and operating costs to consider. For the pretrained model, a generic modelling technique will be adopted through training. The model for each appliance type utilised in all setups is an important factor; if we can find a similar model that predicts for all appliances, it reduces the complexities a lot. In any event, reliable models require data, patience, and, more often than not, many resources. We commonly refer to the cloud environment in terms of functioning because most of these services are hosted on the cloud. The hardware and software trainings and implementation with machine learning is an important factor that will be thoroughly investigated in future work.

7. Conclusions

The development of new technology to better regulate energy use has become a requirement in recent years. Using home smart meter data, this research proposed an appliance recognition and prediction system utilising the NILM technique based on a simple and low-complexity ENSML network, which can identify common household electrical equipment from a typical household smart meter reading. In this research, we offered an intelligent method to detect smart home loads without being obtrusive. The research focused on the prediction of different appliances which have different amounts and patterns of power usage. The evaluation results revealed that the proposed method has 99.9% accuracy. While utilising the proposed method, it is expected that future work will utilise other methodologies that can beat the performance as well as predict optimally for other appliances as well, and, finally, create a prototype of the model that can store the data in cloud. This data then can be stored in the internet operating system platform to continue monitoring for future use. Further work will also investigate the benefits of applying the NNs to convert smart meter data.

Author Contributions

Conceptualisation, M.U.H. and A.B.; methodology, M.U.H.; software, M.U.H., A.B. and N.H.N.S.; validation, M.U.H. and N.H.N.S.; formal analysis, A.B. and N.H.N.S.; investigation, M.U.H., A.B. and N.H.N.S.; resources, M.U.H.; data curation, N.H.N.S., M.U.H. and A.B.; writing—original draft preparation, M.U.H. and N.H.N.S.; supervision, M.U.H. All authors have read and agreed to the published version of the manuscript.

Funding

This research received no external funding.

Data Availability Statement

The data presented in this study are available on request.

Conflicts of Interest

The authors declare no conflict of interest.

References

  1. Osuwa, A.A.; Ekhoragbon, E.B.; Fat, L.T. Application of Artificial Intelligence in Internet of Things. In Proceedings of the 2017 9th International Conference on Computational Intelligence and Communication Networks, Girne, Cyprus, 16–17 September 2017. [Google Scholar]
  2. Subbulakshmi, V.; Aiswarya, D.; Arulselvi, A. Monitoring and controlling energy consumption using IOT and blockchain. Int. J. Adv. Netw. Appl. 2016, 1, 317–321. [Google Scholar]
  3. Garcia, F.D.; Souza, W.A.; Diniz, I.S.; Marafão, F.P. NILM-based approach for energy efficiency assessment of household appliances. Energy Inform. 2020, 3, 10. [Google Scholar] [CrossRef]
  4. Chang, H.; Wiratha, P.W.; Chen, N. A Non-intrusive Load Monitoring System Using an Embedded System for Applications to Unbalanced Residential Distribution Systems. Energy Procedia 2014, 61, 146–150. [Google Scholar] [CrossRef] [Green Version]
  5. Nalmpantis, C.; Vrakas, D. On time series representations for multi-label NILM. Neural Comput. Appl. 2020, 32, 17275–17290. [Google Scholar] [CrossRef]
  6. Sankar, L.; Rajagopalan, S.R.; Mohajer, S.; Poor, H.V. Smart Meter Privacy: A Theoretical Framework. IEEE Trans. Smart Grid 2013, 4, 837–846. [Google Scholar] [CrossRef]
  7. Carrie Armel, K.; Gupta, A.; Shrimali, G.; Albert, A. Is disaggregation the holy grail of energy efficiency? The case of electricity. Energy Policy 2013, 52, 213–234. [Google Scholar] [CrossRef] [Green Version]
  8. Devlin, M.A.; Hayes, B.P. Non-Intrusive Load Monitoring and Classification of Activities of Daily Living Using Residential Smart Meter Data. IEEE Trans. Consum. Electron. 2019, 65, 339–348. [Google Scholar] [CrossRef]
  9. Hart, G.W. Nonintrusive appliance load monitoring. Proc. IEEE 1992, 80, 1870–1891. [Google Scholar] [CrossRef]
  10. Klemenjak, C.; Makonin, S.; Elmenreich, W. Towards comparability in non-intrusive load monitoring: On data and performance evaluation. In Proceedings of the 2020 IEEE Power & Energy Society Innovative Smart Grid Technologies Conference (ISGT), Washington, DC, USA, 17–20 February 2020. [Google Scholar]
  11. Virtsionis-Gkalinikis, N.; Nalmpantis, C.; Vrakas, D. SAED: Self-attentive energy disaggregation. Mach. Learn. 2021, 1–20. [Google Scholar] [CrossRef]
  12. Kelly, D.G. Disaggregation of Domestic Smart Meter Energy Data; London University: London, UK, 2016. [Google Scholar]
  13. Batra, N.; Kukunuri, R.; Pandey, A.; Malakar, R.; Kumar, R.; Krystalakos, O.; Zhong, M.; Meira, P.; Parson, O. Towards reproducible state-of-the-art energy disaggregation. In Proceedings of the 6th ACM International Conference on Systems for Energy-Efficient Buildings, Cities, and Transportation, New York, NY, USA, 13–14 November 2019; pp. 193–202. [Google Scholar]
  14. Jiang, J.; Kong, Q.; Plumbley, M.D.; Gilbert, N.; Hoogendoorn, M.; Roijers, D.M. Deep Learning-Based Energy Disaggregation and On/Off Detection of Household Appliances. ACM Trans. Knowl. Discov. Data 2021, 15, 1–21. [Google Scholar] [CrossRef]
  15. He, K.; Stankovic, L.; Liao, J.; Stankovic, V. Non-intrusive load disaggregation using graph signal processing. IEEE Trans. Smart Grid 2018, 9, 1739–1747. [Google Scholar] [CrossRef] [Green Version]
  16. Liu, Q.; Kamoto, K.M.; Liu, X.; Sun, M.; Linge, N. Low-complexity non-intrusive load monitoring using unsupervised learning and generalized appliance models. IEEE Trans. Consum. Electron. 2019, 65, 28–37. [Google Scholar] [CrossRef]
  17. Kong, S.; Kim, Y.; Ko, R.; Joo, S. Home appliance load disaggregation using cepstrum-smoothing-based method. IEEE Trans. Consum. Electron. 2015, 61, 24–30. [Google Scholar] [CrossRef]
  18. Bhotto, M.Z.A.; Makonin, S.; Bajic, I.V. Load disaggregation based on aided linear integer programming. IEEE Trans. Circuits Syst. II Express Briefs 2017, 64, 792–796. [Google Scholar] [CrossRef] [Green Version]
  19. Wittmann, F.M.; Lopez, J.C.; Rider, M.J. Nonintrusive load monitoring algorithm using mixed-integer linear programming. IEEE Trans. Consum. Electron. 2018, 64, 180–187. [Google Scholar] [CrossRef]
  20. Net2grid. 2019. Available online: http://www.net2grid.com (accessed on 19 March 2022).
  21. Smappee. 2019. Available online: https://www.smappee.com/been/homepage (accessed on 19 March 2022).
  22. SmartB Energy Management. 2019. Available online: http://www.smartb.de/ (accessed on 19 March 2022).
  23. Watty. 2019. Available online: https://watty.io/ (accessed on 21 March 2022).
  24. Bidgely. 2019. Available online: http://www.bidgely.com (accessed on 19 March 2022).
  25. Verv. 2019. Available online: https://verv.energy/ (accessed on 19 March 2022).
  26. Ronneberger, O.; Fischer, P.; Brox, T. U-Net: Convolutional Networks for Biomedical Image Segmentation. In Medical Image Computing and Computer-Assisted Intervention–MICCAI 2015; Navab, N., Hornegger, J., Wells, W.M., Frangi, A.F., Eds.; Springer International Publishing: Cham, Switzerland, 2015; Volume 9351, pp. 234–241. [Google Scholar]
  27. Kelly, J.; Knottenbelt, W. Neural NILM. In: ACM, 55–64. (4 November 2015). Available online: http://dl.acm.org/citation.cfm?id=2821672 (accessed on 19 March 2022).
  28. Barsim, K.S.; Yang, B. Toward a semi-supervised non-intrusive load monitoring system for event-based energy disaggregation. In Proceedings of the 2015 IEEE Global Conference on Signal and Information Processing (GlobalSIP), Orlando, FL, USA, 14–16 December 2015; pp. 58–62. Available online: https://ieeexplore.ieee.org/document/7418156 (accessed on 19 March 2022).
  29. Biansoongnern, S.; Plangklang, B. Nonintrusive load monitoring (NILM) using an Artificial Neural Network in embedded system with low sampling rate. In Proceedings of the 2016 13th International Conference on Electrical Engineering/Electronics, Computer, Telecommunications and Information Technology (ECTI-CON), Chiang Mai, Thailand, 28 June–1 July 2016; pp. 1–4. [Google Scholar]
  30. Faustine, A.; Pereira, L.; Bousbiat, H.; Kulkarni, S. UNet-NILM: A Deep Neural Network for Multi-Tasks Appliances State Detection and Power Estimation in NILM. In Proceedings of the 5th International Workshop on Non-Intrusive Load Monitoring, NILM’20, Virtual Event, Japan, 18 November 2020; Association for Computing Machinery: New York, NY, USA, 2020; pp. 84–88. [Google Scholar]
  31. Zeifman, M.; Roth, K. Nonintrusive appliance load monitoring: Review and outlook. IEEE Trans. Consum. Electron. 2011, 57, 76–84. [Google Scholar] [CrossRef]
  32. Wang, Z.; Zheng, G. Residential Appliances Identification and Monitoring by a Nonintrusive Method. IEEE Trans. Smart Grid 2012, 3, 80–92. [Google Scholar]
  33. Weiss, M.; Helfenstein, A.; Mattern, F.; Staake, T. Leveraging smart meter data to recognize home appliances. In Proceedings of the 2012 IEEE International Conference on Pervasive Computing and Communications, Lugano, Switzerland, 19–23 March 2012; pp. 190–197. [Google Scholar]
  34. Makriyiannis, M.; Lung, T.; Craven, R.; Toni, F.; Kelly, J. Smarter electricity and argumentation theory. In Proceedings of the Smart Innovation, Systems and Technologies; Springer Science and Business Media Deutschland GmbH: Berlin, Germany, 2016; Volume 46, pp. 79–95. [Google Scholar]
  35. Hadi, M.U.; Murtaza, G. Enhancing distributed feedback-standard single mode fiber-radio over fiber links performance by neural network digital predistortion. Microw. Opt. Technol. Lett. 2021, 63, 1558–1565. [Google Scholar] [CrossRef]
  36. Chang, H.H.; Lin, L.S.; Chen, N.; Lee, W.J. Particle-swarm-optimization-based nonintrusive demand monitoring and load identification in smart meters. IEEE Trans. Ind. Appl. 2013, 49, 2229–2236. [Google Scholar]
  37. Kolter, J.Z.; Jaakkola, T. Approximate inference in additive factorial hmms with application to energy disaggregation. In Proceedings of the Machine Learning Research, Volume 22: Artificial Intelligence and Statistics, La Palma, Canary Islands, Spain, 21–23 April 2012; pp. 1472–1482. [Google Scholar]
  38. Hadi, M.U.; Awais, M.; Raza, M.; Khurshid, K.; Jung, H. Neural Network DPD for Aggrandizing SM-VCSEL-SSMF-Based Radio over Fiber Link Performance. Photonics 2021, 8, 19. [Google Scholar] [CrossRef]
  39. Hadi, M.U. Practical Demonstration of 5G NR Transport Over-Fiber System with Convolutional Neural Network. Telecom 2022, 3, 103–117. [Google Scholar] [CrossRef]
  40. Egarter, D.; Bhuvana, V.P.; Elmenreich, W. PALDi: Online Load Disaggregation via Particle Filtering. IEEE Trans. Instrum. Meas. 2015, 64, 467–477. [Google Scholar] [CrossRef]
  41. Ferrández-Pastor, F.J.; Mora-Mora, H.; Sánchez-Romero, J.L.; Nieto-Hidalgo, M.; García-Chamizo, J.M. Interpreting human activity from electrical consumption data using reconfigurable hardware and hidden Markov models. J. Ambient. Intell. Humaniz. Comput. 2016, 8, 469–483. [Google Scholar] [CrossRef]
  42. Khurshid, K.; Khan, A.A.; Siddiqui, H.; Rashid, I.; Hadi, M.U. Big Data Assisted CRAN Enabled 5G SON Architecture. J. ICT Res. Appl. 2019, 13, 93–106. [Google Scholar] [CrossRef]
  43. Hadi, M.U.; Awais, M.; Raza, M.; Ashraf, M.I.; Song, J. Experimental Demonstration and Performance Enhancement of 5G NR Multiband Radio over Fiber System Using Optimized Digital Predistortion. Appl. Sci. 2021, 11, 11624. [Google Scholar] [CrossRef]
  44. Liu, Y.; Wang, J.; Deng, J.; Sheng, W.; Tan, P. Non-Intrusive Load Monitoring Based on Unsupervised Optimization Enhanced Neural Network Deep Learning. Front. Energy Res. 2021, 9, 718916. [Google Scholar] [CrossRef]
  45. Wang, K.; Zhong, H.; Yu, N.; Xia, Q. Nonintrusive Load Monitoring Based on Sequence-To-Sequence Model with Attention Mechanism. Proc. CSEE 2019, 39, 75–83. [Google Scholar]
  46. Liu, L.; Ding, J.; Zhong, J.; Fu, X.; Lv, Y. An unsupervised model for classification and recognition of household appliances. J. Comput. Inf. Syst. 2014, 10, 403–410. [Google Scholar]
  47. Athanasiadis, C.; Doukas, D.; Papadopoulos, T.; Chrysopoulos, A. A Scalable Real-Time Non-Intrusive Load Monitoring System for the Estimation of Household Appliance Power Consumption. Energies 2021, 14, 767. [Google Scholar] [CrossRef]
  48. Athanasiadis, C.L.; Papadopoulos, T.A.; Doukas, D.I. Real-time non-intrusive load monitoring: A light-weight and scalable approach. Energy Build. 2021, 253, 111523. [Google Scholar] [CrossRef]
Figure 1. Load disaggregation hierarchy.
Technologies 10 00085 g001
Figure 2. How NILM works.
Technologies 10 00085 g002
Figure 3. Installation of sensor(s) between ILM and NILM.
Technologies 10 00085 g003
Figure 4. Overall system.
Technologies 10 00085 g004
Figure 5. Process of the project using REDD dataset (Phase 1).
Technologies 10 00085 g005
Figure 6. Block schematic diagram of the ENSML model.
Technologies 10 00085 g006
Figure 7. Process Flow of the ENSML method.
Technologies 10 00085 g007
Figure 8. (a) represents Wattage (W) for House 1 while (be) represents power consumption usage for different appliances recorded on the simulator.
Technologies 10 00085 g008
Figure 9. Process hierarchy summarising the steps simulator goes through from start to the end.
Technologies 10 00085 g009
Figure 10. True vs. predicted result with day 1 and day 6 for (a,b) Refrigerator, (c,d) Electrical heat, and (e,f) Microwave.
Technologies 10 00085 g010
Figure 11. Evaluation of architecture in terms of (a) accuracy and (b) aoss.
Technologies 10 00085 g011
Table 1. Visualisation of the Reference Energy Disaggregation Data (REDD) dataset.
NoHouse NumberChannelsAppliances
1House 1204 kitchen outlets, 3 lightings, 3 washer dryer, 2 mains, 2 ovens, 1 refrigerator, 1 dishwasher, 1 microwave, 1 electric heat, 1 stove, 1-bathroom.
2House 2112 mains, 2 kitchen outlets, 1 lighting, 1 stove, 1 microwave, 1 washer dryer, 1 refrigerator, 1 dishwasher, 1 disposal.
3House 3225 lightings, 3 unknown outlets, 2 mains, 2 washer dryer, 2 kitchen outlets, 1 electronic, 1 refrigerator, 1 dishwasher, 1 disposal, 1 microwave, 1 furnace, 1 smoke alarm, 1-bathroom.
4House 4204 lightings, 3 air-conditioner, 2 mains, 2-bathroom, 2 kitchen outlets, 1 unknown outlet, 1 washer dryer, 1 stove, 1 smoke alarm, 1 dishwasher, 1 miscellaneous, 1 furnace.
5House 5265 lightings, 4 unknown outlets, 2 mains, 2 washer dryers, 2 subpanel, 2 electric heat, 2 kitchen outlets, 1 microwave, 1 furnace, 1-bathroom, 1 dishwasher, 1 disposal, 1 electronics, 1 refrigerator.
6House 6173 air-conditioner, 2 mains, 2 kitchen outlets, 2 unknown outlets, 1 washer dryer, 1 stove, 1 electronics, 1 electrical heat, 1-bathroom, 1 refrigerator, 1 dishwasher, 1 lighting.
Table 2. Previous studies on NILM.
NoAuthorMethodAdvantageDisadvantage
1Kelly, Jack, Knottenbelt, Willian [27]LSTMWork best for two state appliancesDoes not perform well when it comes to multi-state appliances such as washing machine and dish washer
2Somchai, Boonyang [28]ANNWith incomplete information, the data may still produce output.Provides a probing solution, but it does not specify the why or how.
3Barsim, Karim Said; Bin Yang [29]SSLIt estimates the structure of the unlabelled data from its own predictions rather than relying on additional clustering components for this purpose.Error propagation occurs when misclassified observations are chosen for an iteration, causing the prediction function to be increasingly skewed in subsequent iterations
4Faustine, Anthony; Pereira, Lucas; Bousbiat, Hafsa and Kulkarni, Shridhar [30]DNNTo be able to estimate the prediction’s uncertainty by combining appliance states and power consumption values.Single target regression, which ignores any correlations between targets, yielding a single model for each.
5Jiang, Jie; Kong, Qiuqiang; Plumbley, Mark D; Gilbert, Nigel; Hoogendoorn, Mark and Roijers, Diederik M [31]WaveNetA reduction in filter sizes is achieved by reducing the size of the convolution filters as compared to conventional CNN(s).Must minimise the loss with an optimizer with a learning rate of 0.001
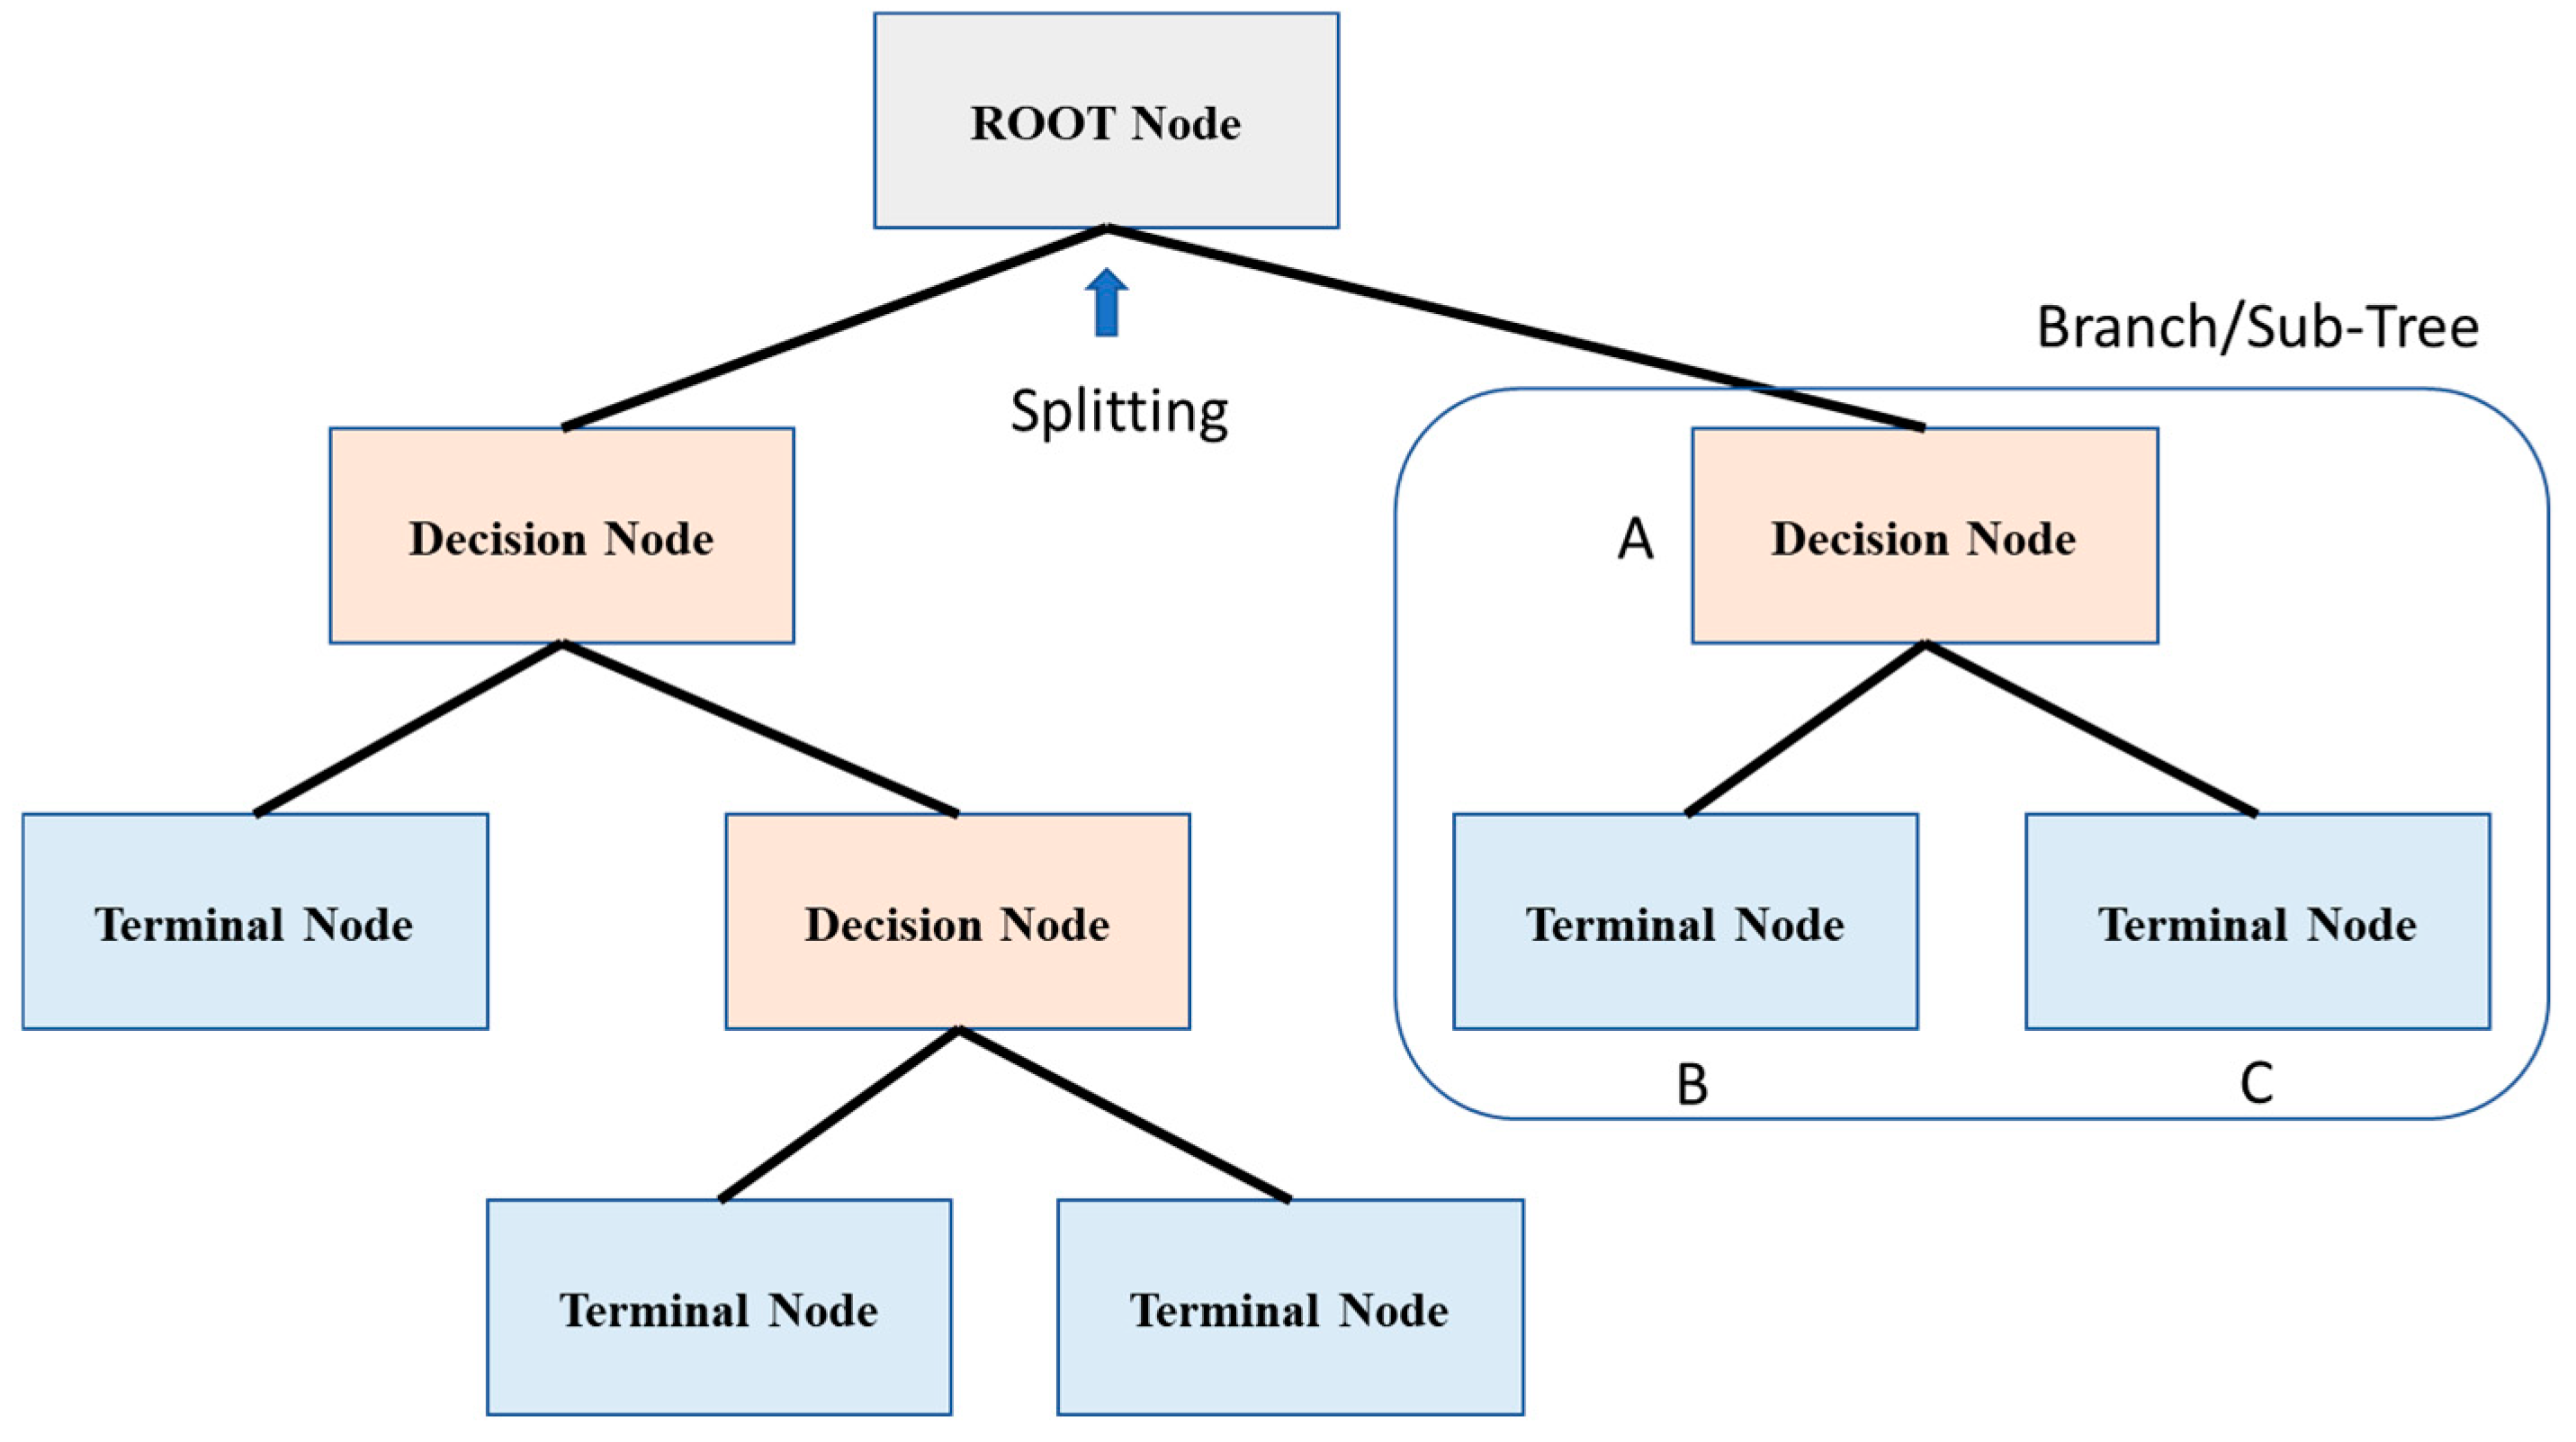
Table 3. The explanation of terminology used in ENSML model.
NoTerminologyExplanation
1Root NodeThis is a sample of an entire population that is divided into two or more homogeneous groups.
2SplittingA process in which a node is divided into two or more sub-nodes
3Decision NodeIn a decision network, each subnode splits into further subnodes
4Leaf/Terminal NodeNodes that do not split are known as Leaf or Terminal nodes.
5PrunningPruning is opposite to splitting. It is removing sub-nodes of a decision node
6Branch/Sub-TreeAn individual branch or sub-tree is a part of an entire tree.
7Parent and Child NodeUsually, the parent node of subnodes is referred to as the parent node, whereas subnodes are its children.
Table 4. Advantages and disadvantages of the ENSML method.
NoBenefitsShortcomings
1The model can be applied to both classification and regression.Prone to overfitting.
2Understanding, interpreting and visualising are easy.No way to extrapolate.
3There is no constraint on data type.Regression can be unstable.
Table 5. Performance of the architecture.
ClassAccuracy
(%)
Recall Rate
(%)
Precision
(%)
F1-Score
(%)
MAE
(%)
Refrigerator99.55699.66799.33699.5010.64
Microwave98.75299.5499.14599.460.98
Electrical Heat99.45499.1499.55699.750.35
Table 6. Comparison of the performance of other methodologies with proposed method.
ContributionMethods/TechniquesNumber of AppliancesPrecision [%]
[42]Factorial hidden Markov modelsREDD82
[43]Deep Learning ApproachREDD76
[44]Back propagation neural networkREDD45
[45]K-means clustering algorithmREDD62
[46]Unsupervised Linear Discrimination MethodREDD81
[47]CNN binary classifierprivate97
[48]Deep CNN and a KNN classifierprivate93.8
Present WorkEfficient Non-parametric Supervised Machine Learning NetworkREDD99.55
Publisher’s Note: MDPI stays neutral with regard to jurisdictional claims in published maps and institutional affiliations.

