Article

Two-Step Validation of a New Wireless Inertial Sensor System: Application in the Squat Motion

University Polytechnic Hauts-de-France, CNRS, UMR 8201 LAMIH, F-59313 Valenciennes, France
*
Author to whom correspondence should be addressed.
Technologies 2022, 10(3), 72; https://doi.org/10.3390/technologies10030072
Submission received: 28 April 2022 / Revised: 1 June 2022 / Accepted: 2 June 2022 / Published: 9 June 2022
(This article belongs to the Section Assistive Technologies)

Abstract

:
The use of Inertial Measurement Units (IMUs) can provide embedded motion data to improve clinical application. The objective of this study was to validate a newly designed IMU system. The validation is provided through two main methods, a classical sensor validation achieved on a six-degrees-of-freedom hexapod platform with controlled linear and rotation motions and a functional validation on subjects performing squats with segmental angle measurement. The kinematics of the sensors were measured by using an optoelectronic reference system (VICON) and then compared to the orientation and raw data of the IMUs. Bland–Altman plots and Lin’s concordance correlation coefficient were computed to assess the kinematic parameter errors between the IMUs and VICON system. The results showed suitable precision of the IMU system for linear, rotation and squat motions.

1. Introduction

The medical application of Inertial Measurement Units (IMUs) has been a growing field for more than a decade. The use of real-time motion analysis, human–computer interface or embedded motion capture, and the combination of small size, good reliability and low cost has convinced many researchers in biomechanics to use such systems. One recent application of this technology has been proposed within the Interreg NOMADe project (http://nomadeproject.eu/, accessed on 1 October 2019) to provide insight into the treatment and rehabilitation of people suffering from Neuro-Musculoskeletal Disorders (NMD). According to the World Health Organization, more than 1.7 billion people in the world suffer from NMD [1], and among them, more than 568 million suffer from low-back pain (LBP). Low-back pain is a symptom, not a disease, and can result from several different known or unknown abnormalities or diseases [2]. LBP is a defined pain location, typically between the lower rib margins and the buttock creases [3]. It is commonly accompanied by pain in one or both legs. With 70% to 85% of the population experiencing LBP during their lifetime [4,5], it represents a socio-economic cost estimated at several billion EUR/year [6,7,8] and an increased risk of early retirement as well as sick leave [9]. From a locomotor point of view, LBP sufferers are characterized by significant sagittal trunk lean modifications [10] associated with alterations in their orthostatic balance control [11,12] and gait [13]. Clinical evaluation of LBP patients has relied in part on the history of their complaint and the assessment of their physical condition [14]. Trunk motion is usually assessed by clinical tests such as the fingertips-to-floor test, Schöber test [15] or using inclinometers [16]. Unfortunately, the metrological reliability of these clinical tests remains low [17,18], and they do not allow for movement characterization over the entire range of motion [14]. In the context of clinical testing, using IMUs allows for the acquisition of quantitative motion information that can contribute to the completion of the clinical assessment and rehabilitation follow-up of patients with LBP.
Naturally, in order to avoid any unsuitable use of this system [19], a thorough validation of the IMU system is required. The IMU system created in the NOMADe project has been verified through experiments in previous work [20,21], but only with low-resolution methods (photogrammetry) and without a gold standard reference comparison (e.g., VICON optoelectronic system) for human motion. In order to be accepted by clinicians and used as a rehabilitation tool, the IMU system needs to be validated in comparison to a gold standard. Previous studies of the validity and reliability of wearable inertial sensors mainly focus on applications such as the study of walking [22] or whole-body kinematics [23,24], but seldom in the context of low-back pain rehabilitation.
Precision and accuracy of the sensors are always at the heart of validation papers and are usually assessed through the well-known Bland–Altman method [25]. To date, no standardized and validated protocol exists for sensor placement on the body [26]. It is thus crucial to assess the sensitivity of the motion system in this area, which is known to greatly alter the final kinematic results [27].
Previous research aiming at the validation of IMU systems can be grouped into two categories: (1) purely sensor validation, where the sensors are equipped on machines and submitted to arbitrary motions or static positions [28,29], and (2) segmental functional validation, where a single IMU is used to measure the orientation of one human segment [30,31]. One innovation of this article is to provide both validations in the same study.
The main application of IMUs of the NOMADe project is in the clinical field, particularly in the prevention and treatment of low-back pain. Burns et al. [32] demonstrated that in this context, 91% of therapy interventions were focused on strengthening the hip joint and 83% used the double-leg squat as a muscle-strengthening exercise. The squat motion combines angular motion of the thigh in three planes, and is thus relevant for motion capture validation. Moreover, the IMU system is designed to be used by clinicians without training in motion capture as a pure sensor (measuring only acceleration or angular speed of computed parameters such as kinetic energy [30] or entropy of acceleration signals [33]) or in combination with others to produce joint angles, as in [34]. Hence, the focus of this article is more based on the validation methodology rather than the complexity of potential clinical applications with several joint angles.
Our main goal with this paper was to provide a two-step validation of the gold standard of this new IMU system designed within the NOMADe project. Each step provides exhaustive information on the usage of the IMU system as a pure sensor (acceleration and angular speed) or a joint angle estimation system for motion capture in clinical conditions.

2. Materials and Methods

2.1. Participants

Fifteen healthy subjects (3 females, 12 males), all members of the laboratory (LAMIH UMR CNRS 8201), were recruited to participate in this study (see Table 1). Inclusion criteria were the absence of any neuro-musculoskeletal disorders in the past 6 months. The study was approved by Lille University’s ethics committee (reference number: 2021-523-S97).

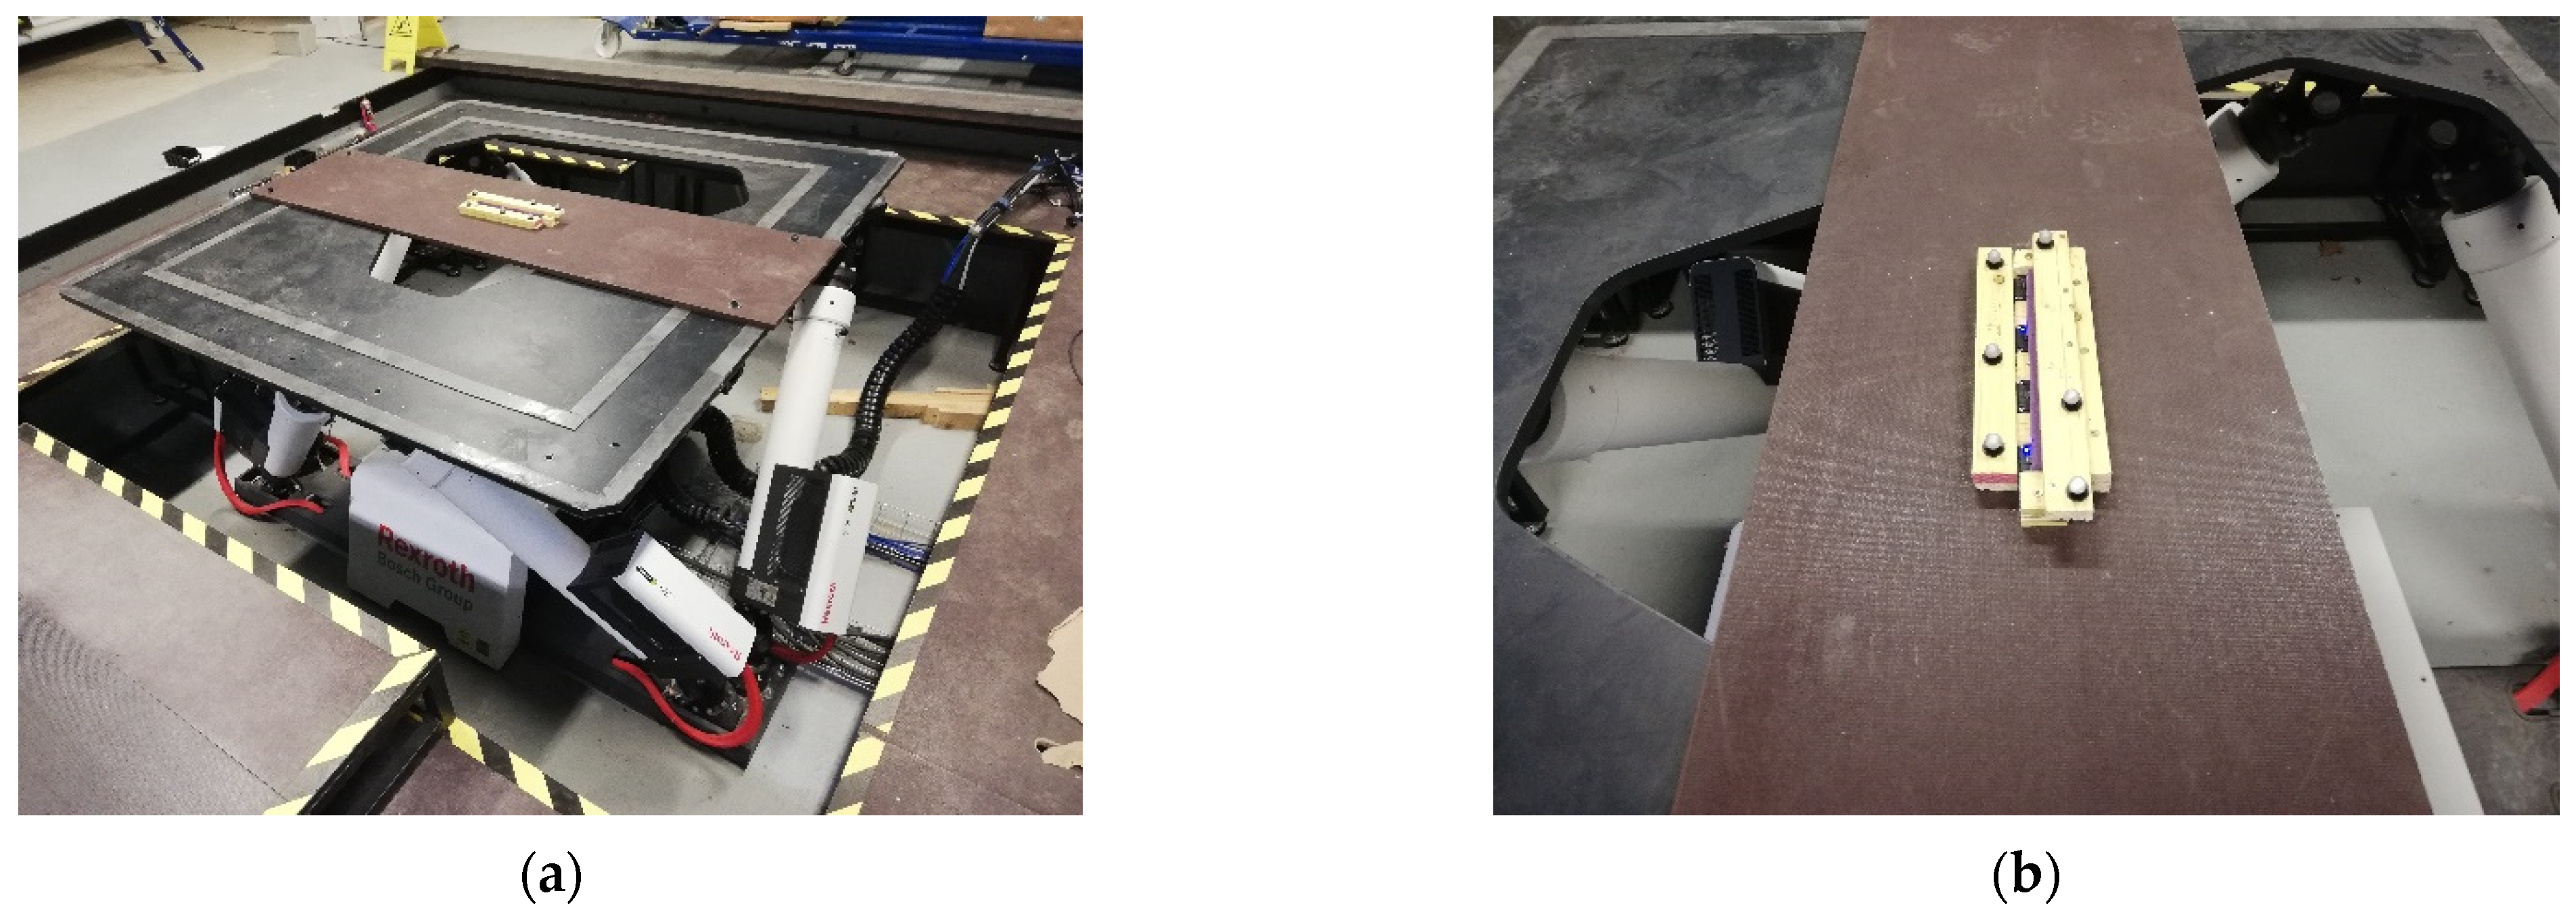
2.2. Sensor Validation

The motion analysis system is composed of a Data-Capturing Unit (DCU) receiving the measured data of four wireless IMUs. Details of the IMU system are provided in previous work [35].
A hydraulic hexapod (Rexroth eMotion-2700, Bosch Group, Gerlingen, Germany) was used to perform the sensor validation through accurate, repeatable and controlled motions. This platform is composed of a rigid plate overlaying electrically driven linear servo actuators and six ball-screw spindles generating translation and rotation in the 3 planes of space.
A plywood board was fixed on the hexapod, and the four IMUs were aligned to the hexapod coordinate system and fixed to the board with a wooden casing (see Figure 1). Translations and rotations along the 3 axes were performed at 20%, 50% and 80% of the maximum linear and angular velocity (10 m/s2 and 400 deg/s2, respectively), respectively, and repeated three times.
Kinematics of 6 spherical retro-reflective markers placed on the board were measured with an optoelectronic system composed of 6 infrared VICON® cameras disposed around the wooden casing.

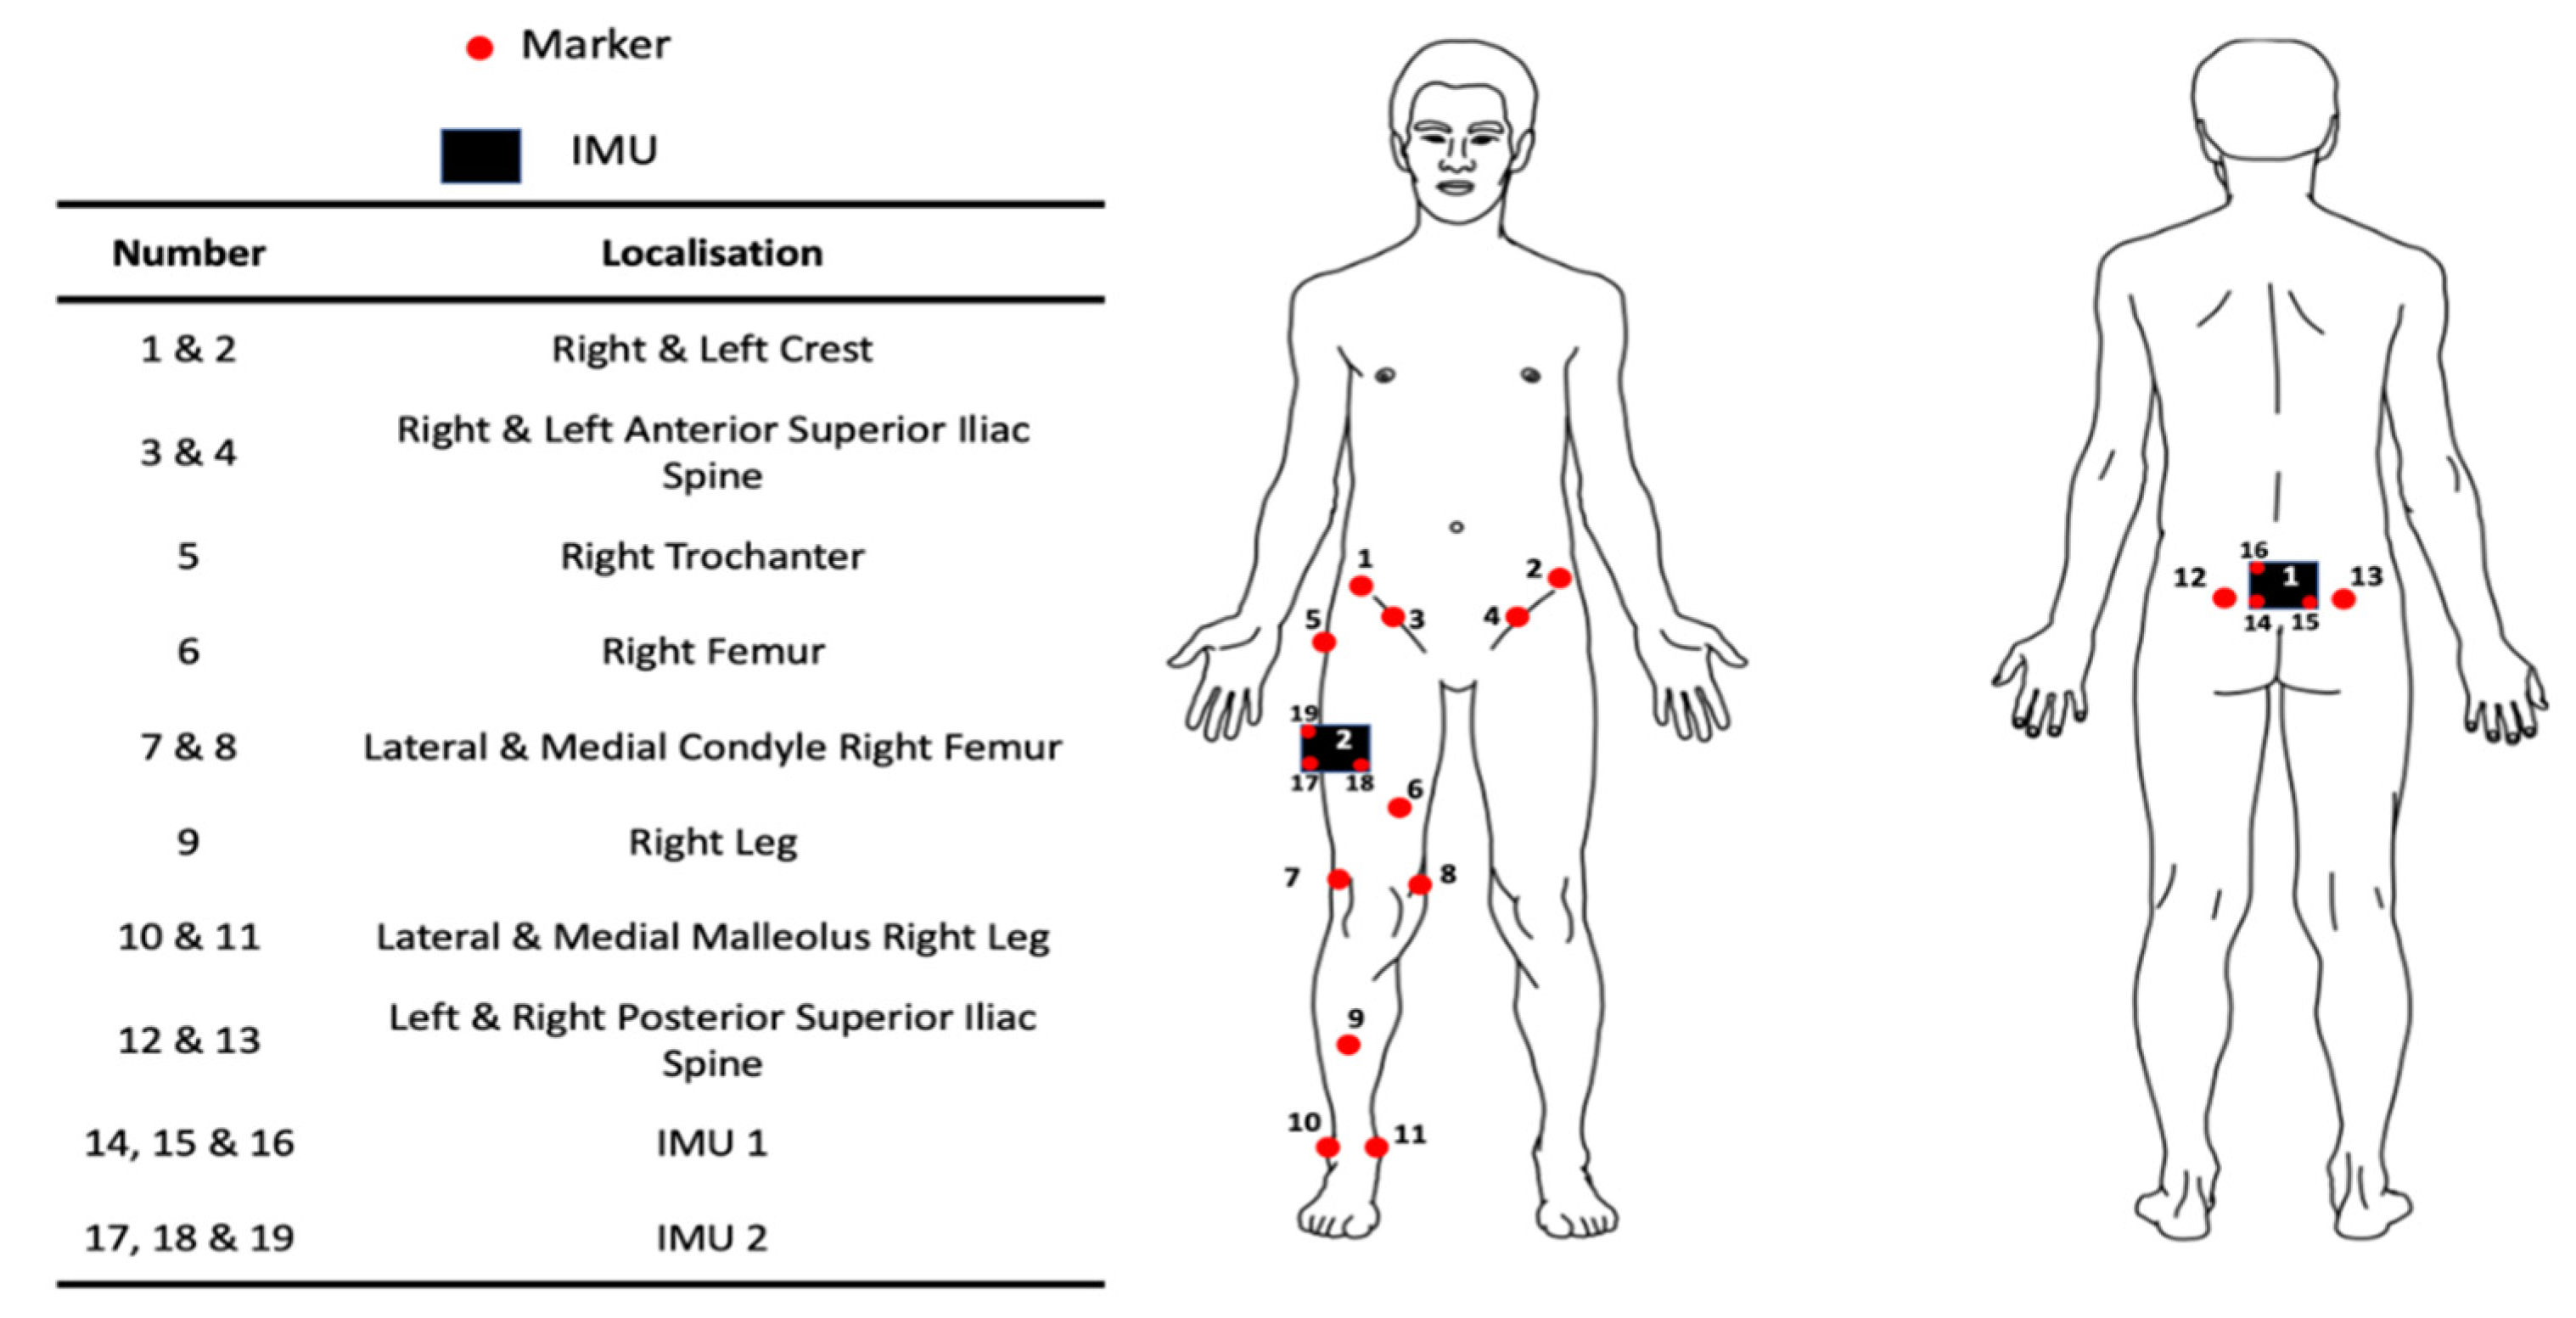
2.3. Functional Validation

To be consistent with the clinical practice [32], the double-leg squat motion was used for the functional validation procedure of the IMU system. For each participant, 13 spherical retro-reflective markers were placed over anatomical landmarks of the pelvis and right lower limb (see Figure 2). One IMU sensor was placed on the pelvis between left and right posterior superior iliac spine. One other IMU sensor was placed on the lateral face of the right thigh, aligned between the trochanter and lateral femoral condyle. Clusters of 3 markers were placed on each IMU to compute their orientation via the optoelectronic system.
Participants completed 3 squatting trials, each lasting 10 s. During each trial, they were asked to perform as many squats as possible, with the arms kept horizontal and maintaining a straight back. A squat was considered as completed when reaching an estimated 90° knee flexion angle. Each participant had the opportunity to train before the trials. A 30 s rest was given between each trial.
For this study, IMU sampling frequency was set to 50 Hz and the output data were orientation quaternion, angular velocity vector and acceleration vector. The reference system for the validation of the IMU system is an optoelectronic system composed of 13 infrared VICON® MX cameras with a sampling frequency scaled at the default sampling frequency of 100 Hz.

2.4. Data Processing

2.4.1. Filtering and Interpolation

Bluetooth data transfer was performed in the form of data packets containing 10 samples each, and occasionally, some packets were not transmitted. All acquisitions with more than 3 missing packets in a row were excluded and a new acquisition was performed. To correct missing packets, the IMU data were re-interpolated at 50 Hz.
Optoelectronic data were resampled at 50 Hz to be easily compared to the IMU data. VICON signals were filtered by a fourth-order Butterworth low-pass filter with a cut-off frequency of 6 Hz (as found in [34]), and IMU signals were filtered by a fourth-order Butterworth low-pass filter with a cut-off frequency of 20 Hz (as found in [36]).
All the data were coming from separated systems (IMU and VICON) and were not synchronous. A cross-correlation algorithm based on linear acceleration was developed to resynchronized all the motion data and to crop all time-series to the common parts (see Appendix A).

2.4.2. Linear Acceleration Computation

The acceleration measured by the IMU system is corrupted by the contribution of Earth’s gravity. To obtain the true linear accelerations of the IMU, one must subtract the gravity vector to the acceleration vector expressed in the global coordinate using the quaternion of orientation between the local coordinate system and the calibration reference system computed by the DCU [21]. First, we must compute the quaternion of gravity.
Q g G = 0 0 0 9.81 . 1 i j k
where i , j and k are the imaginary triplets at the core of quaternion computing. Similarly, we compute the quaternion of acceleration in the local coordinate system (linked to the IMU):
Q a l o c = 0 a x l o c a y l o c a z l o c . 1 i j k
Hence, the quaternion of linear acceleration in the global reference system yields:
Q a G l i n = Q l o c / G Q a l o c Q l o c / G ¯ Q g G
where Q l o c / G is the quaternion of orientation between the local and global coordinates system, Q l o c / G ¯ is the conjugates quaternion and is the operator for the quaternion product [37]. Going back to the linear acceleration vector in the local coordinate system, we obtain trivially:
Q a l o c l i n = Q l o c / G ¯ Q a G l i n Q l o c / G

2.4.3. Thigh and IMU Sensor Orientation
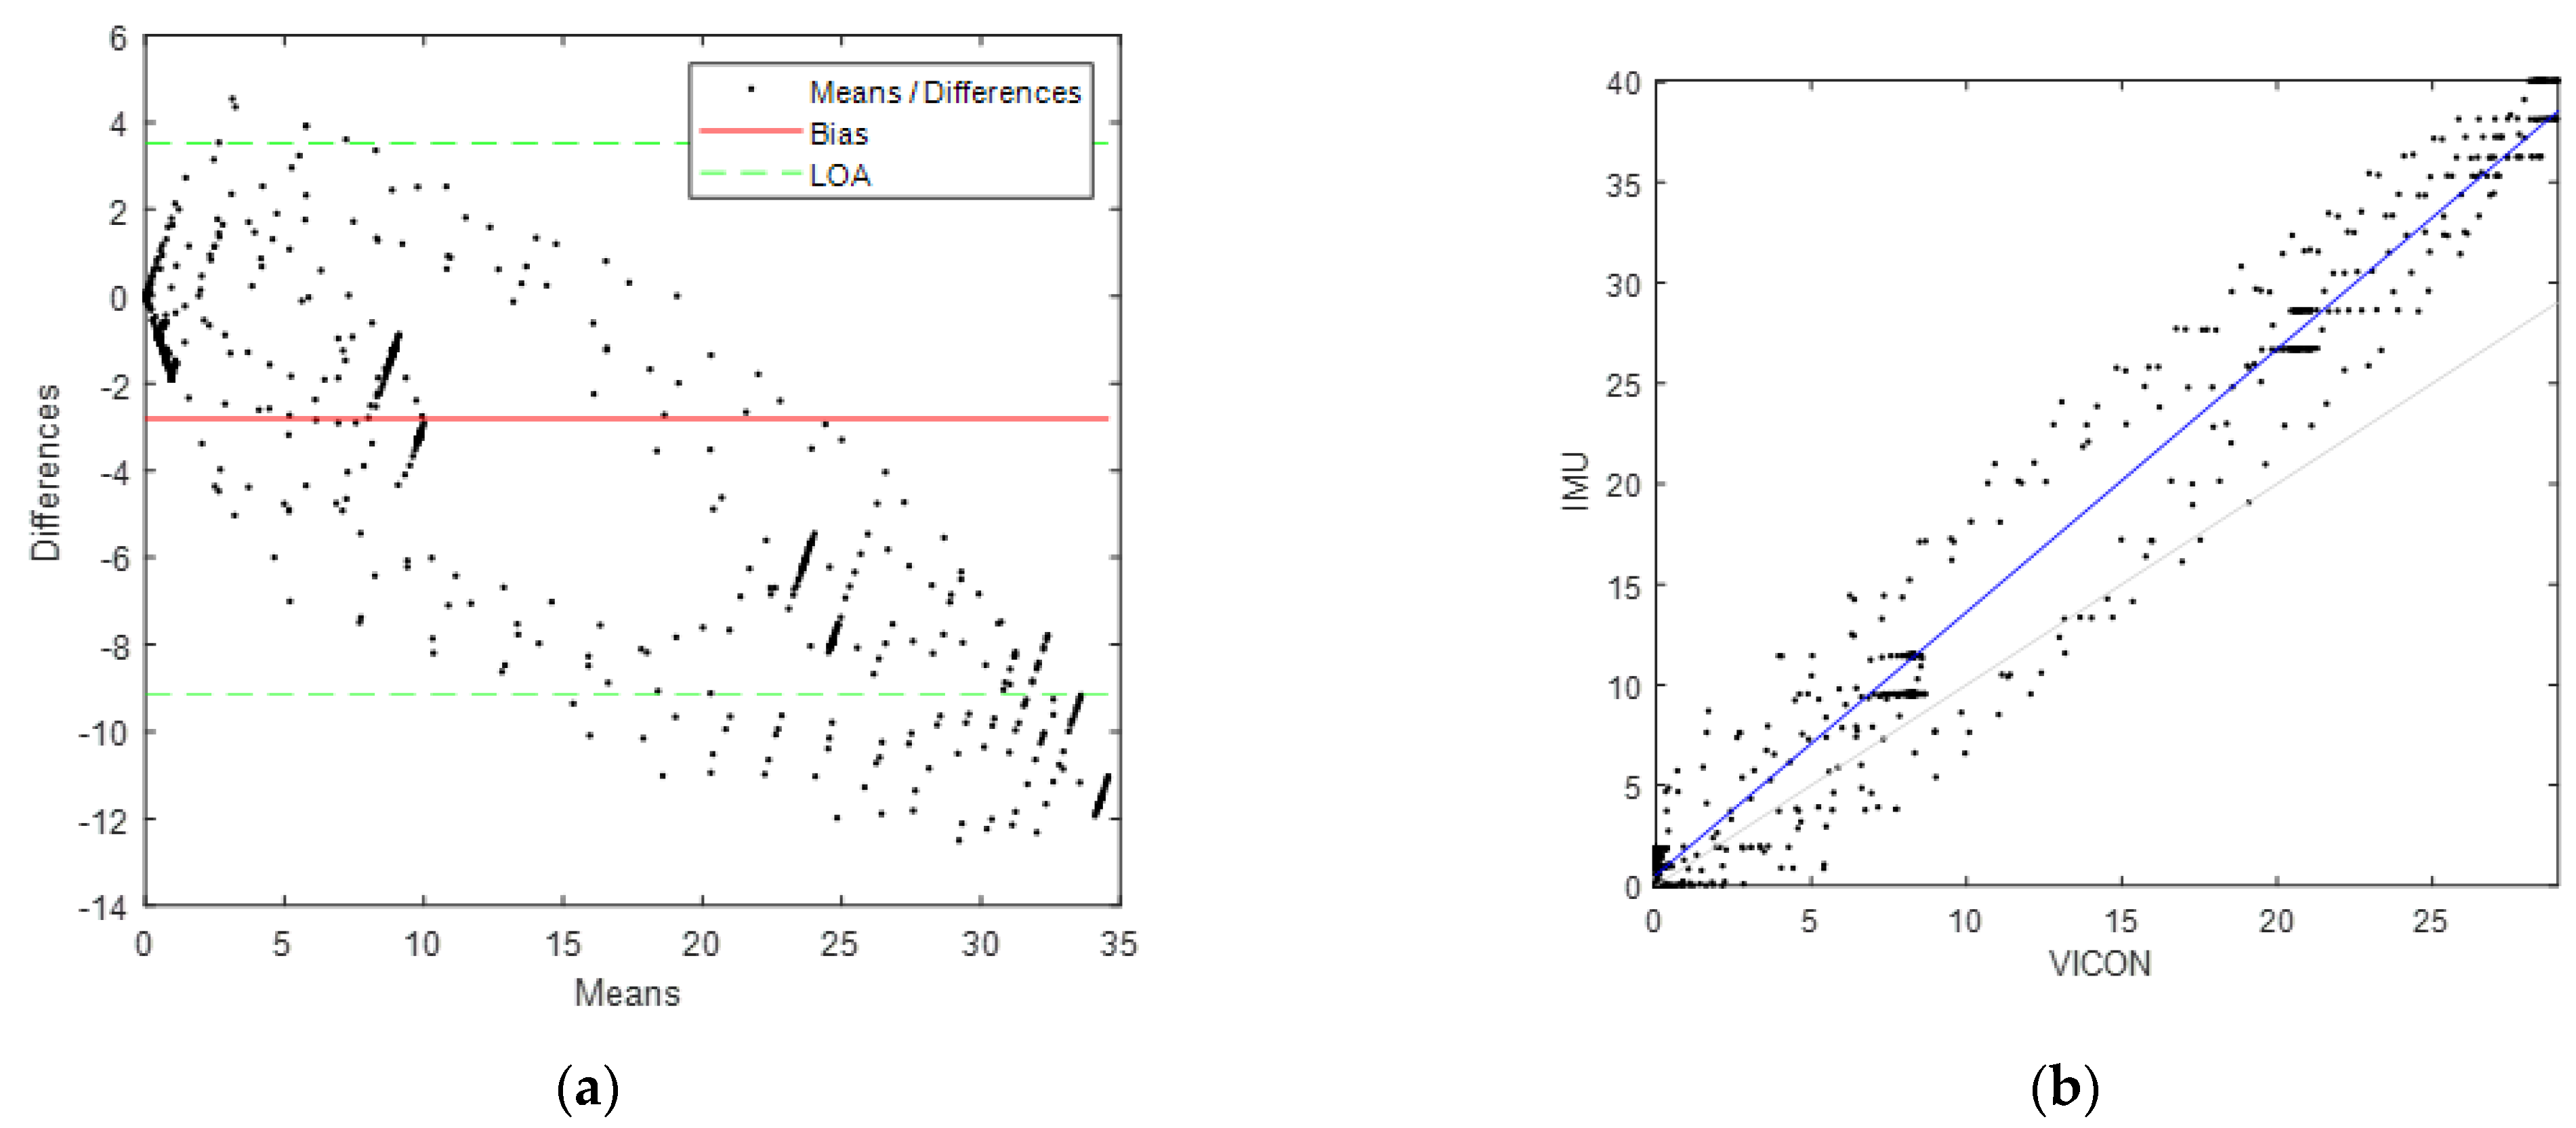
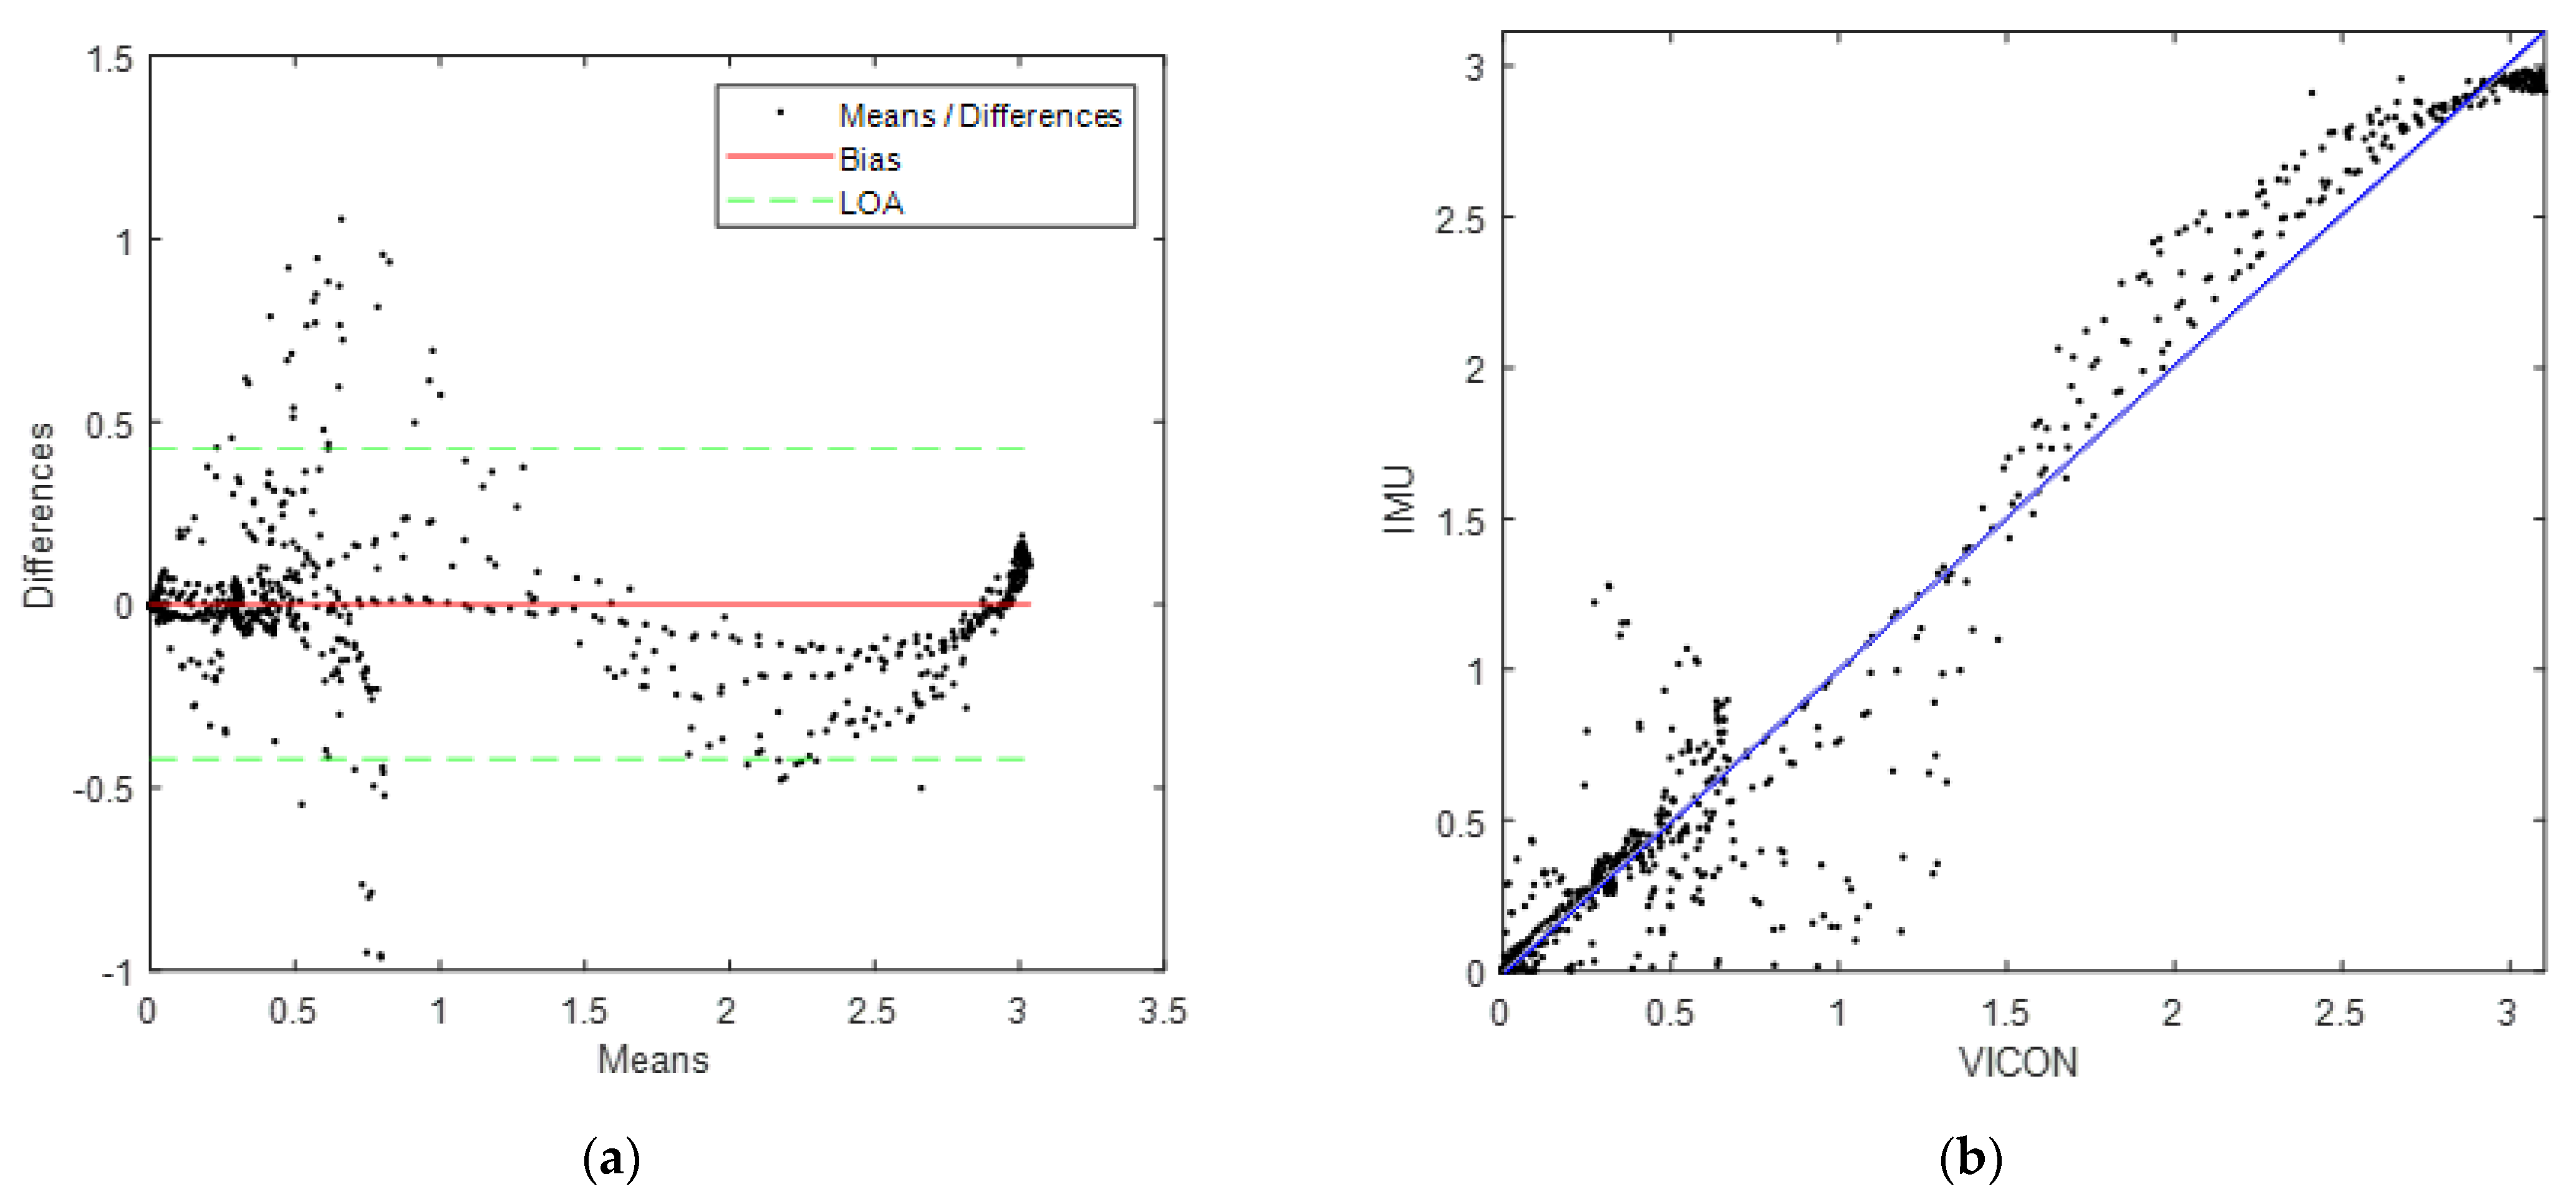
From the markers applied on the thigh and pelvis, the symphision point, hip joint center and knee joint center were deduced using the regression equation [38]. These points are mandatory to compute the rotation matrix of the thigh, which was then transformed into yaw/pitch/roll angles using a ZYX mobile sequence [39].
The orientation angles of each IMU sensor can be deduced from Q l o c / G , the quaternion orientation. The first step is to compute the rotation matrix of the sensor from the quaternion vector [37], followed by the yaw/pitch/roll angles’ computation explained above [39].

2.5. Data Analysis

The well-known Bland–Altman method [25] was used to obtain a visual representation of agreement between the reference and the measurement system to be validated. According to [40,41], the bias and limit of agreement (LOA) of the Bland–Altman method enables us to assess the correctness and fidelity of a new measurement system. The bias value represents the mean of the difference between systems, and the limits of agreement (LOA) are computed as the bias ± 1.96 times the error’s standard deviation.
Bias can be compensated when the difference shifts from positive to negatives values; hence, the precision is computed as the mean of absolute value of the difference to avoid such a phenomenon.
Lin’s concordance correlation coefficient (CCC) [42] was used in this study to obtain numerical information about the agreement between measurement methods. The CCC quantifies the difference between the abscissa points of a first dataset, the ordinate of a second one and the 45° line corresponding to the perfect agreement [43]. This coefficient is computed by taking the product between the Pearson correlation coefficient and a coefficient measuring the gap between the 45° line and the linear regression line. This CCC was chosen instead of the Intraclass Correlation Coefficient, which does not always give the same results depending on the computation method. A CCC between 0.71 and 0.80 is satisfactory, between 0.81 and 0.90 is fairly good, between 0.91 and 0.95 is very good and above 0.95 is excellent [43]. Finally, the squared Pearson’s correlation coefficient (r2) gives the quality of the linear model to represent the relationship between the two datasets.
The Bland–Altman plot and CCC were used for sensor validation, where linear acceleration and angular velocities were used from the reference system and compared to the IMU measurement. Likewise, for the functional validation, the yaw angle of the thigh computed with VICON was compared to that obtained from the IMUs on the thigh.
All the processing and statistical analyses were performed with MATLAB© R2020b software (The MathWorks, Natick, MA, USA).

3. Results

3.1. Sensor Validation

The results of the statistical analysis based on all hexapod motions are presented in Table 2; examples of Bland–Altman plots are presented in Figure 3 (linear acceleration) and Figure 4 (angular velocity). Regarding the accelerometer data, bias values are extremely low, and both linear regression and Lin’s CCC can be considered as excellent. Despite presenting slightly lower results, angular velocity concordance is still very good to excellent.

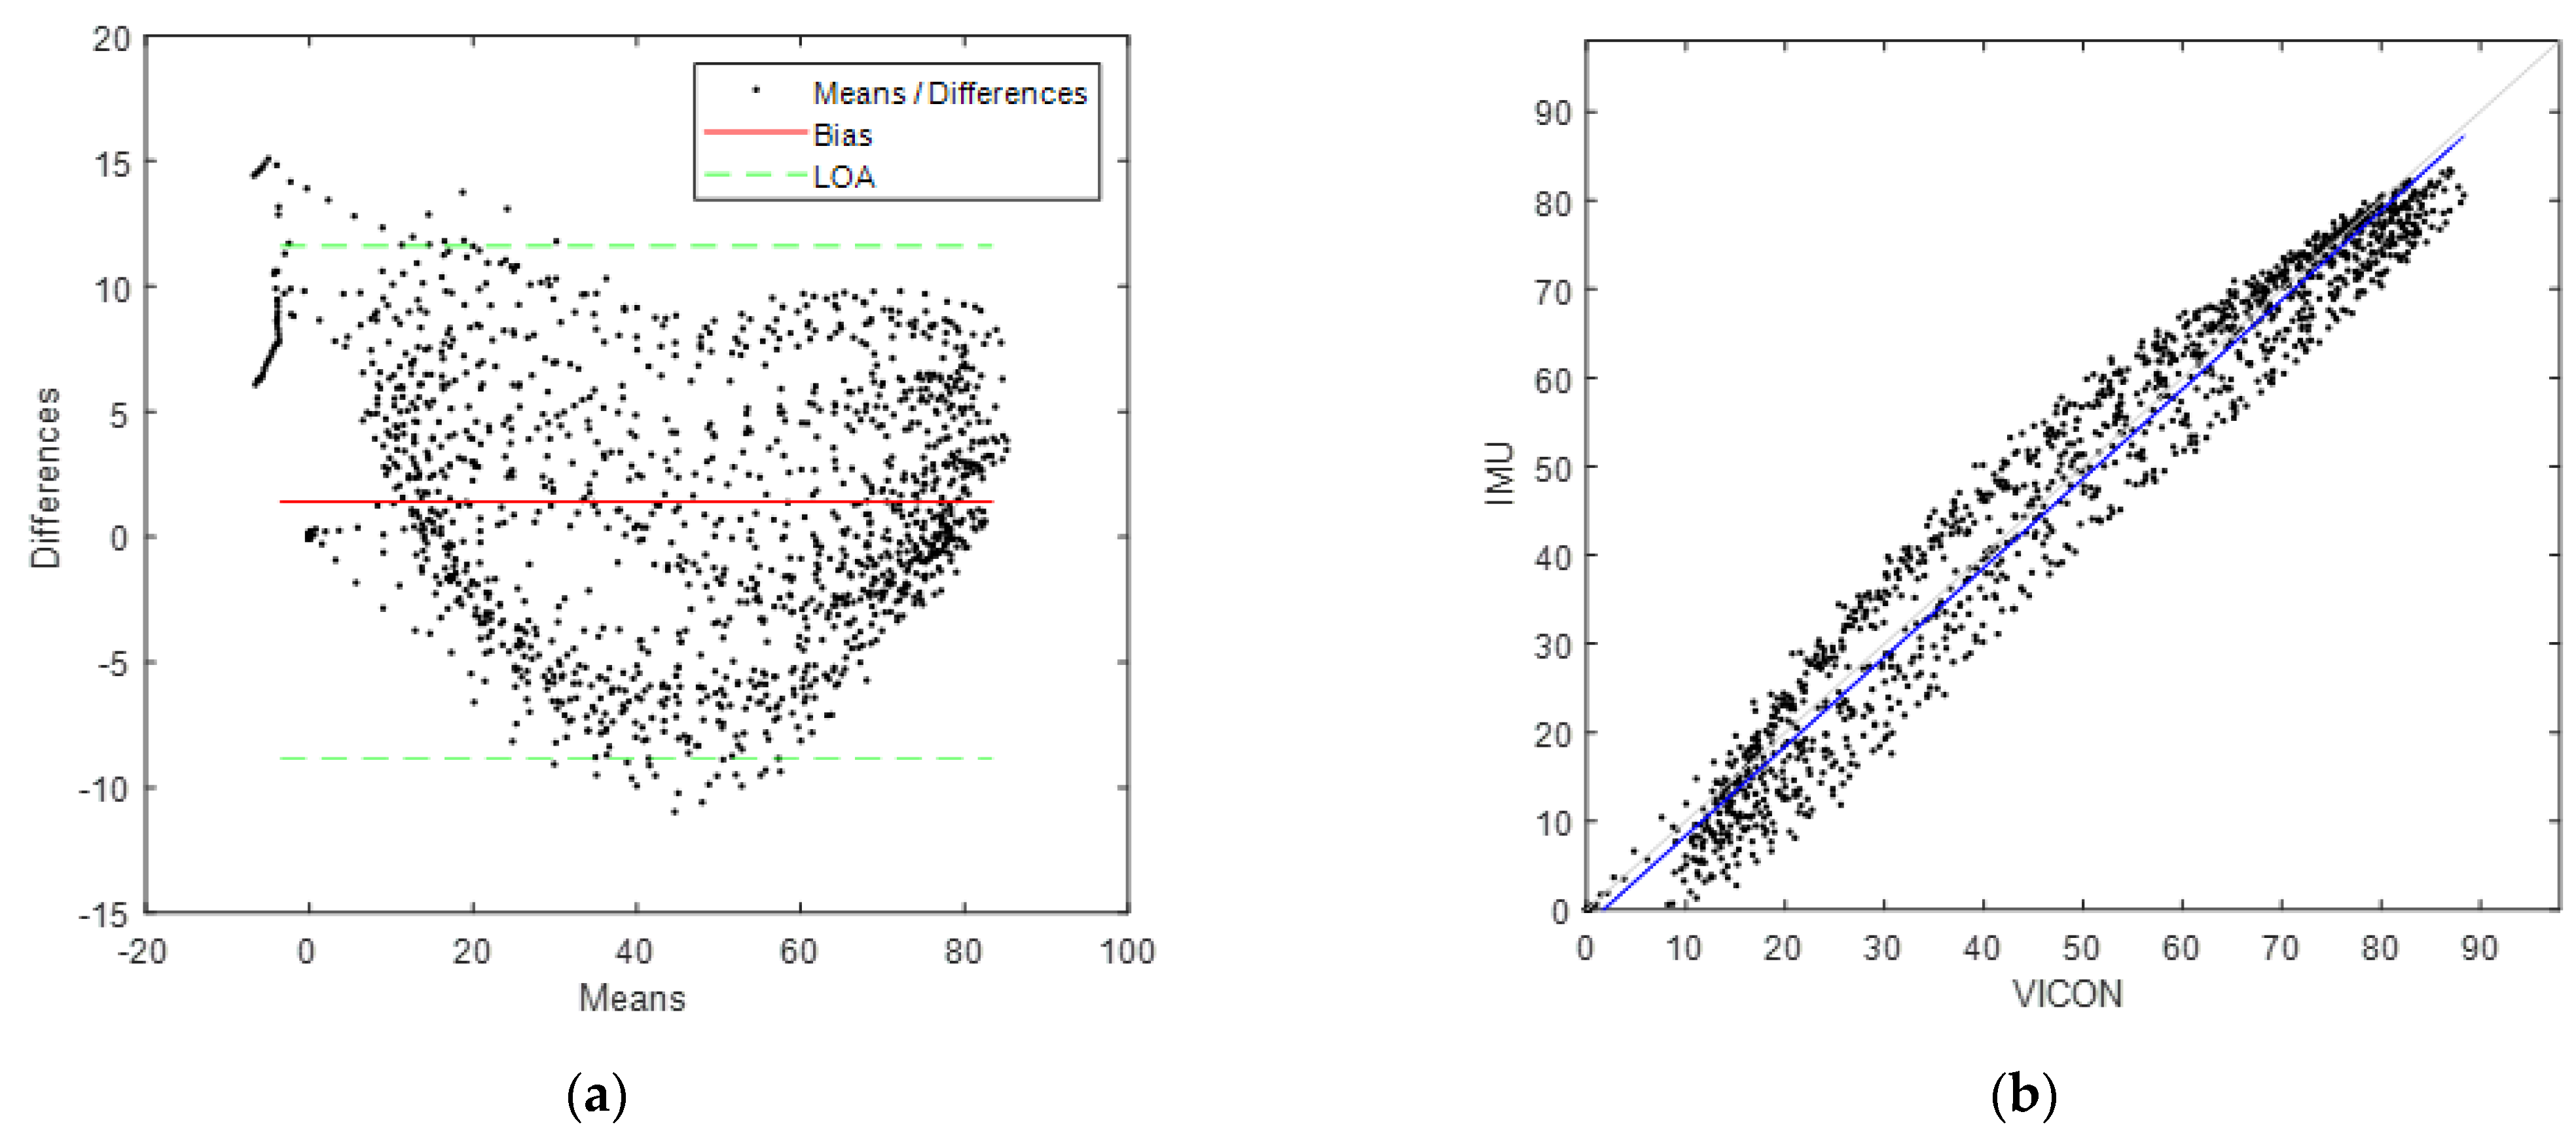
3.2. Segmental Functional Validation

Table 3 presents the statistical analysis results of the thigh yaw angle computed with VICON compared to the one obtained from the IMUs on the thigh (i.e., IMU 2, 3 and 4). Examples of Bland–Altman and linear regression plots are presented in Figure 5. Lin’s CCC is excellent.

4. Discussion

The main objective of the present paper was to validate the use of a new IMU system to improve clinical practice using objective measures without requiring expensive investments for physiotherapists. A two-part validation was followed to assess the quality of the measurement at different levels. The first part was a raw sensor validation with arbitrary motions from a hexapod. The second part was classical function validation against a gold standard motion capture system during a squat motion (the main motion in the treatment of low-back pain).

4.1. Limitations

Some limitations are present in our study, starting with the hexapod motions, which are limited in terms of acceleration and angular velocity ranges. Previous research showed that IMU accuracy could be affected by velocity [28]; hence, quicker motions could have produced higher bias or LOA in the results. In Figure 3a, accelerometer measurements sometimes exceed the LOA; this is due to small vibrations of the hexapod platform hitting security limits, which are not captured by the VICON system. Both the wooden casing’s elastic behavior and internal safety limitations within the hexapod motion software might have produced vibrations in the recorded motions.
One source of error in the angular orientation of the thigh could be due to the well-known soft tissue artefacts (STA) and wobbling masses of the lower limb. The STA could impact the IMU and VICON differently because the sensors are not in the same position as the reflective markers. Nevertheless, a preliminary study [44] showed little effects of STA and wobbling masses when accelerations are low (which is the case for squat motion). The lower trunk IMU not only measures the pelvis orientation but also the lower back motion, which brings errors in the hip angle estimation required in biomechanics.
Finally, better precision could have been obtained by combining magnetometer measurements with our IMU. The reason for this choice was that doing so would have resulted in increasing the sensitivity to magnetic disturbance [34,45], which can be very important in medical facilities (high-power cables, MRI, …).

4.2. Validation Methodological Tools

In the field of sensor validation, the notions of accuracy and agreement are often used, and it is crucial to agree on the terminology, as previous studies have shown discrepancies in the use and interpretation or core concepts [46]. The accuracy described the capacity to discriminate two subjects in spite of measurement error (systematic error and random error). A measurement method has good agreement if it is able to measure the same value in a subject twice, independently of the values of other subjects [43]. To employ the new measurement method, it is necessary to evaluate it and compare these results with a method considered as a reference, and to estimate the agreement between these two measurement methods.
The use of a new measurement method requires its validation in comparison with a reference system. In metrology, the science of measurement, according to the latest international standard [47], the validation of a measurement system depends on its accuracy. This concept of accuracy is defined by the correctness and fidelity, via the comparison between the new measurement method and the previously measured value considered as true. The correctness designates the narrowness of agreement between the mean of measurements and the value accepted as a reference. The fidelity represents the narrowness of agreement between a set of measurements. The accuracy expresses the degree of agreement between the new system of measurement and the reference. The agreement is the ability of a measurement method to provide a quantitative parameter value as close as possible to that obtained with another measurement method. The notion of agreement is used more when the new measurement system is simultaneously compared with the reference system under the same measurement conditions [43].

4.3. Sensor Validation

The sensor’s validation is in agreement with previous publications concerning IMUs. In [29], the authors exposed the IMUs to rotations in three axes using a custom-made rotation device, and studied the angular velocity. The Bland–Altman method resulted in bias values between 5 ° / s and 10 ° / s , LOA 5 ° / s 25 ° / s . Our results presented in Table 2 are slightly more precise, with a bias around 4 ° / s , LOA 12 ° / s 3 ° / s . An error increasing with the angular velocity can be observed in Figure 4. This behavior has been discussed in [29], and its impact on orientation estimations will be very low considering the angular velocities observed in clinical tasks. In [48], accelerations during sit-to-stand motions were compared between IMUs and VICON, resulting in a bias value of around 0.1   m / s 2 , LOA 0.15   m / s 2 0.38   m / s 2 . This is in agreement with the data presented in Table 2. In the works of Lebel et al. [28], the authors rotated IMUs with a gimbal device and studied the orientation angles in three axes. The obtained mean error was between 5 ° and 12 ° , LOA 15 ° 30 ° . Our results presented in Table 3 are more precise, with a bias between 1 ° and 5 ° , LOA 8 ° 15 ° .

4.4. Functional Validation

The functional validation results are coherent with the literature. In [23], the authors compared the joint angles from a low-cost IMU system with a classical optical system using either a standard anatomical model [49] or proprietary software. The Bland–Altman method at the hip joint resulted in bias values between 0 ° and 11 . 8 ° , LOA 10 ° 30 ° . Our results presented in Table 3 are slightly more precise, with a bias between 1 . 5 ° and 5 . 3 ° , LOA 8 ° 15 ° .

5. Conclusions

The IMU system created in the NOMADe Project has been positively validated both as a classic IMU sensor and for the squat motion, which is the main exercise during low-back pain treatment. A comparison between the IMU system and a gold standard motion capture system revealed a very good to excellent agreement for sensor validation and an excellent agreement for functional validation.
The pragmatic and “simple” approach (from an ergonomics point of view) at the core of this IMU system is vital to maintain the production of easy-to-use equipment for clinicians and in clinical application.
The two-step validation procedure presented in this article is a more exhaustive approach for validating an IMU system. Indeed, this type of sensor can be used by itself as a “pure” sensor (measuring only acceleration or angular speed) or in combination with other IMUs to produce joint angles.
Future work will be dedicated to using this device for low-back pain rehabilitation evaluation and for the quantification of classical clinical tests based on qualitative parameters.

Author Contributions

Conceptualization, M.B.; methodology, M.B. and R.G.; validation, M.B., R.G. and R.H.; formal analysis, M.B., R.G. and R.H.; investigation, M.B., R.G. and R.H.; resources, M.B. and R.G.; writing—review and editing, M.B., R.G., R.H. and S.L.; supervision, S.L. All authors have read and agreed to the published version of the manuscript.

Funding

This research was funded by the French Ministry of Higher Education, Research and Innovation; the National Centre for Scientific Research (CNRS); and the NOMADe Project of the EU Interreg Program under grant number 4.7.360.

Institutional Review Board Statement

The study was conducted according to the guidelines of the Declaration of Helsinki, and approved by the Ethics Committee of Lille University (protocol code 2021-523-S97 and date of approval 15/09/2021).

Informed Consent Statement

Informed consent was obtained from all the subjects involved in the study.

Data Availability Statement

The data presented in this study are available on request from the corresponding author.

Acknowledgments

The authors wish to thank C. Gillet, T. Poulain, G. Conreur, J. Greenfield and I. Haymue from LAMIH and all our colleagues in the NOMADe project, especially the KUL team for their great design and explanations.

Conflicts of Interest

The authors declare no conflict of interest.

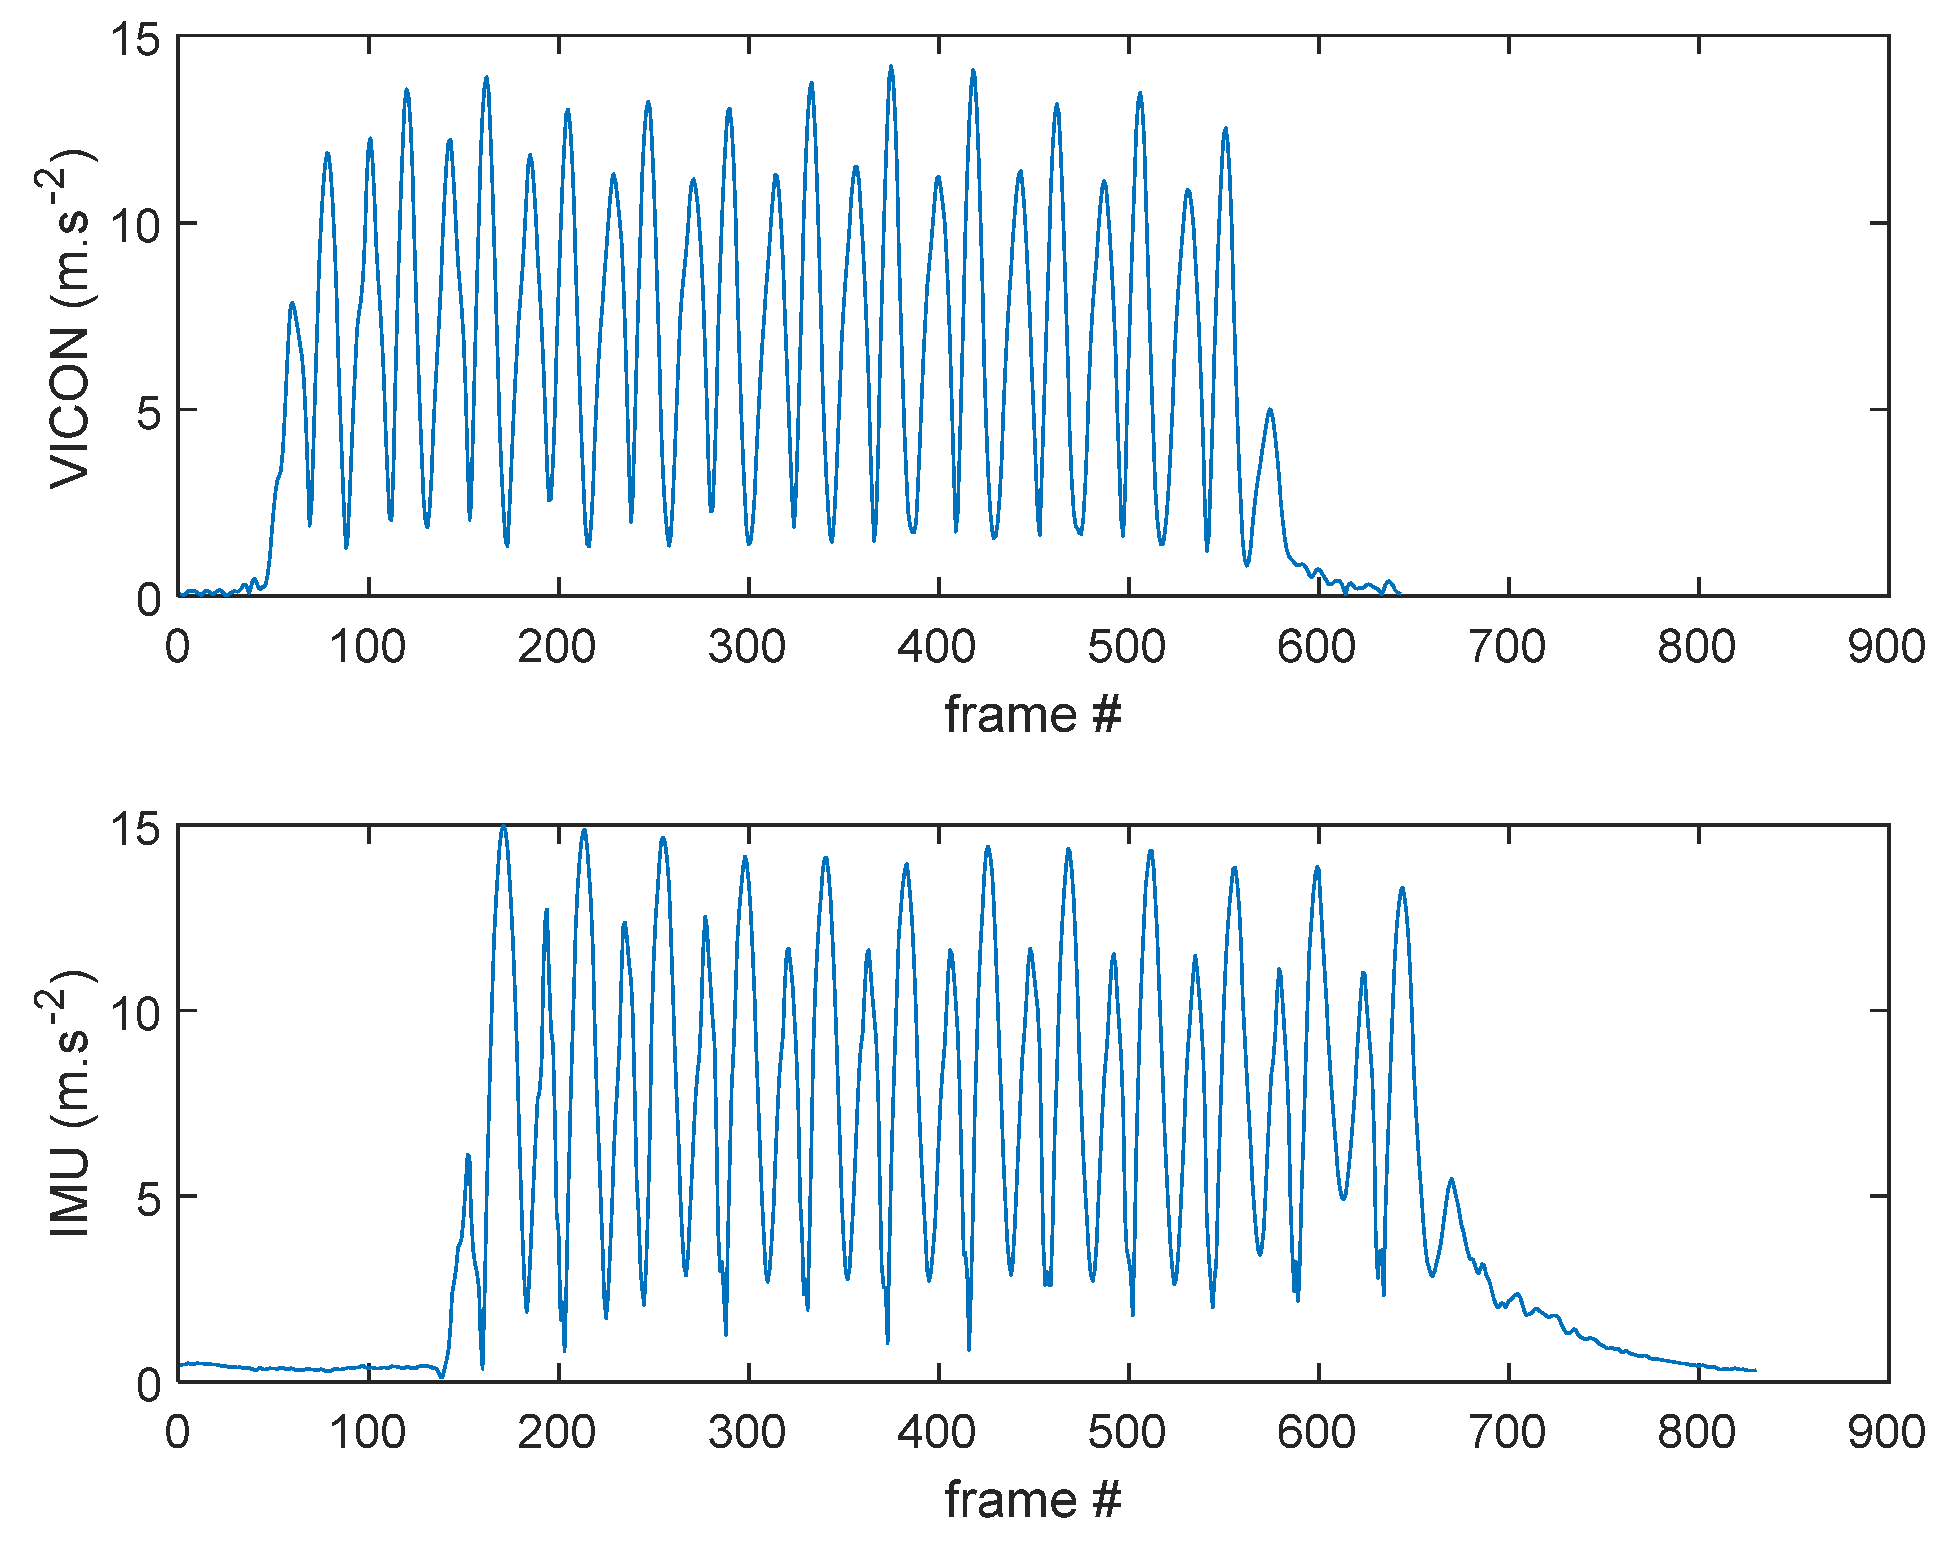
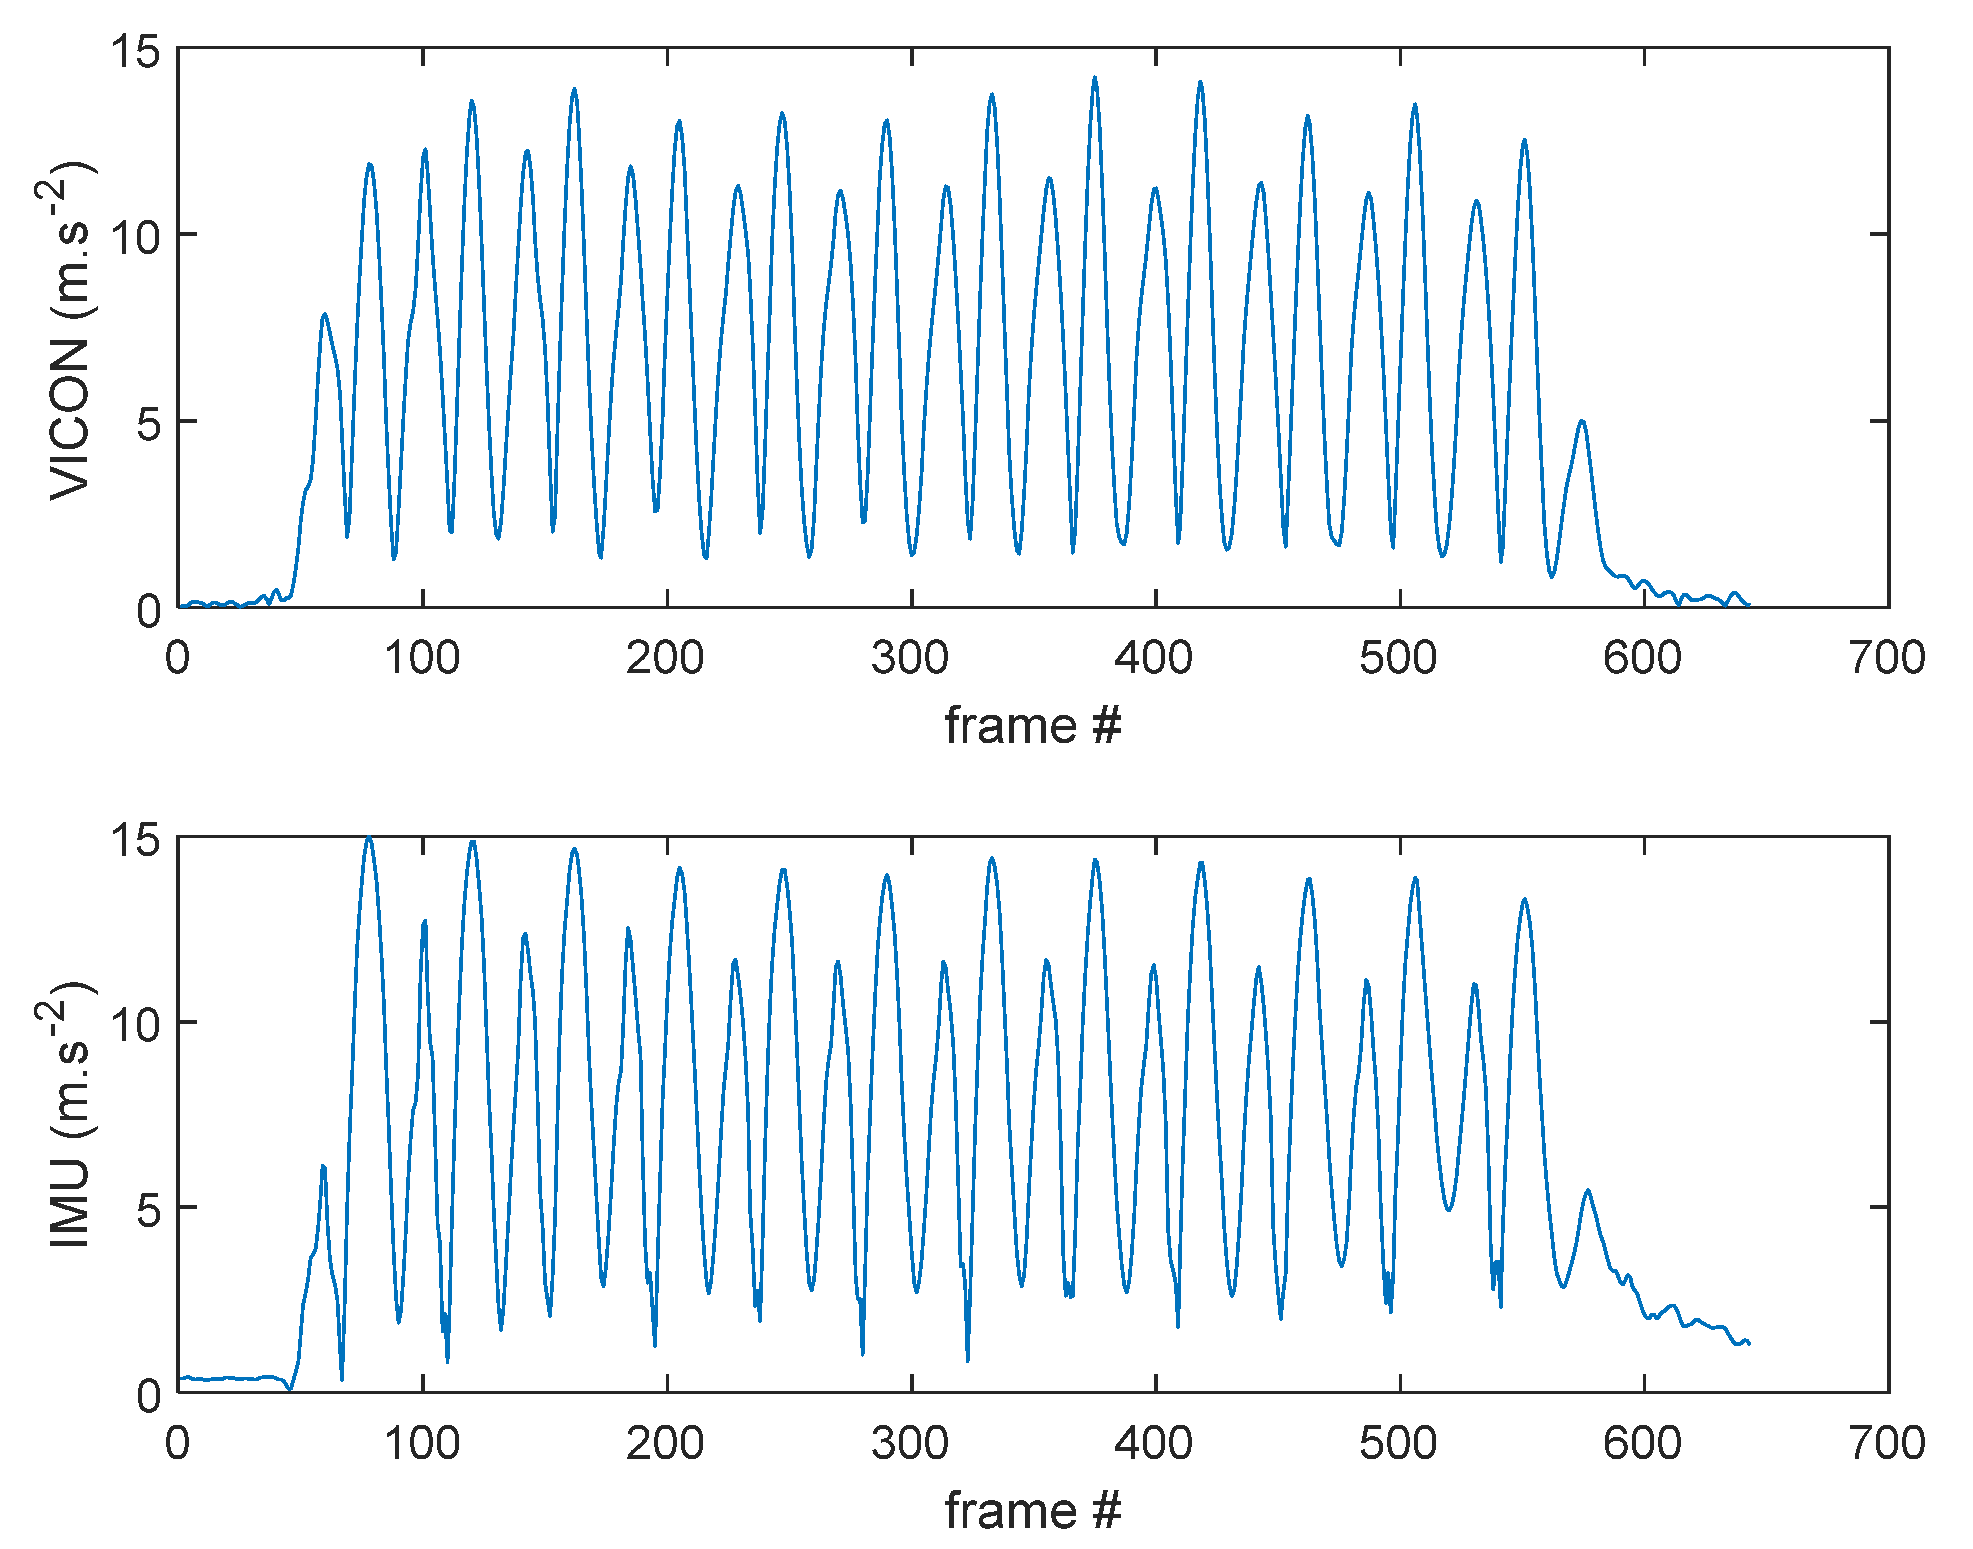
Appendix A. Cross-Correlation Algorithm

As explained, the VICON and IMU, being two independent measurement systems, are not synchronized. One solution for this problem could have been to start and stop both systems at the same time, but this was not chosen for it is not precise enough and does not prevent the risk of a constant delay between measurements. Hence, the cross-correlation procedure was chosen to reduce the risk of delayed data.
The algorithm is composed of the following steps:
  • Computing the average point of the pelvis cluster in VICON.
  • Double derivation of the trajectory to obtain linear acceleration (accel_vic).
  • Cross-correlation (xcorr MATLAB build-in function) of the accel_vic with accel_imu, i.e., the computed linear acceleration of the pelvis IMU (see Figure A1).
  • Identification of the cross-correlation maximum value r_max.
  • Synchronization of the IMU and VICON signals at r_max time.
  • Cropping of the IMU and VICON data to obtain similar length for both signals.
All computations were programmed in MATLAB R2020b software (The MathWorks, Natick, Massachusetts, United States of America).
Figure A1. VICON and IMU signals before cross-correlation synchronization.
Technologies 10 00072 g0a1
Figure A2. VICON and IMU signals after cross-correlation synchronization.
Technologies 10 00072 g0a2

References

  1. Cieza, A.; Causey, K.; Kamenov, K.; Hanson, S.W.; Chatterji, S.; Vos, T. Global Estimates of the Need for Rehabilitation Based on the Global Burden of Disease Study 2019: A Systematic Analysis for the Global Burden of Disease Study 2019. Lancet 2020, 396, 2006–2017. [Google Scholar] [CrossRef]
  2. Hartvigsen, J.; Hancock, M.J.; Kongsted, A.; Louw, Q.; Ferreira, M.L.; Genevay, S.; Hoy, D.; Karppinen, J.; Pransky, G.; Sieper, J.; et al. What Low Back Pain Is and Why We Need to Pay Attention. Lancet 2018, 391, 2356–2367. [Google Scholar] [CrossRef] [Green Version]
  3. Dionne, C.E.; Dunn, K.M.; Croft, P.R.; Nachemson, A.L.; Buchbinder, R.; Walker, B.F.; Wyatt, M.; Cassidy, J.D.; Rossignol, M.; Leboeuf-Yde, C.; et al. A Consensus Approach Toward the Standardization of Back Pain Definitions for Use in Prevalence Studies. Spine 2008, 33, 95–103. [Google Scholar] [CrossRef] [Green Version]
  4. Bourigua, I.; Simoneau, E.; Leteneur, S.; Gillet, C.; Barbier, F. Revue de la littérature La lombalgie chronique: Définitions, Evaluation et Traitement. Sci. Technol. Handicap. 2010, 4, 9–38. [Google Scholar] [CrossRef]
  5. Mounce, K. Back Pain. Rheumatol. Oxf. Engl. 2002, 41, 1–5. [Google Scholar] [CrossRef]
  6. Andersson, G.B. Epidemiological Features of Chronic Low-Back Pain. Lancet 1999, 354, 581–585. [Google Scholar] [CrossRef]
  7. Poiraudeau, S.; Lefevre Colau, M.-M.; Fayad, F.; Rannou, F.; Revel, M. Lombalgies. EMC Rhumatol. Orthop. 2004, 1, 295–319. [Google Scholar] [CrossRef]
  8. Poiraudeau, S.; Palazzo, C. Avancées thérapeutiques de la lombalgie chronique: Revue systématique de la littérature des 5 dernières années. Ann. Phys. Rehabil. Med. 2012, 55, e282. [Google Scholar] [CrossRef] [Green Version]
  9. Dagenais, S.; Caro, J.; Haldeman, S. A Systematic Review of Low Back Pain Cost of Illness Studies in the United States and Internationally. Spine J. 2008, 8, 8–20. [Google Scholar] [CrossRef]
  10. Christie, H.J.; Kumar, S.; Warren, S.A. Postural Aberrations in Low Back Pain. Arch. Phys. Med. Rehabil. 1995, 76, 218–224. [Google Scholar] [CrossRef]
  11. Mientjes, M.I.V.; Frank, J.S. Balance in Chronic Low Back Pain Patients Compared to Healthy People under Various Conditions in Upright Standing. Clin. Biomech. 1999, 14, 710–716. [Google Scholar] [CrossRef]
  12. Della Volpe, R.; Popa, T.; Ginanneschi, F.; Spidalieri, R.; Mazzocchio, R.; Rossi, A. Changes in Coordination of Postural Control during Dynamic Stance in Chronic Low Back Pain Patients. Gait Posture 2006, 24, 349–355. [Google Scholar] [CrossRef] [PubMed]
  13. Smith, J.A.; Stabbert, H.; Bagwell, J.J.; Teng, H.-L.; Wade, V.; Lee, S.-P. Do People with Low Back Pain Walk Differently? A Systematic Review and Meta-Analysis. J. Sport Health Sci. 2022. [Google Scholar] [CrossRef] [PubMed]
  14. Lee, R.Y.W.; Laprade, J.; Fung, E.H.K. A Real-Time Gyroscopic System for Three-Dimensional Measurement of Lumbar Spine Motion. Med. Eng. Phys. 2003, 25, 817–824. [Google Scholar] [CrossRef]
  15. Stolwijk, C.; Ramiro, S.; Vosse, D.; Landewé, R.; van der Heijde, D.; van Tubergen, A. Comparison of Tests for Lumbar Flexion and Hip Function in Patients with and without Axial Spondyloarthritis: Mobility Tests in Patients with and without Axial SpA. Arthritis Care Res. 2015, 67, 538–545. [Google Scholar] [CrossRef] [PubMed]
  16. Royer, A.; Cecconello, R. Bilans articulaires cliniques et goniométriques. Généralités. EMC Podol. Kinésithér. 2004, 1, 82–91. [Google Scholar] [CrossRef]
  17. Newton, M.; Waddell, G. Reliability and Validity of Clinical Measurement of the Lumbar Spine in Patients with Chronic Low Back Pain. Physiotherapy 1991, 77, 796–800. [Google Scholar] [CrossRef]
  18. Shirley, F.R.; O’Connor, P.; Robinson, M.E.; MacMillan, M. Comparison of Lumbar Range of Motion Using Three Measurement Devices in Patients with Chronic Low Back Pain. Spine 1994, 19, 779–783. [Google Scholar] [CrossRef]
  19. Hughes, G.T.G.; Camomilla, V.; Vanwanseele, B.; Harrison, A.J.; Fong, D.T.P.; Bradshaw, E.J. Novel Technology in Sports Biomechanics: Some Words of Caution. Sports Biomech. 2021, 1–9. [Google Scholar] [CrossRef]
  20. Mulders, J.V.; Goossens, S.; Monteyne, L.; Strycker, L.D.; Perre, L.V.D. Contactless Multi-Sensor Solution for E-Treatment of Musculoskeletal Disorders. IEEE Access 2021, 9, 20368–20375. [Google Scholar] [CrossRef]
  21. Cappelle, J.; Monteyne, L.; Van Mulders, J.; Goossens, S.; Vergauwen, M.; Van der Perre, L. Low-Complexity Design and Validation of Wireless Motion Sensor Node to Support Physiotherapy. Sensors 2020, 20, 6362. [Google Scholar] [CrossRef] [PubMed]
  22. Kobsar, D.; Charlton, J.M.; Tse, C.T.F.; Esculier, J.-F.; Graffos, A.; Krowchuk, N.M.; Thatcher, D.; Hunt, M.A. Validity and Reliability of Wearable Inertial Sensors in Healthy Adult Walking: A Systematic Review and Meta-Analysis. J. Neuroeng. Rehabil. 2020, 17, 62. [Google Scholar] [CrossRef] [PubMed]
  23. Robert-Lachaine, X.; Mecheri, H.; Muller, A.; Larue, C.; Plamondon, A. Validation of a Low-Cost Inertial Motion Capture System for Whole-Body Motion Analysis. J. Biomech. 2020, 99, 109520. [Google Scholar] [CrossRef] [PubMed]
  24. Robert-Lachaine, X.; Mecheri, H.; Larue, C.; Plamondon, A. Validation of Inertial Measurement Units with an Optoelectronic System for Whole-Body Motion Analysis. Med. Biol. Eng. Comput. 2017, 55, 609–619. [Google Scholar] [CrossRef] [PubMed]
  25. Bland, M.J.; Altman, D.G. Statistical Methods for Assessing Agreement between Two Methods of Clinical Measurement. Lancet 1986, 327, 307–310. [Google Scholar] [CrossRef]
  26. Poitras, I.; Dupuis, F.; Bielmann, M.; Campeau-Lecours, A.; Mercier, C.; Bouyer, L.J.; Roy, J.-S. Validity and Reliability of Wearable Sensors for Joint Angle Estimation: A Systematic Review. Sensors 2019, 19, 1555. [Google Scholar] [CrossRef] [Green Version]
  27. Della Croce, U.; Leardini, A.; Chiari, L.; Cappozzo, A. Human Movement Analysis Using Stereophotogrammetry: Part 4: Assessment of Anatomical Landmark Misplacement and Its Effects on Joint Kinematics. Gait Posture 2005, 21, 226–237. [Google Scholar] [CrossRef]
  28. Lebel, K.; Boissy, P.; Hamel, M.; Duval, C. Inertial Measures of Motion for Clinical Biomechanics: Comparative Assessment of Accuracy under Controlled Conditions-Effect of Velocity. PLoS ONE 2013, 8, e79945. [Google Scholar] [CrossRef]
  29. Taylor, L.; Miller, E.; Kaufman, K.R. Static and Dynamic Validation of Inertial Measurement Units. Gait Posture 2017, 57, 80–84. [Google Scholar] [CrossRef]
  30. Lepetit, K.; Ben Mansour, K.; Boudaoud, S.; Kinugawa-Bourron, K.; Marin, F. Evaluation of the Kinetic Energy of the Torso by Magneto-Inertial Measurement Unit during the Sit-to-Stand Movement. J. Biomech. 2018, 67, 172–176. [Google Scholar] [CrossRef]
  31. Miller, E.J.; Kaufman, K.R. Cross-Sectional Validation of Inertial Measurement Units for Estimating Trunk Flexion Kinematics during Treadmill Disturbances. Med. Eng. Phys. 2019, 70, 51–54. [Google Scholar] [CrossRef] [PubMed]
  32. Burns, S.A.; Cleland, J.A.; Rivett, D.A.; Snodgrass, S.J. Examination Procedures and Interventions for the Hip in the Management of Low Back Pain: A Survey of Physical Therapists. Braz. J. Phys. Ther. 2019, 23, 419–427. [Google Scholar] [CrossRef] [PubMed]
  33. Thiry, P.; Nocent, O.; Buisseret, F.; Bertucci, W.; Thevenon, A.; Simoneau-Buessinger, E. Sample Entropy as a Tool to Assess Lumbo-Pelvic Movements in a Clinical Test for Low-Back-Pain Patients. Entropy 2022, 24, 437. [Google Scholar] [CrossRef] [PubMed]
  34. Horenstein, R.E.; Lewis, C.L.; Yan, S.; Halverstadt, A.; Shefelbine, S.J. Validation of Magneto-Inertial Measuring Units for Measuring Hip Joint Angles. J. Biomech. 2019, 91, 170–174. [Google Scholar] [CrossRef]
  35. Hubaut, R.; Guichard, R.; Greenfield, J.; Blandeau, M. Validation of an Embedded Motion-Capture and EMG Setup for the Analysis of Musculoskeletal Disorder Risks during Manhole Cover Handling. Sensors 2022, 22, 436. [Google Scholar] [CrossRef]
  36. Storm, F.A.; Cesareo, A.; Reni, G.; Biffi, E. Wearable Inertial Sensors to Assess Gait during the 6-Minute Walk Test: A Systematic Review. Sensors 2020, 20, 2660. [Google Scholar] [CrossRef]
  37. Dumas, R.; Aissaoui, R.; de Guise, J.A. A 3D Generic Inverse Dynamic Method Using Wrench Notation and Quaternion Algebra. Comput. Methods Biomech. Biomed. Eng. 2004, 7, 159–166. [Google Scholar] [CrossRef]
  38. Dumas, R.; Chèze, L.; Verriest, J.-P. Adjustments to McConville et al. and Young et al. Body Segment Inertial Parameters. J. Biomech. 2007, 40, 543–553. [Google Scholar] [CrossRef]
  39. Dumas, R.; Robert, T.; Pomero, V.; Cheze, L. Joint and Segment Coordinate Systems Revisited. Comput. Methods Biomech. Biomed. Eng. 2012, 15, 183–185. [Google Scholar] [CrossRef]
  40. Montenij, L.J.; Buhre, W.F.; Jansen, J.R.; Kruitwagen, C.L.; de Waal, E.E. Methodology of Method Comparison Studies Evaluating the Validity of Cardiac Output Monitors: A Stepwise Approach and Checklist. Br. J. Anaesth. 2016, 116, 750–758. [Google Scholar] [CrossRef] [Green Version]
  41. Ranstam, J. Methodological Note: Accuracy, Precision, and Validity. Acta Radiol. 2008, 49, 105–106. [Google Scholar] [CrossRef] [PubMed]
  42. Lin, L.I.-K. A Concordance Correlation Coefficient to Evaluate Reproducibility. Biometrics 1989, 45, 255. [Google Scholar] [CrossRef] [PubMed]
  43. Desquilbet, L. Guide pratique de validation statistique de méthodes de mesure: Répétabilité, reproductibilité, et concordance. 2020; 48, preprint. [Google Scholar]
  44. Guichard, R.; Blandeau, M.; Leteneur, S. Localization of IMU Sensors Affects the Estimation of Soft Tissue Wobbling: A Preliminary Study. Comput. Methods Biomech. Biomed. Eng. 2021, 24, 3. [Google Scholar]
  45. Koska, D.; Gaudel, J.; Hein, T.; Maiwald, C. Validation of an Inertial Measurement Unit for the Quantification of Rearfoot Kinematics during Running. Gait Posture 2018, 64, 135–140. [Google Scholar] [CrossRef]
  46. Kottner, J.; Streiner, D.L. The Difference between Reliability and Agreement. J. Clin. Epidemiol. 2011, 64, 701–702. [Google Scholar] [CrossRef]
  47. ISO 5725-2:2019; Accuracy (Trueness and Precision) of Measurement Methods and Results—Part 2: Basic Method for the Determination of Repeatability and Reproducibility of a Standard Measurement Method. ISO: Geneva, Switzerland, 2019. Available online: https://www.iso.org/cms/render/live/en/sites/isoorg/contents/data/standard/06/94/69419.html (accessed on 2 September 2021).
  48. Lepetit, K. Évaluation Biomécanique des Capacités Musculo-Squelettiques Lors de la Transition Assis/Debout au Moyen D’une Centrale Inertielle en Situation Ecologique. Ph.D. Thesis, Université de Technologie de Compiègne, Compiègne, France, 2019. [Google Scholar]
  49. Cappozzo, A.; Catani, F.; Della Croce, U.; Leardini, A. Position and Orientation in Space of Bones during Movement: Anatomical Frame Definition and Determination. Clin. Biomech. 1995, 10, 171–178. [Google Scholar] [CrossRef]
Figure 1. (a) Hydraulic hexapod. (b) IMUs and reflective markers.
Technologies 10 00072 g001
Figure 2. Marker placement over IMUs and subjects.
Technologies 10 00072 g002
Figure 3. Linear acceleration Bland-Altman plot between the IMU and VICON system. (a) The systematic bias (solid line) and the 95% limits of agreement (dashed line) are shown. (b) Linear regression (solid line) created by the individual comparison (star markers).
Technologies 10 00072 g003
Figure 4. Angular velocity Bland-Altman plot between the IMU and VICON system. (a) The systematic bias (solid line) and the 95% limits of agreement (dashed line) are shown. (b) Linear regression (solid line) created by the individual comparison (star markers).
Technologies 10 00072 g004
Figure 5. Bland-Altman plot of thigh yaw angle between IMU and VICON system. (a) The systematic bias (solid line) and the 95% limits of agreement (dashed line). (b) The linear regression (solid line) and the 45° line (dashed line).
Technologies 10 00072 g005
Table 1. Characteristics of the participants.
Age (Years)Weight (kg)Height (cm)
All subjects30.7 ± 10.272.6 ± 15.6173.1 ± 7.7
Female34.7 ± 9.360.3 ± 13.7165.0 ± 3.5
Male30.9 ± 11.176.9 ± 15.1176.4 ±6.9
Table 2. Results computed from the Bland–Altman method and Lin’s CCC of sensor validation for all IMUs compared to the reference system (VICON). All values are averaged between acquisition with standard deviation in parentheses.
SensorParameter NameIMU BackIMU Thigh
Accelerometer
(m/s2)
bias0.001 (0.004)0.000 (0.022)
lower LOA−0.252 (0.111)−0.293 (0.152)
upper LOA0.254 (0.119)0.294 (0.180)
precision0.067 (0.039)0.078 (0.052)
r20.962 (0.005)0.951 (0.031)
Lin’s CCC0.978 (0.003)0.971 (0.017)
Gyroscope
(°/s)
bias−4.265 (2.119)−4.328 (2.068)
lower LOA−11.597 (3.491)−11.555 (3.428)
upper LOA3.067 (0.863)2.899 (0.902)
precision4.405 (2.134)4.470 (2.078)
r20.983 (0.007)0.982 (0.007)
Lin’s CCC0.886 (0.045)0.885 (0.045)
Table 3. Results computed from the Bland–Altman method and Lin’s CCC of segmental validation for yaw angle of the thigh computed with VICON compared to the IMU. All values are averaged between acquisition with standard deviation in parentheses.
SensorParameter NameIMU Thigh
Yaw orientation angle (°)bias1.742 (3.178)
lower LOA−7.883 (3.387)
upper LOA (°)11.367 (6.252)
precision (°)4.756 (2.402)
r20.965 (0.041)
Lin’s CCC0.971 (0.039)
Publisher’s Note: MDPI stays neutral with regard to jurisdictional claims in published maps and institutional affiliations.

