Article

On the Exploration of Automatic Building Extraction from RGB Satellite Images Using Deep Learning Architectures Based on U-Net

by
Anastasios Temenos
1,*,
Nikos Temenos
2,
Anastasios Doulamis
1 and
Nikolaos Doulamis
1
1
Department of Rural Surveying Engineering and Geoinformatics Engineering, National Technical University of Athens, 157 80 Athens, Greece
2
Department of Electrical and Computer Engineering, National Technical University of Athens, 157 80 Athens, Greece
*
Author to whom correspondence should be addressed.
Technologies 2022, 10(1), 19; https://doi.org/10.3390/technologies10010019
Submission received: 30 December 2021 / Revised: 21 January 2022 / Accepted: 24 January 2022 / Published: 29 January 2022
(This article belongs to the Collection Selected Papers from the PETRA Conference Series)

Abstract

:
Detecting and localizing buildings is of primary importance in urban planning tasks. Automating the building extraction process, however, has become attractive given the dominance of Convolutional Neural Networks (CNNs) in image classification tasks. In this work, we explore the effectiveness of the CNN-based architecture U-Net and its variations, namely, the Residual U-Net, the Attention U-Net, and the Attention Residual U-Net, in automatic building extraction. We showcase their robustness in feature extraction and information processing using exclusively RGB images, as they are a low-cost alternative to multi-spectral and LiDAR ones, selected from the SpaceNet 1 dataset. The experimental results show that U-Net achieves a 91.9 % accuracy, whereas introducing residual blocks, attention gates, or a combination of both improves the accuracy of the vanilla U-Net to 93.6 % , 94.0 % , and 93.7 % , respectively. Finally, the comparison between U-Net architectures and typical deep learning approaches from the literature highlights their increased performance in accurate building localization around corners and edges.

1. Introduction

Building detection and localization are some of the most important tasks in land-cover classification [1,2,3] and urban planning [4,5,6], which derives from the fact that citizens live and interact inside buildings for most of their time. Therefore, it is necessary to accurately map each building’s location during the initial urban planning procedure and, although it is highly accurate with the traditional methods used, it is also both time consuming and cost dependent. This has motivated the research to take advantage of other available resources that can represent most of the urban scene—for instance, data from satellite and aerial images.
Detailed digitization through these images manually allows the extraction of the locations of buildings in maps with reduced time and cost when compared to the traditional surveying methods while providing buildings’ precise footprints as well [7]. Furthermore, for a wide range of tasks, such as environmental, geographic, or government land administration and/or cover inspections, urban plans may have larger error tolerances in each building’s initial position due to the scaling parameter considered [8].
Although it seems promising, detailed digitization that is conducted manually suffers from the following drawbacks: (1) It is a serial and iterative procedure, meaning that each time a polygon representing an arbitrary building is completed, the procedure is repeated for the rest of the buildings from the selected area; (2) as a consequence of (1), building localization has to be redone from scratch after certain years or whenever necessary from the cadastre systems; (3) it does not favor highly populated areas, as they are prone to errors happening more often due to the complexity of the buildings’ geometry; (4) one also has to consider additional errors originating from anthropogenic factors [8,9].
To this end, research has shifted towards algorithms and methods for automating the procedure of buildings’ detection and localization [10,11,12,13,14,15]. However, they have to face the following challenges: (1) Buildings’ reflectance values are not significant throughout the whole spectrum, which is in contrast to the vegetation in near-infrared [16]; (2) buildings and other human-made structures—for instance, roads—presented in the same scene are confused during image segmentation, possibly resulting in inaccurate predictions due to the fact that all of these structures are made of the same material, concrete [17]; (3) it is important for predicted buildings to have geometrical correctness in order to be realistic—for instance, to have a rectangle-shaped structure [8].
Separating an urban area automatically is a process in which building and non-building areas have to be successfully distinguished from one another. This task is also known as semantic segmentation in images. Deep Neural Networks (DNNs) and especially Convolutional Neural Networks (CNNs) are dominant in image classification, which makes them attractive for semantic segmentation tasks [18,19,20,21,22,23]. A computationally efficient deep learning architecture named U-Net was proposed in [24] to implement semantic segmentation in biomedical images. Given its excellent performance, it was also used in land-cover classification tasks [2,25,26] with the purpose of providing accurate recognition and detailed localization of buildings in the area of interest. Compared to the traditional Fully Convolutional Network (FCN) [23], the SegNet [27], and the MASK R-CNN [28], experimental results showed that U-Net requires fewer data during training and fewer computational resources while offering better performance in classification and segmentation at the same time [29,30,31,32].
In the paradigm of U-Net, researchers have introduced two specific U-Net-based variations: the Residual U-Net [33] and the Attention U-Net [34]. The Residual U-Net replaces the traditional convolutional block with a residual one in order to overcome the problem of accuracy degradation when the neural networks’ depth increases. Attention U-Net benefits from the effectiveness of attention gates, as they highlight the areas of interest on each feature map during the concatenation operation. This allows the network to avoid non-useful and low-level feature extraction, which would result in additional computational power.
Motivated by the above, in this work, we explore the efficacy of the U-Net architecture along with that of its variants, namely, the Residual U-Net, the Attention U-Net, and the Attention Residual U-Net, in automatic building extraction and localization. To demonstrate their effectiveness, we consider the SpaceNet 1 dataset [35], which provides RGB images that: (1) are easy to acquire from multiple sources, such as airborne cameras of unmanned aerial vehicles (UAVs) and airplanes, (2) are low cost when compared to hyper-spectral or LiDAR images, and (3) represent information from remote sensing data using the lowest allowable image quality that captures natural urban scenes and surfaces.

2. Related Work and Motivation for Using RGB Data

Building detection is a feasible procedure that has been addressed in the past using machine learning techniques in aerial and remote sensing data. Vakalopoulou et al. [10] proposed a Conditional Random Field (CRF) framework that benefits from edges’ and boundaries’ locations. These are predicted in two separate ways: (1) with the implementation of SegNet [27], an FCN architecture that can carry out pixel-wise classification with an encoding–decoding technique, and (2) with the use of a traditional edge-detecting Sobel filter that is suitable for this process. Afterwards, they were combined using linear programming methods, thus optimizing the building detection process. Moreover, this framework was evaluated on the SpaceNet 1 dataset using exclusively RGB channels.
Another approach for building extraction from remote sensing data was presented by Xu et al. [11]. The authors used a three-step methodology that combined a pre-processing stage, a classification part, and an implementation of a guided filter to optimize buildings’ localization. First, the pre-processing stage performed edge enhancement in each image channel to emphasize the objects’ edges. Afterwards, a Normalized Vegetation Index (NDVI), a normalized Digital Surface Model (DSM), and a first Principal Component Analysis (PCA) were used for additional image analysis before the training procedure. With respect to the classification part, the previous information was combined in layers along with the RGB and color infrared channels in a single tensor and then fed to the network. The network used was a Residual U-Net that was trained to semantically segment the tensors into two classes, namely, buildings and background. Finally, the guided filter was used to optimize the extraction of the building by smoothing the edges. The datasets used were the Vaihingen (Germany) and Potsdam (Germany) datasets, which include RGB, near-infrared, color infrared, and additional data for DSM generation.
Guo et al. [12] combined a multiloss-based U-Net model along with an attention block to address the building extraction challenge in exclusively RGB remote sensing data. Briefly, the multiloss method initializes the boundaries during the training procedure, while the attention block enhances the local information of each feature map with high-quality features from deeper levels of the network. The dataset used was the Inria Aerial Image Dataset, which includes aerial top-down RGB images with a spatial resolution of 0.3 m.
Automatic building extraction using DNNs has been addressed in the past by utilizing multispectral images and additional altitude information, e.g., DSM and pre-processing stages for data enhancement [13,14,36,37]. However, multispectral images obtained from sensors introduce challenges: (1) They come at high cost compared to simple airborne RGB cameras due to both the value of the sensors themselves and their installation cost, and (2) they capture the land scene at lower accuracy levels, thereby requiring an additional resampling stage so as for all channels to have the same exact resolution. On the other hand, DSM information can be generated as a result of two options. First, by installing a LiDAR sensor, which is subject to the same challenges faced by the multispectral image sensors, or second, by applying a Dense Image-Matching algorithm for the area of interest, which is, however, a time-consuming and computationally intensive process. This is also reflected in the training procedure, as input tensors become larger when the number of channels is increased, resulting in more features to be learned.
Considering the above, RGB images, on the contrary, have the following advantages: (1) They are simpler to collect from multiple sources—for instance, airplanes and UAVs—by exclusively subtracting the satellite factor, and (2) they represent the urban scene in true colors using the lowest allowable image quality, resulting in low-dimensional tensors that are able to be processed using less memory and computational resources. In the proposed work, we exploit the benefits of RGB images and expand the work in [29] so as to include different variations of U-Net. Moreover, we attempt to combine the benefits of residual blocks in Res U-Net and the attention blocks in Attention U-Net into a single architecture, namely, the Attention ResU-Net, in order to explore its benefits in automatic building extraction and localization.

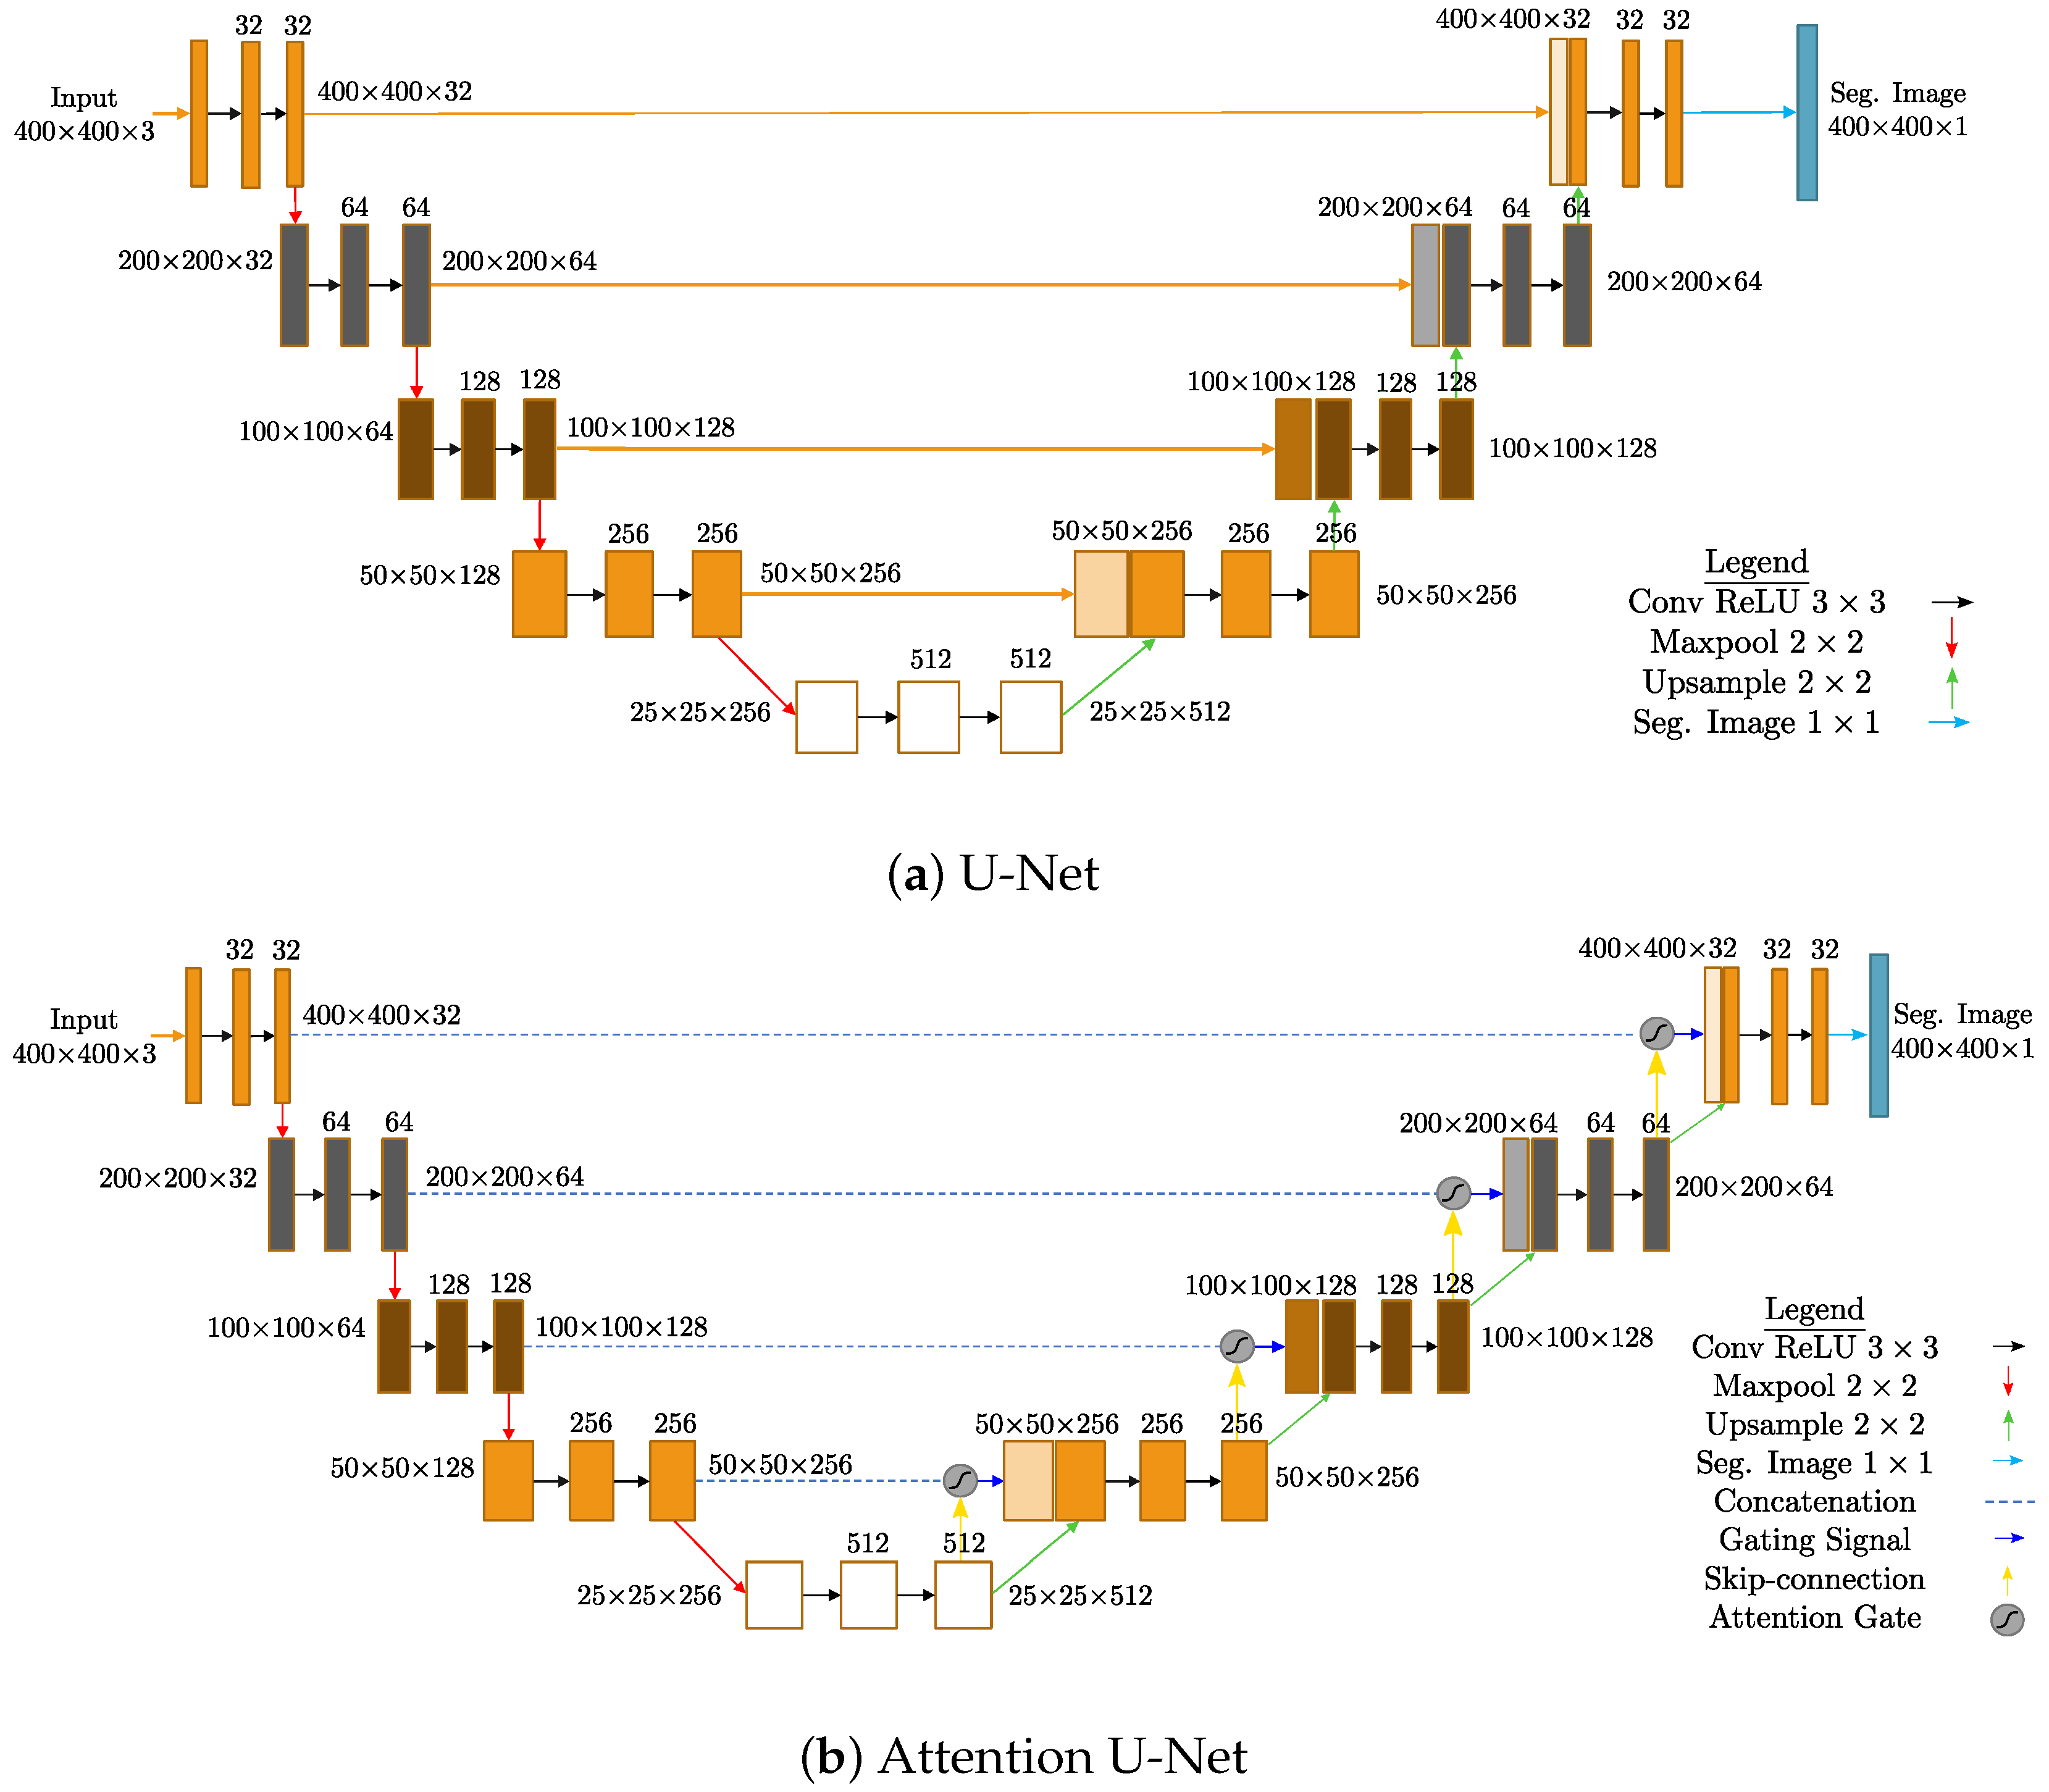
3. U-Net-Based Architectures

3.1. U-Net

U-Net is a Fully Convolutional Neural Network (FCNN), and its architecture is illustrated in Figure 1. In contrast to typical CNN architectures, U-Net exploits a contracting and an expanding path during the convolution process. The former acts as an encoder of the input’s information given the fact that the downsampling includes the feature extraction process, whereas the latter is a decoder that uses information from the encoding process to improve on the spatial information, a technique called skip connection. Both paths are symmetrical in their operations, forming a U-shaped process.
According to the architecture in Figure 1a, the contracting path (encoder—left side) contains five vertically aligned layers of convolution blocks, where each executes two 3 × 3 convolution operations, followed by an activation function (in this case, rectified linear unit (ReLU)). Then, the result is downsampled with a 2 × 2 max pooling operation of stride 2. Therefore, the process downsamples 400 × 400 × 3 images to 25 × 25 × 256 tensors. On the other hand, the expanding path (decoder—right side) works similarly to the contracting one, with the main difference being that the max pooling operation is replaced by an up-convolution that divides by 2 the total number of the channels, thus doubling the image’s width and height. Afterwards, the upsampled image is concatenated with the corresponding feature map of the contracting path (a technique also known as skip connection), and the result passes through two 3 × 3 convolution operations, each followed by the ReLU activation function. This procedure is repeated four more times (five blocks in total), ending up in the final stage, where the 400 × 400 × 32 image convolves with a 1 × 1 kernel followed by a sigmoid activation function so as to carry out the pixel-wise classification part.

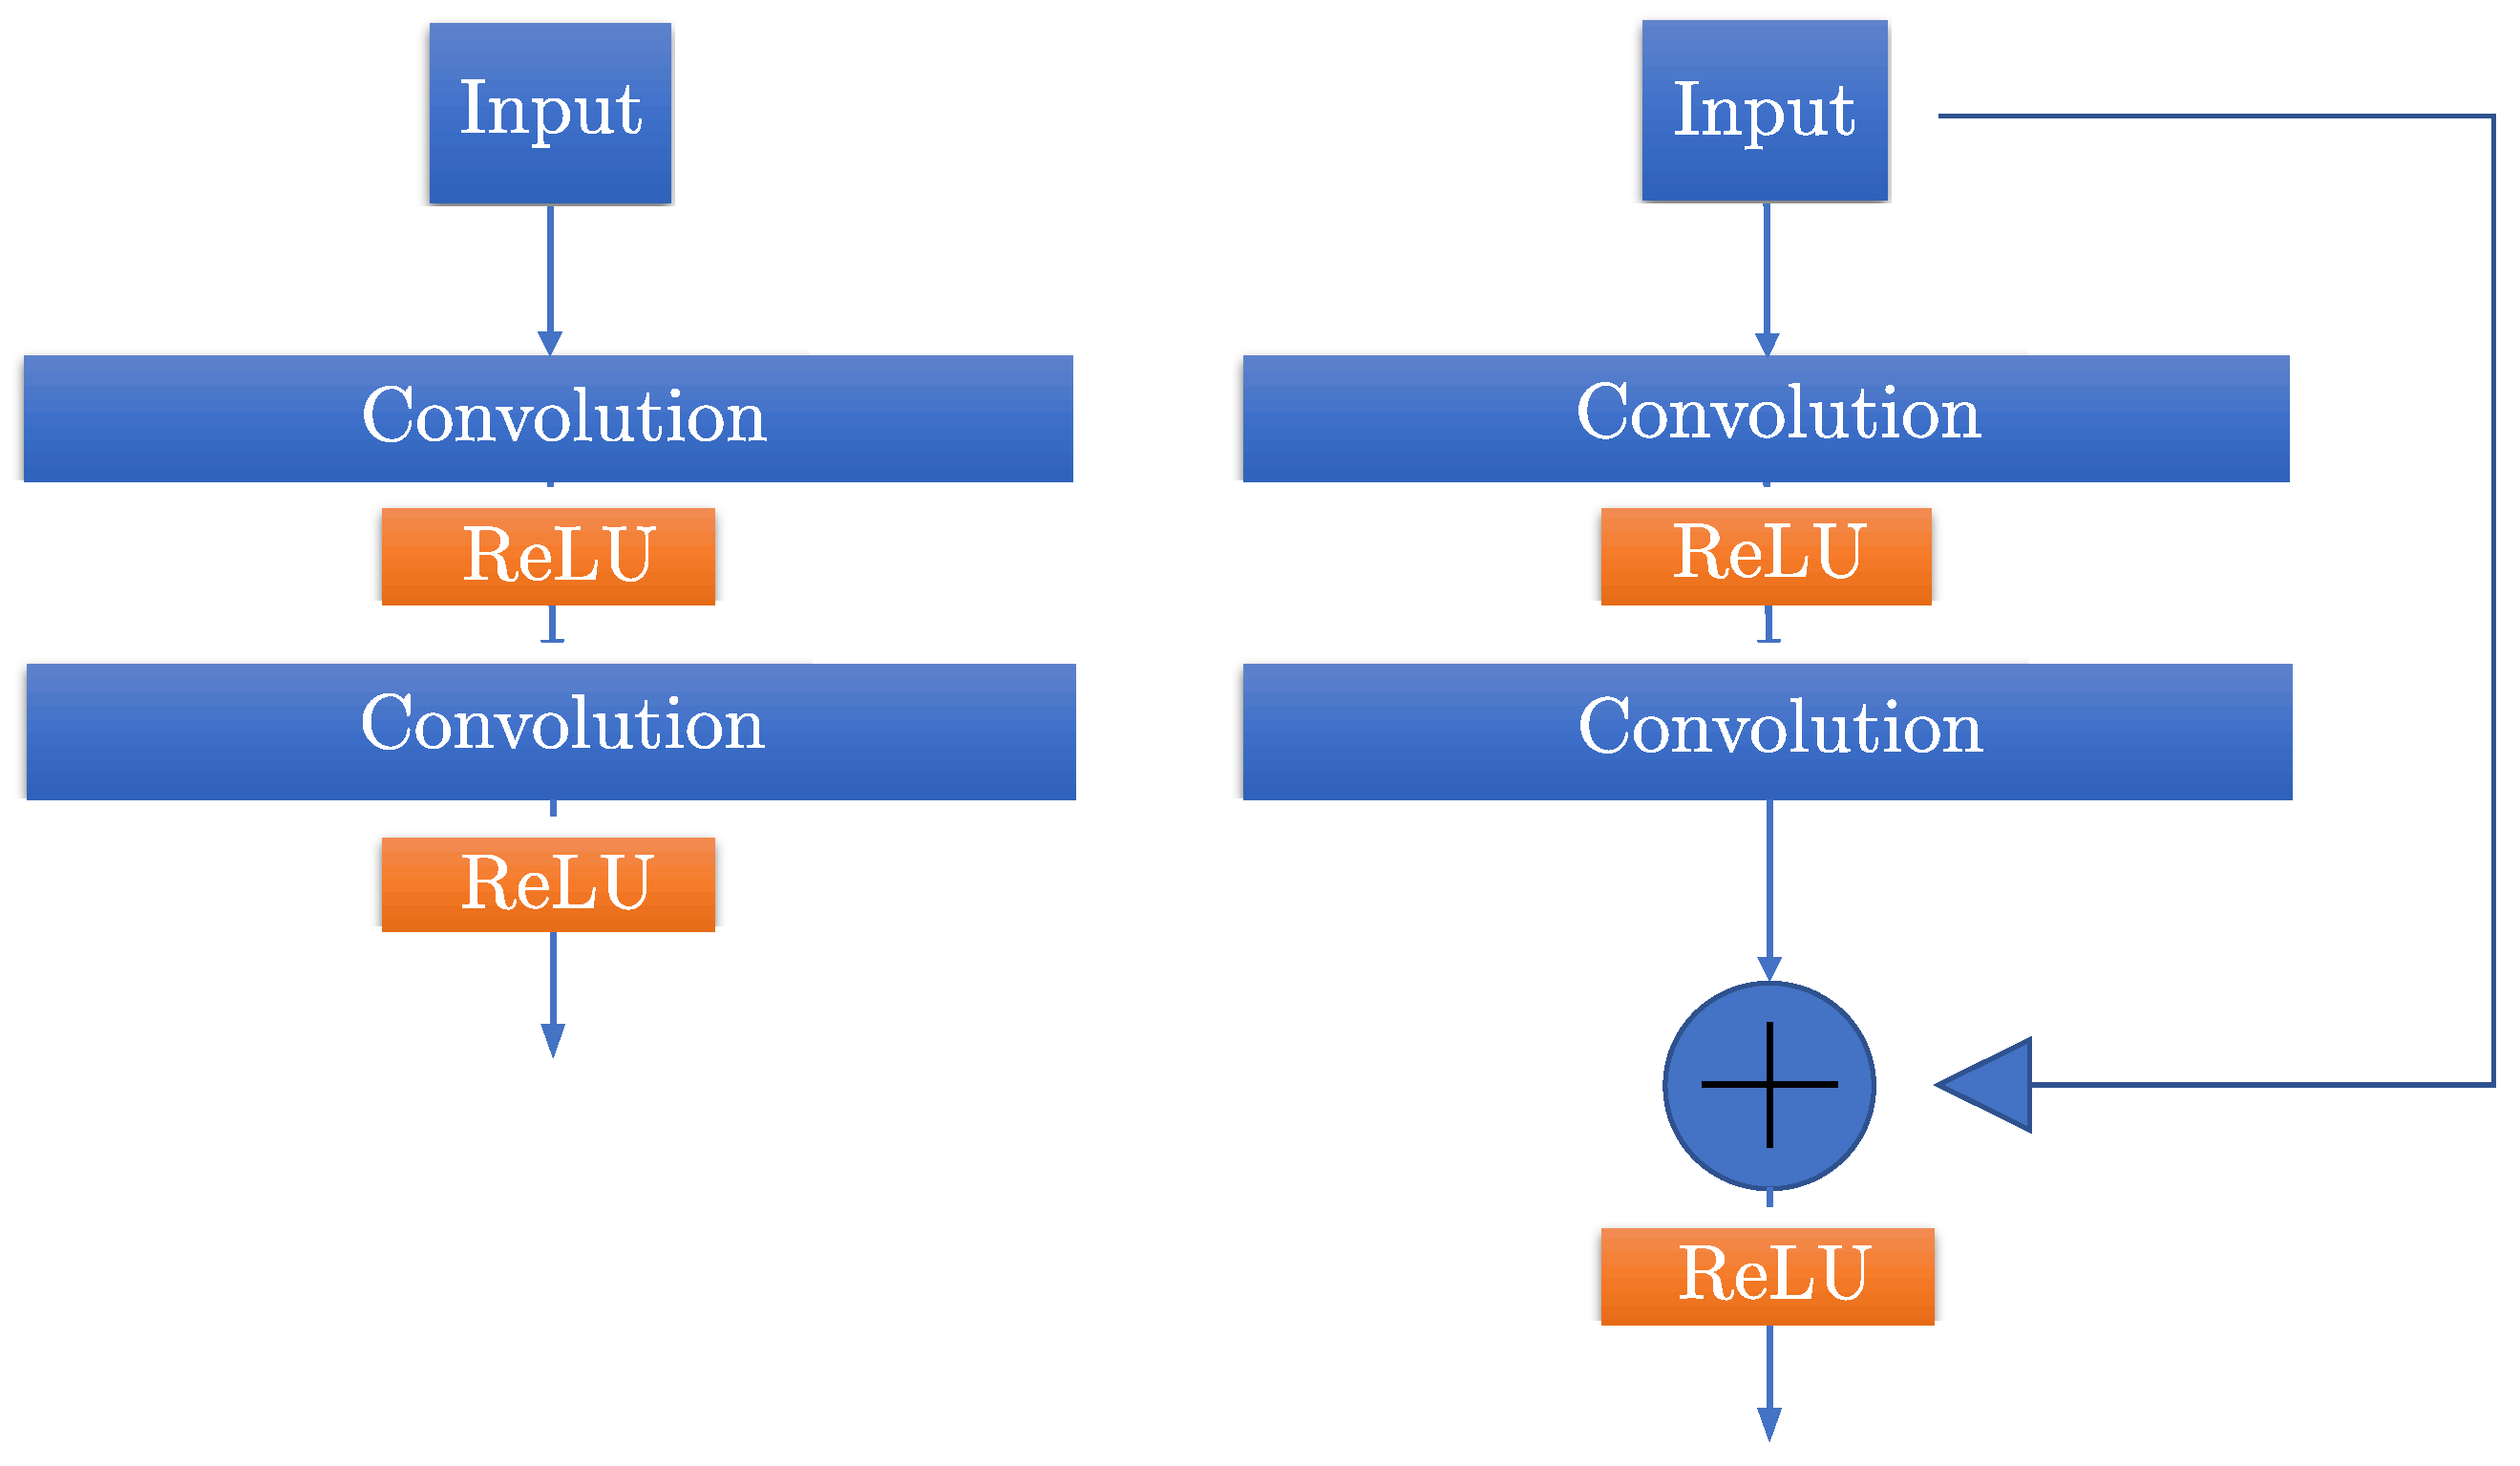
3.2. Residual Block in U-Net

To eliminate a potential degradation problem in U-Net, which derives from the saturation of the model’s accuracy as the depth of the network increases, the authors in [33,38] utilized a residual convolution block. A residual convolution block is described in the same way as a traditional one, but with the main difference being the shortcut connection; the initial information is added to the result of the convolution’s output layer. To provide an insight into its operation, consider a comparison between the residual convolution block and the traditional one, as shown in Figure 2.
Assuming that x is the input tensor (or vector), then F ( · ) is the mapping to it, and in this specific case, it holds that F = W 2 σ ( W 1 x ) , where W 1 , W 2 are the weights in the first and second convolution blocks, respectively, while σ ( · ) represents the non-linear ReLU function. The output tensor (or vector) y is then derived as y = F ( x ) + x . Fitting a desired residual mapping adds “details” to the original input, thereby improving the learning process when the depth of the network increases without further stressing the computational complexity. Therefore, the skip connections, namely, the addition of the input to the residual mapping, allow for the design of a CNN to be done with much fewer parameters.

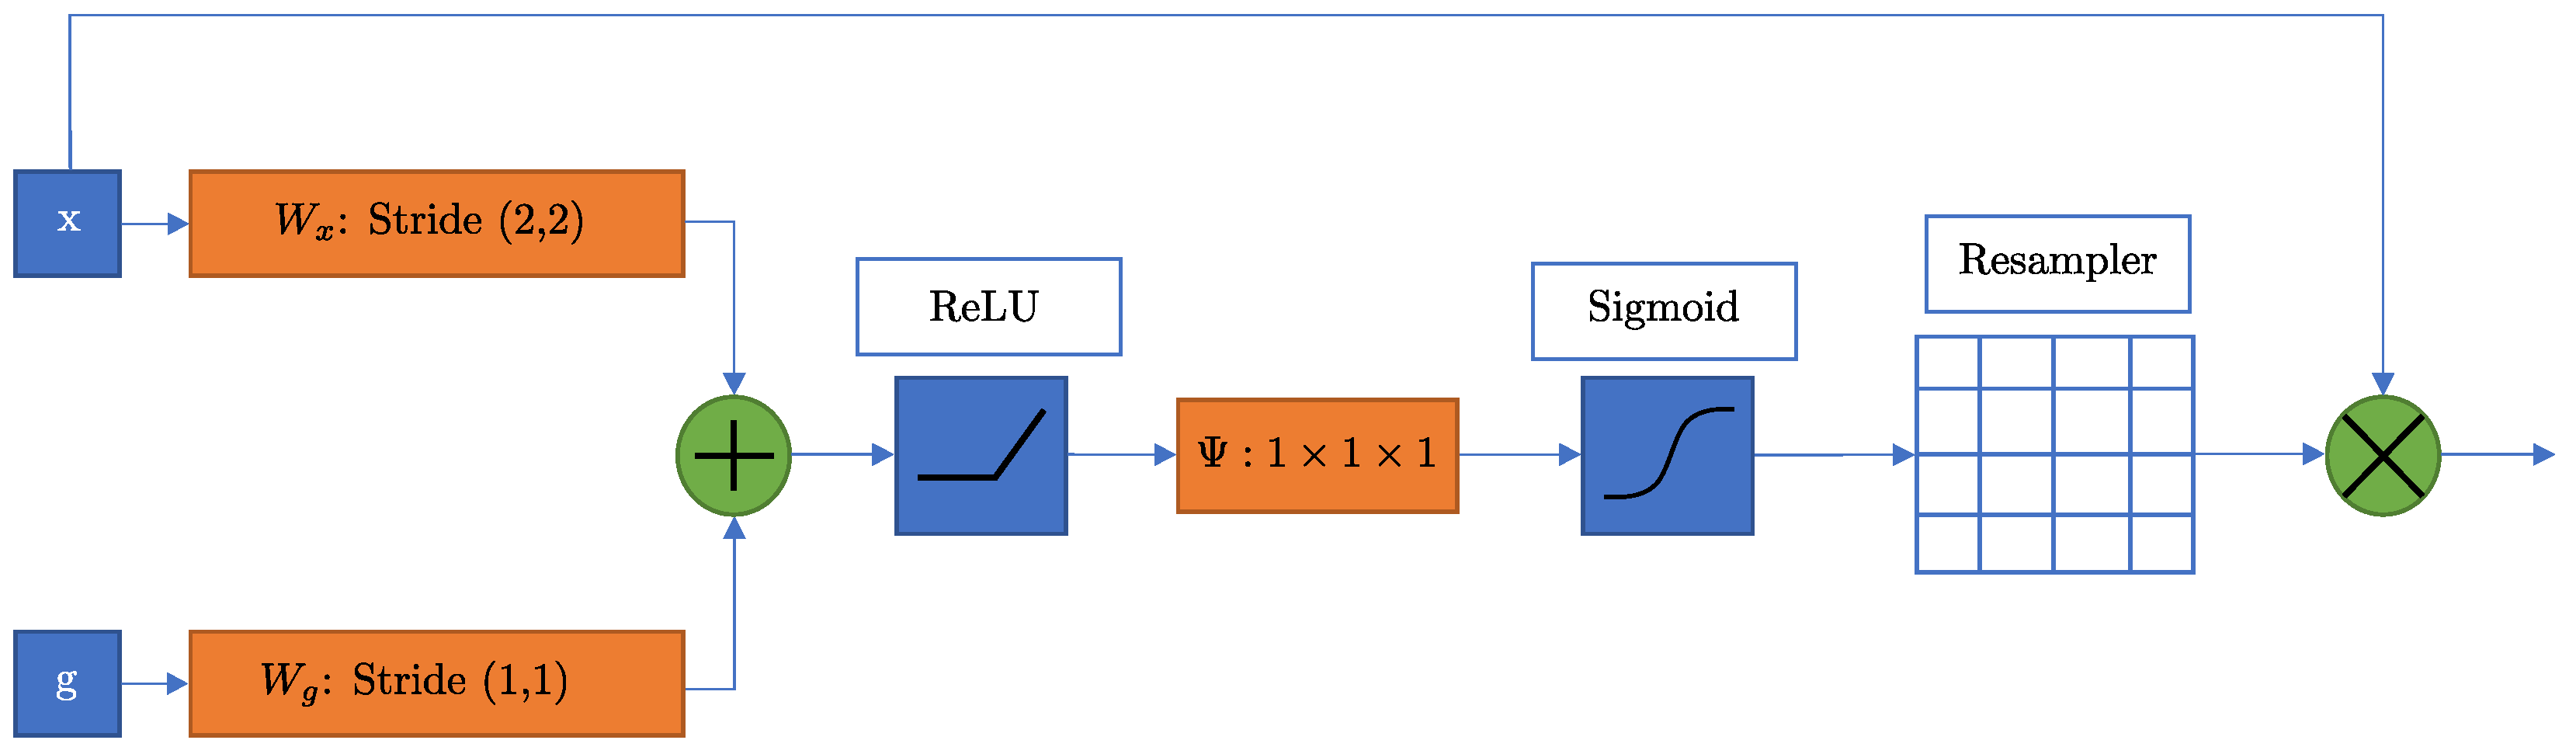
3.3. Attention U-Net

The traditional U-Net architecture benefits from the implementation of the skip connection between each feature map in the encoder part with each upsampled tensor in the decoding path. In [34], it was shown that a plain skip connection causes low-level features to be repeatedly extracted, leading to redundant computational power, an increased number of parameters, and additional resources occupied during the learning procedure. To overcome these computational limitations, in [34], a soft-attention block was applied at the skip connection to actively suppress activations at irrelevant regions of each feature map. The architecture of the Attention U-Net is shown in Figure 1b. As one can observe, the attention gate is applied at every skip connection, and it takes as inputs a gating signal and the symmetrical feature map of the encoding part.
To explain the operation of the attention block shown in Figure 3, suppose that x is the feature map and g is the gating signal. Usually, both inputs to the attention block come from different layers in the network, implying that they have different dimensions; g derives from one layer lower in the network, where areas of interest are more detailed, while x derives from the encoding part of the network and is in the same layer as the attention block. The first convolution operation is applied on both x and g with weights W g and W x , respectively, but tensor x has a stride of 2 × 2 so as to keep the dimension between the two convolutions equal. Now, their addition is feasible, allowing for the aligned weights to become larger, whereas the unaligned ones become relatively smaller. The result of this operation is passed to a ReLU activation function, and then it is convolved with a 1 × 1 × 1 kernel, Ψ , so as to extract the attention coefficients, which are normalized by a sigmoid function. Finally, the result of the sigmoid is upsampled to match the dimension of the input tensor x and is then multiplied with it pixel-wise to produce the output.

3.4. Attention ResU-Net Architecture

Both architectures of the Attention and ResU-Net are subject to changes in parts of their computational blocks in the sense that the architecture core remains identical. Therefore, one can combine them in a single architecture to obtain the advantages from both; the residual block enhances the feature extraction and avoids the degradation learning problem during the training procedure, while the attention gate improves the spatial information of the input images. Their combination is called Attention ResU-Net. It is implemented by replacing each convolution layer of the plain U-Net with the residual one, illustrated in Figure 2. The attention mechanism, Figure 3, is also applied at each convolution layer of the expanding path, as shown in Figure 1b. The above two blocks, enhance in a sense the performance of the U-Net architecture, by allowing both the high-level features to be extracted and low-level spatial information to be preserved.

4. Experimental Setup

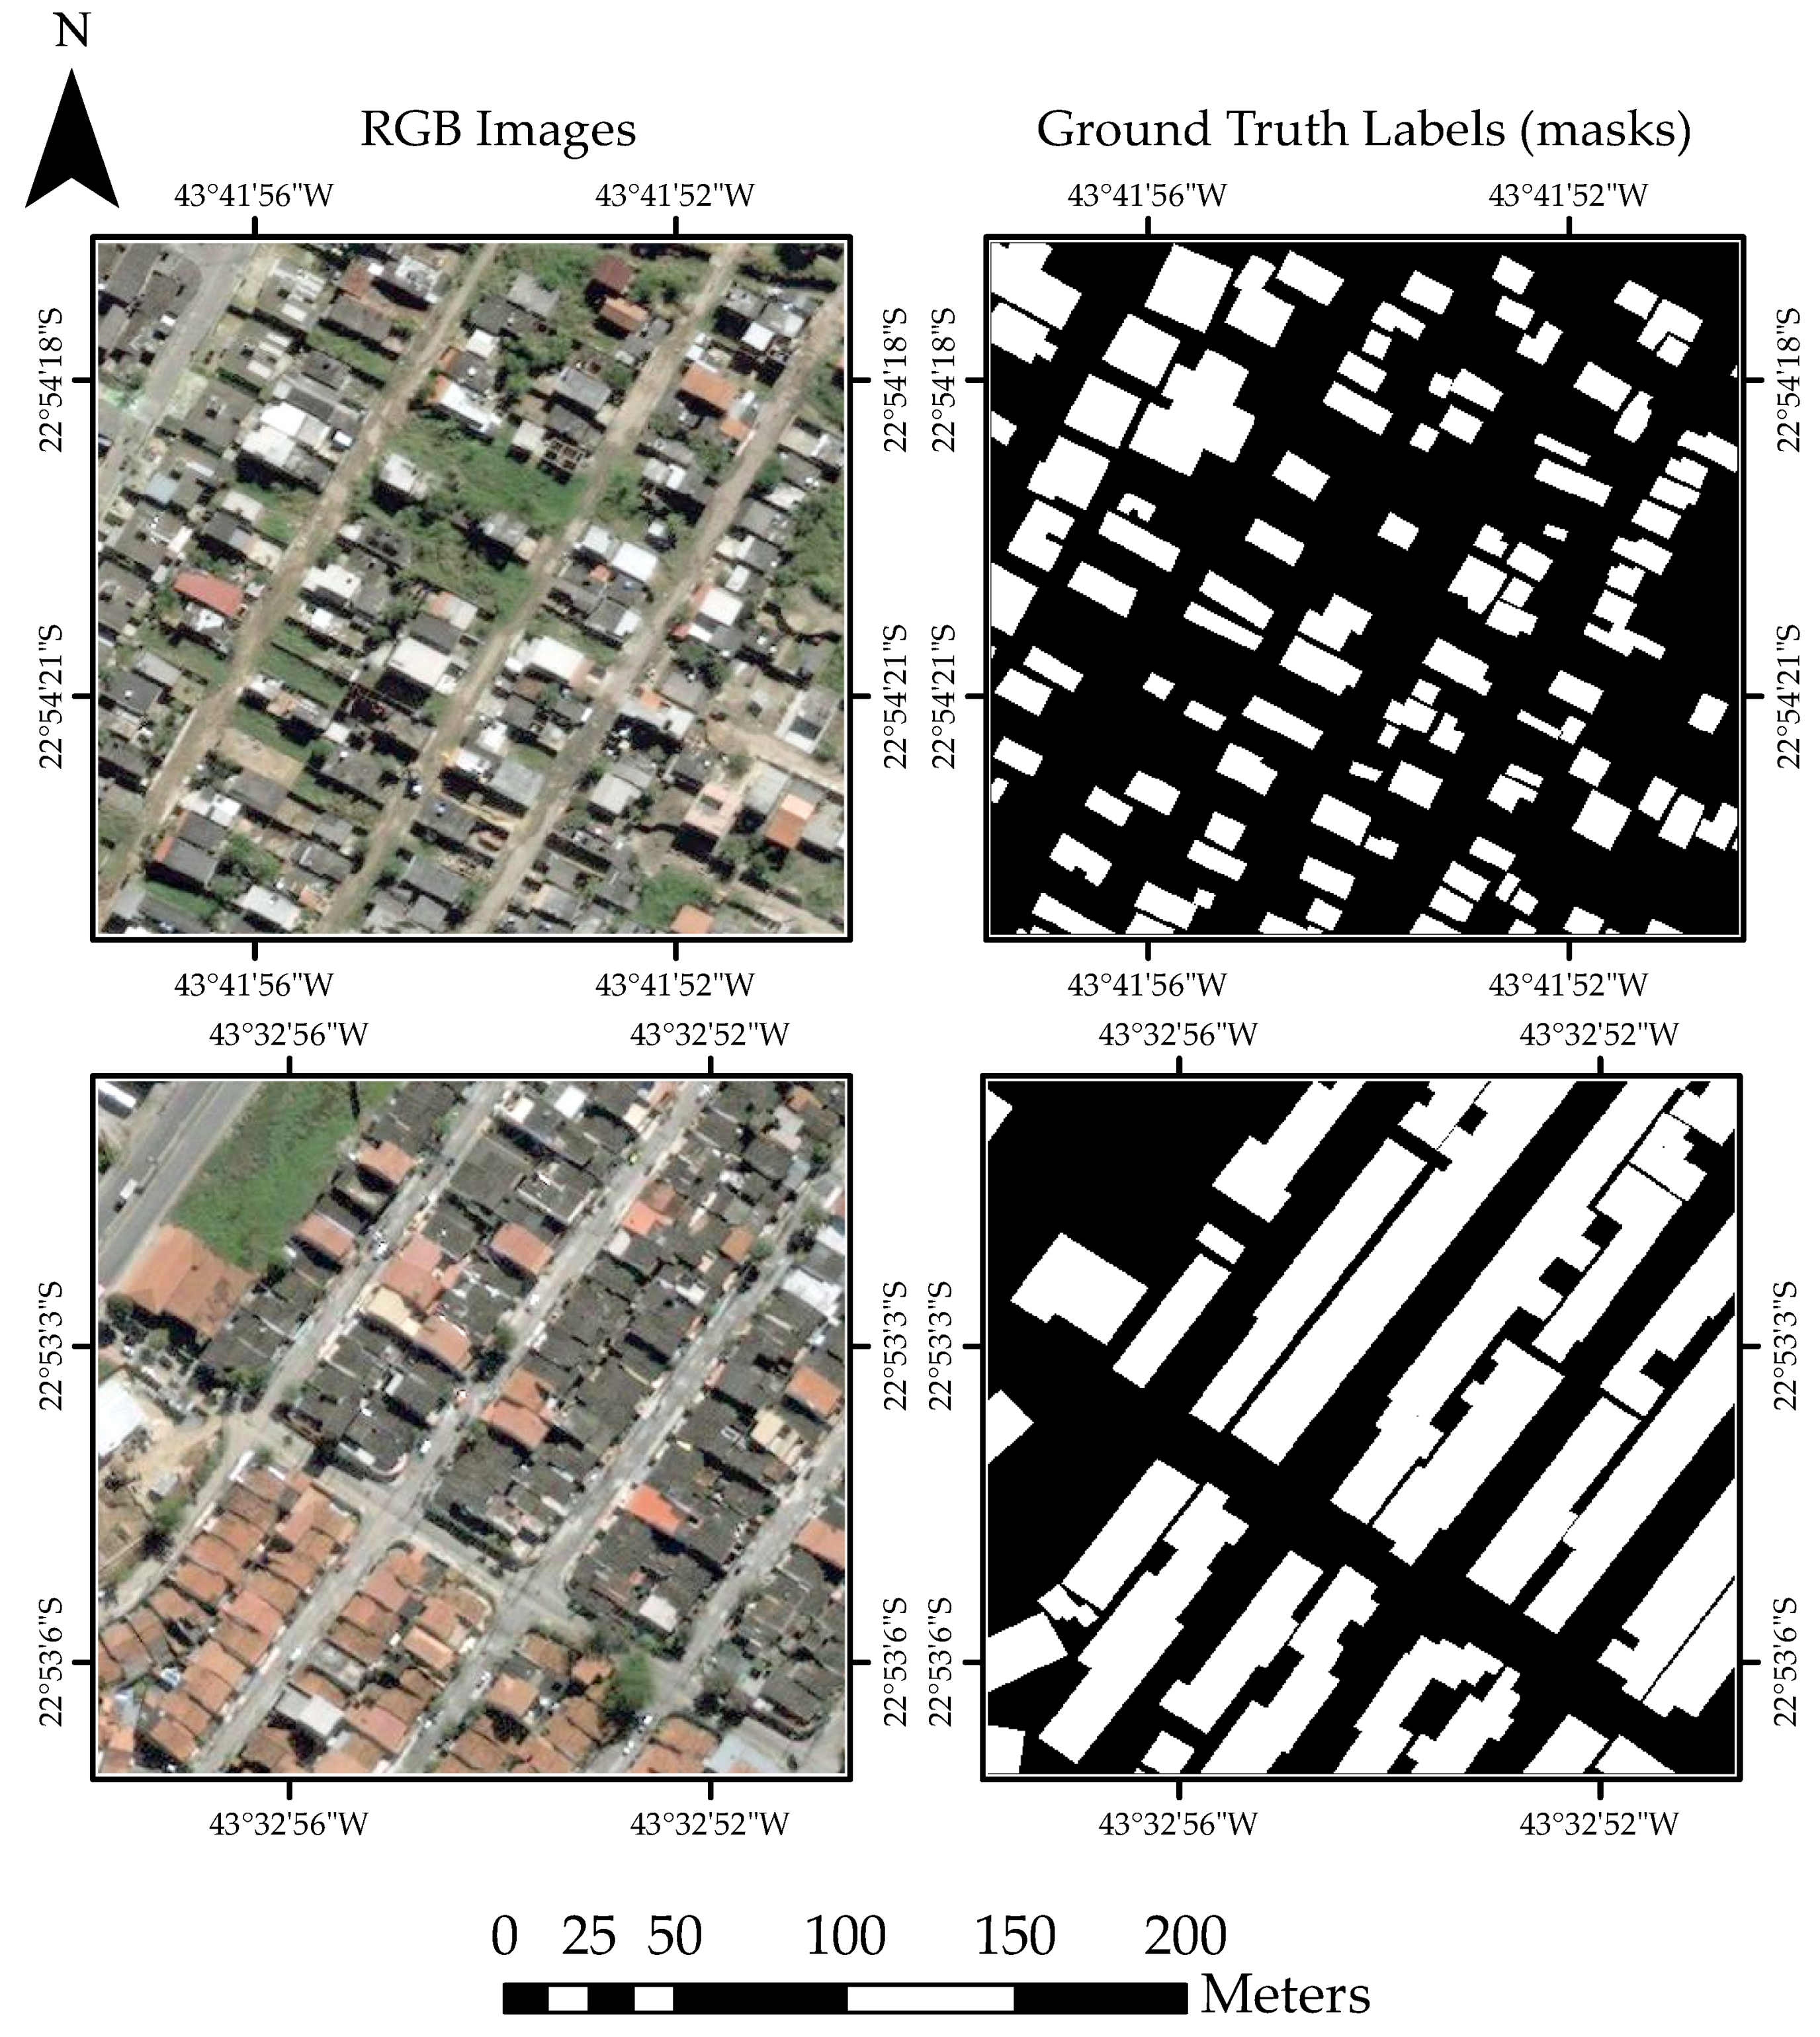
4.1. Dataset Description

In order to evaluate the performance of U-Net and its flavors in automatic building extraction, we consider one of the largest remote sensing datasets that contains high-resolution images, namely, the SpaceNet 1 dataset [15,39]. We selected 6940 images from the WorldView-2 satellite, which covers the region of Rio de Janeiro in Brazil. Focusing on the dataset, it contains two related sets of data depicting the same area of interest. The first one contains pan-sharpened RGB images, where each pixel corresponds to a 50 × 50 cm 2 area on the ground, while the second one includes multi-spectral images, with each pixel corresponding to 1 m 2 resolution on the ground. Each image has an initial size of 438 × 406 pixels and covers a corresponding 200 × 200 m 2 area, with the total area span being 2544 km 2 . Note that only the RGB images from the dataset are used.
In order for the input images to be processed by the U-Net architectures, we conducted a resizing of them to 400 × 400 ; each max pooling operation divided its input image size by 2, which means that the dataset’s images with initial size 438 × 406 could not be accurately passed from the top layer to the bottom one without fractions being introduced. As such, images with pixel size 400 × 400 were the closest allowable representations of the ones in the dataset.
The advantage of this dataset is that it offers pan-sharpened images available in uint8 format, meaning that no additional preprocessing stage is required and that all images have the same resolution and size. Moreover, along with the imagery dataset, an extra geojson file containing the building polygons within that area was attached for each image patch. This is referred to as an image’s mask, and an example is shown in Figure 4. Note that all images are converted from vector to raster format and are also georeferenced.

4.2. Metrics

All 4 U-Net variations were evaluated with the 4 standard classification metrics: (1) accuracy, (2) precision, (3) recall, and (4) F1 score. Using the standard definitions from the confusion matrix (TP = True Positive, TN = True Negative, FP = False Positive, and FN = False Negative), they are defined as follows:
Accuracy = TP + TN TP + FP + TN + FN ,
Precision = TP TP + FP ,
Recall = TP TP + FN ,
F 1 = 2 Precision · Recall Precision + Recall .
It seems that the F1 score is the calculated harmonic mean of Precision and Recall. Apart from the 4 standard classification metrics, here, we considered the Jaccard score. It belongs in the category of intersection-over-union (IoU) metrics and shows the similarity and diversity of 2 sample sets. It is defined as the size of the intersection divided by the size of the union of those—in our case, the predicted image (A) and the actual one (B)—and is described as:
Jaccard ( A , B ) = | A B | | A B | = | A B | | A | + | B | | A B | .
The Jaccard score is a suitable metric for image segmentation because, apart from the classification task, segmentation visualizes the predicted classes. This is why a similarity index measure is important in pixel-wise classification tasks.

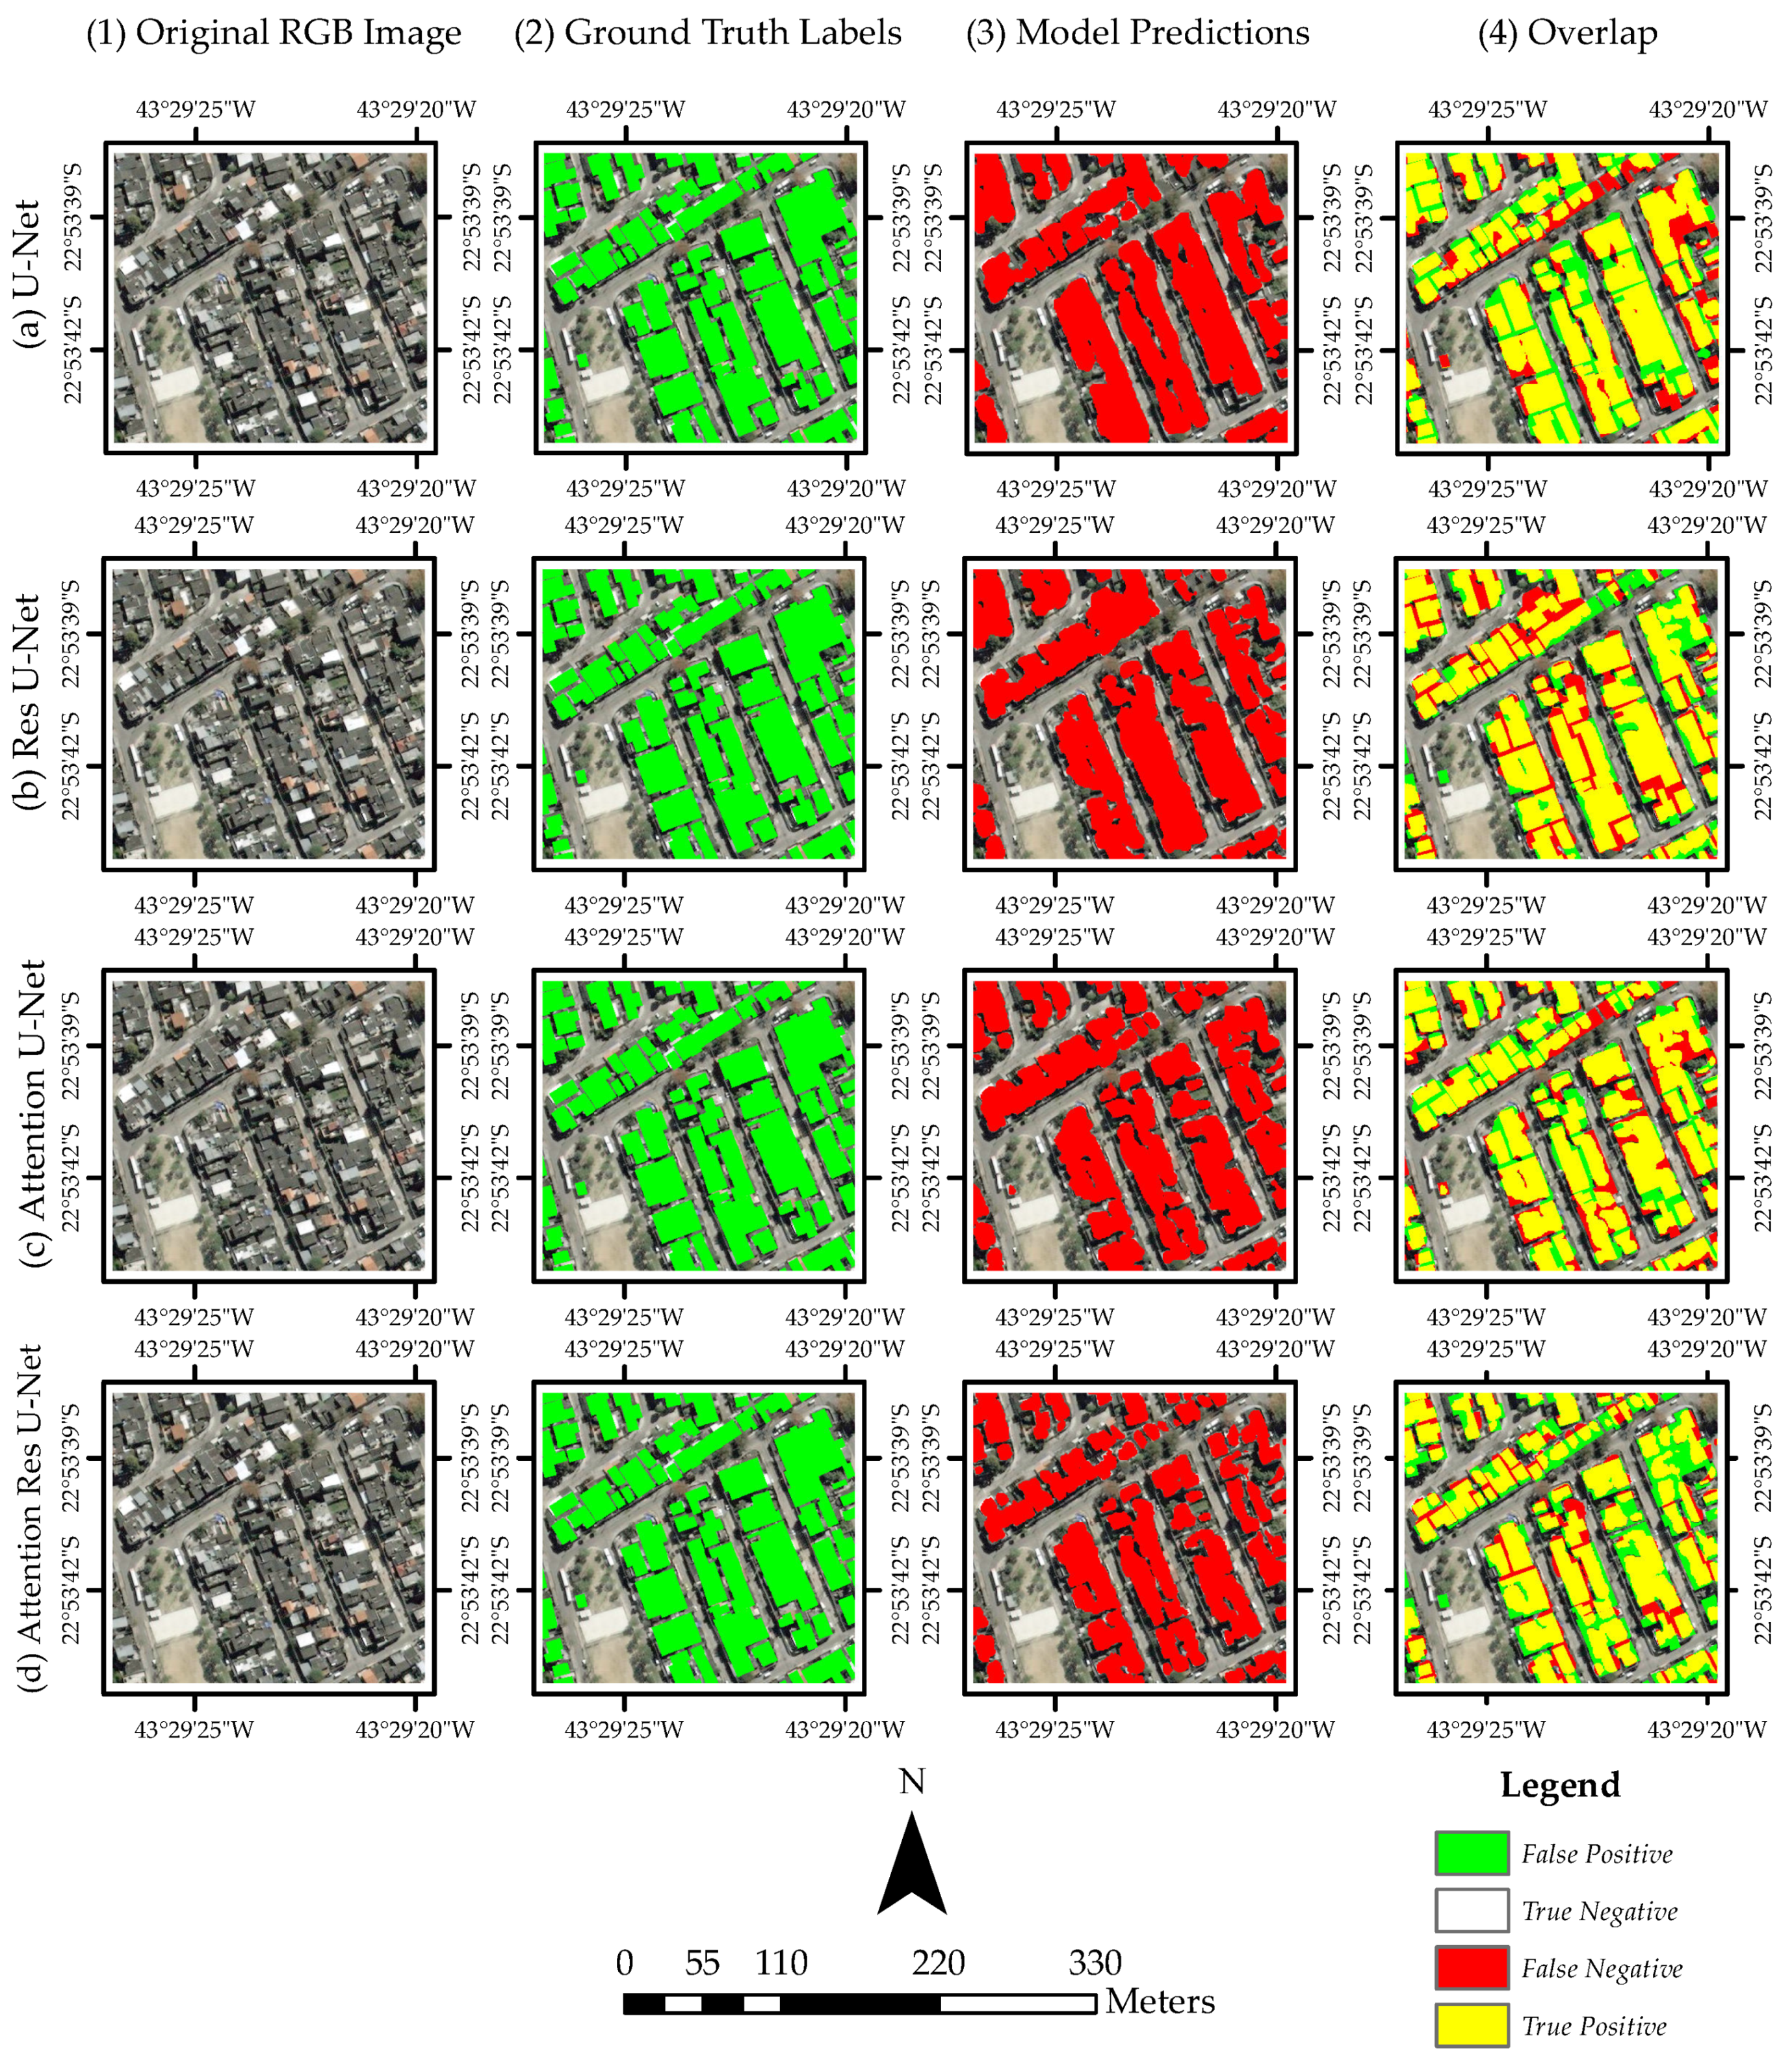
4.3. Experimental Results

Table 1 and Table 2 present the comparison of the performance of the U-Net architectures in the semantic segmentation task with the SpaceNet 1 dataset, accompanied by other approaches from the literature. Therefore, it is reasonable to comment on the performance between (1) the U-Net architectures and (2) the U-Net architectures and the other approaches considered.
Comparison between the different U-Net architectures proposed: According to Table 1, U-Net achieves the lowest computational accuracy regardless of the evaluation metric among the four architectures considered (U-Net, ResU-Net, Attention U-Net, and Attention ResU-Net). Focusing on precision, ResU-Net achieves the highest score with a value of 0.864 , which is due to the residual block’s ability to introduce additional information to the inputs being processed. On the other hand, Attention U-Net results in the best accuracy, recall, F1, and Jaccard scores; during the concatenation operation, the areas of interest on each feature map are highlighted, and this results in improved processing of the input’s spatial information. Of particular interest is Attention ResU-Net’s performance. Although it is expected that combining both the residual blocks and the attention gates in the same architecture would further increase the computational performance when compared to ResU-Net or Attention U-Net, in fact, Attention ResU-Net performs moderately. To this also contributes the fact that it has the largest number of trainable parameters.
Comparison of the proposed U-Net-based architecture with other approaches from the literature: In this paragraph, we compare the proposed deep learning architecture that utilizes the U-Net structure with other models presented in the literature, such as SegNet [27], a deep fully convolutional neural network architecture for semantic pixel-wise segmentation, SegNet with Sobel edge-detecting filters [10], CRF, a machine learning algorithm used for structured predictions along with Sobel filters [10], and CRF with CNN boundaries [10]. Focusing on precision, it can be seen that the proposed Attention U-Net architecture outperforms the other approaches, and the fact that the number of FP values is remarkably low considering (2) should also be emphasized. This is due to skip connection, which enhances the spatial information during the decoding process. With respect to accuracy, the standard U-Net has the same performance as SegNet, while CRF with Sobel filters performs slightly better than the other approaches, with Attention U-Net scoring the highest value. The highest recall score is achieved by SegNet, followed by the proposed Attention U-Net, whereas the rest of the values are in the range of 0.7–0.8. Similar results to that of the precision are observed for the F1 score, where the Attention U-Net performs better regardless of the architecture used.
Apart from the numerical accuracy of the U-Net architectures, in Figure 5, we illustrate their effectiveness in building extraction. Here, the rows correspond to: (a) U-Net, (b) Residual U-Net, (c) Attention U-Net, and (d) Attention Residual U-Net, whereas the columns correspond to: (1) the original RGB image, (2) the image’s ground-truth label, (3) the predicted buildings, and (4) the TP, TN, FP, and FN values compared to the original RGB images. Note that the TN values are totally transparent and represent other objects of the area that the networks predicted correctly as background.
According to Figure 5, in the first and third columns, it can be seen that the building areas are predicted precisely and are correctly separated from the non-building areas, making the buildings’ localization accurate. However, it is also observed that the edges and especially the corners of the buildings do not form a clear four-rectangle shape, but instead, they form arcs. Furthermore, it can be seen that the vanilla U-Net makes an initial localization of the buildings, while the other variations express the geometry of the buildings in an improved manner. Specifically, Res U-Net’s predictions are more precise when buildings are relatively close to each other, while Attention U-Net is more accurate in mapping the buildings’ theoretical four-rectangle shape without including the non-building areas, e.g., fences and roads. It is important to note that attention gates are robust in finding highly detailed features within an image, and this is justified from the small prediction (considered as a park in the image), making Attention U-Net more flexible for urban planning tasks. Finally, Attention ResU-Net attempts to combine the best of both worlds; buildings are clearly observed and are also separated from the non-building areas, but the accuracy of this process is moderate when compared to each individual network (Attention or ResU-Net).

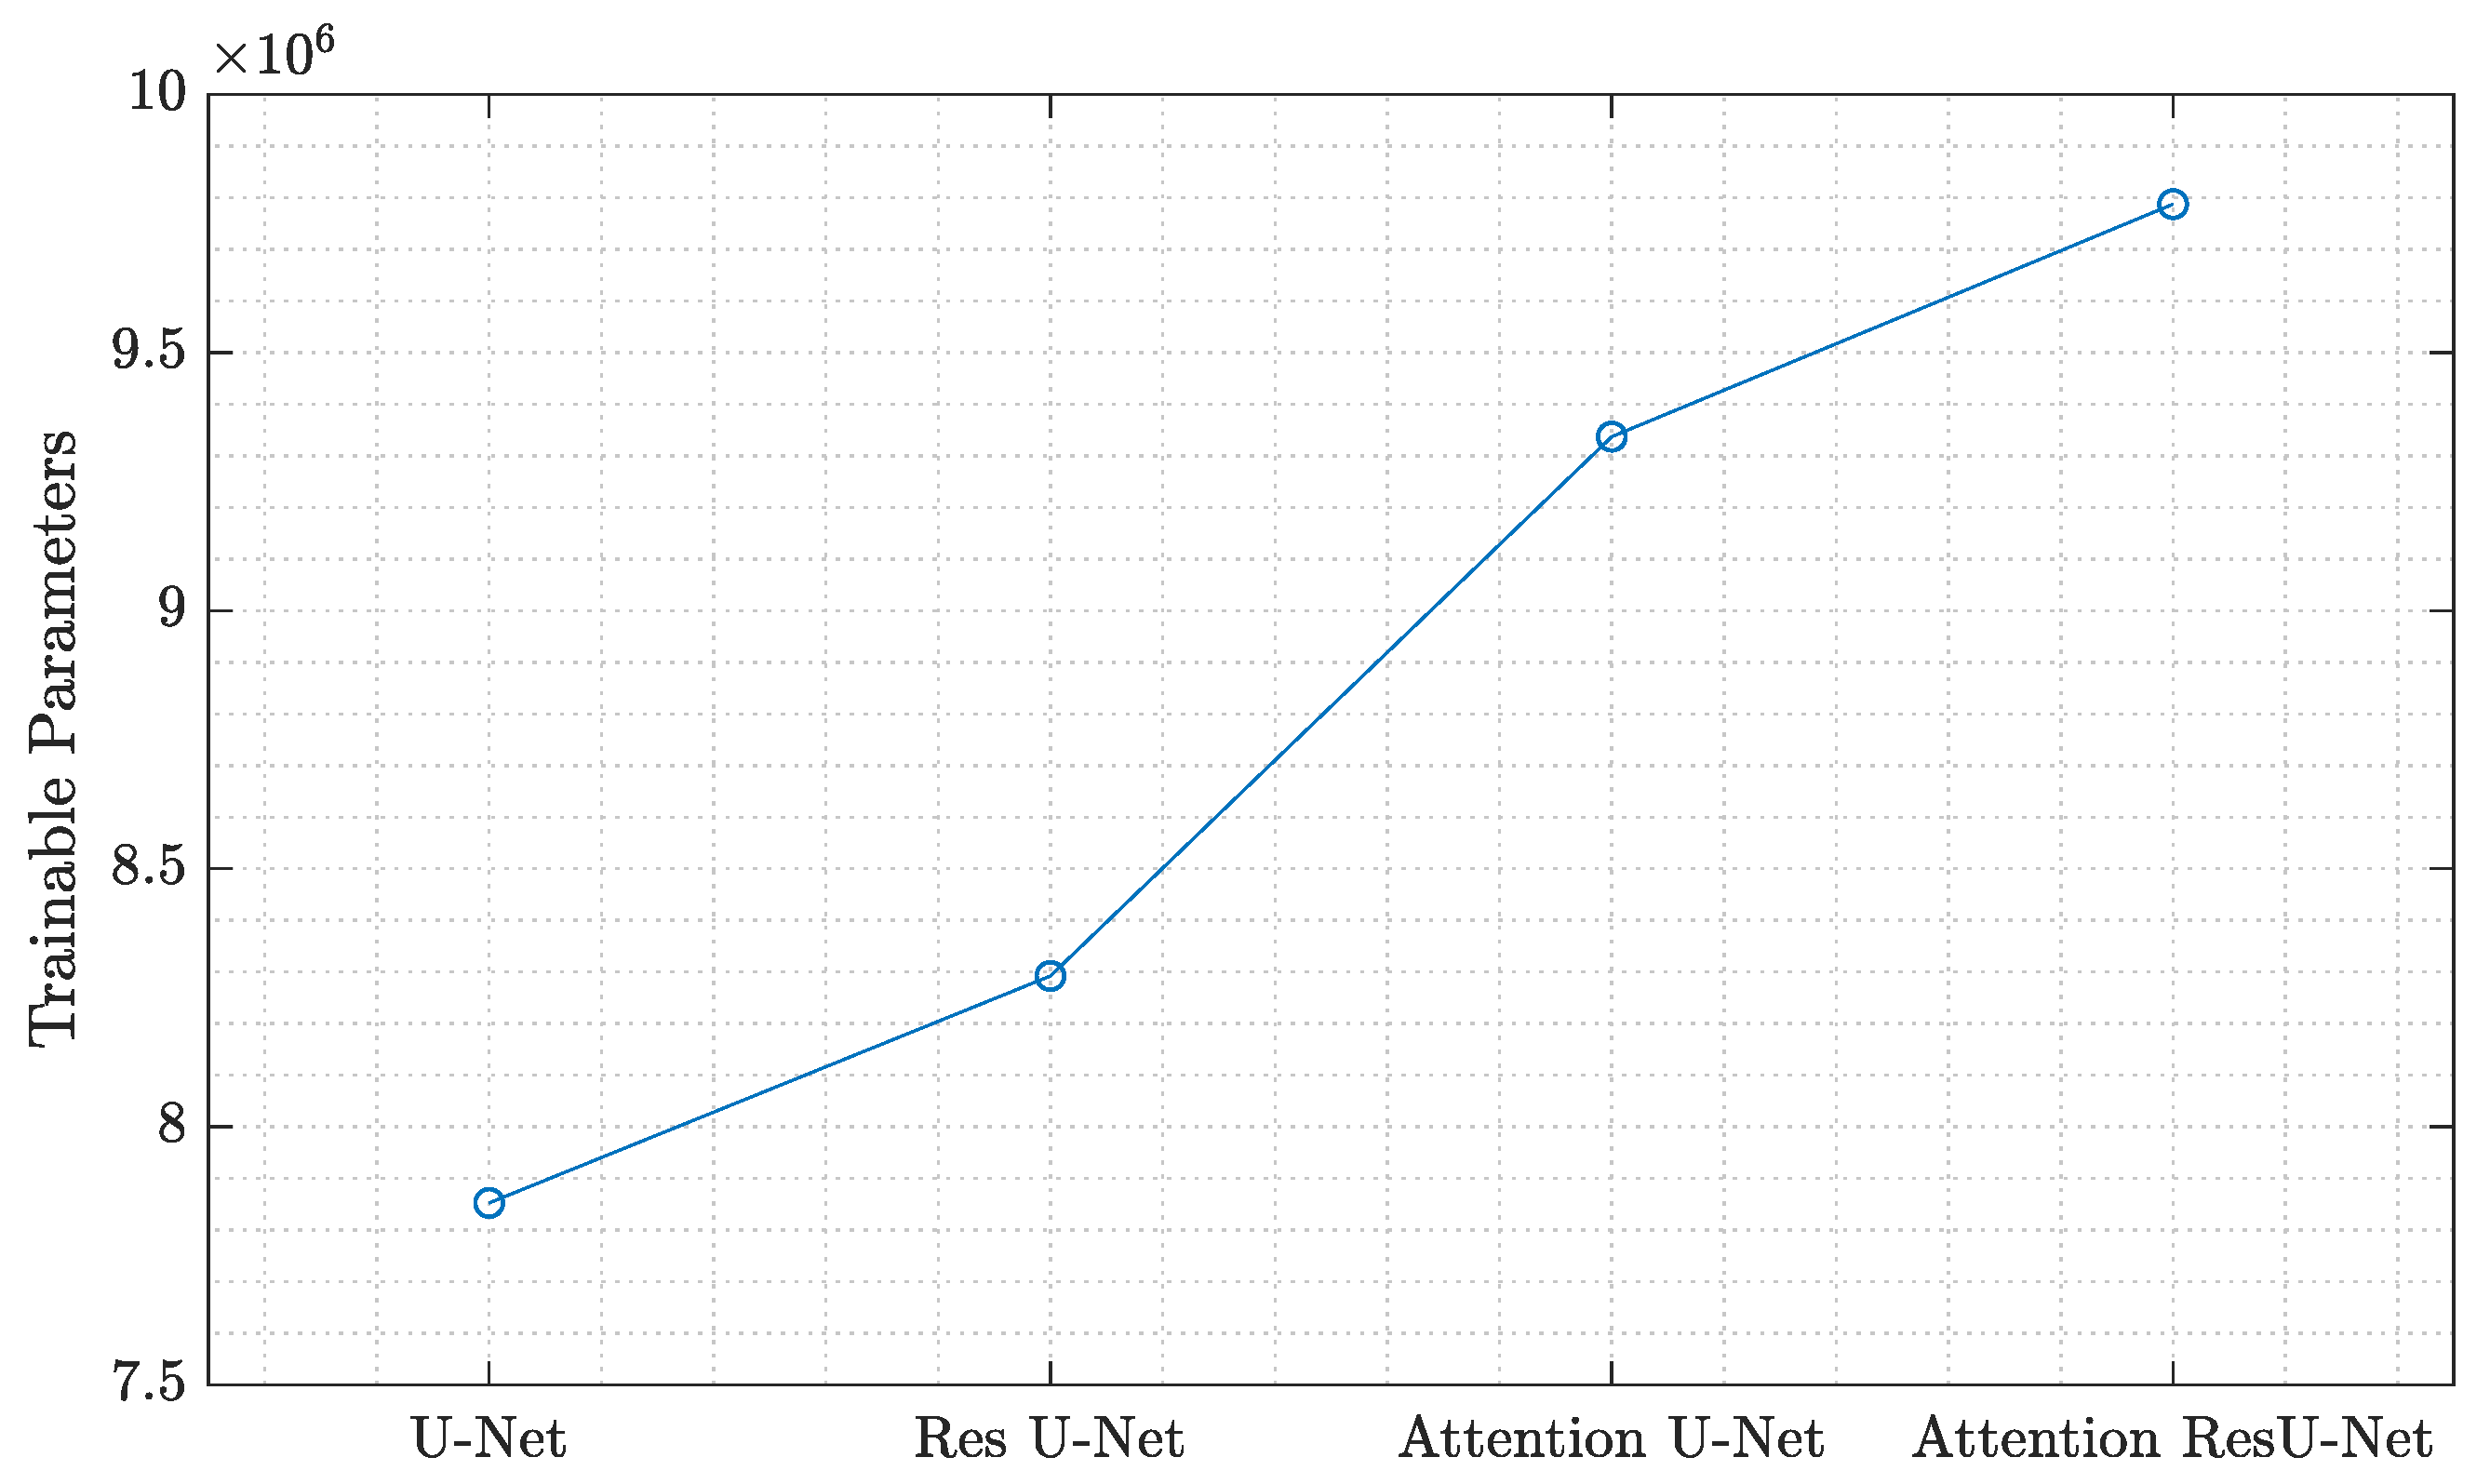
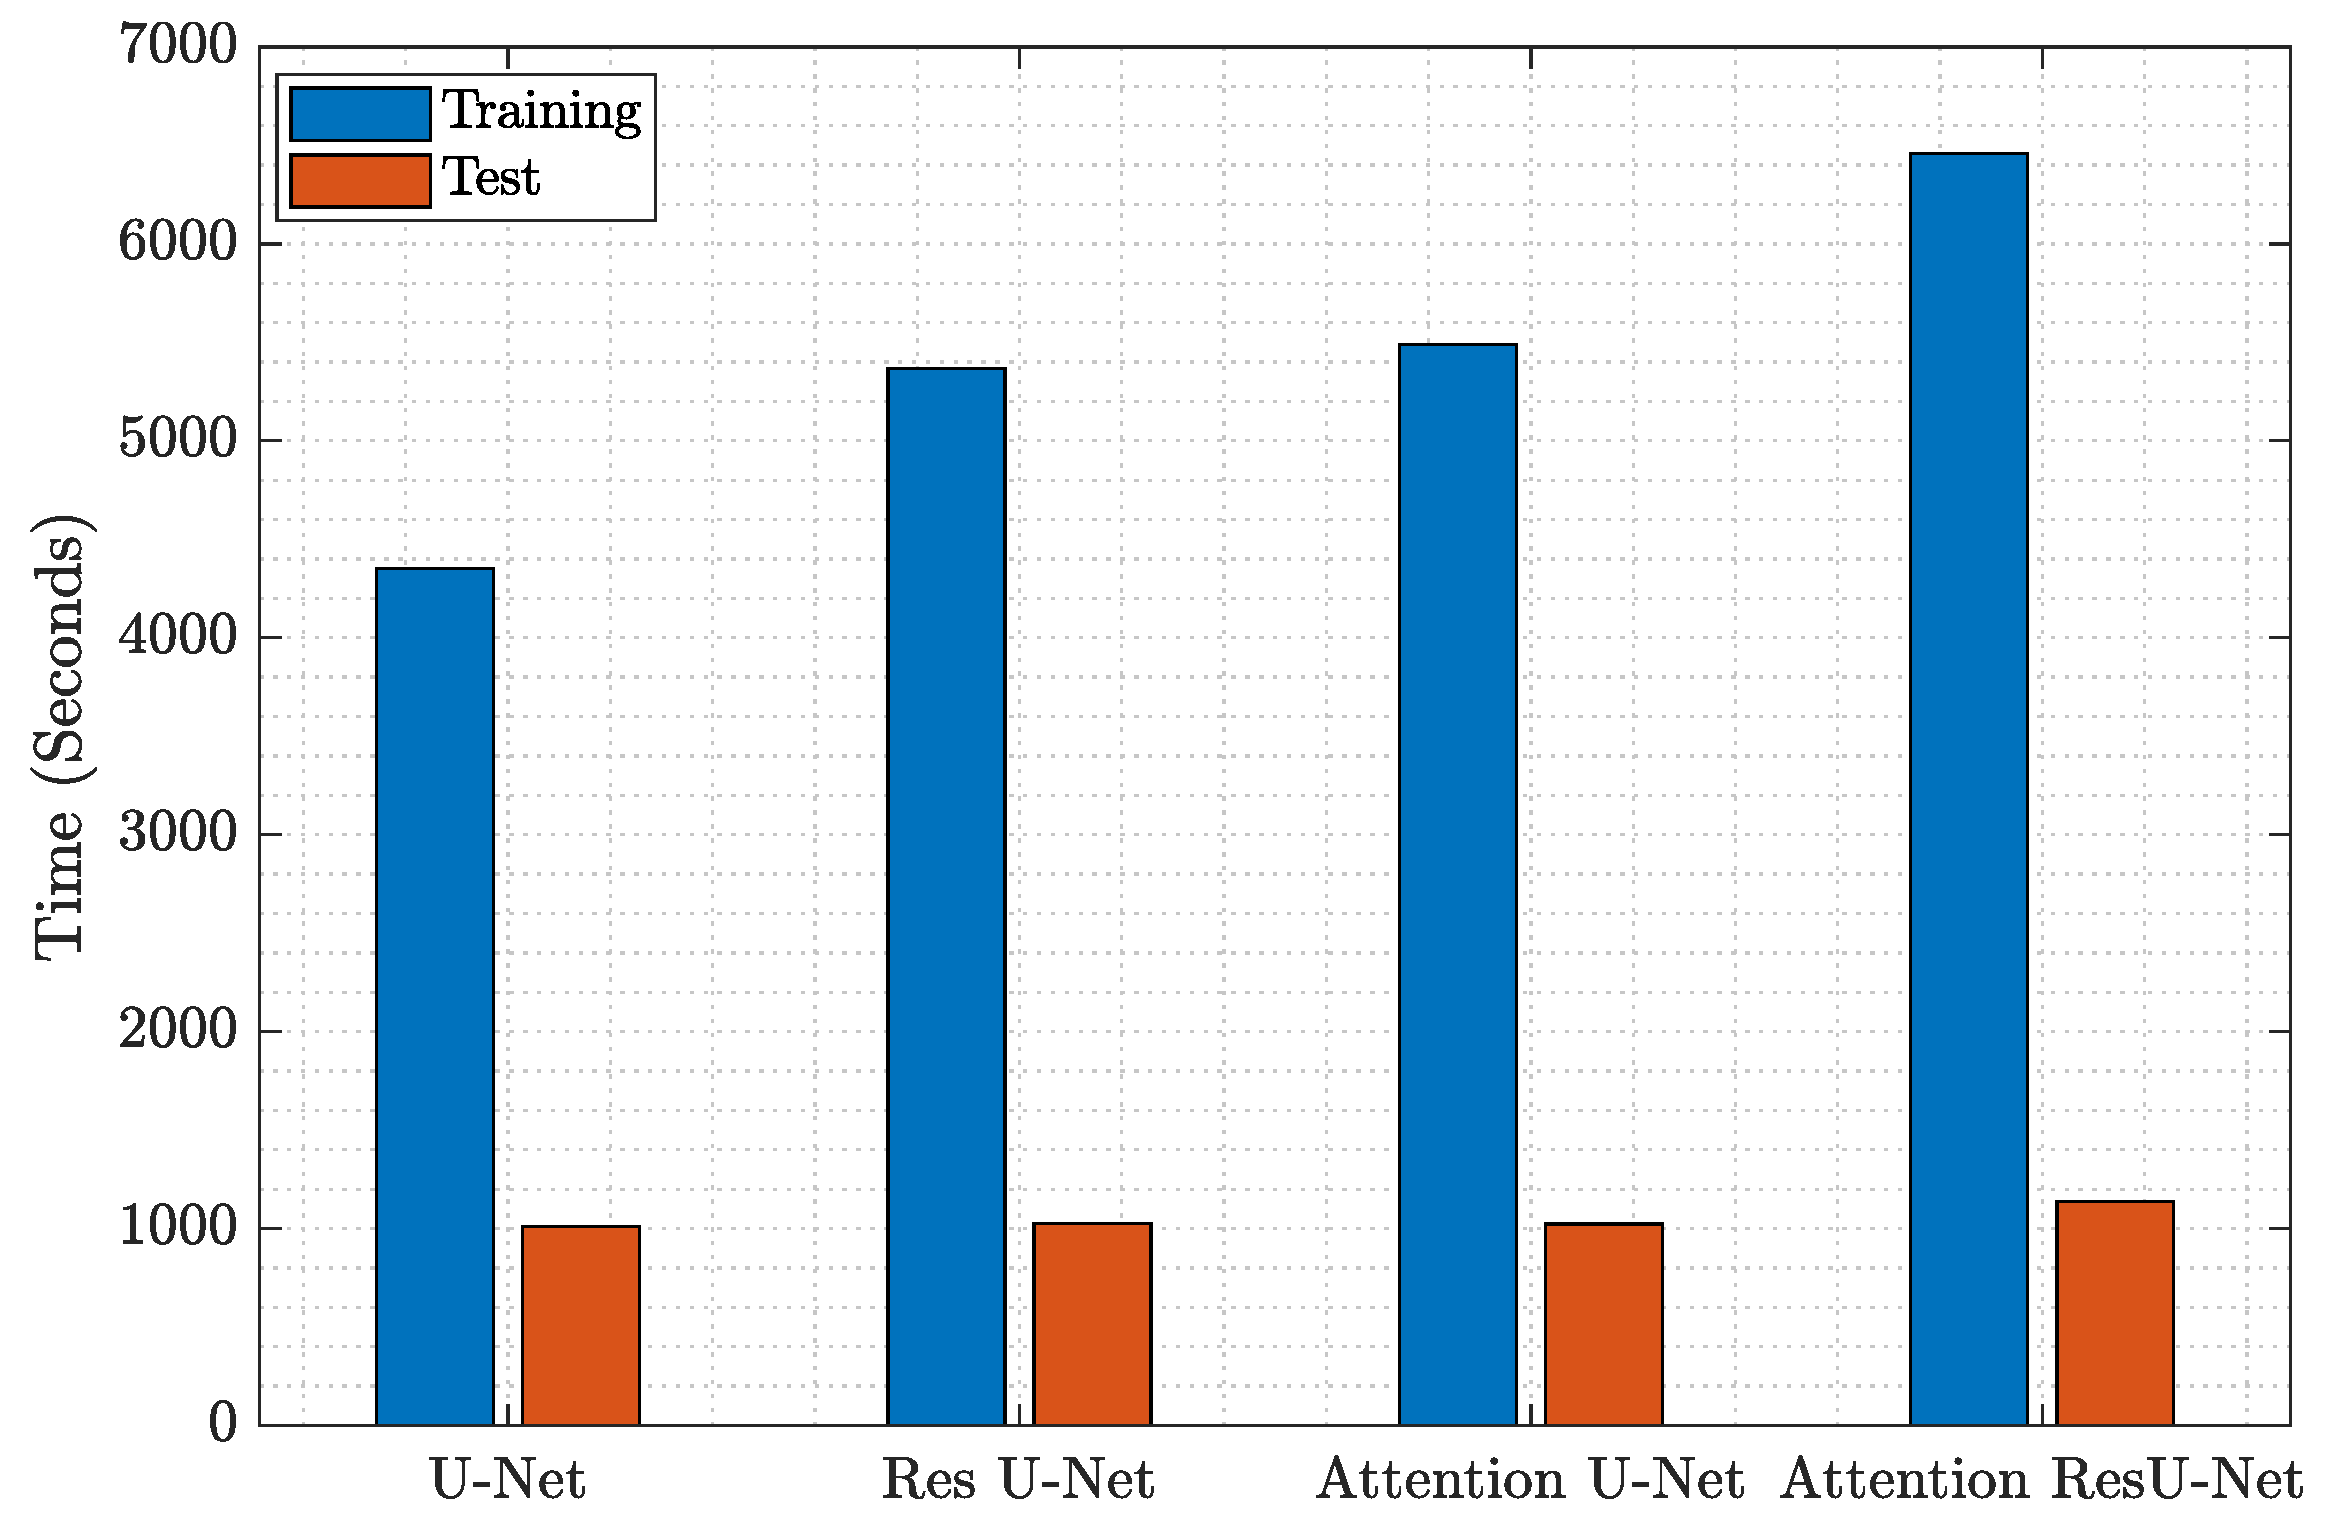
4.4. Model Complexity

With respect to the training and testing procedure, out of the 6940 images in total, we considered 4500 ( 65 % ) for training, 500 ( 7 % ) for validation, and 1940 ( 28 % ) for testing.
The batch size used corresponded to 16 samples per batch, while the learning rate was LR = 10 3 for a total of epochs = 30 . These parameters were applied to all of the U-Net architectures so as to have a fair comparison of their performance. It is important to note that all simulations were conducted on Google Colaboratory, an environment that provides access to graphical processing units (GPUs) and the parallel computing platform CUDA. Thus, many of the separate computations of each model were done in parallel, thus generally achieving lower training and testing times. As far as the number of trainable parameters is concerned, it is expected that increasing the model complexity implies an increase in (1) the number of trainable parameters and (2) the time required for the networks to be trained. The corresponding results are graphically illustrated in Figure 6 and Figure 7. An important observation is that although Attention U-Net has almost 1m parameters more than Res U-Net, they have similar training times, meaning that Attention U-Net converges faster.
The main advantage of the U-Net architectures is that they require fewer data during training and fewer computational resources when compared to other deep learning architectures according to the literature [29,30,31,32]. Therefore, a potential decrease in the input data may have a negligible impact on the models’ accuracy and precision, but may reduce the computational time and resources [40]. In contrast to that mentioned above, increasing the input data by applying data augmentation algorithms can improve the models’ performance in terms of the cost of additional training time and computational power [41]. Finally, the processing times of other CNN architectures and approaches can vary greatly compared to those of the models in this work, and this is based on many factors, such as the available processing units (i.e., CPU, GPU, etc.), the number of images in the dataset itself, possible early-stopping criteria used, the depth of other CNN architectures, the batch size used, the base number of input filters, and other factors.

5. Conclusions

In this work, automatic building extraction from low-cost RGB images by using various deep neural network architectures based on the U-Net model was presented. It was shown that a plain U-Net can accurately make an initial localization of the buildings, whereas the inclusion of attention gates reduces the appearance of arcs around edges and detects small objects that refer to non-building areas. Although there was no information from near-infrared spectra or any digital terrain models, all U-Net variations made accurate predictions. In particular, our best model was the Attention U-Net, which achieved the highest F1 and Jaccard scores of 0.826 and 0.726, respectively, among all the compared architectures, such as the conventional U-Net and the ResU-Net. Despite that the attention mechanism makes U-Net a more robust network than other U-Net variants, the residual block makes the U-Net more precise in building localization. A combination of the previous advantages can be achieved using both residual blocks and attention gates, but at the cost of increasing the number of trainable parameters. The experimental results justified the above in the evaluation with standard classification metrics on the SpaceNet 1 dataset, while extensive comparisons with other deep learning approaches used in the literature highlighted the advantages of the proposed Attention U-Net variant. As a conclusion, the time needed for urban planning using U-Net deep learning models can be accelerated. As future work, U-Net models will be evaluated on other datasets while utilizing more spectral bands in order to investigate their effectiveness in building extraction. In addition, few-shot learning strategies can be incorporated in the above-mentioned architecture to take an expert user’s preferences into account in the final classification outcomes.

Author Contributions

Conceptualization, A.T., A.D. and N.D.; methodology, A.T. and N.T.; Software, A.T.; validation, A.T., N.T., A.D. and N.D.; writing—original draft preparation, A.T. and N.T.; writing—review and editing, A.T., N.T., A.D. and N.D.; supervision, A.D. and N.D. All authors have read and agreed to the published version of the manuscript.

Funding

The research work was supported by the Hellenic Foundation for Research and Innovation (HFRI) under the HFRI PhD Fellowship grant (Fellowship Number:1216) and was supported by the European Union-funded project YADES “Improved Resilience and Sustainable Reconstruction of Cultural Heritage Areas to Cope with Climate Change and Other Hazards Based on Innovative Algorithms and Modelling Tools” under the MSCA program and the grant agreement No. 872931.

Institutional Review Board Statement

Not applicable.

Informed Consent Statement

Not applicable.

Data Availability Statement

The dataset SpaceNet 1 contains images taken from the WorldView-2 satellite and is publicly available according to reference [35].

Acknowledgments

The authors would like to thank the anonymous reviewers for their kind suggestions and constructive comments.

Conflicts of Interest

The authors declare no conflict of interest.

References

  1. Garg, L.; Shukla, P.; Singh, S.; Bajpai, V.; Yadav, U. Land Use Land Cover Classification from Satellite Imagery using mUnet: A Modified Unet Architecture. In Proceedings of the VISIGRAPP (4: VISAPP), Prague, Czech Republic, 25–27 February 2019; pp. 359–365. [Google Scholar]
  2. Zhang, P.; Ke, Y.; Zhang, Z.; Wang, M.; Li, P.; Zhang, S. Urban land use and land cover classification using novel deep learning models based on high spatial resolution satellite imagery. Sensors 2018, 18, 3717. [Google Scholar] [CrossRef] [Green Version]
  3. Han, Z.; Dian, Y.; Xia, H.; Zhou, J.; Jian, Y.; Yao, C.; Wang, X.; Li, Y. Comparing fully deep convolutional neural networks for land cover classification with high-spatial-resolution Gaofen-2 images. ISPRS Int. J. -Geo-Inf. 2018, 9, 478. [Google Scholar] [CrossRef]
  4. Pauleit, S.; Duhme, F. Assessing the environmental performance of land cover types for urban planning. Landsc. Urban Plan. 2000, 52, 1–20. [Google Scholar] [CrossRef]
  5. Thunig, H.; Wolf, N.; Naumann, S.; Siegmund, A.; Jürgens, C.; Uysal, C.; Maktav, D. Land use/land cover classification for applied urban planning-the challenge of automation. In Proceedings of the 2011 Joint Urban Remote Sensing Event, Munich, Germany, 11–13 April 2011; pp. 229–232. [Google Scholar]
  6. Rimal, B.; Zhang, L.; Keshtkar, H.; Haack, B.; Rijal, S.; Zhang, P. Land use/land cover dynamics and modeling of urban land expansion by the integration of cellular automata and markov chain. ISPRS Int. J. -Geo-Inf. 2018, 7, 154. [Google Scholar] [CrossRef] [Green Version]
  7. Beretta, F.; Shibata, H.; Cordova, R.; Peroni, R.; Azambuja, J.; Costa, J. Topographic modelling using UAVs compared with traditional survey methods in mining. REM-Int. Eng. J. 2018, 71, 463–470. [Google Scholar] [CrossRef]
  8. Huang, J.; Zhang, X.; Xin, Q.; Sun, Y.; Zhang, P. Automatic building extraction from high-resolution aerial images and LiDAR data using gated residual refinement network. ISPRS J. Photogramm. Remote Sens. 2019, 151, 91–105. [Google Scholar] [CrossRef]
  9. Sirmacek, B.; Unsalan, C. A probabilistic framework to detect buildings in aerial and satellite images. IEEE Trans. Geosci. Remote Sens. 2010, 49, 211–221. [Google Scholar] [CrossRef] [Green Version]
  10. Vakalopoulou, M.; Bus, N.; Karantzalos, K.; Paragios, N. Integrating edge/boundary priors with classification scores for building detection in very high resolution data. In Proceedings of the 2017 IEEE International Geoscience And Remote Sensing Symposium (IGARSS), Fort Worth, TX, USA, 23–28 July 2017; pp. 3309–3312. [Google Scholar]
  11. Xu, Y.; Wu, L.; Xie, Z.; Chen, Z. Building extraction in very high resolution remote sensing imagery using deep learning and guided filters. Remote Sens. 2018, 10, 144. [Google Scholar] [CrossRef] [Green Version]
  12. Guo, M.; Liu, H.; Xu, Y.; Huang, Y. Building extraction based on U-Net with an attention block and multiple losses. Remote Sens. 2020, 12, 1400. [Google Scholar] [CrossRef]
  13. Prathap, G.; Afanasyev, I. Deep learning approach for building detection in satellite multispectral imagery. In Proceedings of the 2018 International Conference On Intelligent Systems (IS), Funchal, Portugal, 25–27 September 2018; pp. 461–465. [Google Scholar]
  14. Protopapadakis, E.; Doulamis, A.; Doulamis, N.; Maltezos, E. Stacked autoencoders driven by semi-supervised learning for building extraction from near infrared remote sensing imagery. Remote Sens. 2021, 13, 371. [Google Scholar] [CrossRef]
  15. Pasquali, G.; Iannelli, G.; Dell’Acqua, F. Building footprint extraction from multispectral, spaceborne earth observation datasets using a structurally optimized U-Net convolutional neural network. Remote Sens. 2019, 11, 2803. [Google Scholar] [CrossRef] [Green Version]
  16. Ji, S.; Wei, S.; Lu, M. Fully convolutional networks for multisource building extraction from an open aerial and satellite imagery data set. IEEE Trans. Geosci. Remote Sens. 2018, 57, 574–586. [Google Scholar] [CrossRef]
  17. Yang, H.; Yuan, J.; Lunga, D.; Laverdiere, M.; Rose, A.; Bhaduri, B. Building extraction at scale using convolutional neural network: Mapping of the united states. IEEE J. Sel. Top. Appl. Earth Obs. Remote Sens. 2018, 11, 2600–2614. [Google Scholar] [CrossRef] [Green Version]
  18. Chen, L.; Yang, Y.; Wang, J.; Xu, W.; Yuille, A. Attention to Scale: Scale-aware Semantic Image Segmentation. In Proceedings of the IEEE Conference on Computer Vision and Pattern Recognition, Las Vegas, NV, USA, 27–30 June 2016; pp. 3640–3649. [Google Scholar]
  19. Chen, L.; Papandreou, G.; Kokkinos, I.; Murphy, K.; Yuille, A. Deeplab: Semantic image segmentation with deep convolutional nets, atrous convolution, and fully connected crfs. IEEE Trans. Pattern Anal. Mach. Intell. 2017, 40, 834–848. [Google Scholar] [CrossRef] [Green Version]
  20. Zhao, H.; Shi, J.; Qi, X.; Wang, X.; Jia, J. Pyramid Scene Parsing Network. In Proceedings of the IEEE Conference on Computer Vision and Pattern Recognition, Honolulu, HI, USA, 21–26 July 2017; pp. 2881–2890. [Google Scholar]
  21. Makantasis, K.; Karantzalos, K.; Doulamis, A.; Doulamis, N. Deep supervised learning for hyperspectral data classification through convolutional neural networks. In Proceedings of the 2015 IEEE International Geoscience And Remote Sensing Symposium (IGARSS), Milan, Italy, 26–31 July 2015; pp. 4959–4962. [Google Scholar]
  22. Liu, X.; Deng, Z.; Yang, Y. Recent progress in semantic image segmentation. Artif. Intell. Rev. 2019, 52, 1089–1106. [Google Scholar] [CrossRef] [Green Version]
  23. Long, J.; Shelhamer, E.; Darrell, T. Fully Convolutional Networks for Semantic Segmentation. In Proceedings of the IEEE Conference on Computer Vision And Pattern Recognition (CVPR), Boston, MA, USA, 7–12 June 2015. [Google Scholar]
  24. Ronneberger, O.; Fischer, P.; Brox, T. U-Net: Convolutional Networks for Biomedical Image Segmentation. In Proceedings of the Medical Image Computing And Computer-Assisted Intervention—MICCAI 2015, Munich, Germany, 5–9 October 2015; pp. 234–241. [Google Scholar]
  25. Rakhlin, A.; Davydow, A.; Nikolenko, S. Land cover classification from satellite imagery with u-net and lovász-softmax loss. In Proceedings of the IEEE Conference on Computer Vision And Pattern Recognition Workshops, Salt Lake City, UT, USA, 18–22 June 2018; pp. 262–266. [Google Scholar]
  26. Ulmas, P.; Liiv, I. Segmentation of satellite imagery using u-net models for land cover classification. arXiv 2020, arXiv:2003.02899. [Google Scholar]
  27. Badrinarayanan, V.; Kendall, A.; Cipolla, R. Segnet: A deep convolutional encoder-decoder architecture for image segmentation. IEEE Trans. Pattern Anal. Mach. Intell. 2017, 39, 2481–2495. [Google Scholar] [CrossRef]
  28. He, K.; Gkioxari, G.; Dollár, P.; Girshick, R. Mask r-cnn. In In Proceedings of the IEEE International Conference On Computer Vision, Venice, Italy, 22–29 October 2017; pp. 2961–2969. [Google Scholar]
  29. Temenos, A.; Protopapadakis, E.; Doulamis, A.; Temenos, N. Building Extraction from RGB Satellite Images using Deep Learning: A U-Net Approach. In Proceedings of the 14th PErvasive Technologies Related To Assistive Environments Conference, Corfu, Greece, 29 June–2 July 2021; pp. 391–395. [Google Scholar]
  30. Voulodimos, A.; Protopapadakis, E.; Katsamenis, I.; Doulamis, A.; Doulamis, N. Deep learning models for COVID-19 infected area segmentation in CT images. In Proceedings of the 14th PErvasive Technologies Related To Assistive Environments Conference, Corfu, Greece, 29 June–2 July 2021; pp. 404–411. [Google Scholar]
  31. Katsamenis, I.; Protopapadakis, E.; Doulamis, A.; Doulamis, N.; Voulodimos, A. Pixel-level corrosion detection on metal constructions by fusion of deep learning semantic and contour segmentation. In International Symposium on Visual Computing; Springer: Cham, Switzerland, 16 June 2020. [Google Scholar]
  32. Liu, Y.; Wang, F.; Dobaie, A.; He, G.; Zhuang, Y. Comparison of 2D image models in segmentation performance for 3D laser point clouds. Neurocomputing 2019, 251, 136–144. [Google Scholar] [CrossRef]
  33. Alom, M.; Yakopcic, C.; Hasan, M.; Taha, T.; Asari, V. Recurrent residual U-Net for medical image segmentation. J. Med. Imaging 2019, 6, 014006. [Google Scholar] [CrossRef]
  34. Oktay, O.; Schlemper, J.; Folgoc, L.; Lee, M.; Heinrich, M.; Misawa, K.; Mori, K.; McDonagh, S.; Hammerla, N.; Kainz, B.; et al. Attention u-net: Learning where to look for the pancreas. arXiv 2018, arXiv:1804.03999. [Google Scholar]
  35. Van Etten, A.; Lindenbaum, D.; Bacastow, T. Spacenet: A remote sensing dataset and challenge series. arXiv 2018, arXiv:1807.01232. [Google Scholar]
  36. Maltezos, E.; Doulamis, A.; Doulamis, N.; Ioannidis, C. Building extraction from LiDAR data applying deep convolutional neural networks. IEEE Geosci. Remote Sens. Lett. 2018, 16, 155–159. [Google Scholar] [CrossRef]
  37. Maltezos, E.; Doulamis, N.; Doulamis, A.; Ioannidis, C. Deep convolutional neural networks for building extraction from orthoimages and dense image matching point clouds. J. Appl. Remote Sens. 2017, 11, 042620. [Google Scholar] [CrossRef]
  38. He, K.; Zhang, X.; Ren, S.; Sun, J. Deep residual learning for image recognition. In Proceedings of the IEEE Conference on Computer Vision And Pattern Recognition, Las Vegas, NV, USA, 27–30 June 2016; pp. 770–778. [Google Scholar]
  39. Van Etten, A. You only look twice: Rapid multi-scale object detection in satellite imagery. arXiv 2018, arXiv:1805.09512. [Google Scholar]
  40. Zhang, L.; Shen, J.; Zhu, B. A research on an improved Unet-based concrete crack detection algorithm. Struct. Health Monit. 2021, 20, 1864–1879. [Google Scholar] [CrossRef]
  41. Shorten, C.; Khoshgoftaar, T. A survey on image data augmentation for deep learning. J. Big Data 2019, 6, 1–48. [Google Scholar] [CrossRef]
Figure 1. The U-Net (a) architecture. The contracting path (left) encodes information by downsampling the input image five times. The expanding path (right) decodes information using the contracting path to improve on the spatial information. The Attention U-Net (b) architecture consists of the original U-Net architecture along with attention gates in the contracting path, which are used to avoid low-level features being repeatedly extracted.
Technologies 10 00019 g001
Figure 2. (Left): Convolution and ReLU convolution block utilized by the U-Net architecture. (Right): Residual block adding the initial information to the convolution and ReLU operation.
Technologies 10 00019 g002
Figure 3. Operation of the attention block used in the Attention U-Net architecture. The feature map is denoted as x and is derived from the encoding part of the network, while the gating signal g is derived from one layer lower in the network.
Technologies 10 00019 g003
Figure 4. Two sample images taken from the WorldView-2 satellite along with their masks from the SpaceNet 1 dataset. (Left): RGB image patches. (Right): Corresponding masks.
Technologies 10 00019 g004
Figure 5. Automatic building extraction using the U-Net architectures. From the top to the bottom rows: (a) U-Net, (b) Residual U-Net, (c) Attention U-Net, and (d) Attention Residual U-Net. From the left to the right columns: (1) original RGB image, (2) ground-truth labels, (3) networks’ predictions, and (4) overlap of networks’ predictions and ground-truth labels with the original image as background.
Technologies 10 00019 g005
Figure 6. Number of trainable parameters ( × 10 6 ) used for U-Net and its variations. The inclusion of attention gates and residual blocks increases the total number of parameters for the plain U-Net architecture.
Technologies 10 00019 g006
Figure 7. Total training and testing times in seconds for the U-Net architecture and its variations. The increase in the models’ complexity due to the inclusion of attention gates and residual blocks has an impact on the training time.
Technologies 10 00019 g007
Table 1. Comparison of the performance between U-Net architectures. Best scores are annotated in bold.
ArchitectureEvaluation Metrics
AccuracyPrecisionRecallF1Jaccard
U-Net [29]0.9230.8080.8080.7980.700
ResU-Net0.9360.8640.7700.8110.703
Attention U-Net0.9400.8510.8090.8260.726
Attention ResU-Net0.9370.8500.7990.8200.719
Table 2. Comparison of performance between the proposed U-Net architecture and approaches from the literature on the semantic segmentation task with the SpaceNet 1 dataset. Best scores are annotated in bold.
ArchitectureEvaluation Metrics
AccuracyPrecisionRecallF1Jaccard
SegNet [27]0.9190.5690.813 0.662-
SegNet with Sobel filters [10]0.9230.5960.7220.667-
CRF with Sobel filters [10]0.9310.6320.7630.675-
CRF with CNN boundaries [10]0.9240.6240.7640.674-
U-Net [29]0.9230.8080.8080.7980.700
ResU-Net0.9360.8640.7700.8110.703
Attention U-Net0.9400.8510.8090.8260.726
Publisher’s Note: MDPI stays neutral with regard to jurisdictional claims in published maps and institutional affiliations.

