Article

A Quantitative Model Supporting Socially Responsible Public Investment Decisions for Sustainable Tourism †

Department of Mechanical, Energy and Management Engineering, University of Calabria, 87036 Rende (CS), Italy
*
Author to whom correspondence should be addressed.
Paper presented at the 1st Interdisciplinary International Conference on Tourism, Management and Development of Territory, 16–19 December 2019, Bari (Italy).
Int. J. Financial Stud. 2020, 8(2), 33; https://doi.org/10.3390/ijfs8020033
Submission received: 6 March 2020 / Revised: 29 April 2020 / Accepted: 20 May 2020 / Published: 1 June 2020
(This article belongs to the Special Issue Socially Responsible Investments)

Abstract

:
The purpose of this article is to develop a quantitative model that supports policy makers in the tourism sector in making socially responsible investment decisions. In particular, this paper proposes a methodological approach to assess the impact of strategic decisions at the policy level, in the field of tourism, from an economic, environmental and social point of view. The Calabria region, in Italy, has been chosen as a real-world case study. Based on historical data, the study identifies the main levers that influence tourism-related dynamics in Calabria. A quantitative forecasting model to support future investment decisions for sustainable tourism has then been developed. This problem is modeled through a multi-criteria optimization framework. To initialize such a framework, a non-linear autoregressive network with exogenous inputs (NARX) has been used. The proposed model is a flexible instrument to evaluate public investment policies in the field of tourism from the point of view of sustainability and social responsibility.

1. Introduction

Tourism is a sector with a strong economic, environmental and social impact. National and regional governments which invest in tourism need to consider the problem of making socially responsible decisions. The primary objective of this study is to support policy makers in the field of tourism in evaluating their investment decisions from the point of view of sustainability and social responsibility. The goal of our analysis is not to merely provide guidelines to increase tourism flows, since this strategy could lead to different drawbacks; i.e., increased pollution (Mehmood et al. 2016), a higher number of crimes (Stange et al. 2011) or overpopulation (Saaty 1990) etc.). More generally, this work aims at supporting socially responsible strategic investment decisions taking into account drivers related to socio-environmental aspects. To achieve this goal we examine the impact of tourism on the quality of life of a community. This impact is measured through different key performance indicators (KPIs) related to economic, environmental and social factors (Wu et al. 2018). The dynamic nature of tourist channel competition requires destinations to be able to combine and manage their tourist resources in order to gain competitive advantages (Teece et al. 1997; Cracolici and Nijkamp 2009). A predictive model can be used to understand how these resources affect the system and accordingly plan future strategic decisions (Shah et al. 2019; Zhao et al. 2019).
Different studies have been carried in the field of the impact of tourism on the surrounding context. An interesting review can be found in Van der Zee and Vanneste (2015). Many studies are numerical and statistical models (Plog 1974; Miossec 1977; Thurot 1980; Butler 1980; Butler 1991) analyzing the economic impact of tourism flows on a specific territory and in a well-defined time frame. Sustainability has become one of the main dimensions in tourism research as highlighted by the UN 2030 Agenda for Sustainable Development (Hall 2019). Scholars stress the importance of studies and tools focusing on tourism sustainability and with an impact on decision making and individual behavior (Keyvanfar et al. 2018; Font et al. 2019). After an extensive review of literature on sustainable tourism, Ruhanen et al. (2019) underline the importance of modeling decision processes in the field. In general, there is a lack of practical procedures supporting policy makers in making decisions oriented to sustainable tourism (Lakner et al. 2018; Guo et al. 2019).
Consequently, the aim of this work is to develop a model that can be used as a sustainability-oriented decision support system. The specificity of our study, however, is that it proposes a framework that can be adapted to a territory, taking into account the specific attributes particularly important for the considered case study.
Data used to test this approach are related to Calabria, an Italian region with a modest level of industrial development, which has attracted growing tourist flows in recent years. Tourism is a strategic economic sector for this area, but the growing number of tourists poses challenges from a social and environmental point of view. Calabria is a region characterized by small organizations where diffuse, spontaneous initiatives are the main mode of destinations promotion in the tourism sector. In the past, public investment decisions aimed exclusively at increasing the number of tourists have created social and environmental damage.
The methodology illustrated in this paper is derived from Zhang (2016), who first proposed an analytic network process within a goal-programming model based on nine decision variables and used it to weigh tourism development goals. The model has been tested on data from Tibet, one of the most popular Chinese tourism destinations, which is of great ecological, cultural and economic value. Although our methodology is similar, we made use of different decision variables and objective criteria in order to consider the different peculiarities of the analyzed regions. Moreover, in the first stage of the analysis, in which a set of relationships is developed through a non-linear autoregressive network (NARX), we consider the possibility that the impact of some decision variables on an objective response could be achieved only after a certain amount of time (years). This is particularly relevant, since it might be possible that public funding used for the activation of multi-year projects generates an immediate social value due to the newly created job positions and a delayed economic return due to the project outputs.

2. The Predictive Model

With the aim of defining a decision support system for tourism management, the following steps were performed. First step: determining the boundaries of the analyzed domain. Second: after a deep evaluation of the state-of-the-art and through collaboration with various stakeholders in the tourism field, we were able to identify the main objectives to pursue and the variables to investigate in order to influence those objectives. Third: a NARX network was used to formalize mathematically the required input–output relationships. Each step of the procedure will be described in Section 3.
In this section, we describe how we have developed a predictive model from a time series of data related to Calabria and how the model can be used to make future decisions. There are few examples of attempts to forecast the tourist flows based on regional data. Most focus on the factors affecting the choice of tourist destinations. These studies are mainly based on qualitative methods and focusing on short time periods, generally one or few years. In Calabria, the tourist flow is steadily growing.

2.1. Domain Definition

The development of a decision support system requires the correct definition of the factors that partially/totally influence the set of key performance indicators which have a direct impact on the objectives that the decision maker aims to optimize. The selection of indicators was carried out according to the indications reported by the European Tourism Indicator System (European Commission (EC) 2014). The indicators have been divided into three overall categories: final goals, intermediate results and variables. “Final goals” are the three dimensions of sustainability: economic, social and environmental. The final goals cannot be directly measured. “Intermediate results” are intermediate objectives that can be directly measured and relate to the three dimensions of sustainability. Intermediate results have been linked to final goals through a procedure detailed in the following section. “Variables” are cause variables which have an impact on intermediate results and, through intermediate results, on the final goals. Some variables are under the control of the decision maker. They are the specific focus of our model. Others, like for example population and GDP, are contingent factors that must be taken into account but cannot be directly determined. See Figure 1 for the details. We collected all the historical data available for Calabria to get a clear picture of the touristic impact on the economic, social and environmental goals. Then, in order to collect missing data we have consulted public databases of national institutions such as: Istat, Mibact, Sistan, Ispra, ACI, ANPA, Ateco, UNPLI, Arpacal, Eurostat, Banca D’Italia (the expanded name of the institutions is reported in the caption of the following table). Collaboration with the Regional Department of National and European Planning Funds, which we thank, allowed us to access the time series of European and Italian funds in the field of regional tourism. Other potentially relevant indicators were excluded from our analysis because their effect can be considered to a large extent included in the chosen indicators. For example, the effect of competition from alternative destinations is implicit in the number of tourists or in the average stay. The effect of macroeconomic factors such as the financial crisis is included in the GDP factor. This article proposes a procedure that can be applied using different indicators according to the needs of the subject conducting the analysis. In this first application we used indicators for which, without prejudice regarding their relevance, data were available. In future applications it will be possible to purposefully collect specific data according to refined indicators.
The data were grouped into “thematic” tables depending on the field of interest and the direct influence on the territory, subsequently selected as “variables” or “levers” as follows (Table 1, Table 2, Table 3, Table 4 and Table 5).

2.2. Time Delay Neural Networks

Accurate forecasts are crucial because of the unique nature of the tourism industry (Frechtling 2012). These activities can be performed through qualitative and quantitative approaches (Walle 1997). The first ones depend on substantial information and human experiences gained through the years. Walle (1997) criticized these techniques for their lack of generalizability. The second ones make use of mathematical functions to define the relationships of certain phenomena using numerical data. These models are then used to estimate future values based on past performance. The construction of an approximation model as a neural network has become a standard technique for many applications (Specht 1991). However, the use of classical structures and training algorithms still present some shortcomings, being not satisfactory if the complexity or the dimension of the problem is increased. An alternative scheme of neural network architecture (NARX) is designed to model the non-linearity of the analyzed problem. NARX is one of the recurrent neural network schemes with a specific global feedback, considered as a time series forecasting network. It is particularly appropriate for dynamic system applications as it gives a fast and accurate training response, then describes a system as a linear combination of some input parameters, then past values up to a certain fixed time delay, and its own past values.
y j ( t ) = f [ y j ( t 1 ) , , y j ( t n y ) , x 1 ( t ) , . , x 1 ( t n u 1 ) , , x n ( k n u n ) ]
yj(t) and xi(t) represent, respectively, the input and output vectors at time step t, ny and nui are the input and output time delays, while the function f is a non-linear mapping function. The non-linear mapping 
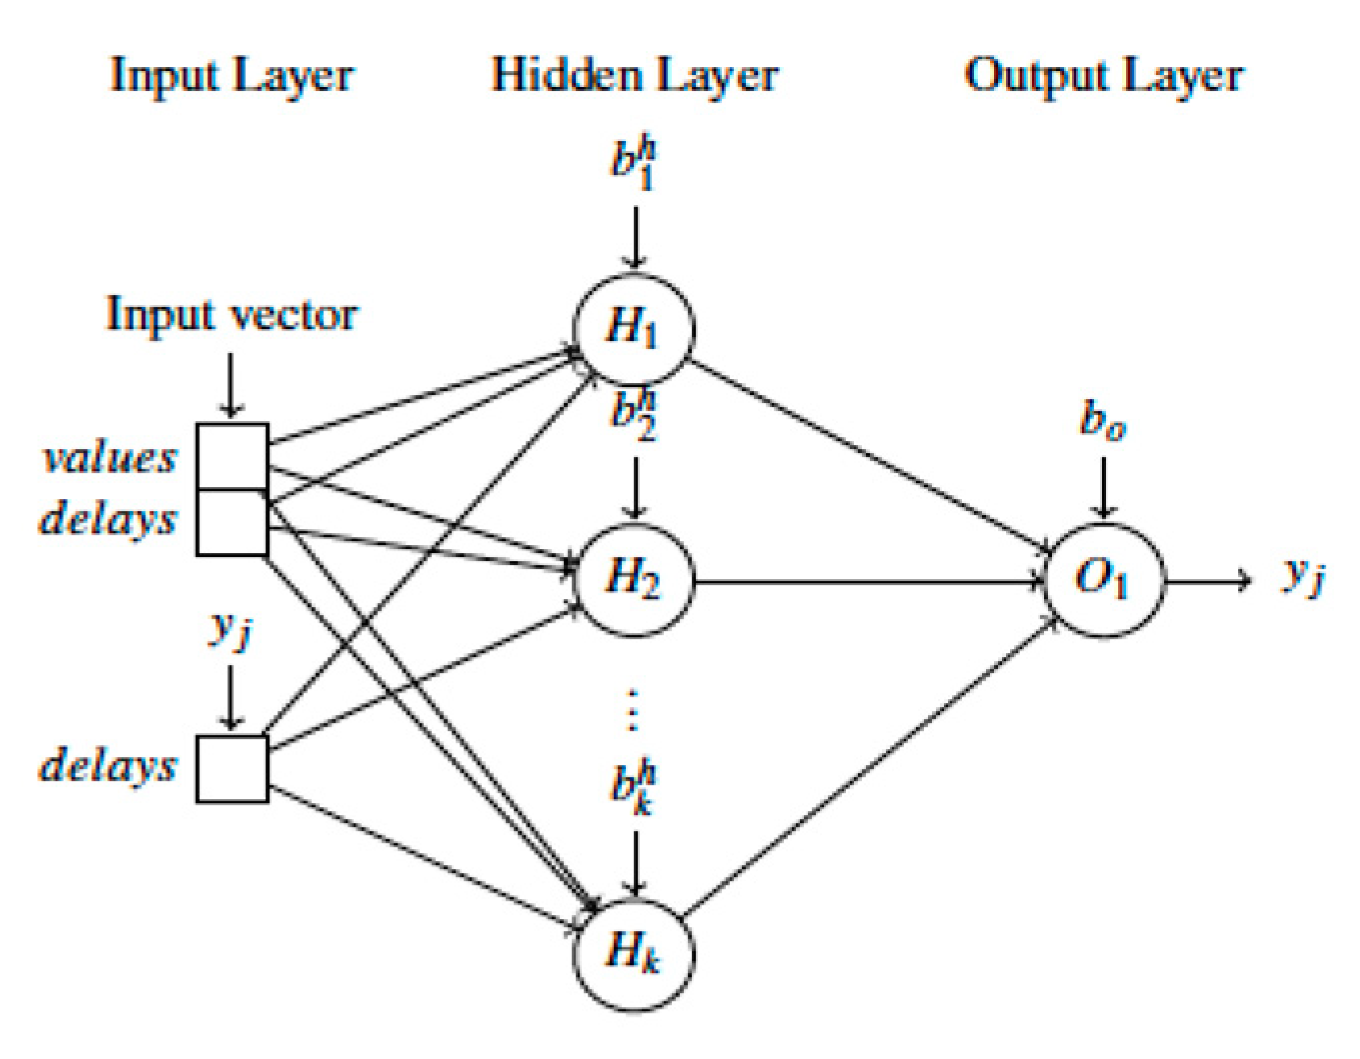
f in (1) is generally unknown but can be approximated, using a standard multilayer perceptron network with a combination of different activation functions (e.g., RELU, sigmoid, linear). For illustration purposes, the architecture of the NARX network is shown in Figure 2.
The first layer of the network is composed by the input information used to predict the value of y j ( t ) . For the particular application, the layer contains a subset of the decision variables of tourism development goals reported in Table 1 and previous recorded values of y j . The subset of relevant information can be detected by using a trial and error approach or through statistical techniques (e.g., Analysis of Variance). The values stored in the input layers are then manipulated through a structure of weighted connections and hidden units. An example of a network composed of three layers is shown in Figure 2. The value of a generic hidden unit in the second layer H k is given by the following equation:
H k = σ [ b k + k = 1 n y w k y j ( t k ) + i = 1 n k = 1 n i n w i k x i ( t k ) ] ,
where σ is a sigmoid function and w k   and   w i k are weight coefficients. Finally, in a similar way the predicted output value yj(t) is modeled as:
y j ( t ) = b 0 + k = 1 K θ k H k .
It is worth noting that Equations (2) and (3) apply to a three-layer network. If the NARX architecture is made by more than one hidden layer, additional intermediate transformations are required.
Backpropagation through time (BPTT) is the most used algorithm for training recurrent neural networks. The aim of the BPTT algorithm is to minimize the error of the network outputs. The general algorithm is:
  • fix an initial set of weights;
  • present the input data and propagate it through the network to get the estimated output;
  • compare the predicted output to the expected output and calculate the error;
  • calculate the derivates of the error with respect to the network weights and adjust the weights so that the error is minimized.
The error E to be minimized is:
E = t = 1 T y ( t ) y ^ ( t ) 2
where y ^ ( t ) is the estimated output value at time t. The new weights are iteratively updated computing the error propagation term by proceeding backward through t = T, …, 1 for each time t and unit activation xi(t), y(t). The performance of the NARX network in terms of complexity and accuracy is largely dependent on internal components, such as the number of hidden neurons and the activation functions, and training algorithm parameters, such as the learning rate and the momentum. The process of selecting an adequate value of these parameters is still a controversial issue even if several approaches have been proposed in recent years. In this work, a procedure based on the use of a genetic algorithm illustrated in Ciancio et al. (2016) has been used to determine a suitable network architecture. The first step of this method is to encode the features of the neural network into specific chromosomes. A chromosome is a sequence of bits with value 0 or 1. Genetic algorithm undertakes to evolve the solution, during its execution, according to the following basic pattern:
(1)
random generation of the first population of solutions;
(2)
application of a fitness function to the solutions belonging to the current population;
(3)
selection of the best solutions based on the value of the fitness function;
(4)
generation of new solutions using crossover and mutation;
(5)
repetition of steps 2, 3 and 4 for k iterations;
(6)
selection of the best found solution.
One of the disadvantages of BPTT is that when the number of time steps increases, the computation also increases, making the overall model noisy. The high cost of single parameter updates makes the BPTT impossible to use for a large number of iterations. For this reason, it is important to consider only the relevant input parameters and time delays. The ANOVA technique was used to determine which decision variables significantly affect the selected criteria (Rajput et al. 2011). A p-Value threshold of 0.05 was used to determine the relevant features. The 26 data related to the period 1990–2015 were split in two sets. The first set, 1990–2013, was used to train and validate the regression model, while the last two data sets were used for validation purposes. Table 3 reports the accuracy of the estimated input–output relationships both in absolute and percentage terms.
In order to test the prediction accuracy, we compared the real KPI values measured in 2014 and 2015 with the predicted responses obtained by imposing the strategic decisions adopted in those two years as input values. The results are reported in Table 6 and Table 7.

3. Conclusions

The proposed methodology allowed us to create a tool that supports policy makers in future investment decisions in the tourism sector. The methodology was built to evaluate investments from the point of view of sustainability and social responsibility. Compared to existing models, the mathematical formulation is able to analyze different investment plans through a sensitivity analysis that emphasizes socially responsible factors. Predictions on the future value of investments from the economic, environmental and social points of view can be formulated using our method and used to evaluate investment decisions.
The equations of the model are estimated based on historical data using a NARX network. At the same time the NARX helps us to have a clear picture of how to influence the critical objective variables with a small sample of data. The methodology will help decision makers to choose from a set of previously identified strategic plans.
The variables chosen in this paper were considered relevant for the specific case study (i.e., Calabria). Other decision makers in other territories could choose a different set of variables. In particular, in this study only publicly available data have been used. Future applications could use purposefully retrieved data and, consequently, develop finer indicators. For example, the number of circulating vehicles specifically related to tourism could be calculated and included in the model instead of the number of vehicles in general. The use of this approach can support the balanced and socially responsible growth of the tourism industry in regions which aim at increasing their wealth without compromising their environmental and social goals.

Author Contributions

The article is the result of the joint work of the authors who all participated in its writing in all its parts. However the following specific contributions can be identified: C.C.: Methodology and Formal analysis; V.C.: Introduction and Economic Model; R.M.: Conceptualization, Modelling and Supervision; A.S. Conceptualization, Conclusions and Data collection. All authors have read and agreed to the published version of the manuscript.

Funding

This research has not received external or public funding.

Acknowledgments

We thank the Regional Departments of Public Works, Infrastructure and European Programming.

Conflicts of Interest

The authors declare that they have no conflict of interest.

References

  1. Butler, Richard W. 1980. The concept of a tourist area cycle of evolution: implications for management of resources. The Canadian Geographer/Le Gographe canadien 24: 5–12. [Google Scholar] [CrossRef]
  2. Butler, Richard W. 1991. Tourism, environment, and sustainable development. Environmental Conservation 18: 201–9. [Google Scholar] [CrossRef]
  3. Ciancio, Claudio, Giuseppina Ambrogio, Francesco Gagliardi, and Roberto Musmanno. 2016. Heuristic techniques to optimize neural network architecture in manufacturing applications. Neural Computing and Applications 27: 2001–15. [Google Scholar] [CrossRef]
  4. Cracolici, Maria Francesca, and Peter Nijkamp. 2009. The attractiveness and competitiveness of tourist destinations: A study of Southern Italian regions. Tourism Management 30: 336–44. [Google Scholar] [CrossRef]
  5. European Commission (EC). 2014. Directorate General for Enterprise and Industry. In The European Tourism Indicator-Toolkit for Sustainable Destinations. Brussels: EU. [Google Scholar]
  6. Font, Xavier, James Higham, Graham Miller, and Shahab Pourfakhimi. 2019. Research engagement, impact and sustainable tourism. Journal of Sustainable Tourism 27: 1–11. [Google Scholar] [CrossRef] [Green Version]
  7. Frechtling, Douglas. 2012. Forecasting Tourism Demand. Abingdon: Routledge. [Google Scholar]
  8. Guo, Yi, Jinbo Jiang, and Shengchao Li. 2019. A Sustainable Tourism Policy Research Review. Sustainability 11: 3187. [Google Scholar] [CrossRef] [Green Version]
  9. Hall, C. Michael. 2019. Constructing sustainable tourism development: The 2030 agenda and the managerial ecology of sustainable tourism. Journal of Sustainable Tourism 27: 1044–60. [Google Scholar] [CrossRef]
  10. Keyvanfar, Ali, Arezou Shafaghat, Sapura Mohamad, Mu’azu Mohammed Abdullahi, Hamidah Ahmad, Mohd Derus, Nurul Hidayah, and Majid Khorami. 2018. A Sustainable Historic Waterfront Revitalization Decision Support Tool for Attracting Tourists. Sustainability 10: 215. [Google Scholar] [CrossRef] [Green Version]
  11. Lakner, Zoltán, Anna Kiss, Ivan Merlet, Judit Oláh, Domicián Máté, Janusz Grabara, and József Popp. 2018. Building Coalitions for a Diversified and Sustainable Tourism: Two Case Studies from Hungary. Sustainability 10: 1090. [Google Scholar] [CrossRef] [Green Version]
  12. Mehmood, Shafaqat, Zahid Ahmad, and Ather Azim Khan. 2016. Dynamic relationships between tourist arrivals, immigrants, and crimes in the United States. Tourism Management 54: 383–92. [Google Scholar] [CrossRef]
  13. Miossec, Jean Marie. 1977. Miossec, Jean Marie 1977. Un modle de l’espace touristique. Espace Gographique 6: 41–8. [Google Scholar] [CrossRef]
  14. Plog, Fred. 1974. The Study of Prehistoric Change. New York: Academic Press. [Google Scholar]
  15. Rajput, Harish C., Abbas S. Milani, and Andrew Labun. 2011. Including time dependency and ANOVA in decision-making using the revised fuzzy AHP. A case study on wafer fabrication process selection. Applied Soft Computing 11: 5099–109. [Google Scholar] [CrossRef]
  16. Ruhanen, Lisa, Char-lee Moyle, and Brent Moyle. 2019. New directions in sustainable tourism research. Tourism Review 74: 138–49. [Google Scholar] [CrossRef]
  17. Saaty, Thomas L. 1990. How to make a decision: the analytic hierarchy process. European Journal of Operational Research 48: 9–26. [Google Scholar] [CrossRef]
  18. Shah, Dev, Haruna Isah, and Farhana Zulkernine. 2019. Stock market analysis: A review and taxonomy of prediction technique. International Journal of Financial Studies 7: 26. [Google Scholar] [CrossRef] [Green Version]
  19. Specht, Donald F. 1991. A general regression neural network. Neural Networks. IEEE Transactions on Neural Networks 2: 568–76. [Google Scholar] [CrossRef] [PubMed] [Green Version]
  20. Stange, Jan, Brown David, Hilbruner Richard, and Hawkins Donald Edward. 2011. Tourism Destination Management Achieving Sustainable and Competitive Results; Washington: US Agency for International Development.
  21. Teece, David J., Gary Pisano, and Amy Shuen. 1997. Dynamic capabilities and strategic management. Strategic Management Journal 18: 509–33. [Google Scholar] [CrossRef]
  22. Thurot, Jean Maurice. 1980. Capacitè de Charge et Production Touristique. Centre des Huates Etudes Touristiques. Paris: Universitè de Droit, d’Economie et des Sciences. [Google Scholar]
  23. Van der Zee, E., and D. Vanneste. 2015. Tourism networks unravelled; a review of the literature on networks in tourism management studies. Tourism Management Perspectives 15: 46–56. [Google Scholar] [CrossRef] [Green Version]
  24. Walle, Alf H. 1997. Quantitative versus qualitative tourism research. Annals of Tourism Research 24: 524–36. [Google Scholar] [CrossRef]
  25. Wu, Yunna, Jianli Zhou, Yong Hu, Lingwenying Li, and Xiaokun Sun. 2018. A TODIM-Based Investment Decision Framework for Commercial Distributed PV Projects under the Energy Performance Contracting (EPC) Business Model: A Case in East-Central China. Energies 11: 1210. [Google Scholar] [CrossRef] [Green Version]
  26. Zhang, Jiekuan. 2016. Weighing and realizing the environmental, economic and social goals of tourism development using an analytic network process-goal programming approach. Journal of Cleaner Production 127: 262–73. [Google Scholar] [CrossRef]
  27. Zhao, Xinna, Yuhang Tang, Milin Lu, and Xiaohong Zhang. 2019. Foreign direct investment dynamic performance with low-carbon influence: A provincial comparative application in China. International Journal of Financial Studies 7: 46. [Google Scholar] [CrossRef] [Green Version]
Figure 1. Description of final goals, intermediate results and variables.
Ijfs 08 00033 g001
Figure 2. Non-linear autoregressive network (NARX) network architecture.
Ijfs 08 00033 g002
Table 1. Decision variables of tourism development goals.
IDIndicatorsDescription
x 1 Public investment in tourismSum of all European and national funds (including the annual fee paid by the region) spread over the territory to promote cultural and touristic activities. (1), (11), (13)
x 2 GDP CalabriaGross domestic product per capita in Calabria. (1), (11)
x 3 PopulationTotal number of residents in the region. (1), (12)
x 4 Number of sleeping accommodations in CalabriaTotal number of beds on offer in the regional territory during the year. (1), (10), (13)
x 5 VehiclesTotal number of cars in circulation in the regional territory. (5)
x 6 Associations promoting local tourismTotal number of “pro loco” registered in the territory. (8)
x 7 Tourism sciences graduatesTotal number of students graduated from all the tourism schools in Calabria over the year. (13)
(1) Istat: Italian National Institute of Statistics; (2) Mibact: Ministry of Heritage, Cultural Activities and Tourism; (3) Sistan: National Statistic System; (4) Ispra: Higher Institute for Environmental Protection and Research; (5) ACI: Italian Automobile Club; (6) ANPA: National Agency for Environmental Protection until 1999; (7) APAT: Agency for Environmental Protection and Technical Services; (8) UNPLI: National Union Pro Loco of Italy; (9) Arpacal: Regional Agency for Environmental Protection of Calabria; (10) Eurostat: Statistical Office of the European Union; (11) Banca D’Italia: Bank of Italy; (12) BURC: Official Bulletin of Calabria Region; (13) USR. MIUR: Regional School Office of Calabria; (14) Security and order institutions.
Table 2. Decision variables: historical data.
ID1990 Value2015 ValueAverage Value
x 1 17,419,571€24,110,443€12,364,316€
x 2 11,987€13,230€14,226€
x 3 2,087,1201,970,5212,020,630
x 4 722,4011,481,9351,173,057
x 5 850,7241,574,0921,265,844
x 6 70346178.4
x 7 247576539.2
Table 3. Objective variables of tourism development goals.
IDIndicatorsDescription
y 1 Total spending in tourismTotal annual tourist expenditure in the regional territory (expressed in millions of euros). (1),(10),(11)
y 2 Number of people who visited museumsTotal number of visitors to museums, archaeological sites, art galleries, monuments and monumental complexes, natural areas. (2),(3)
y 3 Number of touristsTotal numbers in attendance, such as the days of stay of all foreign and Italian tourists in the tourist facilities of the territory during the year. (1),(10)
y 4 Average stay of touristsAverage number of days of tourist stay in the regional territory in one year. (1),(2),(10)
y 5 Pollution stock (CO2)CO2 production (expressed in tons) attributable to industry and the fleet of vehicles in circulation on the regional territory. (4),(6),(7),(8)
y 6 Pollution stock (total)Production of polluting gases in the territory (expressed in ton) attributable to industry and vehicles (except CO2). (4),(6),(7),(8)
y 7 Waste generated by tourismProduction of waste directly attributable to tourism in the territory during the year. (4),(6),(7)
y 8 Number of employees in museums and cultureTotal number of employees in cultural institutions of the region in all contractual categories. (2),(8)
y 9 CriminalityTotal numbers of crimes reported by law enforcement agencies throughout the regional territory during the year. (14)
(1) Istat, (2) Mibact, (3) Sistan, (4) Ispra, (5) ACI, (6) ANPA, (7) APAT, (8) Unpli, (9) Arpacal, (10) Eurostat, (11) Banca d’Italia, (12) Burc, (13) USR ( Ipsar), (14) SOI.
Table 4. Objective variables: historical data.
ID1990 Value2015 ValueAverage Value
y 1 142,000,000€161,000,000€156,497,000€
y 2 652,0001,764,300981,315
y 3 3,773,5138,135,8786,503,575
y 4 5.476.005.75
y 5 11,121,681 ton7,669,000 ton8,790,666 ton
y 6 28,387,415 ton40,493,902 ton34,116,212 ton
y 7 3.24 Kg5.20 Kg5.00 Kg
y 8 36,00063,90057,365
y 9 51,09364,31567,839
Table 5. Accuracy of estimated input–output relationships.
IDTraining SetTest SetInput Data
y 1 ( t ) 520,000 (0.34%)1,190,000 (0.76%) x 1 ( t ) ,   x 1 ( t 1 ) , x 4 ( t ) ,   x 5 ( t ) ,   x 5 ( t 1 )
y 2 ( t ) 36,505 (3.67%)84,495 (8.50%) x 1 ( t ) , x 2 ( t ) , x 4 ( t ) , x 6 ( t ) , y 2 ( t 1 )
y 3 ( t ) 89,870 (1.36%)67,773 (1.02%) x 1 ( t 1 ) , x 2 ( t 1 ) , x 3 ( t 1 ) ,   x 4 ( t ) , x 5 ( t ) ,   x 7 ( t 1 )
  y 4 ( t ) 0.017 (0.31%)0.146 (2.55%) x 1 ( t ) ,   x 1 ( t 1 ) ,   x 4 ( t 1 ) , x 7 ( t 1 )
y 5 ( t ) 155,060 (1.78%)180,780 (2.08%) x 1 ( t ) , x 1 ( t 1 ) , x 3 ( t ) , x 5 ( t )
y 6 ( t ) 771,390 (2.25%)871,610 (2.54%) x 1 ( t 1 ) , x 3 ( t ) , x 5 ( t ) , x 7 ( t )
y 7 ( t ) 0.043 (0.93%)0.174 (3.72%) x 2 ( t ) ,   x 6 ( t 1 ) ,   x 7 ( t )
y 8 ( t ) 854 (1.26%)1032 (1.52%) x 1 ( t 1 ) , x 2 ( t ) , x 2 ( t 1 ) , x 6 ( t 1 ) , x 7 ( t 2 ) , y 8 ( t 1 )
y 9 ( t ) 1921 (2.80%)4704 (6.87%) x 2 ( t ) , x 2 ( t 1 ) , x 3 ( t ) , x 3 ( t 1 )
Table 6. Real and predicted key performance indicator (KPI) values (2014).
VariableValueKPIReal ValuePredicted ValuePercentage Error
x 1 19,648,323 y 1 168,000,000168,898,7080.53%
x 2 13,580 y 2 2,396,4662,479,4353.46%
x 3 1,976,631 y 3 7,762,9117,910,3481.90%
x 4 1,402,373 y 4 6.26.0−2.73%
x 5 1,565,296 y 5 7,701,0007,843,3901.85%
x 6 315 y 6 48,462,00249,507,7892.16%
x 7 556 y 7 5.55.2−5.39%
y 8 64,10065,0141.43%
y 9 66,32769,7285.13%
Table 7. Real and predicted KPI values (2015).
VariableValueKPIReal ValuePredicted ValuePercentage Error
x 1 19,648,323 y 1 161,000,000162,199,6710.75%
x 2 13,580 y 2 1,764,3001,863,1155.60%
x 3 1,976,631 y 3 8,135,8788,072,477−0.78%
x 4 1,402,373   y 4 6.06.12.14%
x 5 1,565,296 y 5 7,669,0007,826,9692.06%
x 6 315 y 6 40,493,90241,902,9393.48%
x 7 556 y 7 5.25.55.47%
y 8 63,90062,868−1.61%
y 9 64,31568,0815.86%

