Article

Long-Range Behaviour and Correlation in DFA and DCCA Analysis of Cryptocurrencies

1
Instituto Politécnico de Portalegre, 7300-100 Portalegre, Portugal
2
VALORIZA—Research Center for Endogenous Resource Valorization, 7300-555 Portalegre, Portugal
3
CEFAGE-UE, IIFA, Universidade de Évora, Largo dos Colegiais 2, 7000 Évora, Portugal
*
Author to whom correspondence should be addressed.
Int. J. Financial Stud. 2019, 7(3), 51; https://doi.org/10.3390/ijfs7030051
Submission received: 25 June 2019 / Revised: 10 September 2019 / Accepted: 11 September 2019 / Published: 15 September 2019
(This article belongs to the Special Issue Econophysics Applications to Financial Markets)

Abstract

:
In recent years, increasing attention has been devoted to cryptocurrencies, owing to their great development and valorization. In this study, we propose to analyse four of the major cryptocurrencies, based on their market capitalization and data availability: Bitcoin, Ethereum, Ripple, and Litecoin. We apply detrended fluctuation analysis (the regular one and with a sliding windows approach) and detrended cross-correlation analysis and the respective correlation coefficient. We find that Bitcoin and Ripple seem to behave as efficient financial assets, while Ethereum and Litecoin present some evidence of persistence. When correlating Bitcoin with the other cryptocurrencies under analysis, we find that for short time scales, all the cryptocurrencies have statistically significant correlations with Bitcoin, although Ripple has the highest correlations. For higher time scales, Ripple is the only cryptocurrency with significant correlation.

1. Introduction

Technological advances introduce new financial products and services to the market, as well as new investment possibilities, with the emergence of new investors who seek the possibility of increasing their income through new technologies. One of the new markets emerging in recent years is that of virtual currencies, also known as cryptocurrencies. Although a new investment market, it promises to revolutionize the currency market, at the same time as meeting its investors’ return needs.
The rapid development of cryptocurrencies has also attracted researchers’ attention, with an increasing body of literature on this issue (see Urquhart 2018 or Corbet et al. 2018, among others). Besides studies devoted to analysis of the evolution of cryptocurrencies’ prices and/or returns, which will be dealt with in the next section, other studies analyse different issues, ranging from the regulation of cryptocurrencies (see, for example, Chaffee 2018 or Li et al. 2019) to the possible links to illicit activities (see van Wegberg et al. 2018 or Campbell-Verduyn 2018).
In this paper, we apply two different techniques (detrended fluctuation analysis (DFA) and detrended cross-correlation analysis (DCCA)) aiming to analyse the fluctuations of the main cryptocurrencies’ prices. We choose to analyse the behaviour of Bitcoin, Ethereum, Ripple, and Litecoin, because they are among the cryptocurrencies with greater capitalization and are also among those with greater data availability.
We start by analysing the existence of dependence in each of the individual time series with the simple DFA. With this technique, we can evaluate the dependence of a given time series as a whole. Transposing the analysis to a financial time series, we can see whether there is support for the efficient market hypothesis. As the cryptocurrency market has evolved very quickly, however, it is useful to analyse whether dependence has also evolved over time. With this objective, we also develop a sliding windows approach for the DFA, and can thus see whether or not the four cryptocurrencies studied are now nearer to the efficient pattern.
The main motivation of the paper is to understand the evolution of dependence in the main cryptocurrencies over time and understand if, after the fall in the price of cryptocurrencies at the end of 2017, some changes occurred. In particular, as we employ a sliding windows approach, we can evaluate whether that price shock changed the pattern of efficiency of the cryptocurrencies analysed. Finally, with the application of DCCA and its correlation coefficient, we can evaluate the correlation between cryptocurrencies, with the advantage of getting results for different time scales (in this case, we correlate Bitcoin with the others). This paper will contribute to the existing literature not only by extending analysis of the major cryptocurrencies, but also by conducting a dynamic analysis of efficiency, which could help in the continuous monitoring of this property for these assets.
Our main results point to some evidence of efficiency of Bitcoin and Ripple, although after the decrease in price at the end of 2017, all cryptocurrencies show evidence of persistence. We also found that in the short run, Ripple, Ethereum, and Litecoin are correlated with Bitcoin, but in the long run, only the first shows a significant correlation.
The remainder of the paper is organized as follows: Section 2 presents a brief literature review about the issues under analysis; Section 3 explains the data and the methodologies used in this work; Section 4 presents the results; and Section 5 concludes.

2. Brief Literature Review

According to the Bank for International Settlements (2015), cryptocurrencies are forms of virtual money, which rely on cryptographic methods to ensure the creation and distribution of value in a secure way, through a network of computers. Cryptocurrencies, rather than relying on a centralized bank or monetary authority, depend on encryption, algorithms, and peer-to-peer technologies to allow users to safely transfer money without going through any intermediary. The first decentralized cryptocurrency appeared in 2009, named Bitcoin, and since then, more than 500 cryptocurrencies have been developed.
On the basis of total market capitalization and data availability, we chose to analyse four of the major cryptocurrencies: Bitcoin, Ethereum, Ripple, and Litecoin. We started by analysing the dependence of those time series, which is associated with the concept of market efficiency, the very well-known concept of Fama (1970) and his efficient market hypothesis (EMH). According to the author, an efficient market is one in which prices reflect all the available information of a given asset, with it not being possible to predict any future price based on historical information, that is, market prices are unpredictable and random.
Despite identification of the EMH by Fama, the notion that stock prices have a random behaviour was not new; in the 19th century, a French economist worked with stochastic models of price (Jovanovic and Gall 2001) and, in 1900, Bachelier concluded that the prices of French government bonds were also random variables (Bachelier [1900] 1964). From then on, and until the identification of the EMH by Fama, many other researchers investigated price movements in financial markets, supporting the possibility of randomness (see, for example, Osborne 1959, 1962; Granger and Morgenstern 1963; and Samuelson 1965, among others). However, some work identified the possibility of some inconsistency with the random walk, finding some stylized facts in financial data such as leptokurcity or volatility clustering (Mandelbrot 1963; Mandelbrot and Wallis 1969).
The EMH presented by Fama (1970) became a cornerstone of empirical and theoretical finance, with some discussion and controversy in the financial literature, namely the use of martingales rather than random walks to explain prices, because martingales are less restrictive models, only requiring that the first moment of returns is independent from the available information. Higher moments might still be predictable using past information, but this feature does not necessarily imply non-validation of the EMH, meaning that non-linearities and time dependence could be identified without non-verification of the EMH (Andreou et al. 2001; McCauley et al. 2008).
Our objective is not to make an extensive review of the EMH, given the vast number of studies about this topic in the literature. For example, Yen and Lee (2008) identified that most studies support the EMH, despite some contradictory results.
In the specific case of cryptocurrencies, some work is devoted to analysing the efficiency of this particular market, such as the studies by Urquhart (2016), Bariviera (2017), Nadarajah and Chu (2017), or Tiwari et al. (2018). Generally, these authors find that cryptocurrencies do not follow the EMH. Recently, there has been some evidence of increased efficiency in this particular market (Khuntia and Pattanayak 2018).
The analysis of efficiency in cryptocurrencies is contained in an increasing body of literature on this particular type of asset, with Kyriazis (2019) making a very comprehensive survey. In the diversity of studies, several papers use fractal methodologies. For example, Urquhart (2016), Bariviera (2017), Bariviera et al. (2017), Tiwari et al. (2018), or Zhang et al. (2018a, 2018b) and Zhang et al. (2019) also used DFA, while Lahmiri and Bekiros (2018) used a multifractal modification of DFA. Estimation of Hurst exponents, with methods other than DFA, is carried out by Jiang et al. (2018) and Zhang et al. (2019) (also using a sliding windows approach) and Köchling et al. (2018) (jointly with other methodologies). El Alaoui et al. (2018) also used multifractality, but with DCCA. Generally, those studies conclude that cryptocurrencies are inefficient, although in some cases, that inefficiency decreases over time.
Another type of study in financial markets is the analysis of correlation between financial assets. In the beginning, correlation analysis used essentially linear approaches, but with the development of methodologies and the evolution of computational capacity, other different approaches were created, such as the one that will be used here. Regarding the particular case of the cryptocurrency market, Antonakakis et al. (2019) and Silva et al. (2019) are some examples of studies analysing the behaviour between different cryptocurrencies.
A final note, which is important when we are analysing the EMH, is that despite finding deviations from the expected behaviour of prices, regardless of considering random walks or martingales, no study is known to confirm rejection of the EMH. This is an important note because even in the presence of some kind of dependence, we cannot infer directly that investors could obtain systematically abnormal profits.

3. Methodology and Data
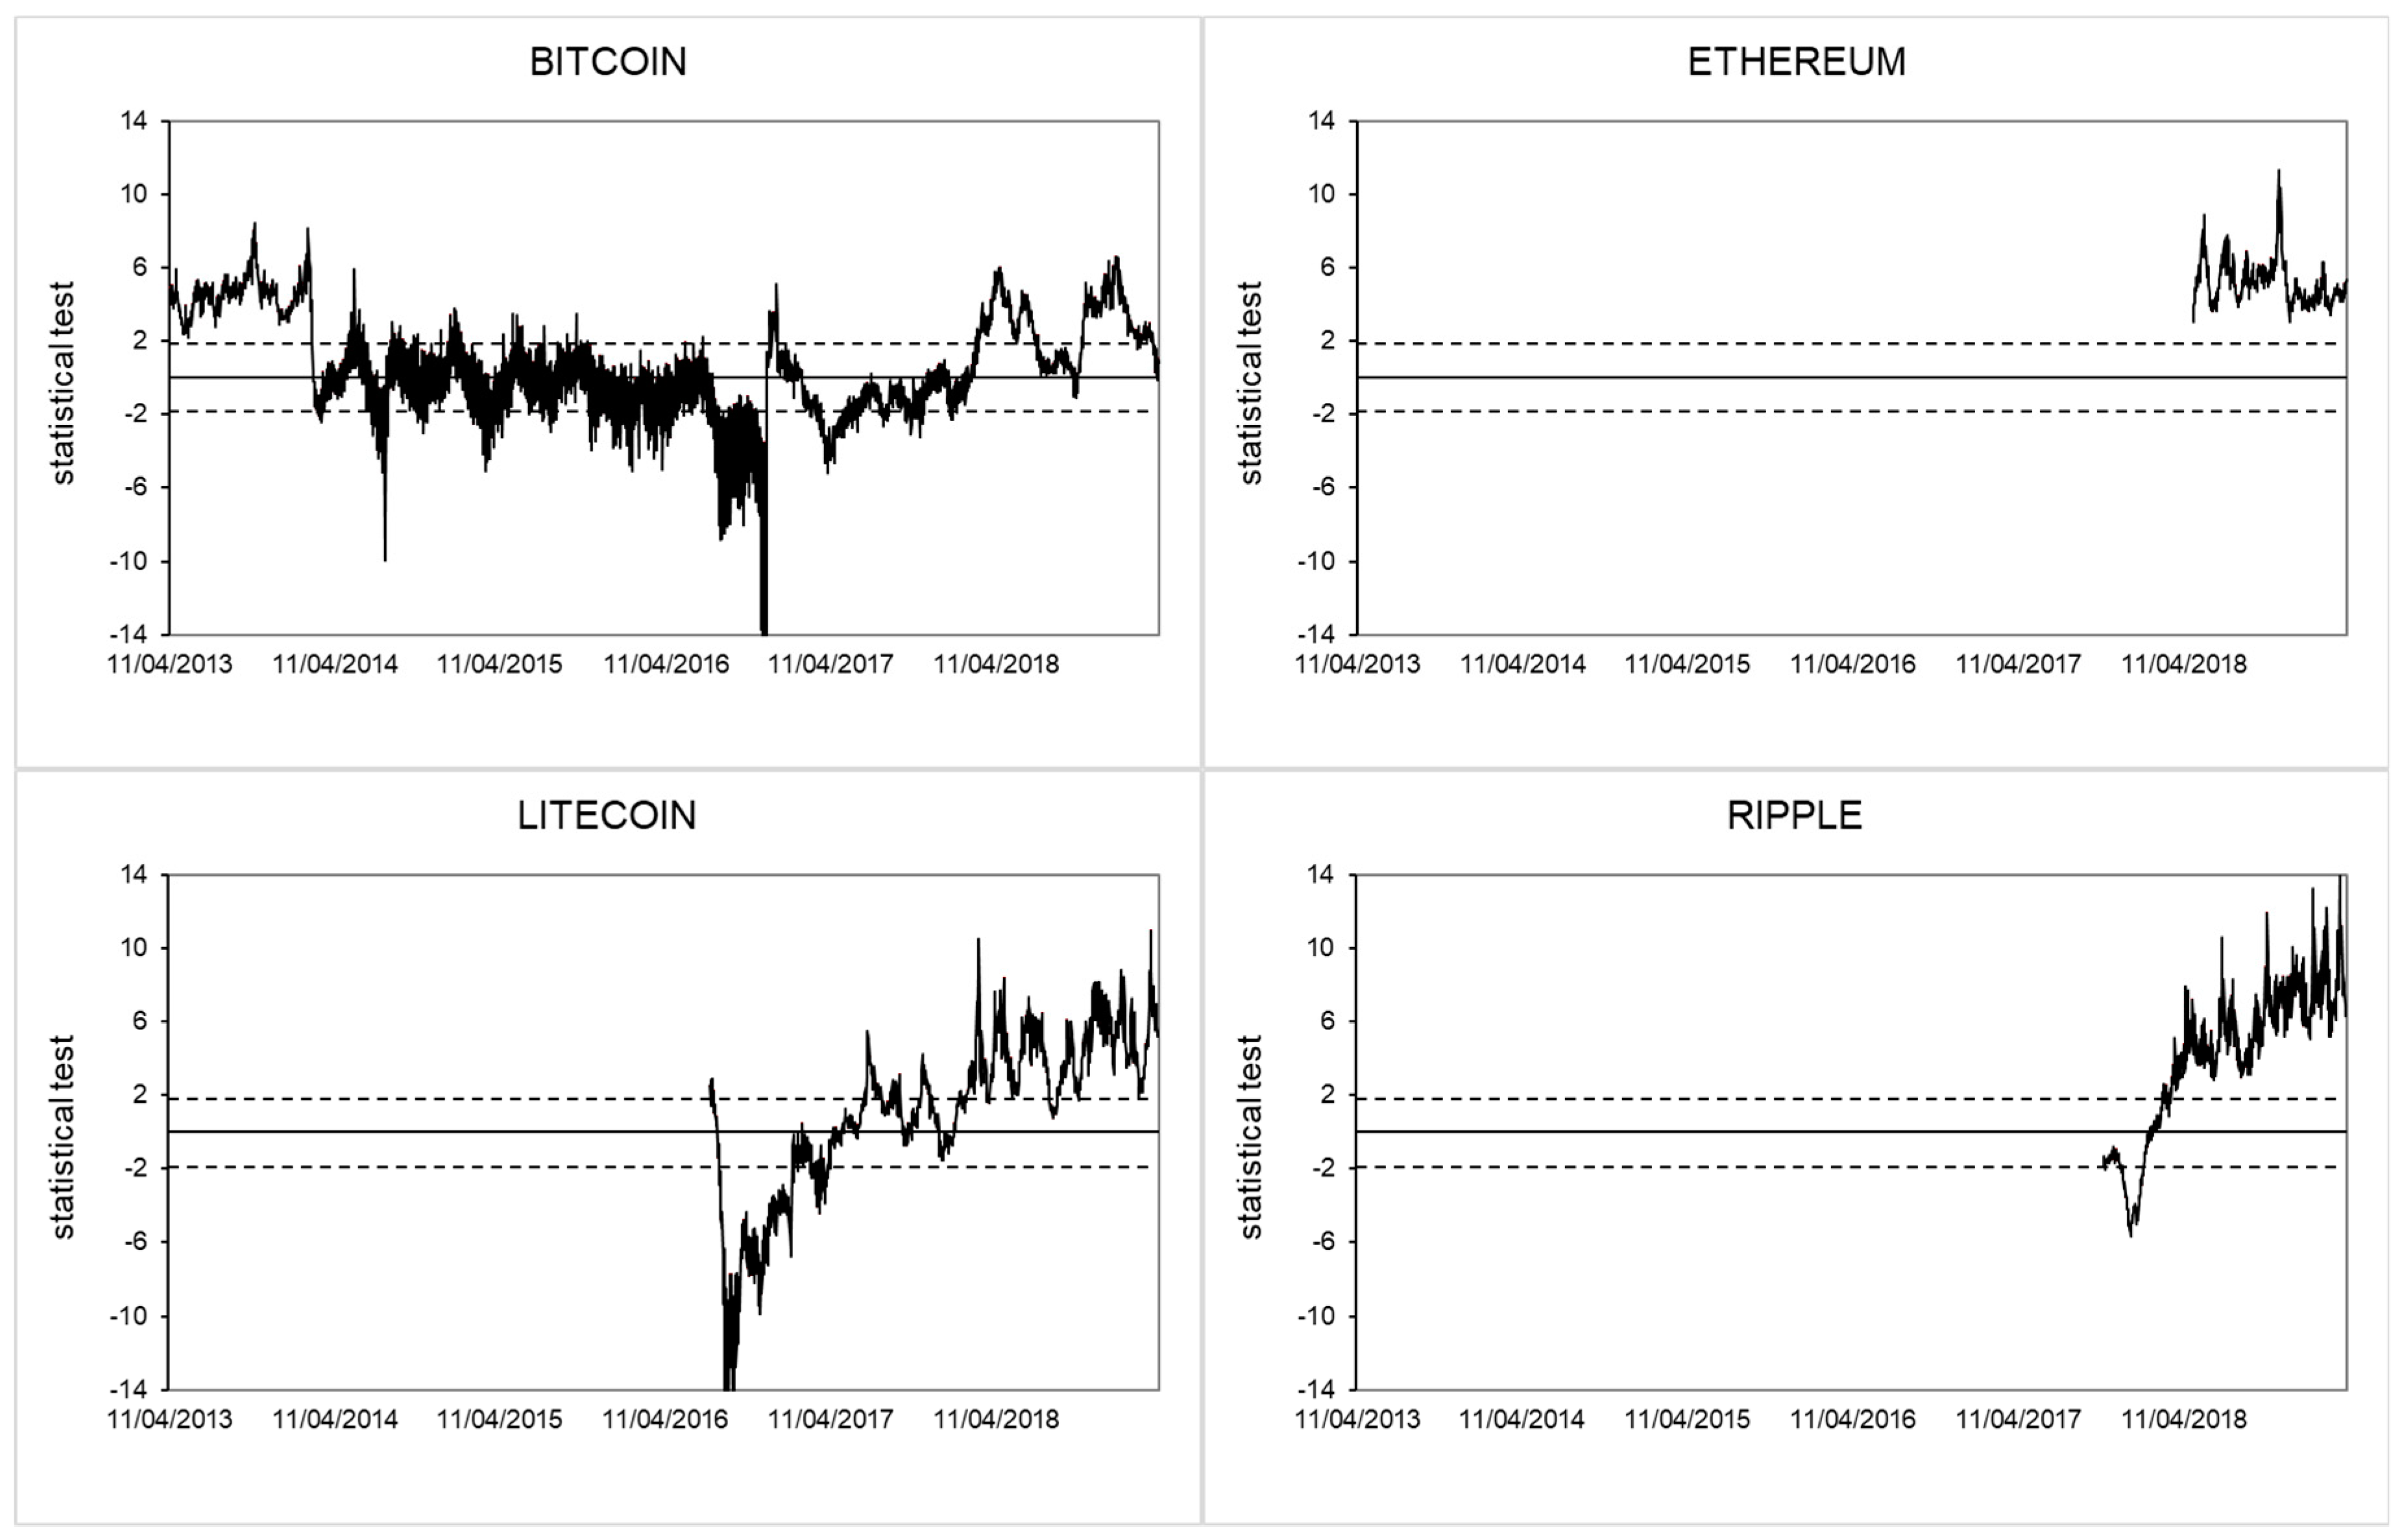
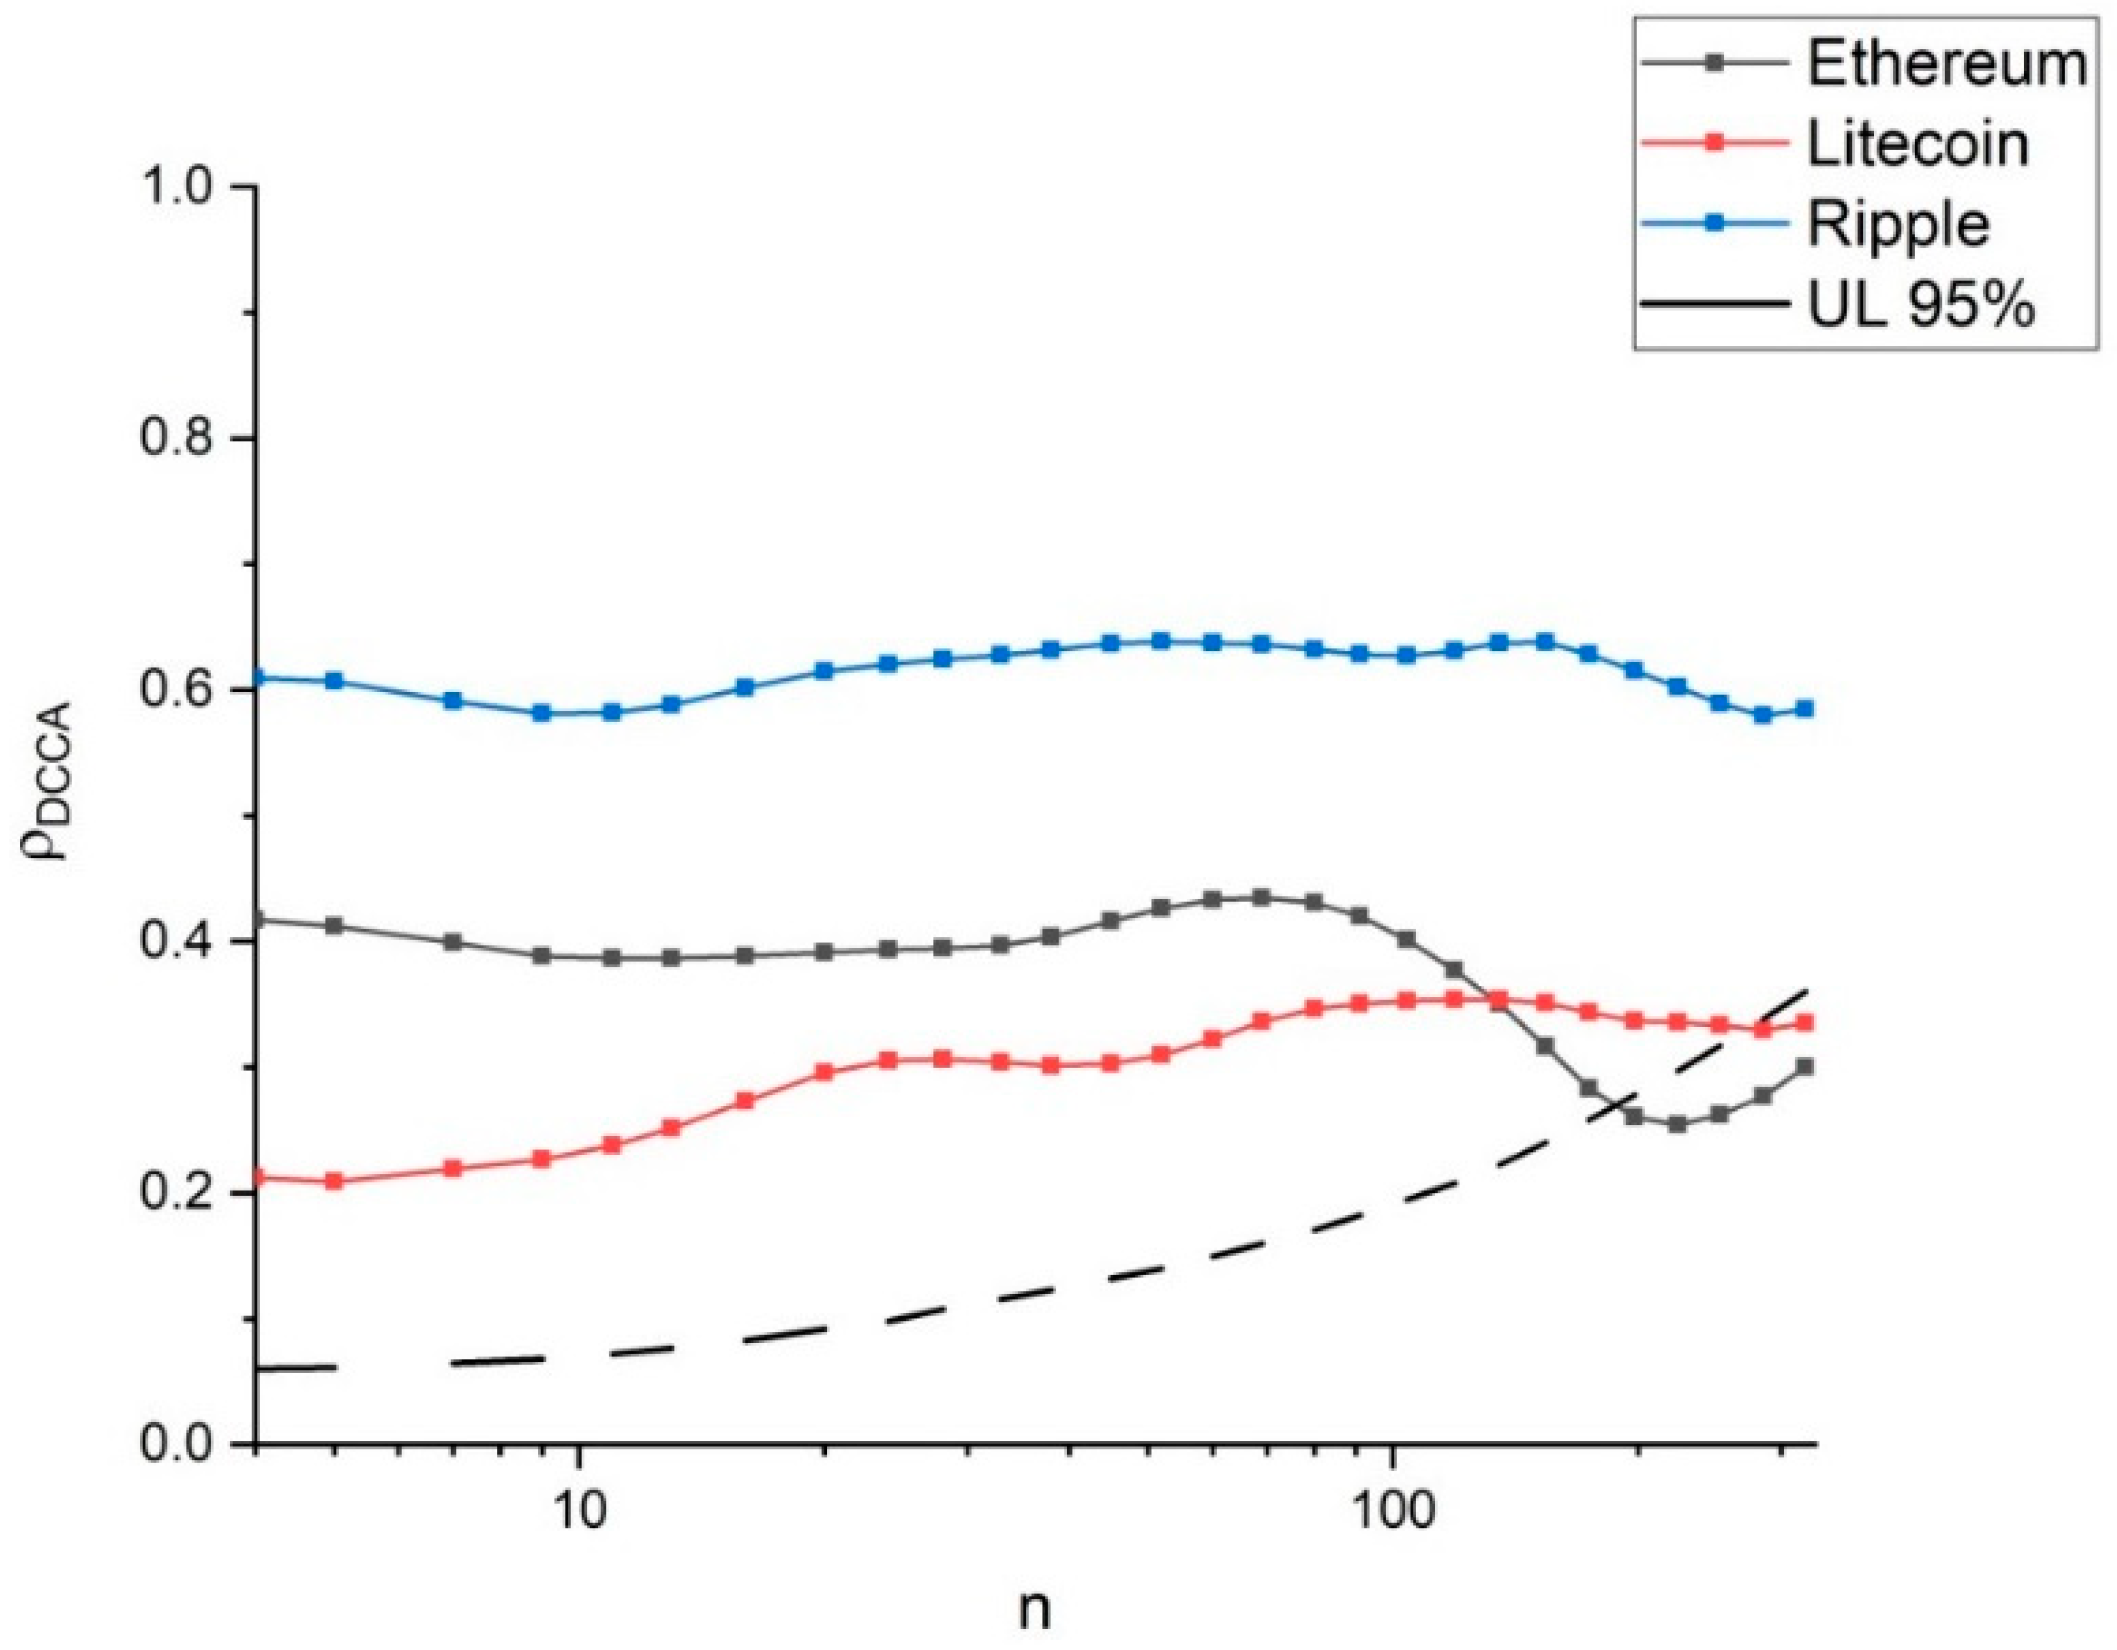
The cryptocurrency market can be considered as a new economic and financial instrument (Bartos 2015). As such, and as it involves several agents and sources of uncertainty, it could be considered as a complex system. Owing to that complexity, associated with possible non-linearity, the use of conventional methods might not be adequate, and methods related to Econophysics could give a better explanation of variables (Chakrabarti et al. 2006).
Aiming to assess the multi-scale autocorrelation of each individual cryptocurrency, we use detrended fluctuation analysis (DFA), proposed by Peng et al. (1994). Originally used to study natural phenomena (besides the original work, see (Peng et al. 1995)), it has also been used in financial markets. Because it can measure the dependence of a given time series, it could be used to analyse the possible confirmation of the EMH. On the basis of a given time series x t of length N, DFA starts by integrating the time series, that is, calculating
X t = i = 1 t ( x i x ) ,
where 〈x〉 is the observed mean value. X t is the cumulative sum or profile of the original time series, which is then divided into time windows of length n. On those windows, ordinary least squares are used to calculate the local trend and, after detrending Equation (1) with the calculated trend, allow us to obtain the fluctuation function given by the following:
F ( n ) = 1 N t = 1 N ( X t X ˜ t ) 2 ,
where X ˜ t is the trend. The process is repeated for the different window sizes of dimension n, and the log–log relationship between F(n) and n is a power-law equal to F ( n ) n α , where the α exponent is the relevant parameter to obtain, and could be interpreted as follows: an α = 0.5 indicates that the time series could be described by a random walk (in this case, meaning that the given financial market could be considered as efficient); if 0.5 < α < 1, a positive long-range dependence exists in the time series, that is, it has persistent behaviour; if α < 0.5, this indicates the existence of negative long-range dependence (the time series is anti-persistent). A value of α = 1 identifies a pink noise and α > 1 indicates that the long-range dependence is not explained by a power law, but these two results are not usually found in financial time series.
As previously mentioned, DFA has already been used in financial data, for example, in the work of Cao and Zhang (2015), Anagnostidis et al. (2016), or Ferreira et al. (2017), to identify only some recent work. Even in the case of cryptocurrencies, we have the examples of the work by Al-Yahyaee et al. (2018), Zhang et al. (2018a, 2018b), or Alvarez-Ramirez et al. (2018).
As we also want to analyse the evolution of the DFA exponent, we apply a sliding windows approach. In this case, we transform our whole sample in sequential samples of 1000 observations, that is, starting by calculating the DFA for the sample from t = 1, …, 1000; then for t = 2, …, 1001; and so on. The use of such windows sizes is a regular choice, and it is also usual to find this kind of approach in financial studies (see Carbone et al. 2004). In this case, we create a time series of α exponents, which allows us to assess the evolution of the dependence behaviour over time. Other studies applying this methodology to financial data are those by Cajueiro and Tabak (2004a, 2004b, 2006, 2008a, 2008b).
On the basis of these time series, we apply the efficiency index (EI) defined by Kristoufek and Vosvrda (2013), and given by
E I = i = 1 N ( M i M * R i ) 2 ,
where Mi is each of the values for the DFA exponent, M* is the expected value for market efficiency (0.5 in the case of DFA), and Ri the range of the measure (in the case of DFA, equal to 1). Calculating the EI, we have the most efficient asset as the one with the lowest value.
To analyse the correlation between Bitcoin and the other major cryptocurrencies, we will use detrended cross-correlation analysis (DCCA). Proposed by Podobnik and Stanley (2008), DCCA has some similarities with the DFA, both in the properties (allowing evaluation of correlations for different time scales) and in the different steps. So, based on the original time series Xt and Yt, it starts by integrating both series, similarly to the procedure described in Equation (1). Series are also divided into time windows of length n, detrended based on the trend calculated by the ordinary least squares and used to calculate covariance of the residuals,
f D C C A 2 ( n ) = 1 n 1 k = i i + n ( x k x ˜ k ) ( y k y ˜ k ) ,
which are the basis for calculating the detrended covariance given by
F D C C A 2 ( n ) = 1 N n i = 1 N n f D C C A 2 .
The process is repeated for all length boxes and the DCCA exponent given by a power law. However, we are not using the DCCA exponent. As we are interested in measuring the degree of the relationship, we apply the correlation coefficient created by Zebende (2011) and given by
ρ D C C A = F D C C A 2 F D F A { x } F D F A { y } .
This correlation coefficient combines DFA and DCCA to have a coefficient with the desired properties, among others, being efficient and ranging between −1 and 1 (see Kristoufek 2014 and Zhao et al. 2017). Some applications of this technique in finance are found, for example, in Ferreira and Dionísio (2015), Ferreira et al. (2016, 2019), or Pereira et al. (2018). We test the significance of the correlations by applying the procedure proposed by Podobnik et al. (2011).
As previously mentioned, we analyse the behaviour of Bitcoin, Ethereum, Ripple, and Litecoin, owing to their great capitalization at the moment of data retrieval, but also based on data availability, according to the website https://coinmarketcap.com. Table 1 describes the information analysed.
The sample we use is different for each of the four cryptocurrencies under analysis, and is obtained according to availability, because each cryptocurrency has a different date of creation. Although many other cryptocurrencies have available data, as we use a sliding windows approach (with windows of 1000 observations), we need samples that allow us not only to reach the size of the window, but also to ensure that we will have sufficient results to analyse the evolution of the DFA exponents. Therefore, we fixed the starting day of the analysis as August 2015, in order to also use the information for Ethereum, and allow the analysis of three other major cryptocurrencies.

4. Results

Figure 1 shows the evolution of the prices of the cryptocurrencies under analysis. Prices are seen to reach a peak at the end of 2017/beginning of 2018. On the basis of those prices, we calculated the logarithmic returns, with Table 2 showing the respective descriptive statistics. All the cryptocurrencies increased their values, with Bitcoin attaining the highest mean. Minimum and maximum values show that extreme changes occurred, with three of the four cryptocurrencies showing positive skewness, that is, with higher returns more frequent than lower returns. The exception was Ethereum, which shows a negative skew, in this case meaning that negative returns are more frequent. The fact that this is the newest cryptocurrency in the study could explain this result, as it reached the fall in price in this market more quickly. Finally, all the currencies show very high kurtosis values, meaning they have leptokurtic distributions, which is a common stylized fact in financial markets.
We continue our analysis by applying the DFA to the whole sample of each cryptocurrency (Table 3). Analysing the exponents, we can conclude that, for the whole sample, Bitcoin and Ethereum showed a positive long-range correlation (0.5 < α < 1), while Ripple and Litecoin presented a negative long-range correlation (α < 0.5), although in the case of Ripple, it is very near to the 0.5 level. Analysing the available sample, Ripple seems to be the most efficient cryptocurrency, followed by Bitcoin, while Ethereum and Litecoin are more distant from that pattern.
The previous exponents identify the dependence of the whole time series, but aiming to analyse that dependence dynamically, we performed a sliding windows DFA, based on windows of 1000 observations. With this analysis, we are able to understand the evolution of those exponents over time.
The results presented in Figure 2, where black lines represent the evolution of the DFA exponents over time and red bars the standard deviations of the DFA estimations, are interesting. Firstly, the fact that Bitcoin, during a significant part of the sample, has DFA exponents around the 0.5 level, while this does not happen with any of the other cryptocurrencies. In fact, Ethereum always has a persistent behaviour, while Litecoin and Ripple passed from an anti-persistent behaviour to a persistent one. The most interesting feature is that in the final part of the sample, after the drop in cryptocurrency prices, most of the exponents are positive.
Application of the efficiency index (EI), with the results presented in Table 4, allows us to conclude that Litecoin and Ethereum are the least efficient cryptocurrencies, as they have the highest EI levels, while Bitcoin and Ripple have relatively similar results, although with a slight advantage for Bitcoin.
Still based on the DFA exponents, we use the methodology of Ferreira (2018) to analyse the significance of the Hurst exponents. On the basis of the estimations of the Hurst exponents and the standard deviations (given by α ˜ and s . d . ( α ˜ ) , respectively), the statistic test of t = α ˜ 0.5 s . d . ( α ˜ ) allows us to test the hypothesis of each parameter being equal to 0.5. The results are presented in Figure 3, where dashed lines represent the critical values, meaning that if the statistic is inside those bands, the hypothesis of an exponent equal to 0.5 is not rejected. The results allow us to conclude that Bitcoin seems to have an efficient behaviour during most of the sample, although at the end of the sample, there is less evidence. For the remaining cryptocurrencies, the test confirms the idea of inefficiency, at least when compared with Bitcoin (although Litecoin, during part of the sample, has statistical values under the dashed lines).
We conclude our statistical analysis by applying the DCCA correlation coefficient between Bitcoin and the other cryptocurrencies, with the results presented in Figure 4. Ripple has the highest correlation with Bitcoin, with a significant level over all the time scales. For shorter time scales, Ethereum has higher correlation than Litecoin, but around the time scale of 100 days, that position changes, and for about 110 days, the correlations are no longer significant, meaning that in the long term, those cryptocurrencies are not significantly correlated with Bitcoin.
Here, we would like to make a comparison with the results of Zhang et al. (2019), who also measured the Hurst exponent of the same four cryptocurrencies with a sliding windows approach, but using high frequency intraday data. Considering the dependence levels, the main difference in that study is that Ethereum and Bitcoin show similar patterns. The fact that the total sample is smaller (the dataset is just for part of 2017) and the use of high frequency data could justify the differences, all the more so because the authors clearly identify that for short time windows, the cryptocurrencies seem to be efficient.
Also for the correlation pattern, the study by Zhang et al. (2019) shows different results, identifying some differences, namely a stronger connection between Ethereum and Bitcoin. Besides the already mentioned difference of sample and type of data, in this particular case, the authors use the Pearson correlation, while in our study, we use a different correlation measure, which is more general and measures not only linear, but also non-linear correlations.

5. Concluding Remarks

We proposed to analyse the major cryptocurrencies, according to their market capitalization, using different methodologies. The use of DFA, specifically the sliding windows approach, allows us to identify the evolution of dependence of each of the cryptocurrencies over time, which could be related with the efficiency of those assets. In addition, the use of DCCA, as proposed, identifies how Ethereum, Litecoin, and Ripple correlate with Bitcoin. For a better understanding of our conclusions, we split our final section into three sub-sections.

5.1. Main Conclusions

The analysis of DFA and the use of sliding windows allow us to draw conclusions about the evolution of the dependence of the cryptocurrencies studied. One of the findings of our study is that Bitcoin seems to be the most efficient cryptocurrency. This is not a surprising result, as it is in line with previous studies, but also because Bitcoin is the most mature cryptocurrency. In fact, although currently having a higher market capitalization, the other cryptocurrencies are younger. Their lack of maturity compared with Bitcoin could help to explain these results.
Still regarding the results of DFA, it is interesting to note that at the end of 2017, Bitcoin’s pattern of dependence changed, moving to persistent behaviour (despite some recovery at the end of the sample). The sharp decrease in prices at the end of 2017 could have caused market instability. Interestingly, Litecoin and Ripple also had the same increase in persistence, showing that those cryptocurrencies had the same effect. In the case of Ethereum, the whole sample shows the same persistent pattern. The smaller sample and the window size used could explain this result.
Regarding the correlations, all the cryptocurrencies studied are correlated with Bitcoin, with Ripple presenting the strongest correlation. However, the significance levels are different considering the different time scales. While for short time scales, the correlations are all significant (despite Litecoin having relatively low correlation levels), for long time scales, the only significant correlations are those of Ripple. So in the long run, it is possible to conclude that Litecoin and Ethereum are not correlated with Bitcoin.

5.2. Potential Implications for Markets and Investors

The evidence of dependence in the different cryptocurrencies could have practical implications for how markets work, as dependencies could raise the possibility of some kind of predictability. The existence of persistence, meaning that a given outcome is more likely to occur in the following period, could provide some information for market agents. Moreover, the fact that some cryptocurrencies could have a higher signal of inefficiency could also give information about where to make investments, if wanting to focus on the cryptocurrency market.
Despite the apparent evidence of inefficiency, and as previously identified, some caution is necessary, as this might not necessarily mean a capacity for abnormal profits, because this depends on issues like liquidity or even transaction costs. Moreover, as also mentioned, the different cryptocurrencies are not at the same stage of maturity. Finally, the high recognition of Bitcoin compared with other cryptocurrencies should not be ignored. This together with the different degree of maturity could have implications, for example, for liquidity.
Regarding the results of the correlations, it is important to identify firstly the connection of the different cryptocurrencies to Bitcoin. Although to different degrees, and while the correlation is higher in the short run, the connection between those assets is important for agents’ investment decisions. Further, if in the short run, the correlations are significant, in some cases in the long run, they are not, which could be used for diversification purposes, if the option is to invest in this particular market.

5.3. Limitations and Future Research

Despite the interesting results, the main limitation of this study is the reduced size of the sample of some cryptocurrencies. This happens because some of the cryptocurrencies analysed are relatively recent in the market (and other unused ones have fewer observations). Following the apparent success of this new financial market, many new cryptocurrencies appear and, for the newer ones, some immaturity of the asset could lead to the existence of persistence in the market. These features should be taken into account and conclusions should be made cautiously.
Another limitation is the correlation approach, just in this particular market. As mentioned above, the existence of non-significant correlations could be used for diversification purposes, although this is true only in this particular market. Obviously, if the objective is to analyse the possibility of diversification with other assets, the analysis should be deepened and should include those assets, this being a possibility for future research. Continuous monitoring of the DFA exponents could also be used in the future to analyse the possibility of predicting other price bubbles. Finally, the use of high frequency data could also be used to extend the kind of analysis made, for example, by Zhang et al. (2019).

Author Contributions

Conceptualization, N.C., C.S., and P.F.; Formal analysis, N.C., C.S., and P.F.; Methodology, N.C., C.S., and P.F.; Software, N.C., C.S., and P.F.; Writing—original draft, N.C., C.S., and P.F.; Writing—review & editing, N.C., C.S., and P.F.

Funding

This research received no external funding.

Conflicts of Interest

The authors declare no conflict of interest.

References

  1. Alvarez-Ramirez, José, Eduardo Rodriguez, and Carlos Ibarra-Valdez. 2018. Long-range correlations and asymmetry in the Bitcoin market. Physica A 492: 948–55. [Google Scholar] [CrossRef]
  2. Al-Yahyaee, Khamis, Walid Mensi, and Seong-Min Yoon. 2018. Efficiency, multifractality, and the long-memory property of the Bitcoin market: A comparative analysis with stock, currency, and gold markets. Finance Research Letters 27: 228–34. [Google Scholar] [CrossRef]
  3. Anagnostidis, Panagiotis, Christos Varsakelis, and Christos Emmanouilides. 2016. Has the 2008 financial crisis affected stock market efficiency? The case of Eurozone. Physica A 447: 116–28. [Google Scholar] [CrossRef]
  4. Andreou Elena, Nikitas Pittis, and Aris Spanos. 2001. On modelling speculative prices: The empirical literature. Journal of Economic Surveys 15: 187–220. [Google Scholar] [CrossRef]
  5. Antonakakis, Nikolaos, Ioannis Chatziantoniou, and David Gabauer. 2019. Cryptocurrency market contagion: Market uncertainty, market complexity, and dynamic portfolios. Journal of International Financial Markets, Institutions and Money 61: 37–51. [Google Scholar] [CrossRef] [Green Version]
  6. Bachelier, Louis. 1964. Theory of speculation. In The Random Character of Stock Prices. Edited by Paul Cootner. Cambridge: MIT Press. First published 1900. [Google Scholar]
  7. Bank for International Settlements. 2015. Digital Currencies. S.L.: Committee on Payments and Market Infrastructures. Basel: Bank for International Settlements. [Google Scholar]
  8. Bariviera, Aurelio. 2017. The inefficiency of Bitcoin revisited: A dynamic approach. Economics Letters 161: 1–4. [Google Scholar] [CrossRef] [Green Version]
  9. Bariviera, Aurelio, María José Basgall, Waldo Hasperué, and Marcelo Naiouf. 2017. Some stylized facts of the Bitcoin market. Physica A: Statistical Mechanics and Its Applications 484: 82–90. [Google Scholar] [CrossRef] [Green Version]
  10. Bartos, Jakub. 2015. Does Bitcoin follow the hypothesis of efficient market? International Journal of Economic Sciences IV: 10–23. [Google Scholar] [CrossRef]
  11. Cajueiro, Daniel, and Benjamin Tabak. 2004a. The Hurst exponent over time: Testing the assertion that emerging markets are becoming more efficient. Physica A 336: 521–37. [Google Scholar] [CrossRef]
  12. Cajueiro, Daniel, and Benjamin Tabak. 2004b. Evidence of long range dependence in Asian equity markets: The role of liquidity and market restrictions. Physica A 342: 656–64. [Google Scholar] [CrossRef]
  13. Cajueiro, Daniel, and Benjamin Tabak. 2006. Testing for predictability in equity returns for European transition markets. Economic Systems 30: 56–78. [Google Scholar] [CrossRef]
  14. Cajueiro, Daniel, and Benjamin Tabak. 2008a. Testing for long-range dependence in world stock markets. Chaos, Solitons & Fractals 37: 918–27. [Google Scholar]
  15. Cajueiro, Daniel, and Benjamin Tabak. 2008b. Testing for time-varying long-range dependence in real estate equity returns. Chaos, Solitons & Fractals 38: 293–307. [Google Scholar]
  16. Campbell-Verduyn, Malcolm. 2018. Bitcoin, crypto-coins, and global anti-money laundering governance. Crime, Law and Social Change 69: 283–305. [Google Scholar] [CrossRef]
  17. Cao, Guangxi, and Minjia Zhang. 2015. Extreme values in the Chinese and American stock markets based on detrended fluctuation analysis. Physica A 436: 25–35. [Google Scholar] [CrossRef]
  18. Carbone Anna, Giuliano Castelli, and Harry Stanley. 2004. Time dependent Hurst exponent in financial time series. Physica A 344: 267–71. [Google Scholar] [CrossRef]
  19. Chaffee, Eric. 2018. The Heavy Burden of Thin Regulation: Lessons Learned from the SEC’s Regulation of Cryptocurrencies. Mercer Law Review 70: 615. [Google Scholar]
  20. Chakrabarti, Bikas, Anirban Chakraborti, and Arnab Chatterjee. 2006. Econophysics and Sociophysics: Trends and Perspectives. Weinheim: Wiley-VCH Verlag. [Google Scholar]
  21. Corbet, Shaen, Brian Lucey, Andrew Urquhart, and Larisa Yarovaya. 2018. Cryptocurrencies as a financial asset: A systematic analysis. International Review of Financial Analysis 62: 182–99. [Google Scholar] [CrossRef]
  22. El Alaoui, Marwane, Elie Bouri, and David Roubaud. 2018. Bitcoin price–volume: A multifractal cross-correlation approach. Finance Research Letters. [Google Scholar] [CrossRef]
  23. Fama, Eugene. 1970. Efficient Capital Markets: A Review of Theory and Empirical Work. The Journal of Finance 25: 383–417. [Google Scholar] [CrossRef]
  24. Ferreira, Paulo. 2018. Dynamic long-range dependences in the Swiss stock market. Empirical Economics 2018: 1–33. [Google Scholar] [CrossRef]
  25. Ferreira, Paulo, and Andreia Dionísio. 2015. Revisiting covered interest parity in the European Union: The DCCA Approach. International Economic Journal 29: 597–615. [Google Scholar] [CrossRef]
  26. Ferreira, Paulo, Andreia Dionísio, and Gilney Zebende. 2016. Why does the Euro fail? The DCCA approach. Physica A 443: 543–54. [Google Scholar] [CrossRef]
  27. Ferreira, Paulo, Luís Loures, José Nunes, and Andreia Dionísio. 2017. The behaviour of share returns of football clubs: An econophysics approach. Physica A 472: 136–44. [Google Scholar] [CrossRef]
  28. Ferreira, Paulo, Éder Pereira, Marcus da Silva, and Hernane Pereira. 2019. Detrended correlation coefficients between oil and stock markets: The effect of the 2008 crisis. Physica A 517: 86–96. [Google Scholar] [CrossRef]
  29. Granger, Clive, and Oskar Morgenstern. 1963. Spectral analysis of New York stock market prices. Kyklos 16: 1–27. [Google Scholar] [CrossRef]
  30. Jiang, Yonghong, He Nie, and Weihua Ruan. 2018. Time-varying long-term memory in Bitcoin market. Finance Research Letters 25: 280–84. [Google Scholar] [CrossRef]
  31. Jovanovic, Franck, and Philippe Le Gall. 2001. Does God practice a random walk? The ‘financial physics’ of a nineteenth-century forerunner, Jules Regnault. European Journal of the History of Economic Thought 8: 332–62. [Google Scholar] [CrossRef]
  32. Khuntia, Sashikanta, and Jamini Pattanayak. 2018. Adaptive market hypothesis and evolving predictability of bitcoin. Economics Letters 167: 26–28. [Google Scholar] [CrossRef]
  33. Köchling, Gerrit, Janis Müller, and Peter N. Posch. 2018. Does the introduction of futures improve the efficiency of Bitcoin? Finance Research Letters 30: 367–70. [Google Scholar] [CrossRef]
  34. Kristoufek, Ladislav. 2014. Measuring correlations between non-stationary series with DCCA coefficient. Physica A 402: 291–98. [Google Scholar] [CrossRef]
  35. Kristoufek, Ladislav, and Miloslav Vosvrda. 2013. Measuring capital market efficiency: Global and local correlations structure. Physica A 392: 184–93. [Google Scholar] [CrossRef]
  36. Kyriazis, Nikolaos. 2019. A Survey on Efficiency and Profitable Trading Opportunities in Cryptocurrency Markets. Journal of Risk and Financial Management 12: 67. [Google Scholar] [CrossRef]
  37. Lahmiri, Selim, and Stelios Bekiros. 2018. Chaos, randomness and multi-fractality in Bitcoin market. Chaos, Solitons & Fractals 106: 28–34. [Google Scholar]
  38. Li, Yannan, Willy Susilo, Guomin Yang, Yong Yu, Xiaojiang Du, Dongxi Liu, and Nadra Guizani. 2019. Toward Privacy and Regulation in Blockchain-based Cryptocurrencies. IEEE Network, 1–70. [Google Scholar] [CrossRef]
  39. Mandelbrot, Benoit. 1963. The variation of certain speculative prices. The Journal of Business 36: 394–419. [Google Scholar] [CrossRef]
  40. Mandelbrot, Benoit, and James Wallis. 1969. Some long-run properties of geophysical records. Water Resources Research 5: 321–40. [Google Scholar] [CrossRef]
  41. McCauley, Joseph, Kevin Bassler, and Gemunu Gunaratne. 2008. Martingales, detrending data, and the efficient market hypothesis. Physica A 387: 202–16. [Google Scholar] [CrossRef]
  42. Nadarajah, Saralees, and Jeffrey Chu. 2017. On the inefficiency of Bitcoin. Economics Letters 150: 6–9. [Google Scholar] [CrossRef]
  43. Osborne, Martin. 1959. Brownian motion in the stock market. Operations Research 7: 145–73. [Google Scholar] [CrossRef]
  44. Osborne, Martin. 1962. Periodic structure in the Brownian motion of stock prices. Operations Research 10: 345–79. [Google Scholar] [CrossRef]
  45. Peng, Chung-Kang, Sergey Buldyrev, Shlomo Havlin, Michael Simons, Harry Eugene Stanley, and Ary Goldberger. 1994. Mosaic organization of DNA nucleotides. Physical Review 49: 1685. [Google Scholar] [CrossRef] [PubMed]
  46. Peng, Chung-Kang, Shlomo Havlin, Harry Stanley, and Ary Goldberger. 1995. Quantification of scaling exponents and crossover phenomena in nonstationary heartbeat time series. Chaos: An Interdisciplinary Journal of Nonlinear Science 49: 82–87. [Google Scholar] [CrossRef] [PubMed]
  47. Pereira Éder, Marcus da Silva, Ivan da Cunha Lima, and Hernane Pereira H. 2018. Trump’s Effect on stock markets: A multiscale approach. Physica A 512: 241–47. [Google Scholar] [CrossRef]
  48. Podobnik, Boris, and Harry Stanley. 2008. Detrended cross-correlation analysis: A new method for analyzing two non-stationary time series. Physical Review Letters 100: 084102. [Google Scholar] [CrossRef] [PubMed]
  49. Podobnik, Boris, Zhi-Qiang Jiang, Wei-Xing Zhou, and Harry Eugene Stanley. 2011. Statistical tests for powerlaw cross-correlated processes. Physical Review E 84: 066118. [Google Scholar] [CrossRef] [PubMed]
  50. Van Wegberg, Rolf, Jan-Jaap Oerlemans, and Oskar van Deventer. 2018. Bitcoin money laundering: Mixed results?: An explorative study on money laundering of cybercrime proceeds using bitcoin. Journal of Financial Crime 25: 419–35. [Google Scholar] [CrossRef]
  51. Samuelson, Paul. 1965. Proof that properly anticipated prices fluctuate randomly. Industrial Management Review 6: 41–49. [Google Scholar]
  52. Silva, Paulo, Marcelo Klotzle, Antonio Pinto, and Leonardo Gomes. 2019. Herding behavior and contagion in the cryptocurrency market. Journal of Behavioral and Experimental Finance 22: 41–50. [Google Scholar] [CrossRef]
  53. Tiwari, Aviral, Rabin Jana, Debojyoti Das, and David Roubaud. 2018. Informational efficiency of Bitcoin—An extension. Economics Letters 163: 106–9. [Google Scholar] [CrossRef]
  54. Urquhart, Andrew. 2016. The inefficiency of Bitcoin. Economics Letters 148: 80–82. [Google Scholar] [CrossRef]
  55. Urquhart, Andrew. 2018. What causes the attention of Bitcoin? Economics Letters 166: 40–44. [Google Scholar] [CrossRef] [Green Version]
  56. Yen, Gili, and Cheng-Few Lee. 2008. Efficient market hypothesis (EMH): Past, present and future. Review of Pacific Basin Financial Markets and Policies 11: 305–29. [Google Scholar] [CrossRef]
  57. Zebende, Gilney. 2011. DCCA cross-correlation coefficient: Quantifying level of cross-correlation. Physica A 390: 614–18. [Google Scholar] [CrossRef]
  58. Zhang, Wei, Pengfei Wang, Xiao Li, and Dehua Shen. 2018a. The inefficiency of cryptocurrency and its cross-correlation with Dow Jones Industrial Average. Physica A 510: 658–70. [Google Scholar] [CrossRef]
  59. Zhang, Wei, Pengfei Wang, Xiao Li, and Dehua Shen. 2018b. Some stylized facts of the cryptocurrency market. Applied Economics 50: 5950–65. [Google Scholar] [CrossRef]
  60. Zhang, Yuanyuan, Stephen Chan, Jeffrey Chu, and Saralees Nadarajah. 2019. Stylised facts for high frequency cryptocurrency data. Physica A 513: 598–612. [Google Scholar] [CrossRef]
  61. Zhao, Xiaojun, Pengjian Shang, and Jongjong Huang. 2017. Several fundamental properties of DCCA cross-correlation coefficient. Fractals 25: 1750017. [Google Scholar] [CrossRef]
Figure 1. Evolution of prices of cryptocurrencies under analysis.
Ijfs 07 00051 g001
Figure 2. Evolution of the detrended fluctuation analysis (DFA) exponents considering a window length w = 1000. In red, the error bar of the DFA exponents.
Ijfs 07 00051 g002
Figure 3. Statistical test for hypothesis H0: α = 0.5 versus H1: α ≠ 0.5, for the DFA exponents. Dashed lines represent critical values for a 5% level of significance.
Ijfs 07 00051 g003
Figure 4. Detrended cross-correlation analysis (DCCA) correlation coefficients between Bitcoin and the other cryptocurrencies. The dashed line represents the critical value (UL—upper limit), considering a significance level of 95%, to test the absence of correlation.
Ijfs 07 00051 g004
Table 1. Cryptocurrencies under analysis.
CryptocurrencyPeriodObservations
Bitcoin (BTC)16 July 2010–5 April 20193185
Ethereum (ETH)6 August 2015–5 April 20191338
Ripple (XRP)21 January 2015–5 April 20191536
Litecoin (LTC)23 October 2013–5 April 20191990
Table 2. Descriptive statistics for returns.
BitcoinEthereumRippleLitecoin
Mean0.00360.00300.00210.0017
Std. Dev.0.06760.07570.10830.0765
Minimum−0.8488−0.9163−0.9973−0.9345
Maximum1.47440.38301.02800.8904
Skewness2.9622−1.12930.82600.6468
Kurtosis93.159518.885523.227133.8733
Table 3. Detrended fluctuation analysis (DFA) exponents.
CryptocurrencyDFA Exponent
Bitcoin (BTC)0.5166 ± 0.0076
Ethereum (ETH)0.5347 ± 0.0111
Ripple (XRP)0.4980 ± 0.0124
Litecoin (LTC)0.4439 ± 0.0051
Table 4. Efficiency index (EI).
CryptocurrencyEfficiency Index (EI)
Bitcoin (BTC)0.0026
Ethereum (ETH)0.0061
Ripple (XRP)0.0027
Litecoin (LTC)0.0089

