The Relationship between Technology Life Cycle and Korean Stock Market Performance
Abstract
1. Introduction
2. Literature Review
3. Methodology and Data
3.1. Data
3.2. Methodology
4. Empirical Results
4.1. Average CAR for Evaluation Period: Jan 2007–Dec 2008, Event Period: Jan 2010–Dec 2012.
4.2. Average CAR for Evaluation Period: The Month in which Each Company Was Listed-Dec 2008, Event Period: Jan 2010–Dec 2012
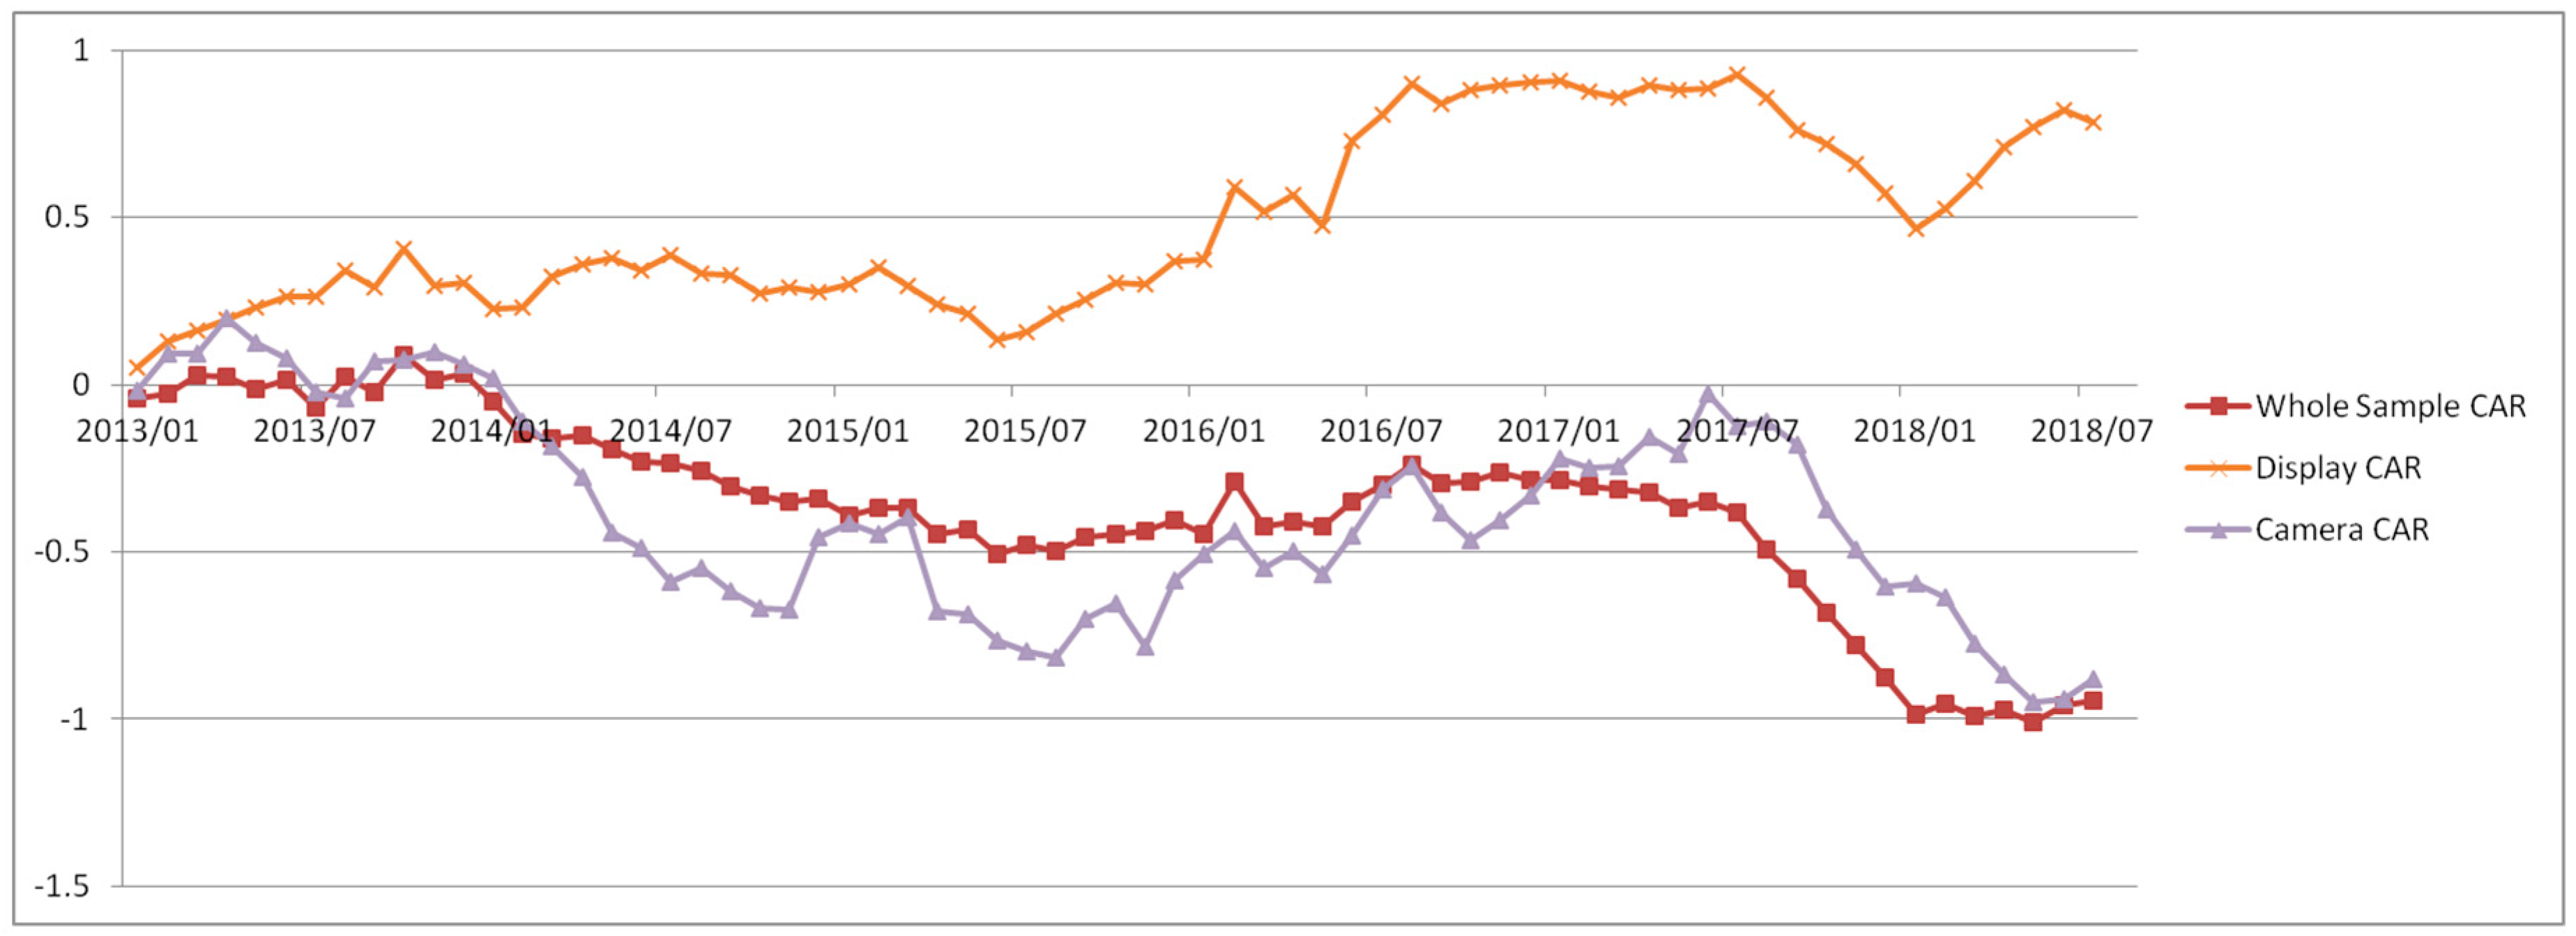
4.3. Average CAR for Evaluation Period: Jan 2010–Dec 2011, Event Period: Jan 2013–Jul 2018
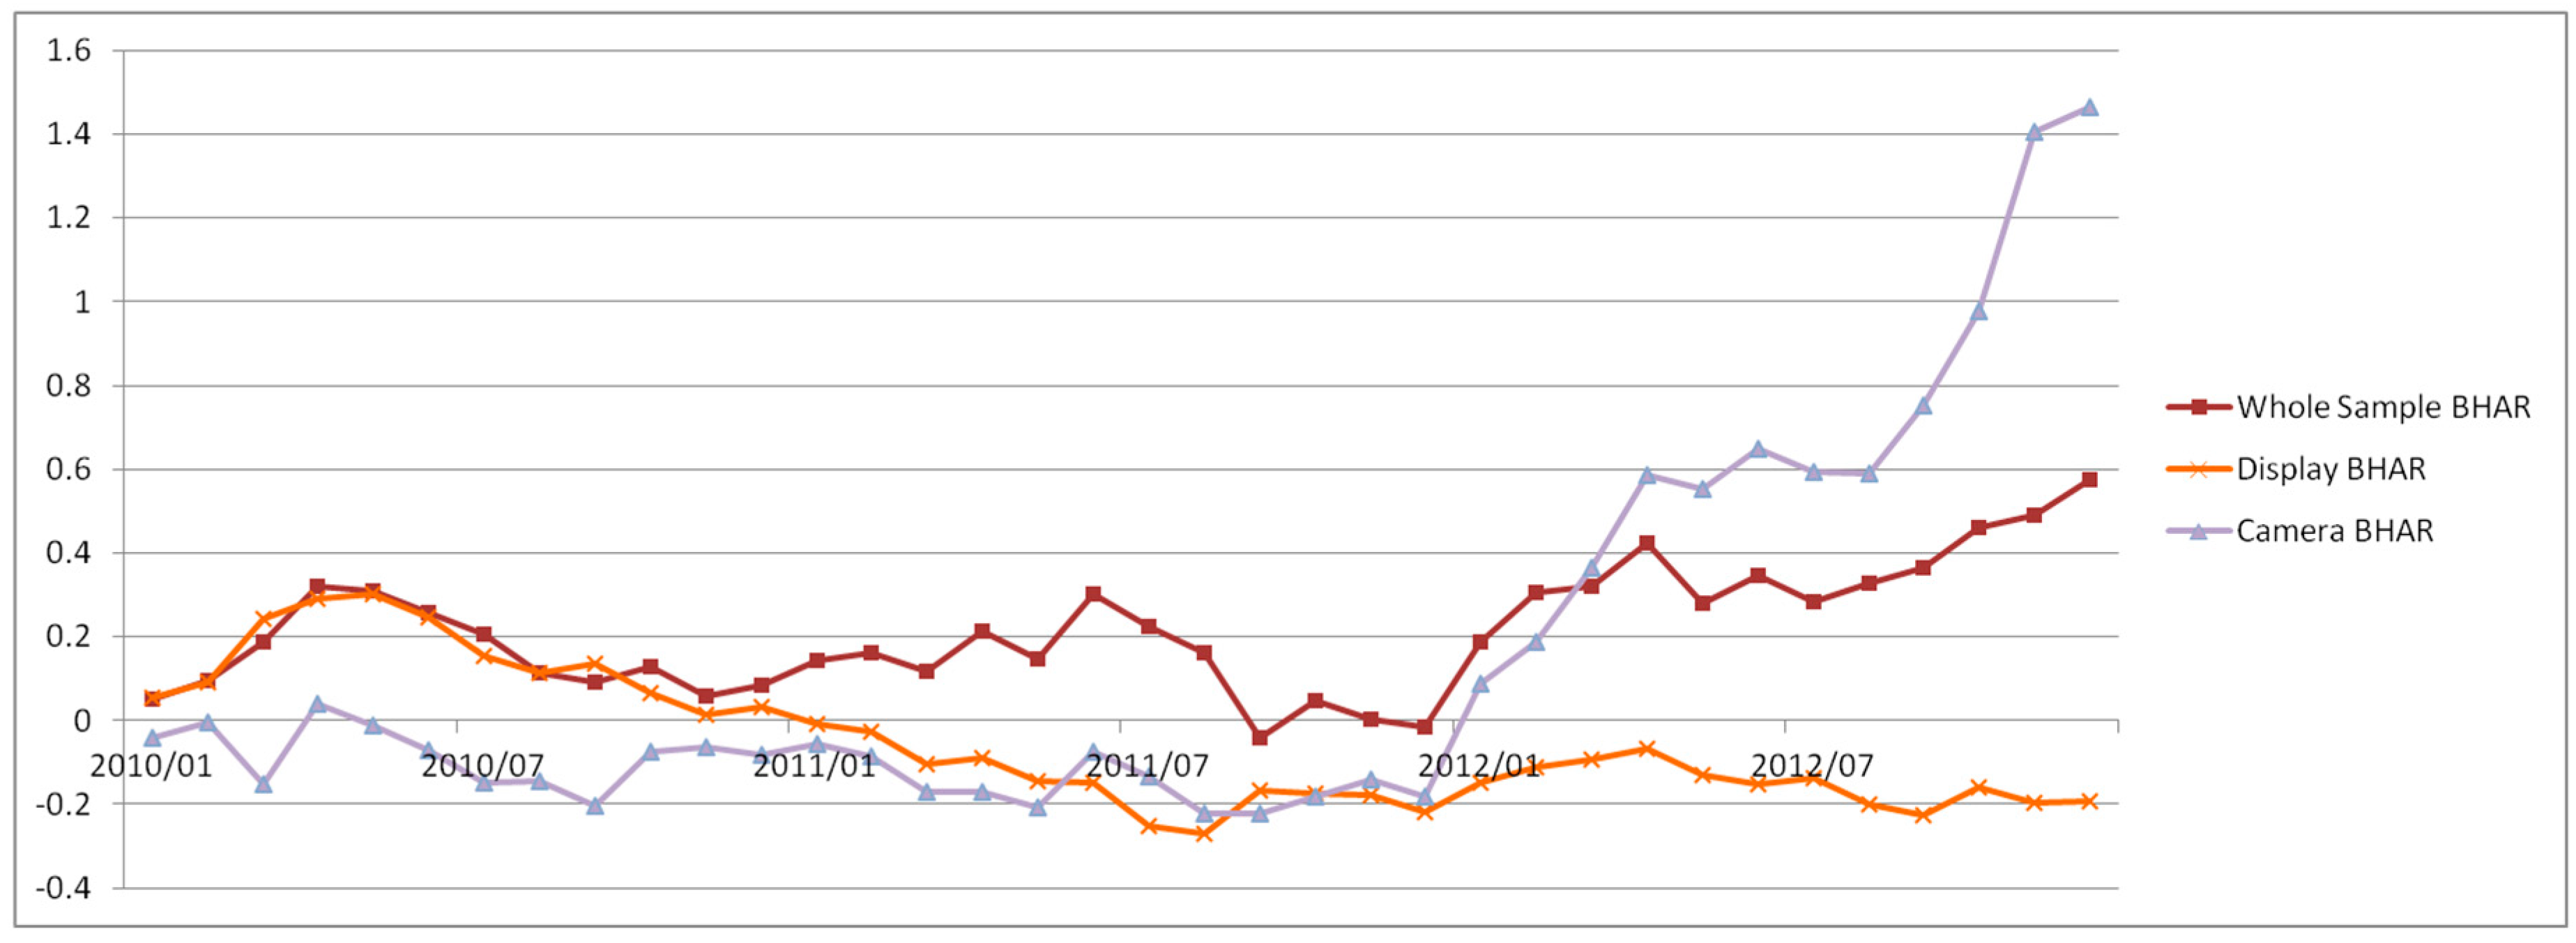
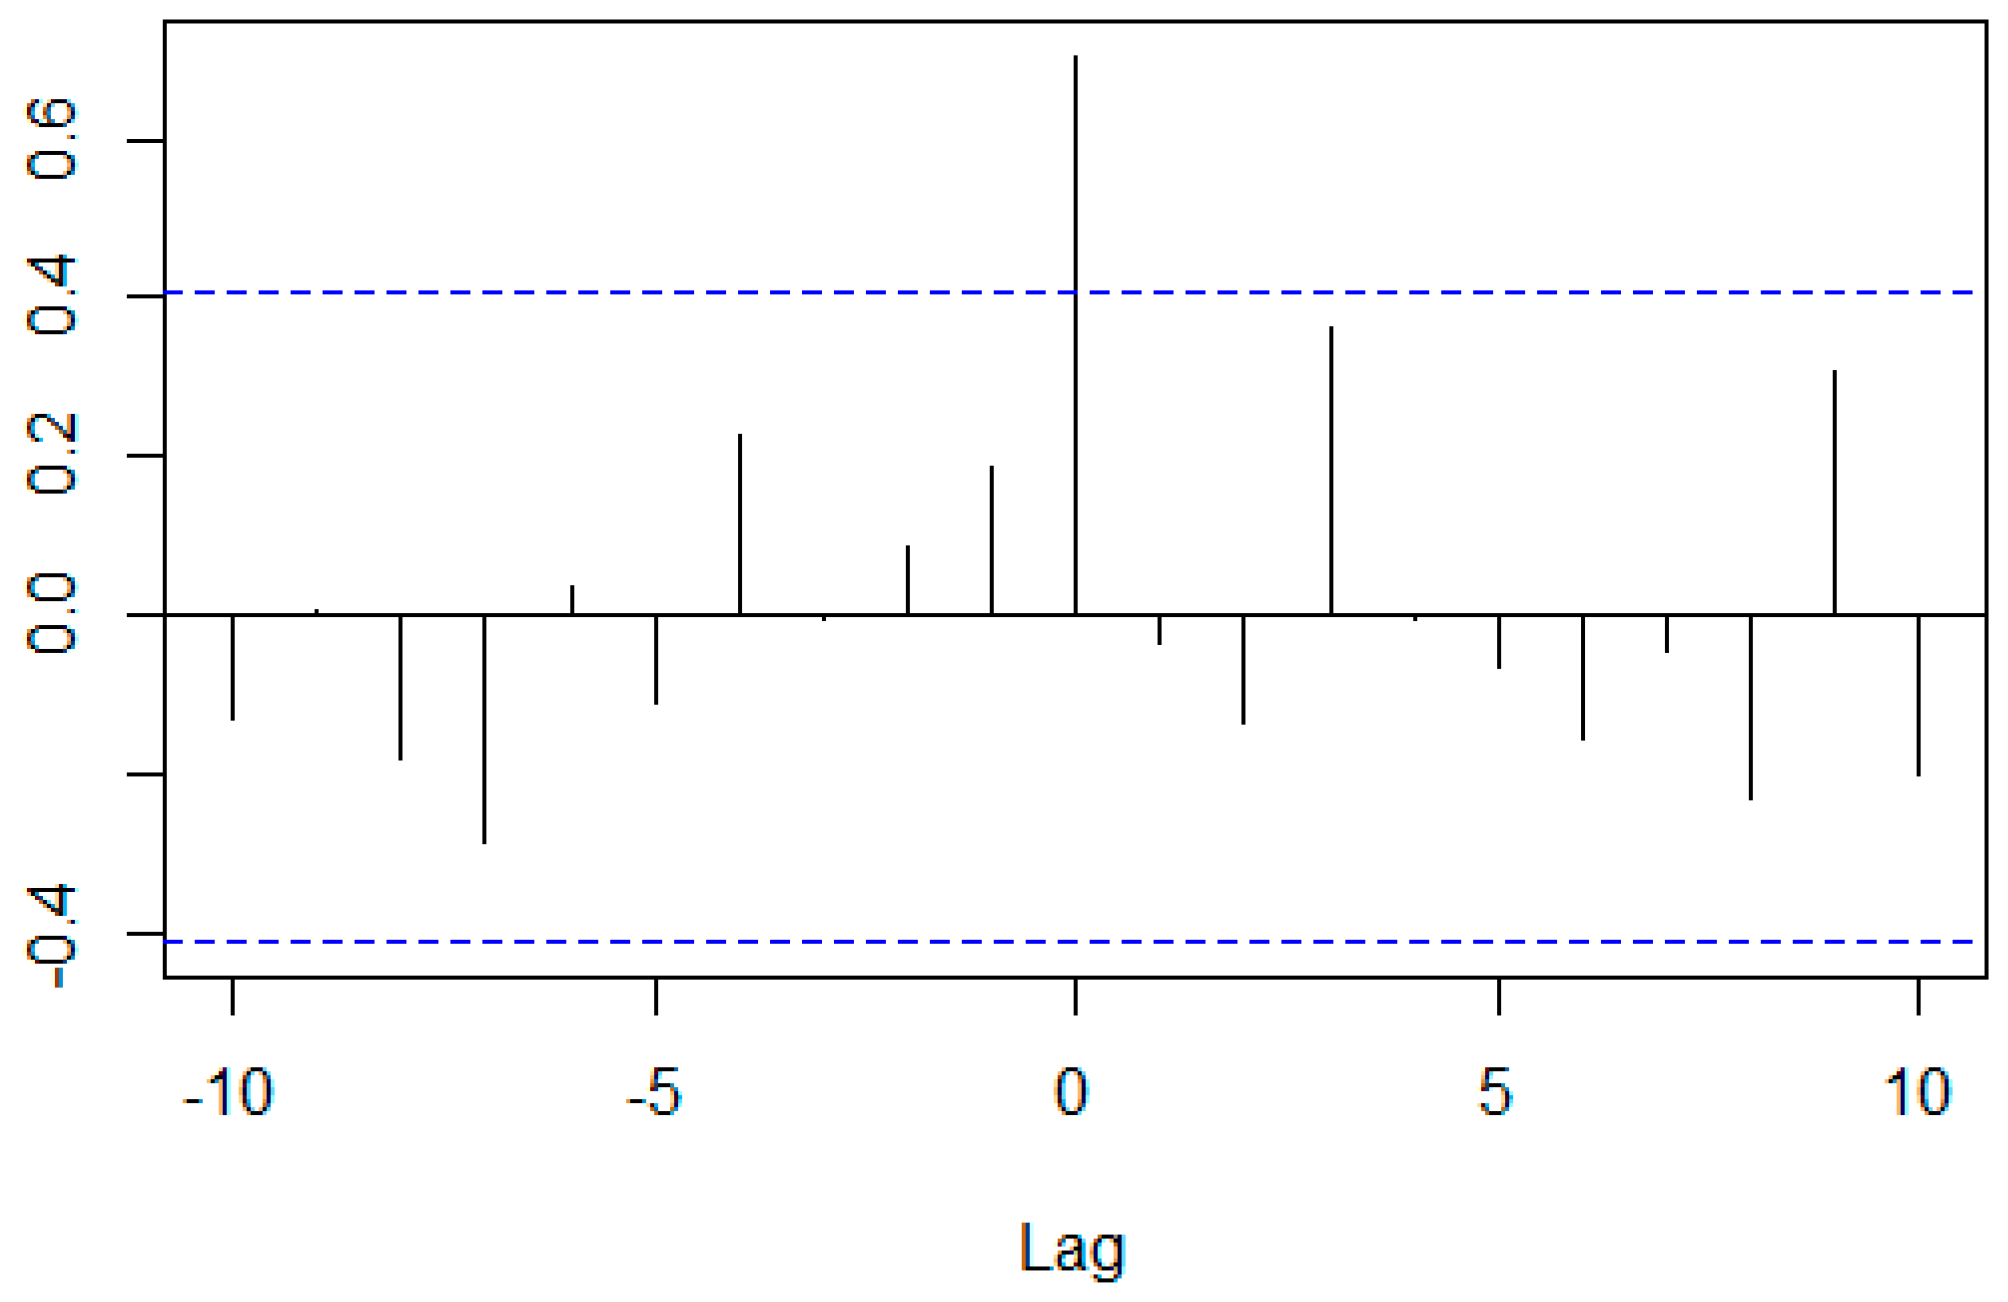
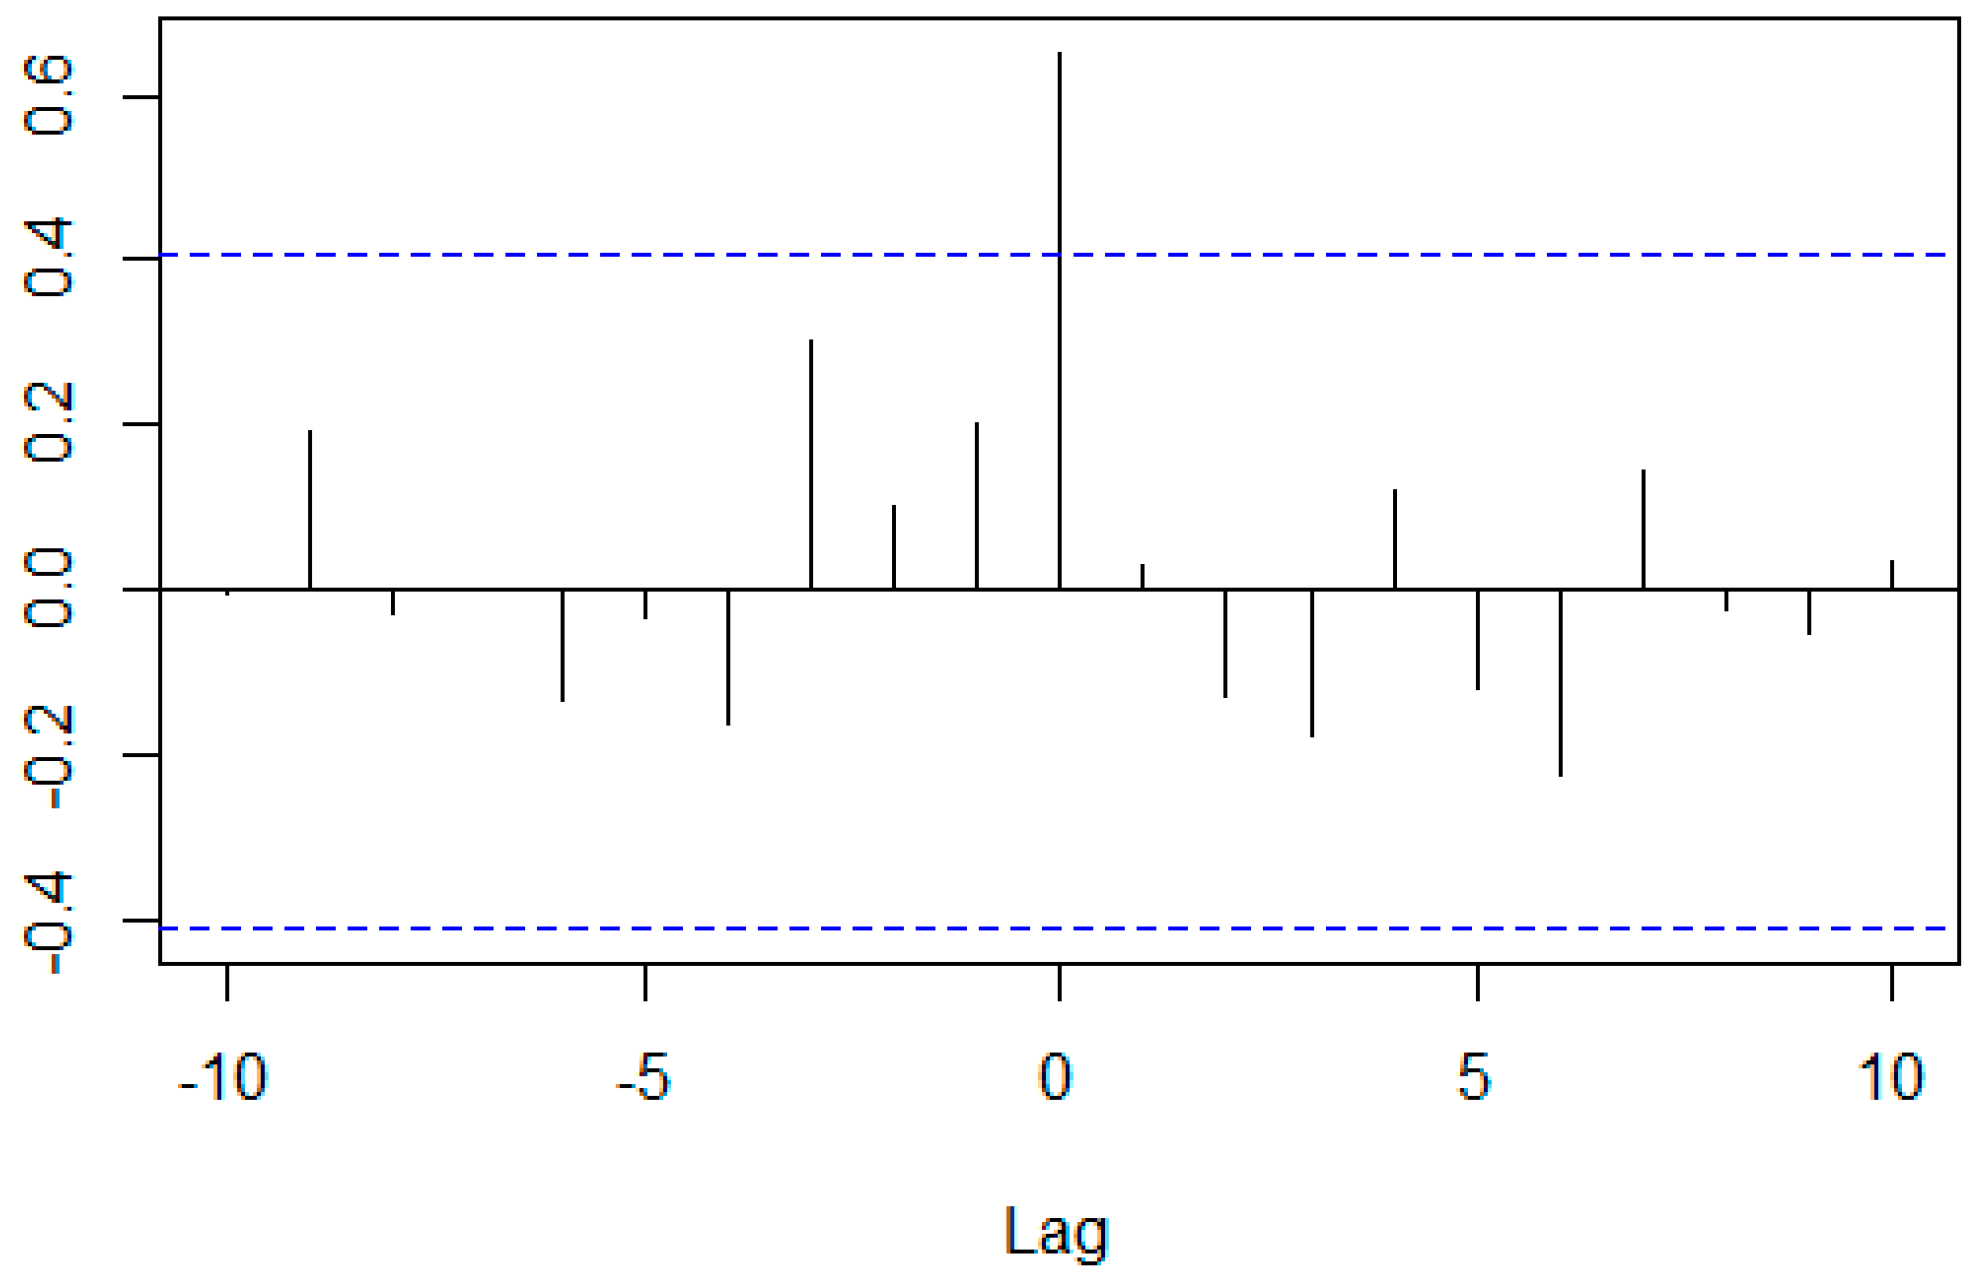
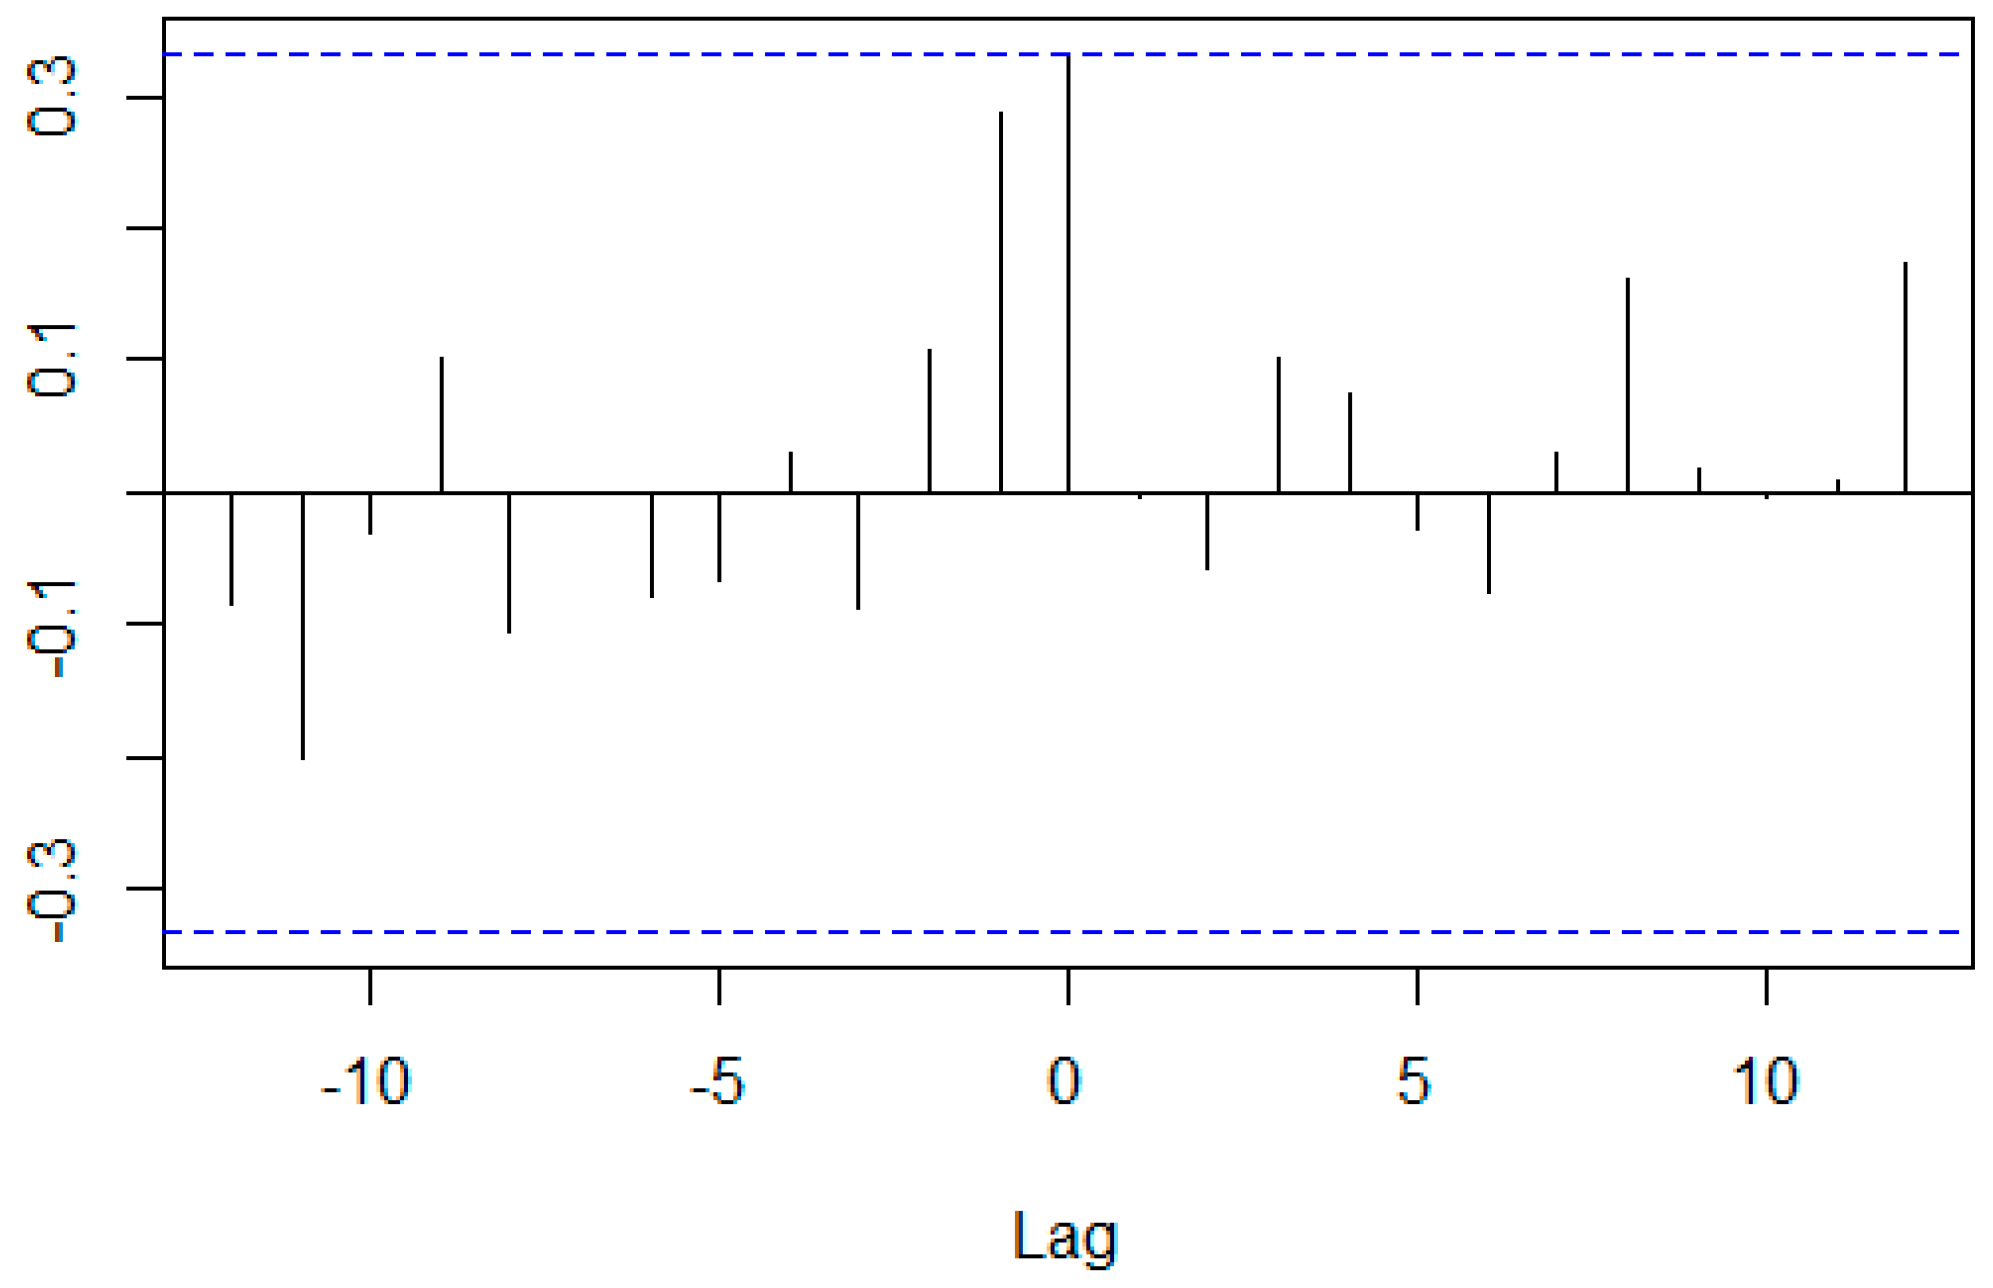
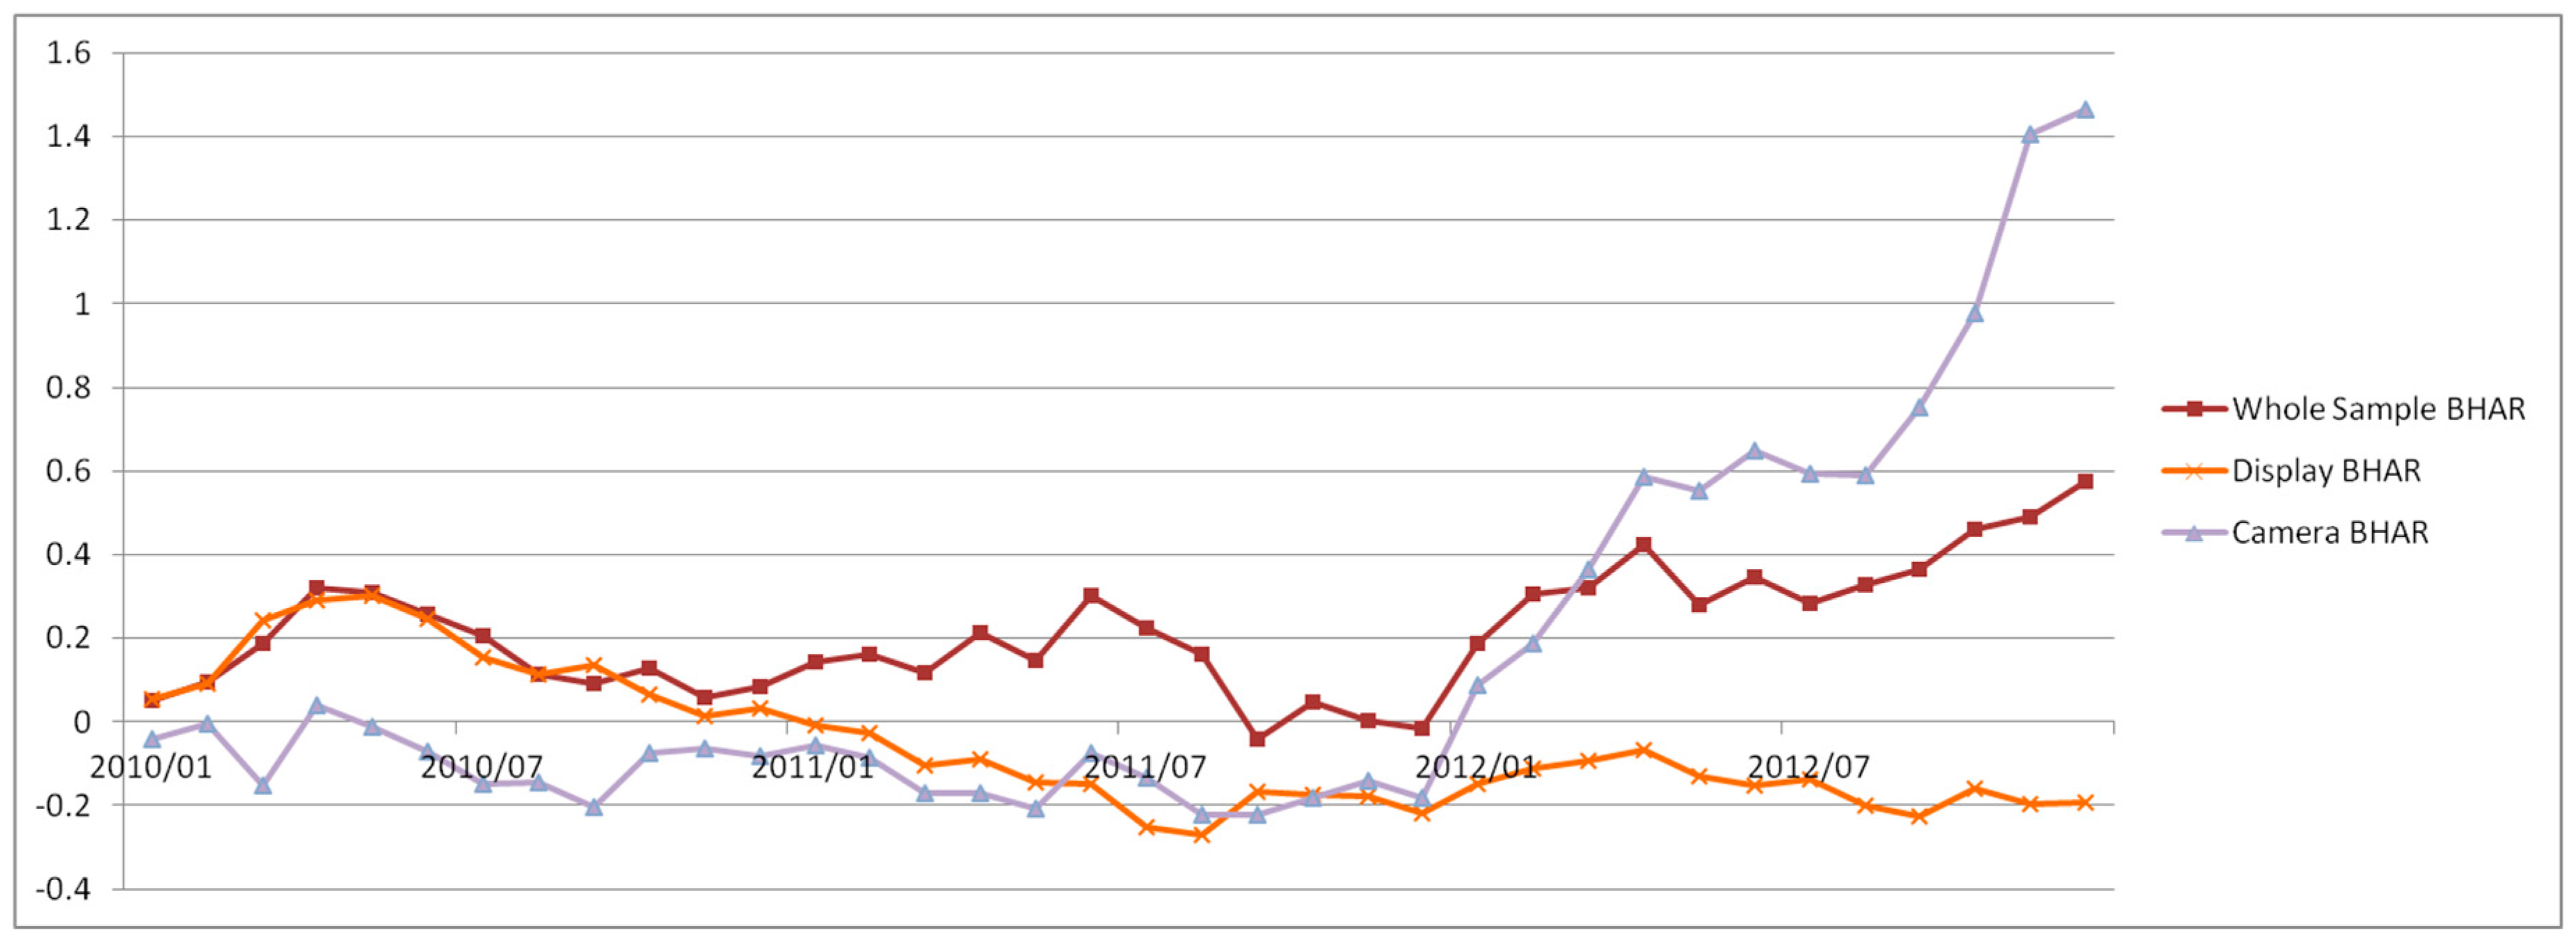
4.4. Average Buy-and-Hold Abnormal Returns (BHAR) for Jan 2010–Dec 2012
4.5. Average BHAR for Jan 2013–Jul 2018
5. Main Results
6. Conclusions and Implications
Funding
Conflicts of Interest
References
- Avellaneda, Marco, and Jeong-Hyun Lee. 2008. Statistical Arbitrage in the U.S. Equities Market. Available online: https://www.math.nyu.edu/faculty/avellane/AvellanedaLeeStatArb071008.pdf (accessed on 4 April 2018).
- Baek, Jong-Geun. 2005. Samsung Electronics’ patent trend and correlation with stock price. Patent 21 62: 16–21. [Google Scholar]
- Chadha, Alka, and Raffaele Oriani. 2010. R&D market value under weak intellectual property rights protection: The case of India. Scientometrics 82: 59–74. [Google Scholar] [CrossRef]
- Cho, Sang Sup, and Jang Woo Lee. 2003. A Relationship on the IT Technology and IT Stock in Korea: A Preliminary Looking. Electronics and Telecommunications Trends 18: 89–98. [Google Scholar] [CrossRef]
- Daizadeh, Iraj. 2007. Issued US patents, patent-related global academic and media publications, and the US market indices are inter-correlated, with varying growth patterns. Scientometrics 73: 29–36. [Google Scholar] [CrossRef]
- Greenwood, Jeremy, and Boyan Jovanovic. 1999. The Information-Technology Revolution and the Stock Market. American Economic Review 89: 116–22. [Google Scholar] [CrossRef]
- Hobijn, Bart, and Boyan Jovanovic. 2001. The Information-Technology Revolution and the Stock Market: Evidence. American Economic Review 91: 1203–20. [Google Scholar] [CrossRef]
- Jovanovic, Boyan, and Peter L. Rousseau. 2003. The Two Technological Revolutions. Journal of the European Economic Association 1: 419–28. [Google Scholar] [CrossRef]
- Jung, HyeongJong, and Si-woo Kim. 2017. Investment Ideas from Market Capitalization Changes. Korea Investment & Securities Co., Ltd. Available online: http://file.mk.co.kr/imss/write/20170713102204__00.pdf (accessed on 1 April 2018).
- Kim, Gi-Beom. 2016. A Study on Stock Price Prediction System for Bio Medicine Sector using Opinion Mining and Machine Learning. Ph.D. thesis, Soongsil University, Seoul, Korea. [Google Scholar]
- Kim, MinJo, and HyeongChan Jung. 1995. A Disclosure of Patent Application and Share Value. The Korean Journal of Financial Management 12: 121–142. [Google Scholar]
- Kim, Jinhyung, Myunggwon Hwang, Do-Heon Jeong, and Hanmin Jung. 2012. Technology trends analysis and forecasting application based on decision tree and statistical feature analysis. Expert Systems with Applications 39: 12618–25. [Google Scholar] [CrossRef]
- Linden, Alexander, and Jackie Fenn. 2003. Understanding Gartner’s Hype Cycles. Gartner. Available online: http://www.bus.umich.edu/KresgePublic/Journals/Gartner/research/115200/115274/115274.pdf (accessed on 6 April 2018).
- Mazzucato, Mariana. 2002. The PC Industry: New Economy or Early Life-Cycle? Review of Economic Dynamics 5: 318–45. [Google Scholar] [CrossRef][Green Version]
- Mazzucato, Mariana. 2003. Risk, variety and volatility: Growth, innovation and stock prices in early industry evolution. Journal of Evolutionary Economics 13: 491–512. [Google Scholar] [CrossRef][Green Version]
- Mazzucato, Mariana. 2006. Innovation and Stock Prices: A Review of some Recent Work. Revue de l’OFCE, Presses de Sciences-Po 97: 159–79. [Google Scholar] [CrossRef]
- Mazzucato, Mariana, and Willi Semmler. 1999. Market share instability and stock price volatility during the industry life-cycle: The US automobile industry. Journal of Evolutionary Economics 9: 67–96. [Google Scholar] [CrossRef]
- Nicholas, Tom. 2008. Does Innovation Cause Stock Market Runups? Evidence from the Great Crash. American Economic Review 98: 1370–96. [Google Scholar] [CrossRef]
- Park, Jung-Hee, In-Gook Yeo, and Jong-Beom Moon. 2011. Effect of Small and Medium Businesses’ R&D Intensity and Patents on Their P/E Ratios. Journal of Korea Technology Innovation Society 14: 466–87. [Google Scholar]
- Park, HyunWoo, WongHyun Sung, JeomYeol Yun, GeunIm Lee, CheulMin Jung, HanJung Ju, and JeongUn Choi. 2014. Technology Valuation Practice Guide. Ministry of Trade, Industry and Energy. Available online: http://www.valuation.or.kr/assess/%EA%B8%B0%EC%88%A0%EA%B0%80%EC%B9%98%ED%8F%89%EA%B0%80_%EC%8B%A4%EB%AC%B4%EA%B0%80%EC%9D%B4%EB%93%9C(2014).pdf (accessed on 6 March 2018).
- Pástor, Ľuboš, and Pietro Veronesi. 2009. Technological Revolutions and Stock Prices. American Economic Review 99: 1451–83. [Google Scholar] [CrossRef]
- Schumaker, Robert P., and Hsinchun Chen. 2009. Textual analysis of stock market prediction using breaking financial news: The AZFin text system. ACM Transactions on Information Systems (TOIS) 27: 12. [Google Scholar] [CrossRef]
- Shah, Priyanka, and Parvinder Arora. 2014. M&A Announcements and Their Effect on Return to Shareholders: An Event Study. Accounting and Finance Research 3: 170. [Google Scholar] [CrossRef]
- Suh, Yoonkyo, and SiJeong Kim. 2016. An Exploratory Study of Technology Planning Using Content Analysis & Hype Cycle. Journal of Korea Technology Innovation Society 19: 80–104. [Google Scholar]
- Thomas, Patrick. 2001. A relationship between technology indicators and stock market performance. Scientometrics 51: 319–33. [Google Scholar] [CrossRef]
- Yoo, Sun-Hi. 2004. A study on the Forecasting Model of Technology Life Cycles by Analysis of US Patent Citation. Journal of Information Management 35: 93–112. [Google Scholar] [CrossRef]
| 1 | Idiosyncratic risk was defined as the ratio between the volatility of firm-level returns over the volatility of market level return volatility. |
| 2 | The ARIMA model was chosen based on the Akaike’s information criterion (AIC) and Bayesian information criterion (BIC). |
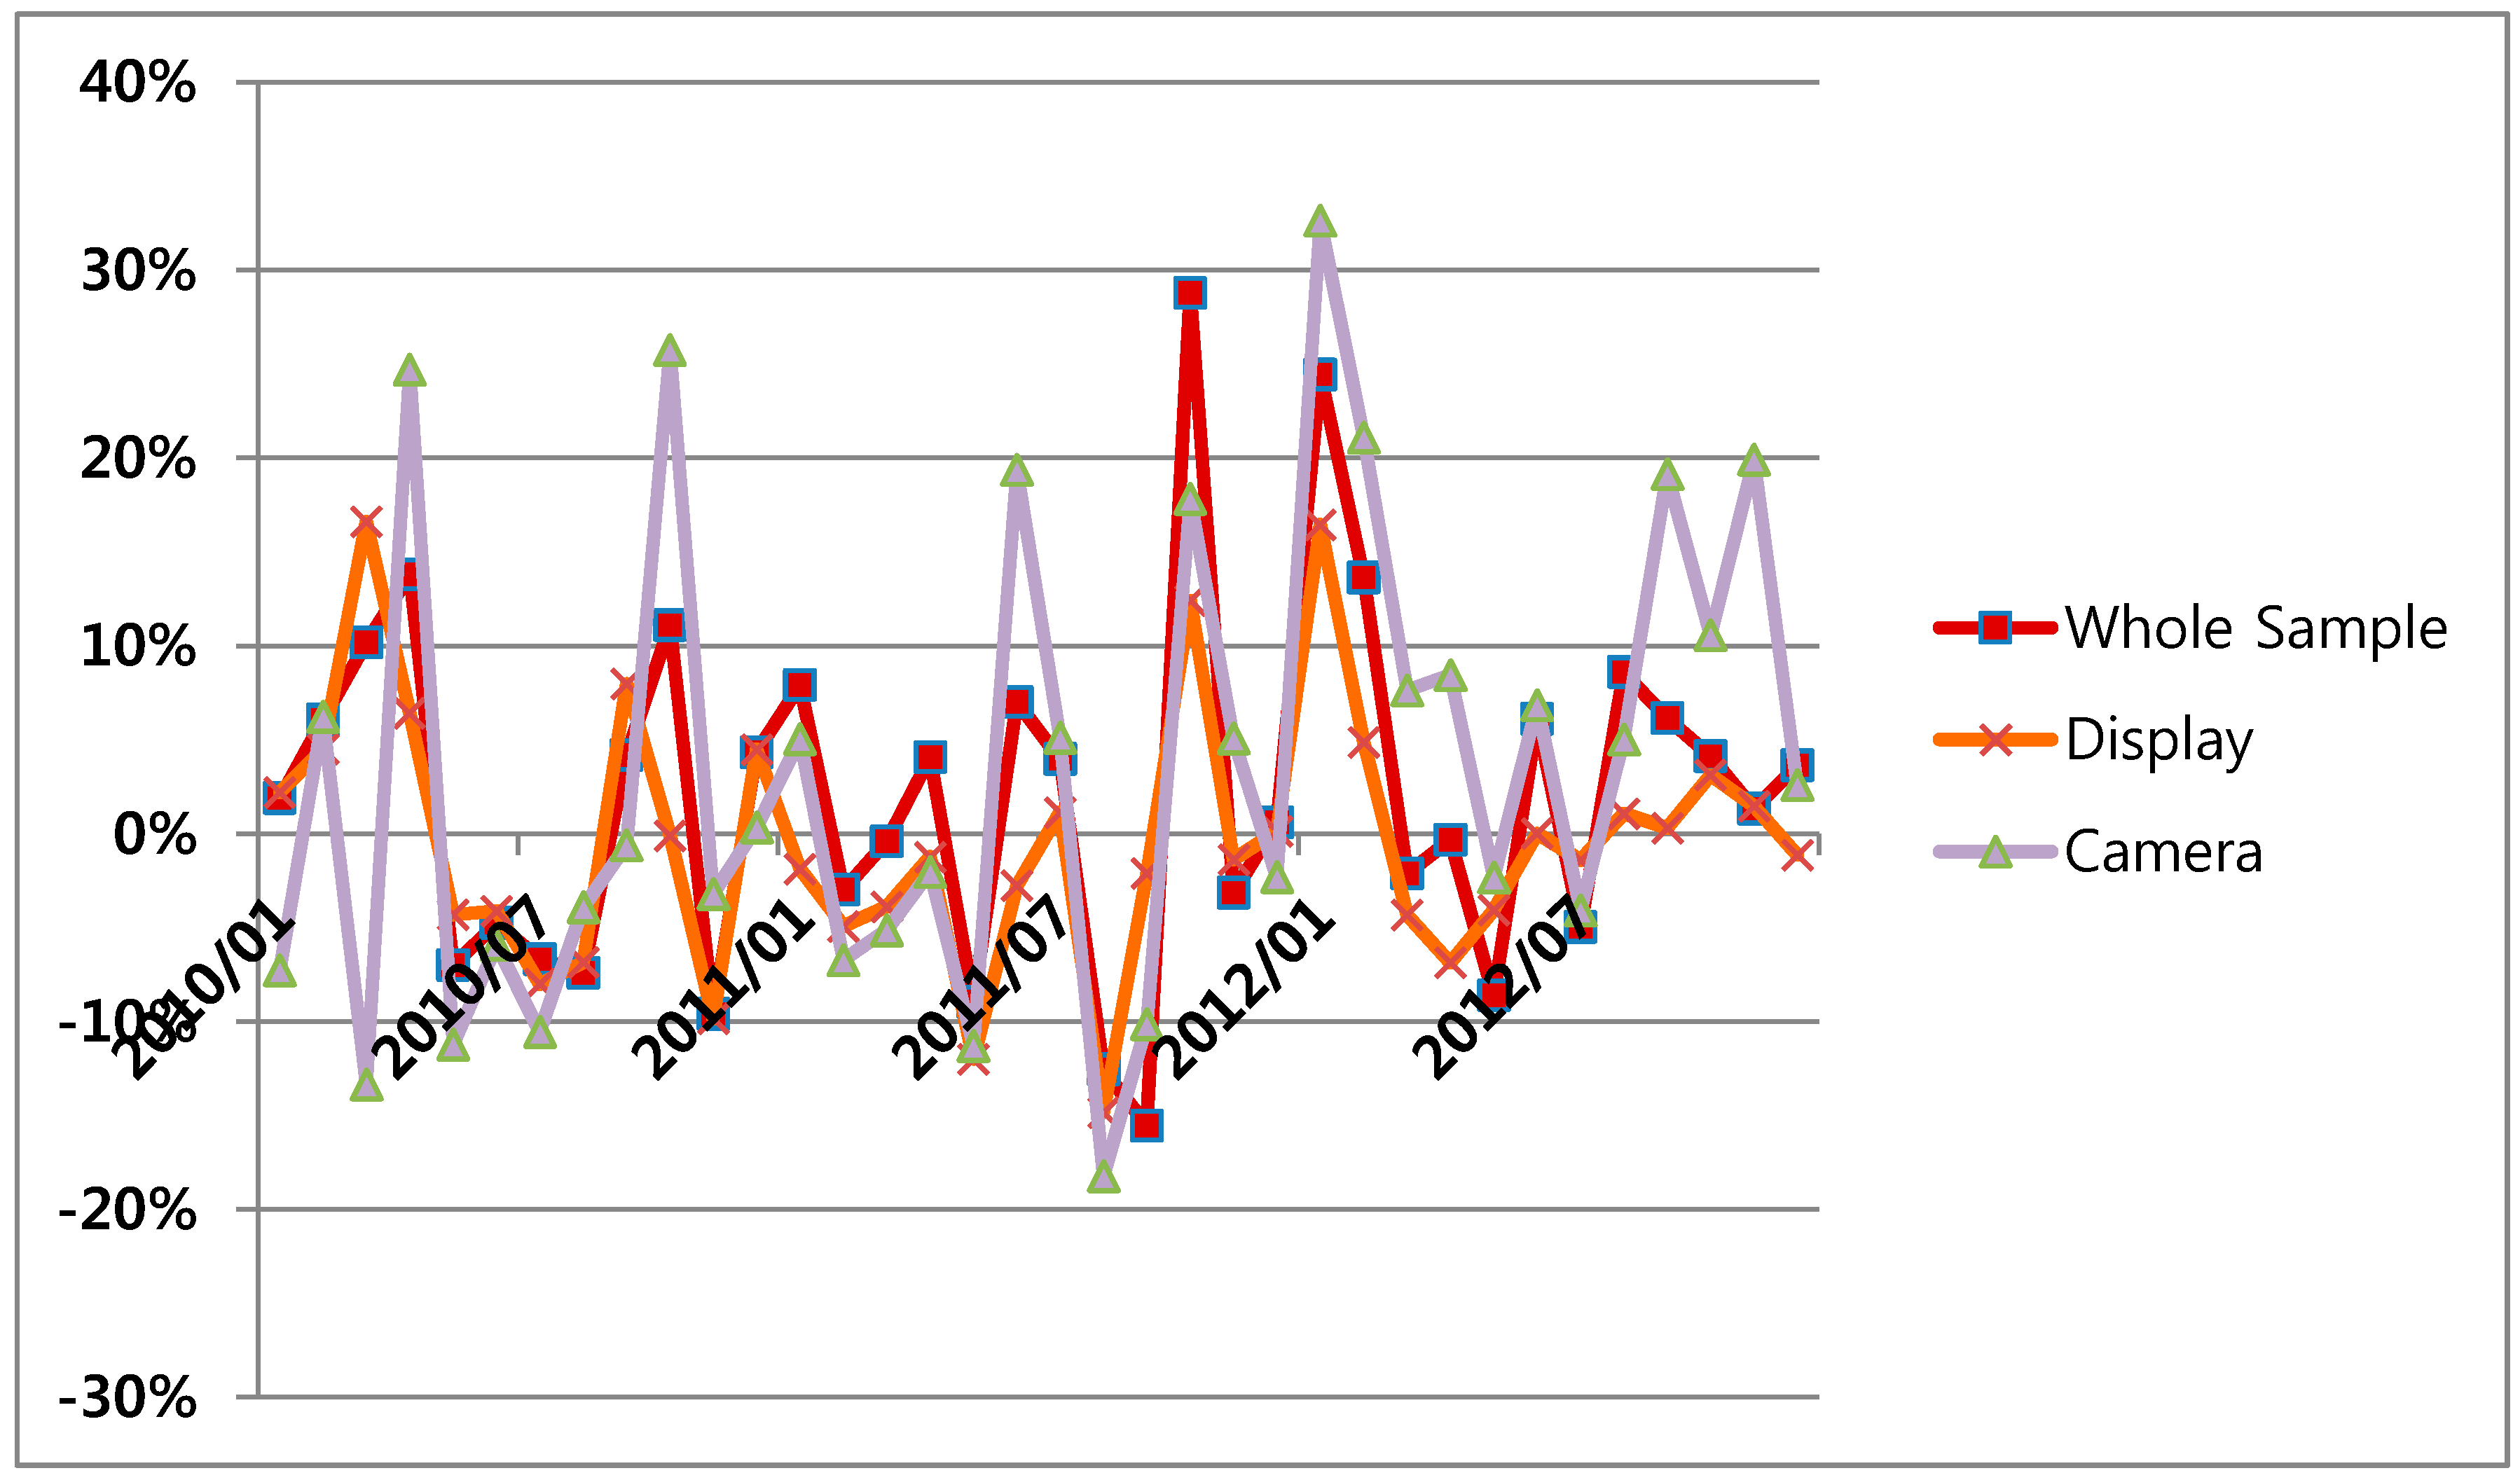
| 3 | The average CAR and the average BHAR for a specific month in a chart are the average of the CAR and the BHAR for each firm from the first month shown in the charts to the specific month. |
| 4 | The minimum p-value calculated by PP test in R program is 0.01. The real p-value could be smaller than 0.01. |
| 5 | The ma, sar, and drift mean Θ of MA model, Φ of seasonal AR model and drift of ARIMA model, respectively. |
| 6 | TS1 refers to the p-value of the first time series of a Group Combination computed by the PP test and TS2 refers to the p-value of the second time series of a Group Combination computed by the PP test. For example, the TS1 of the whole sample and display group is the p-value of a whole sample time series computed by the PP test, and the TS2 of the whole sample and display group is the p-value of a display time series computed by the PP test. |
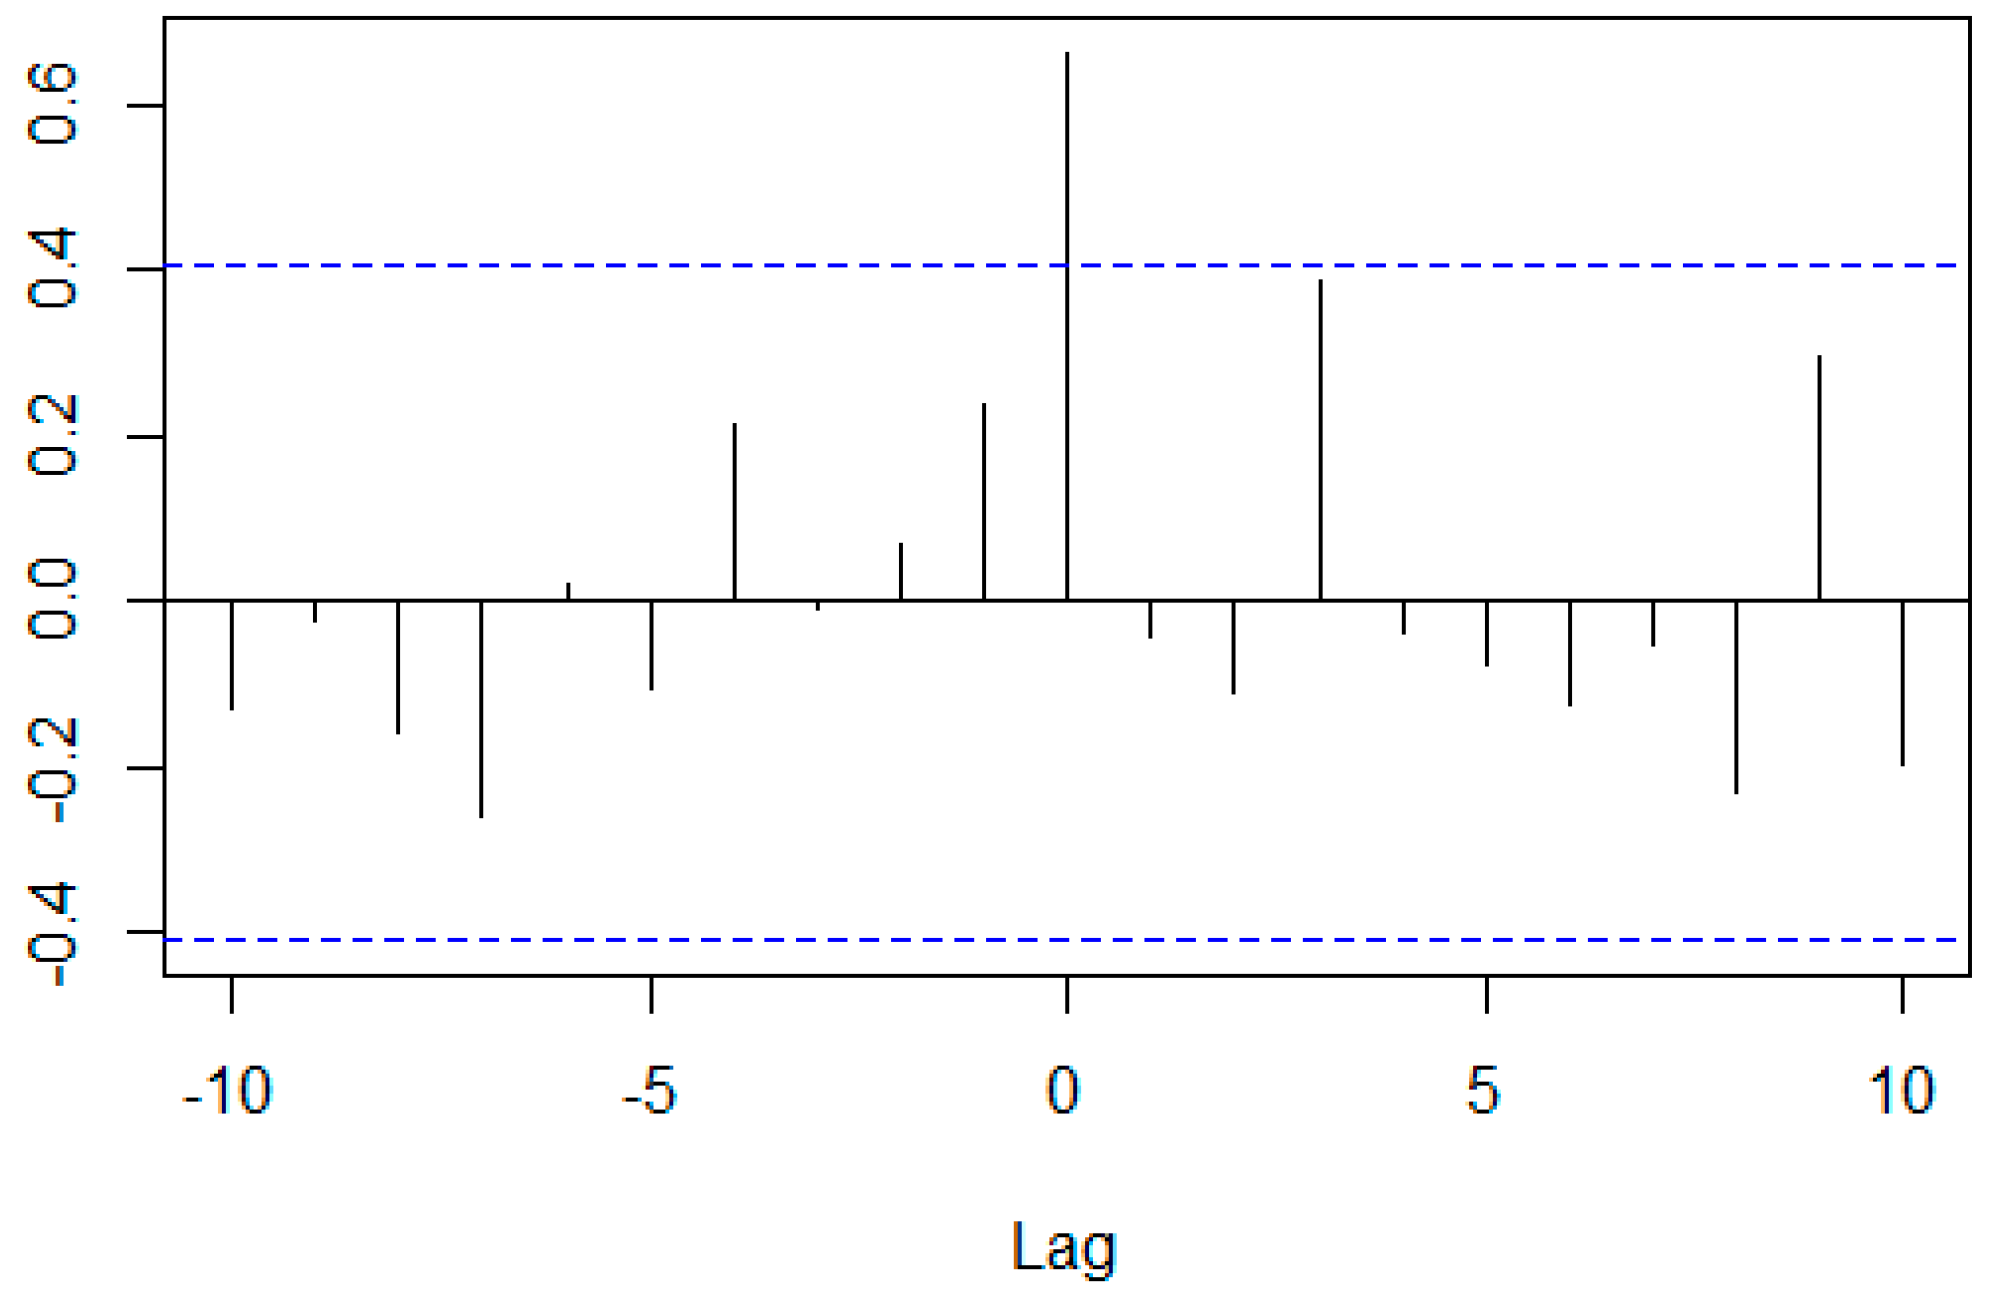
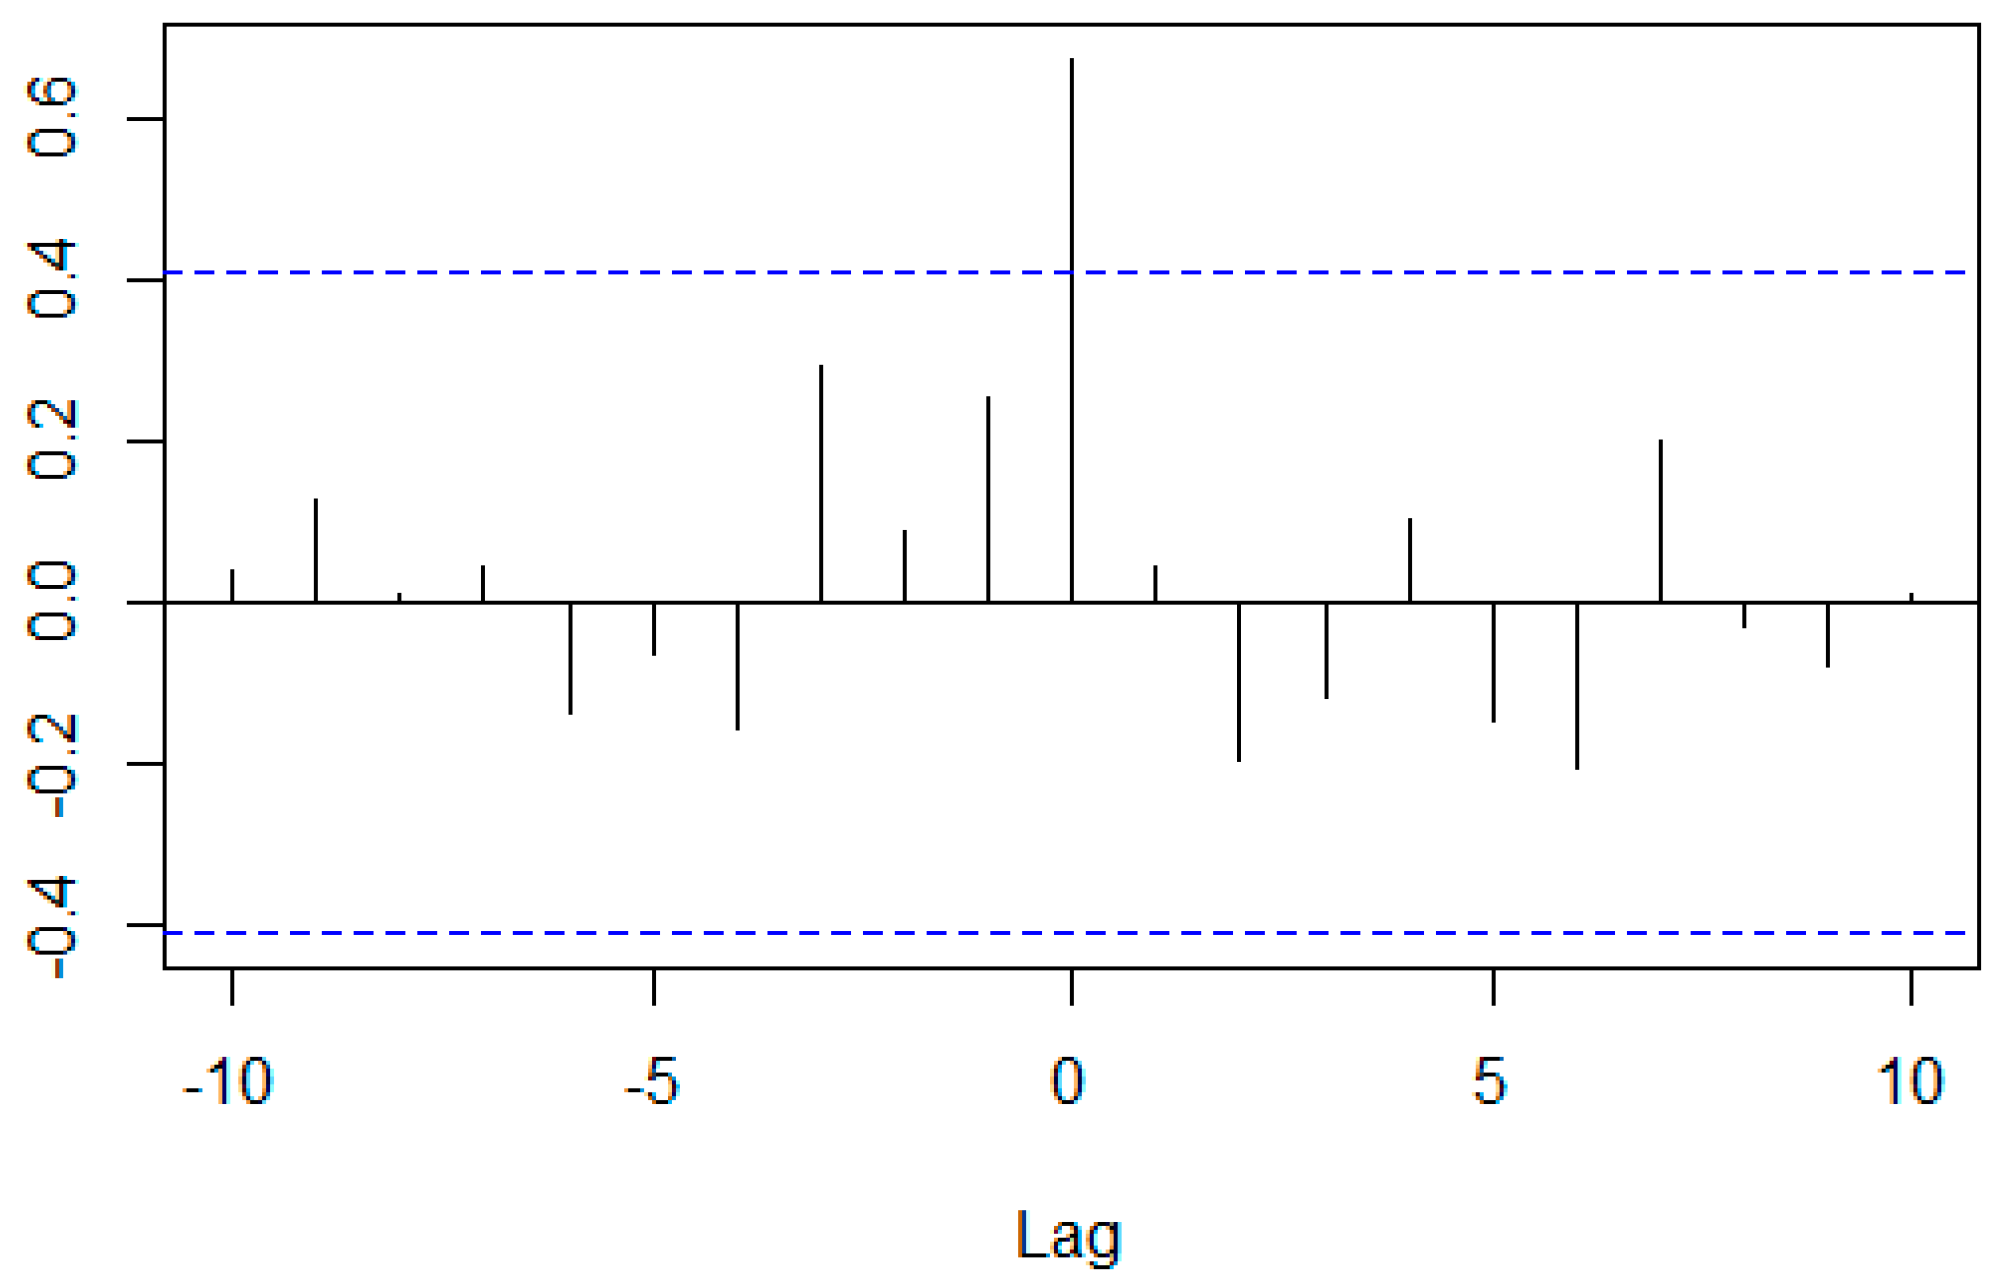
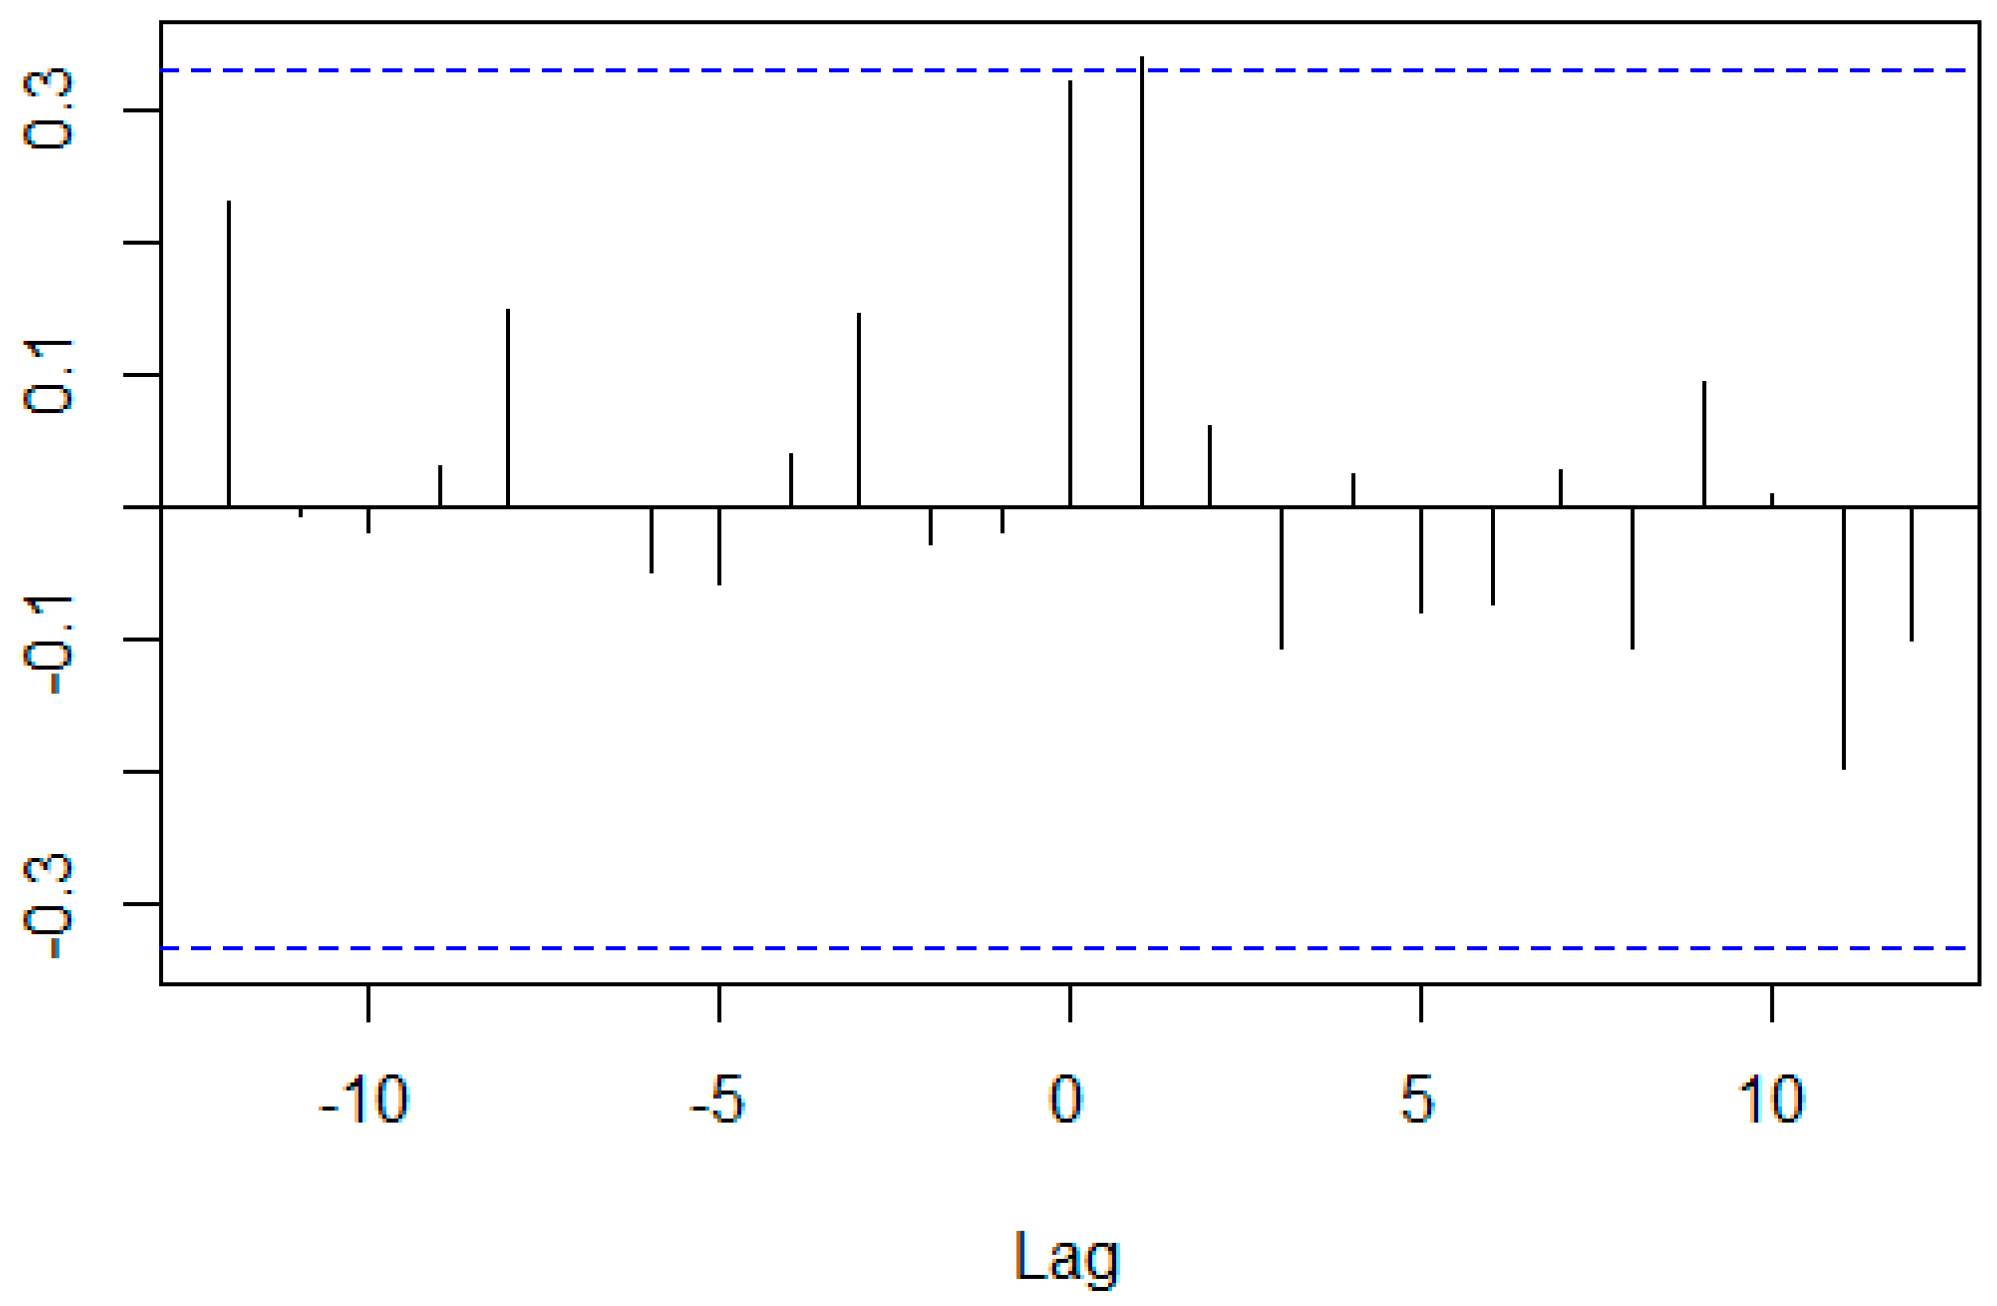
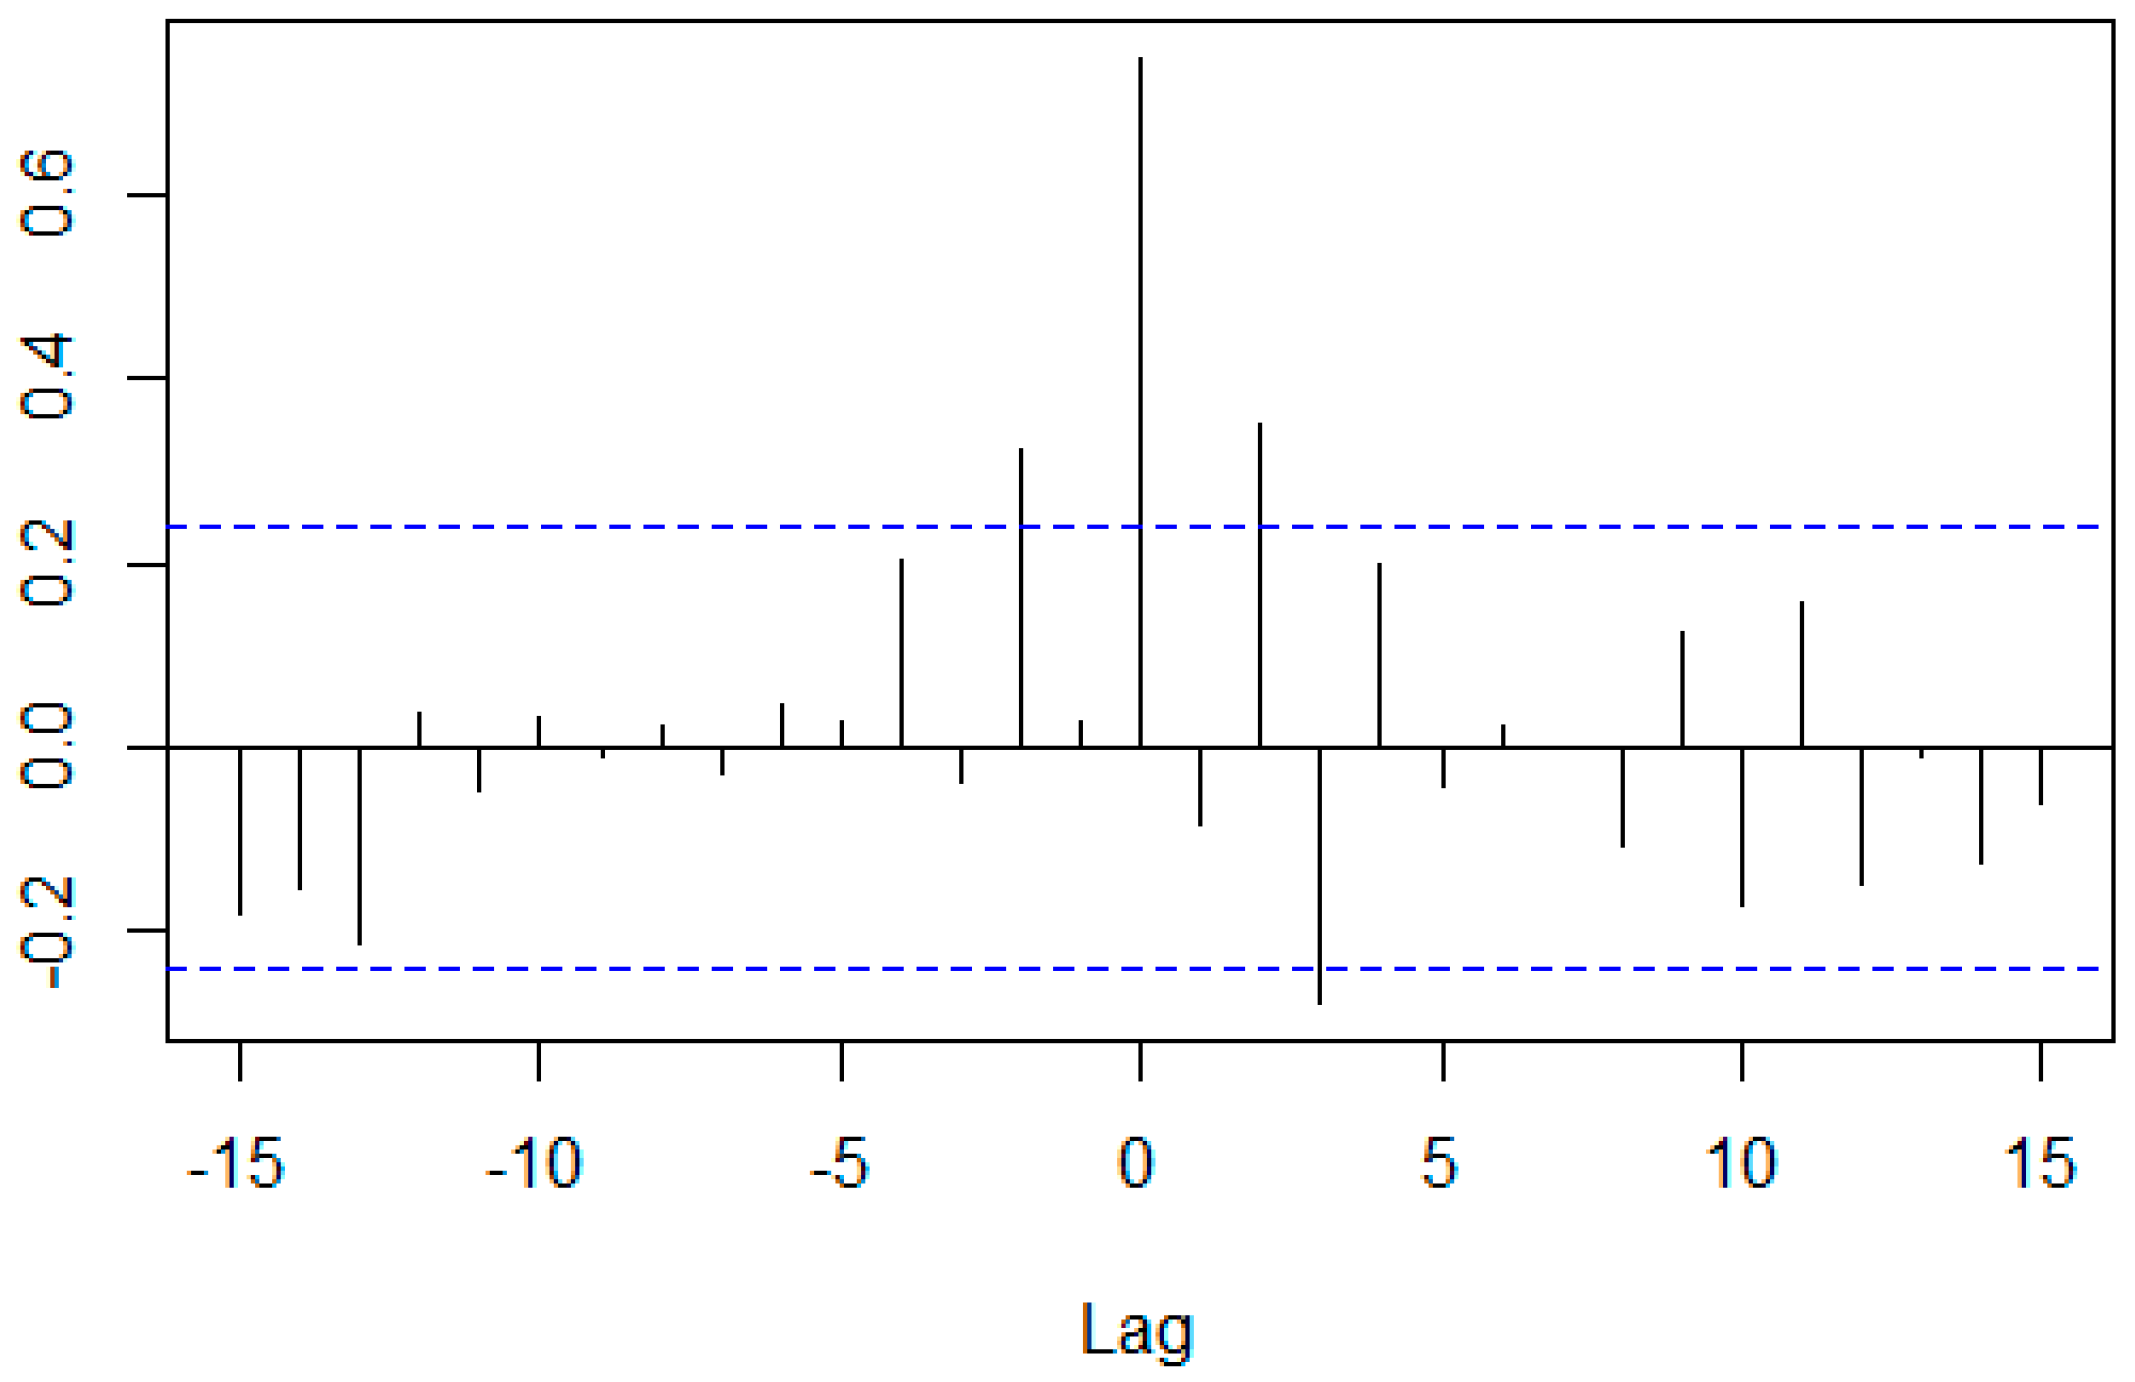
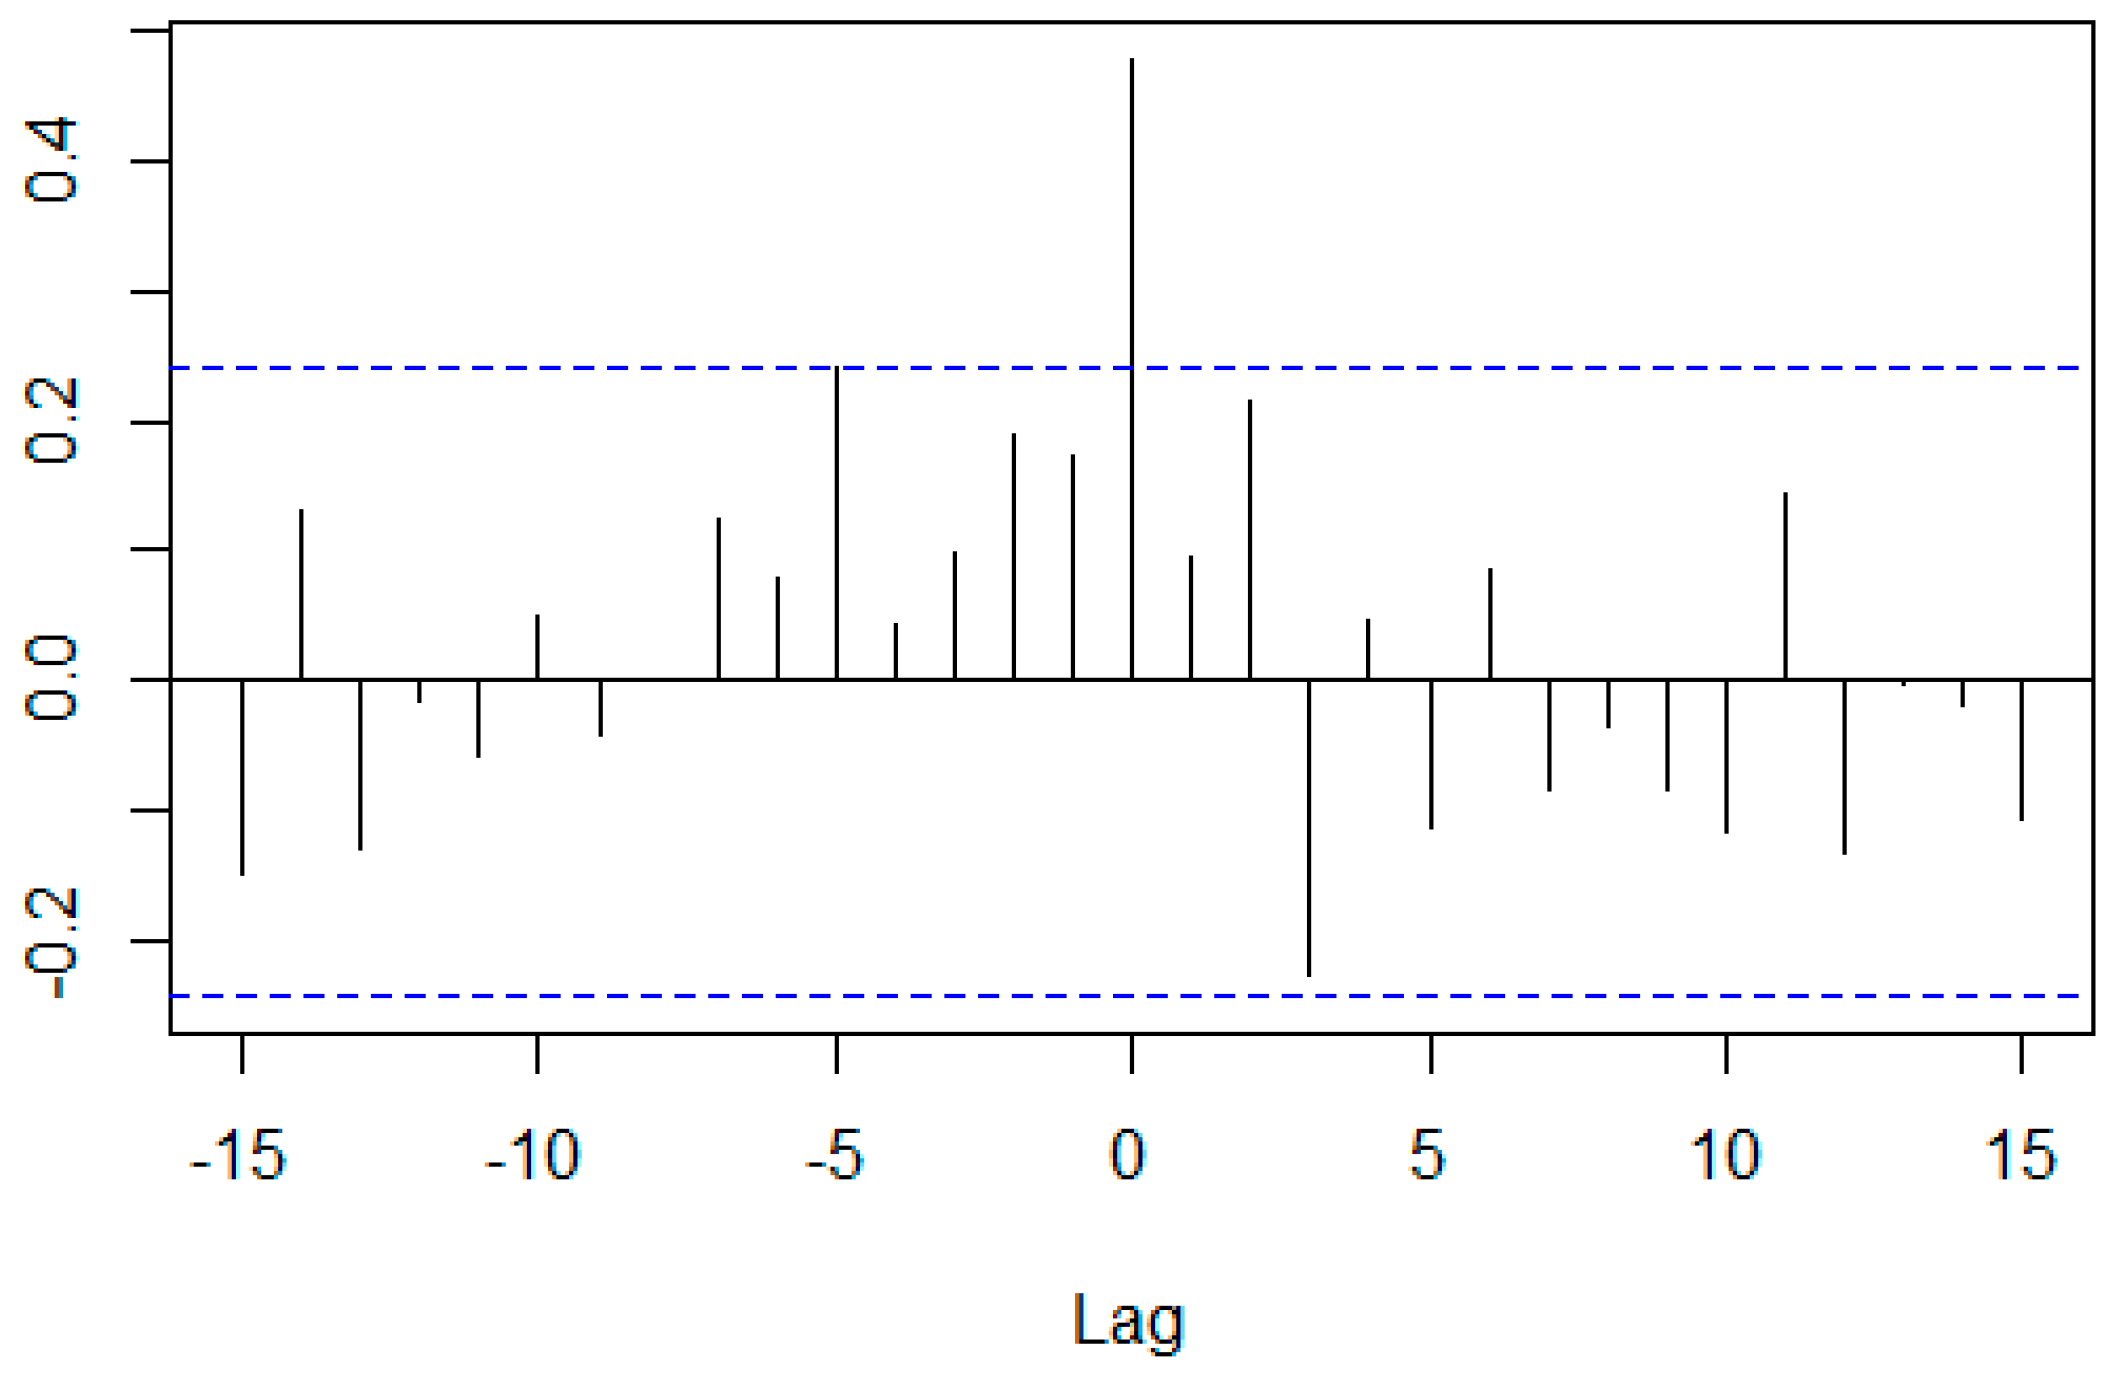
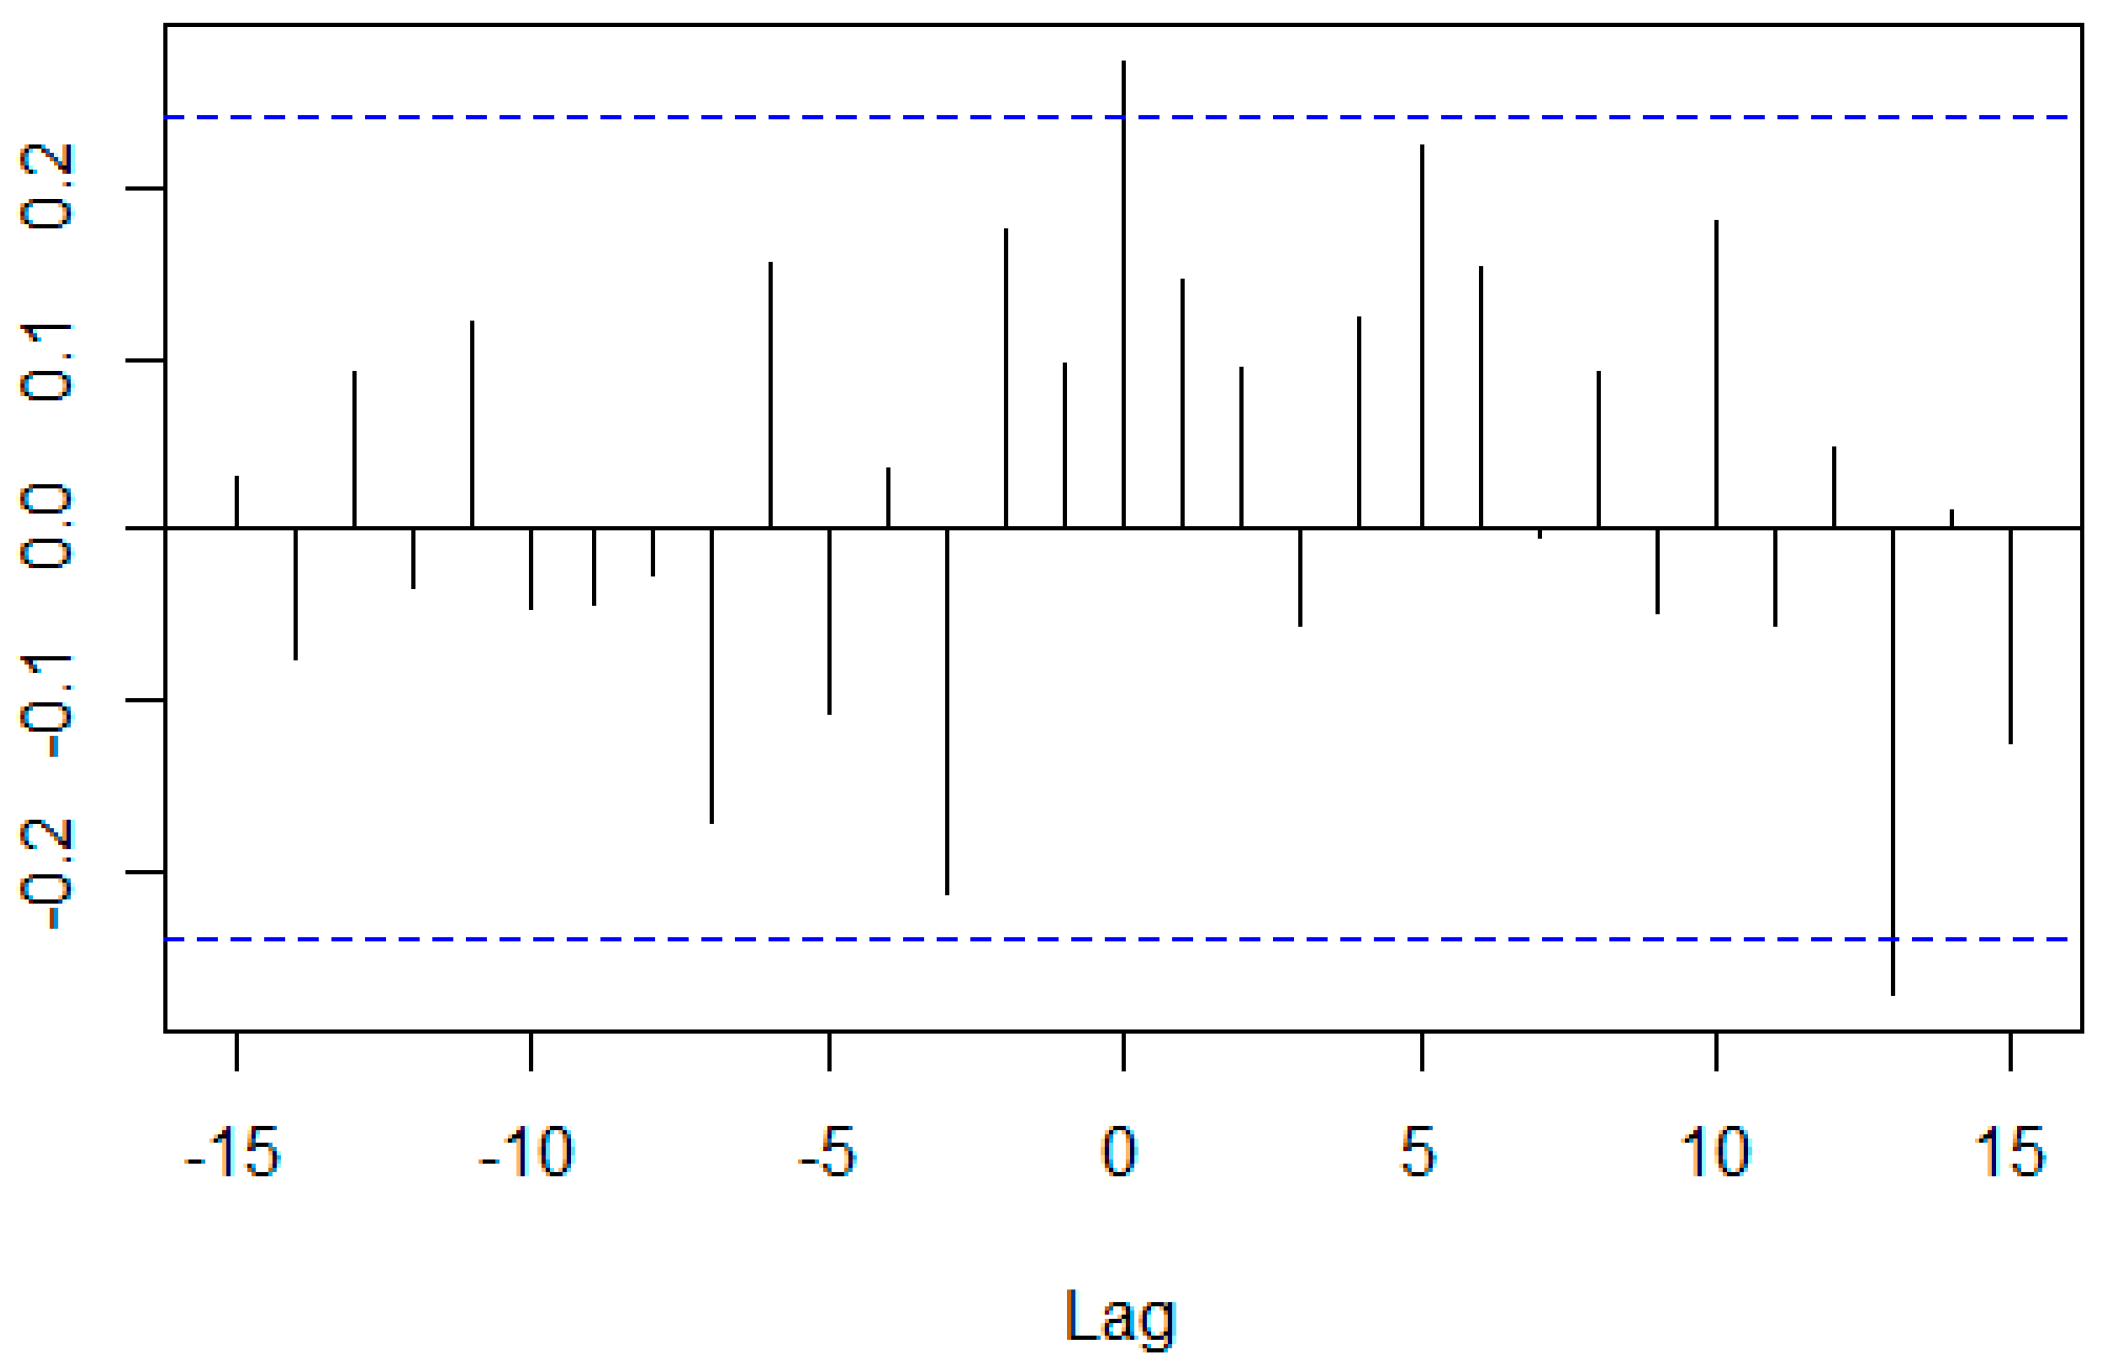
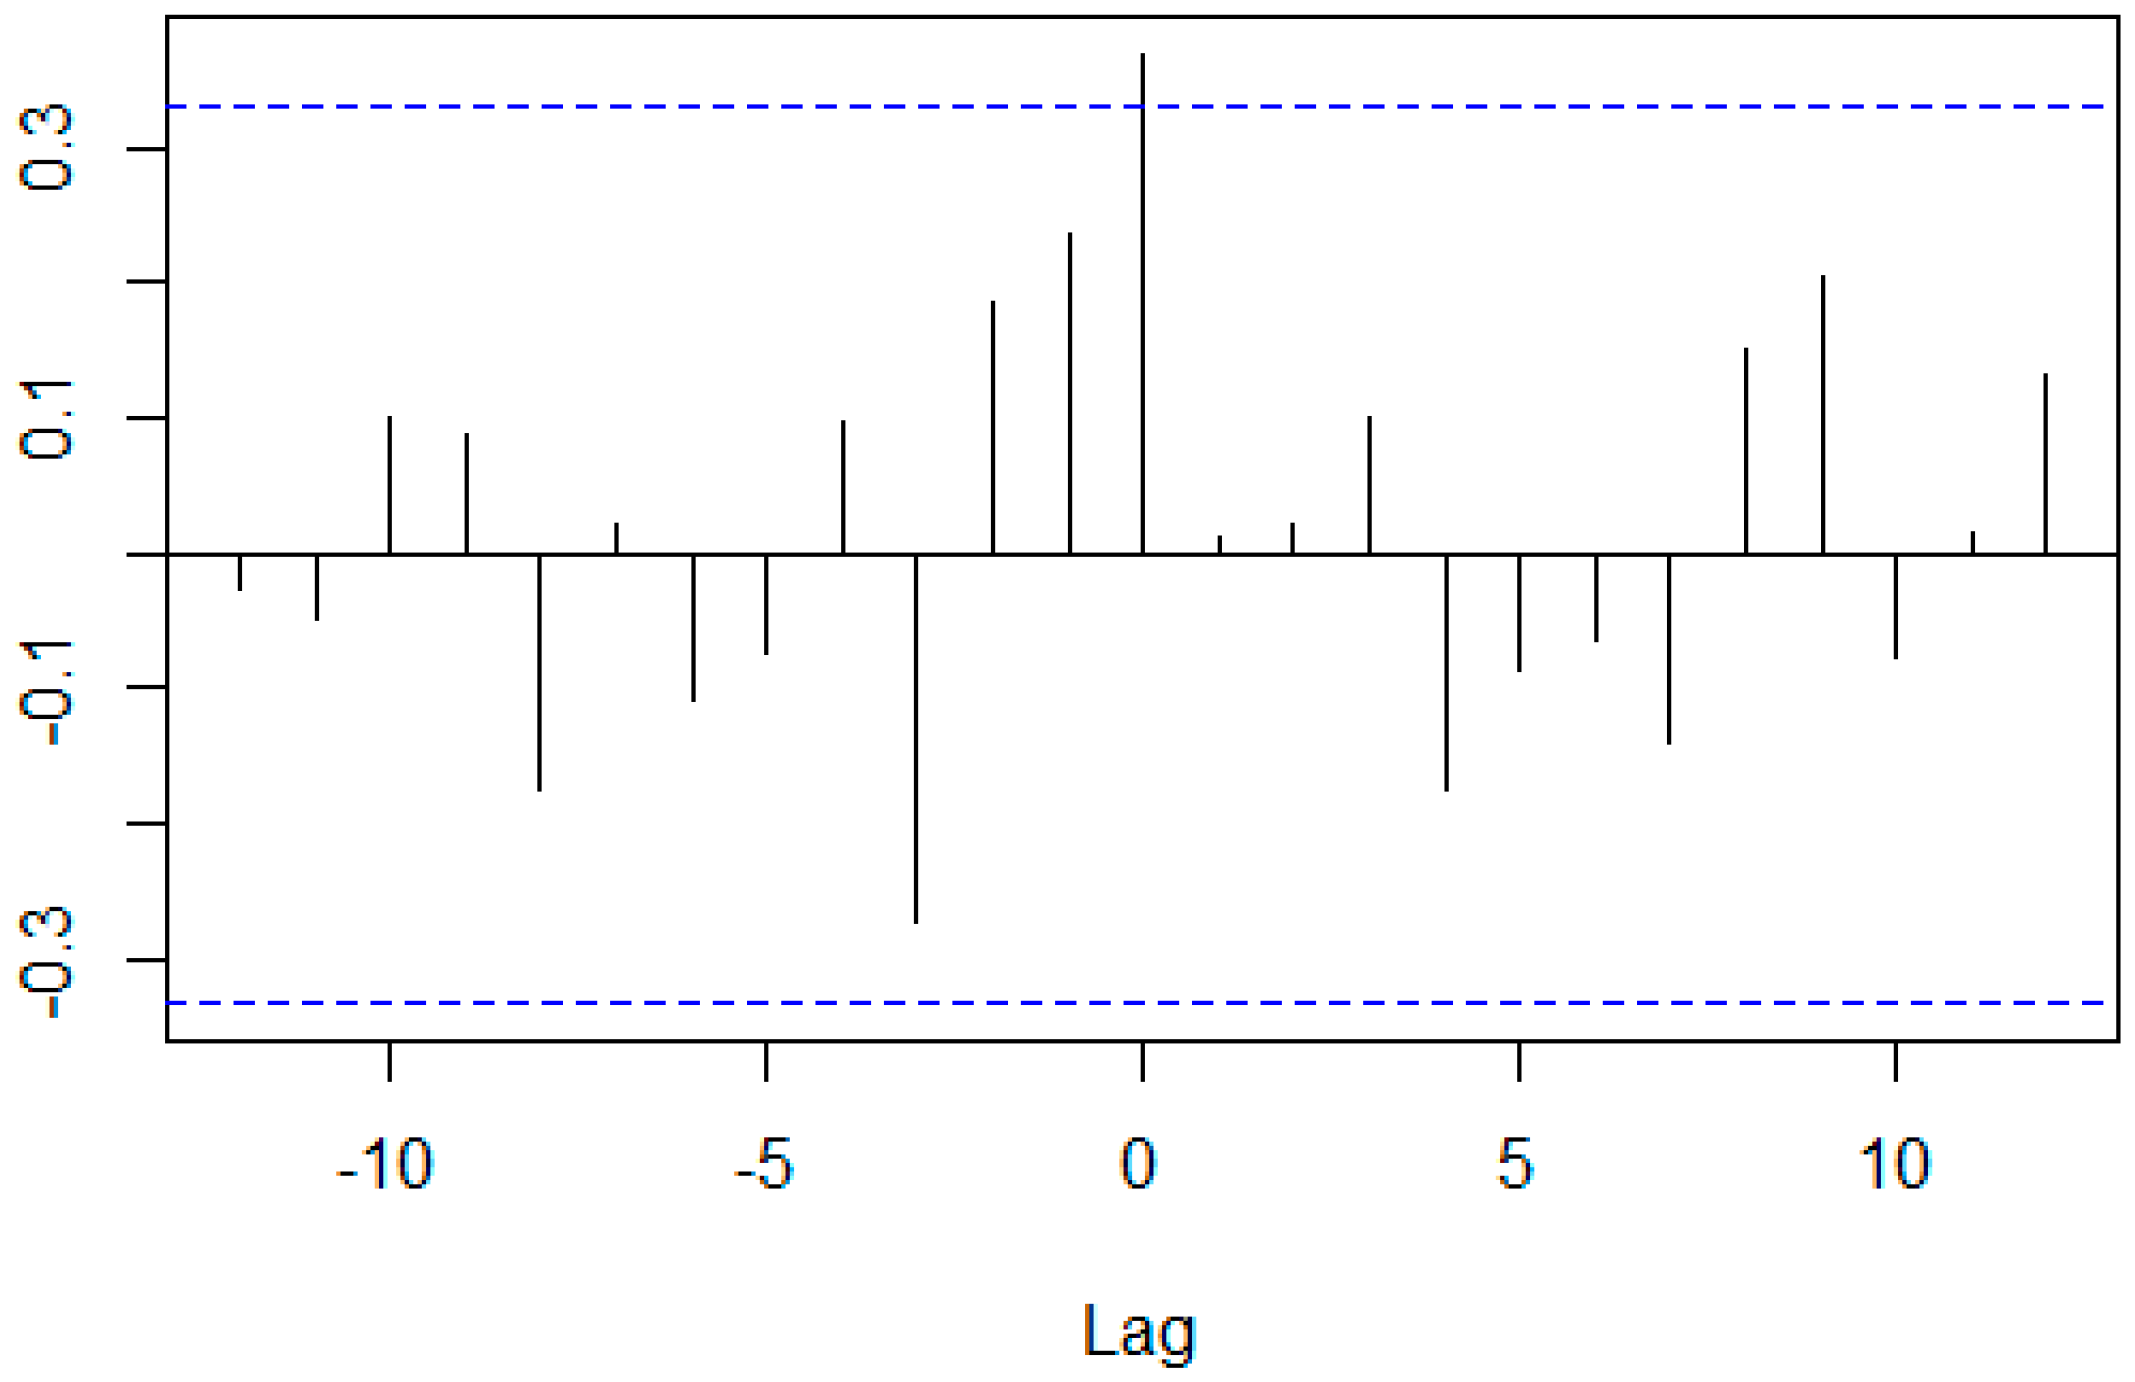
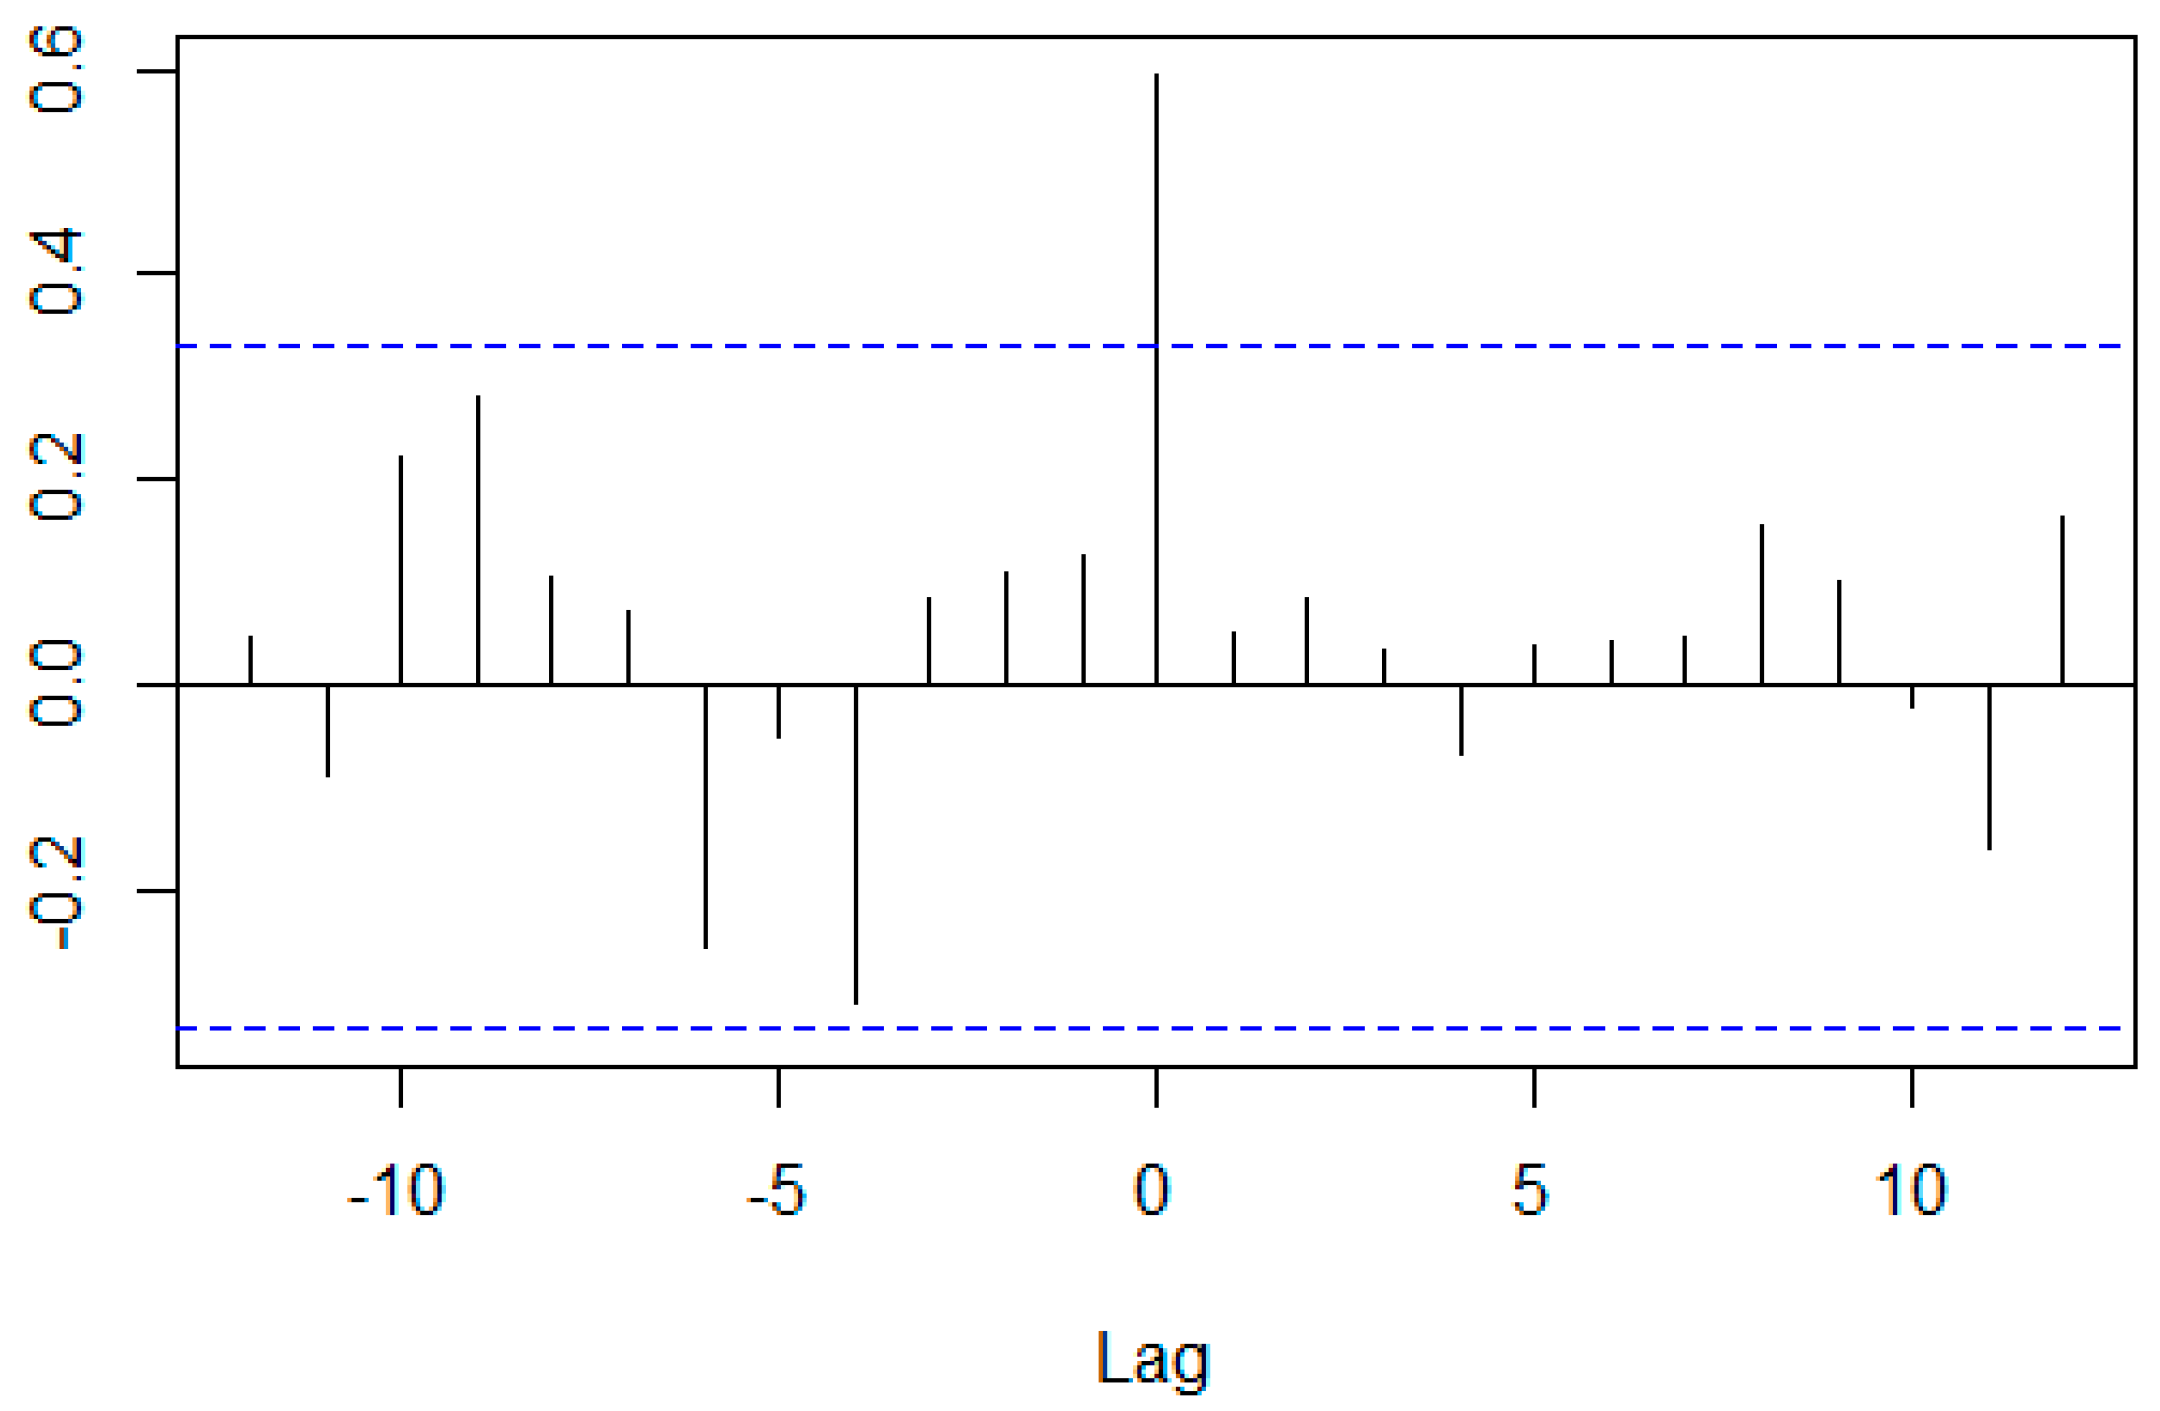
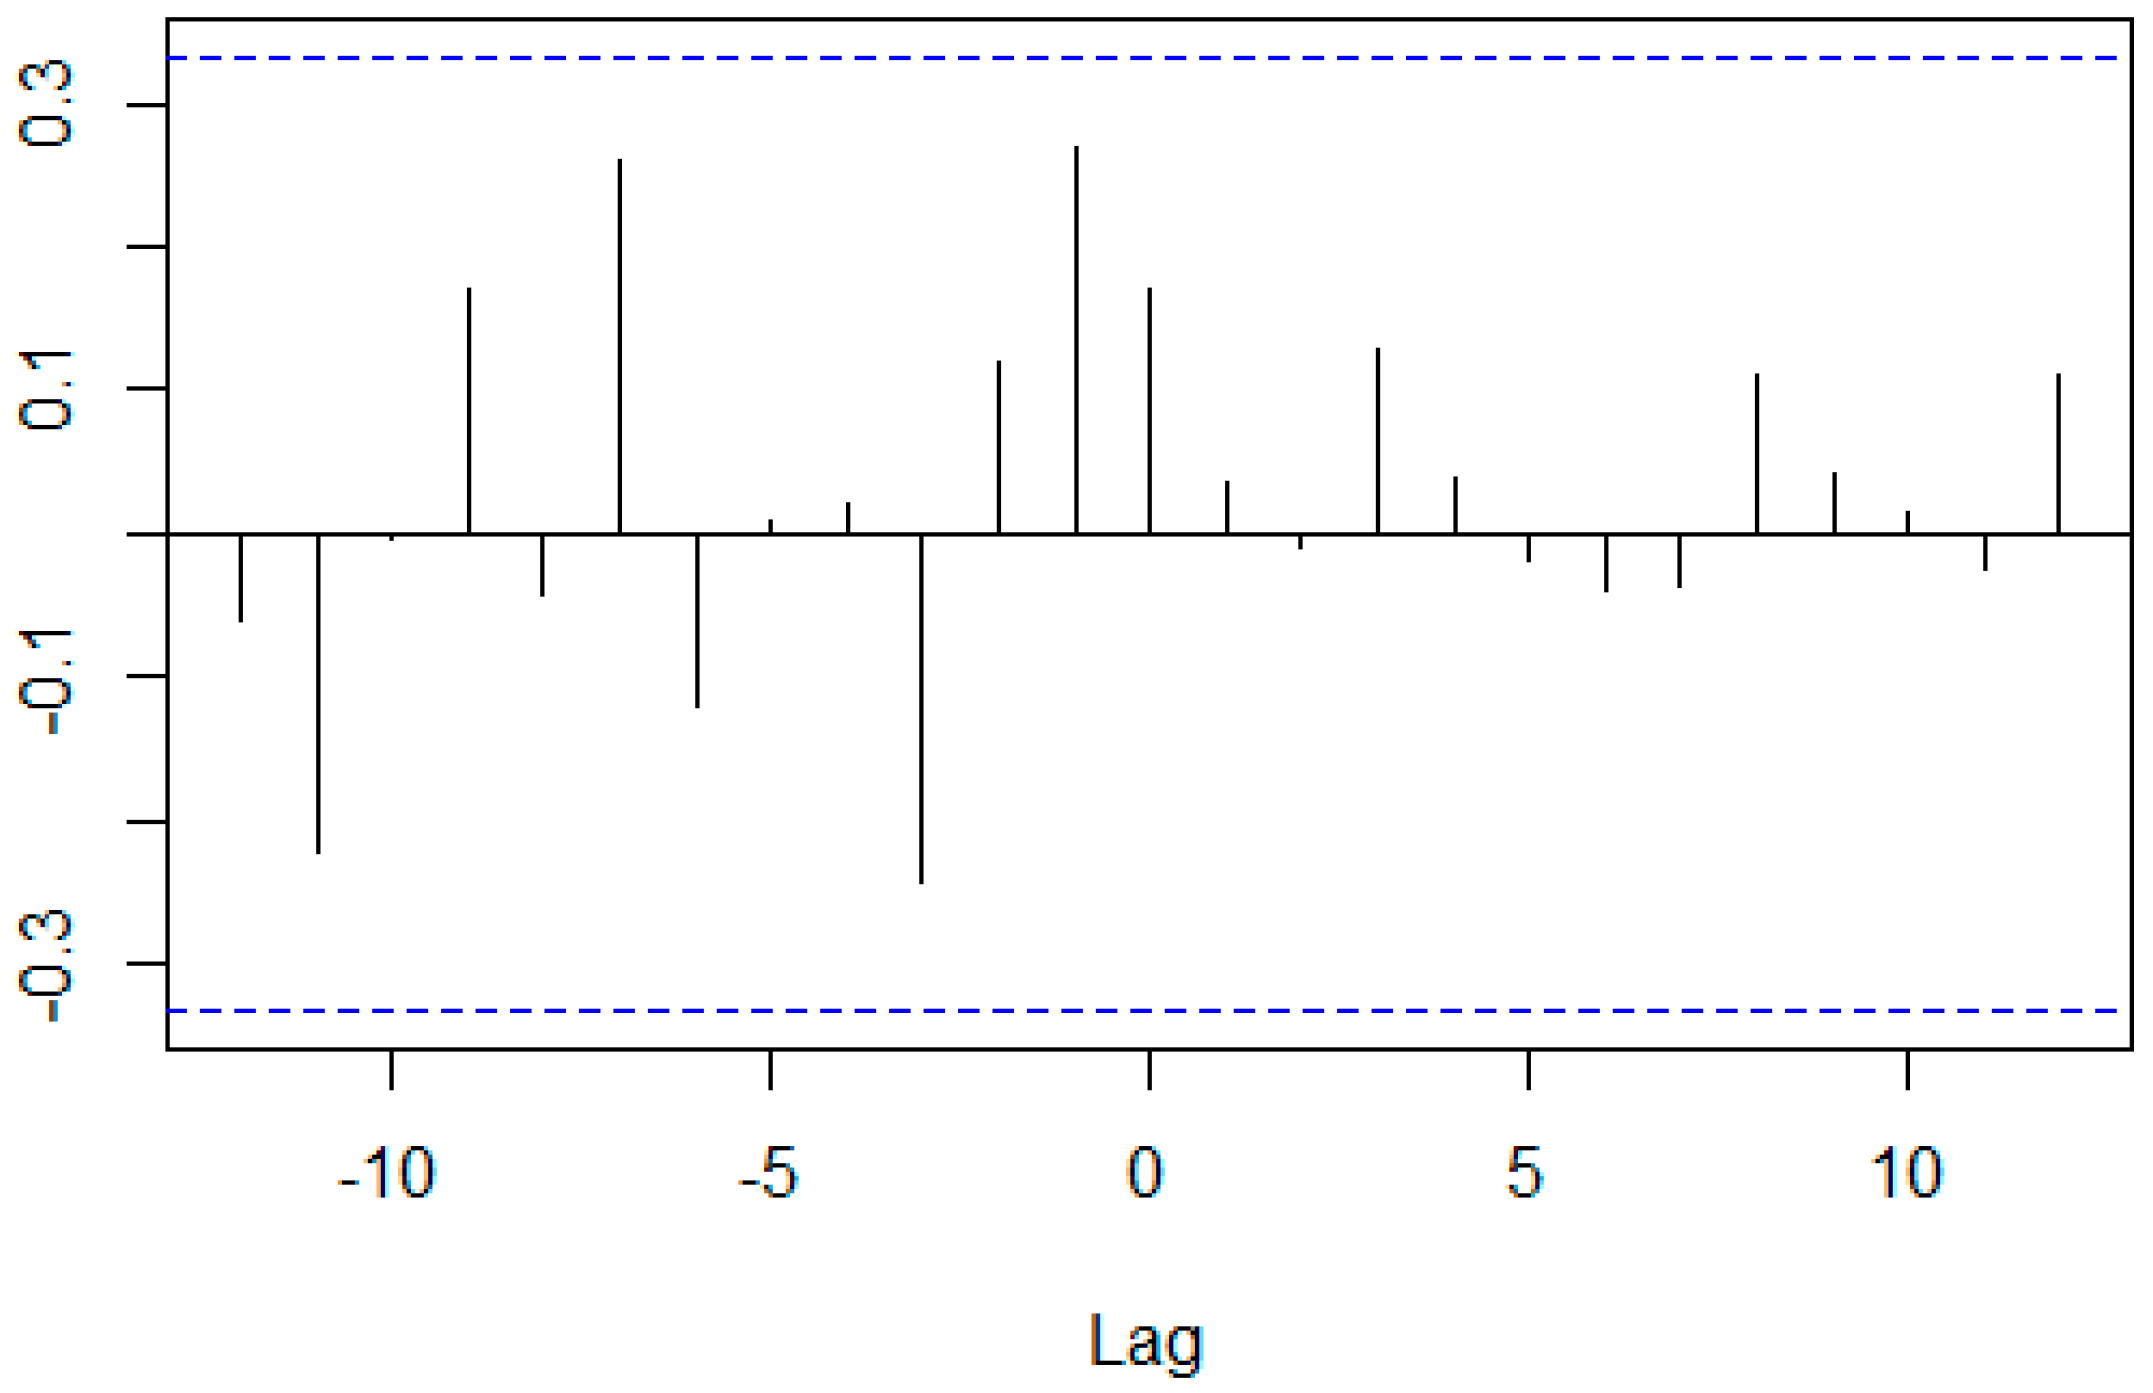
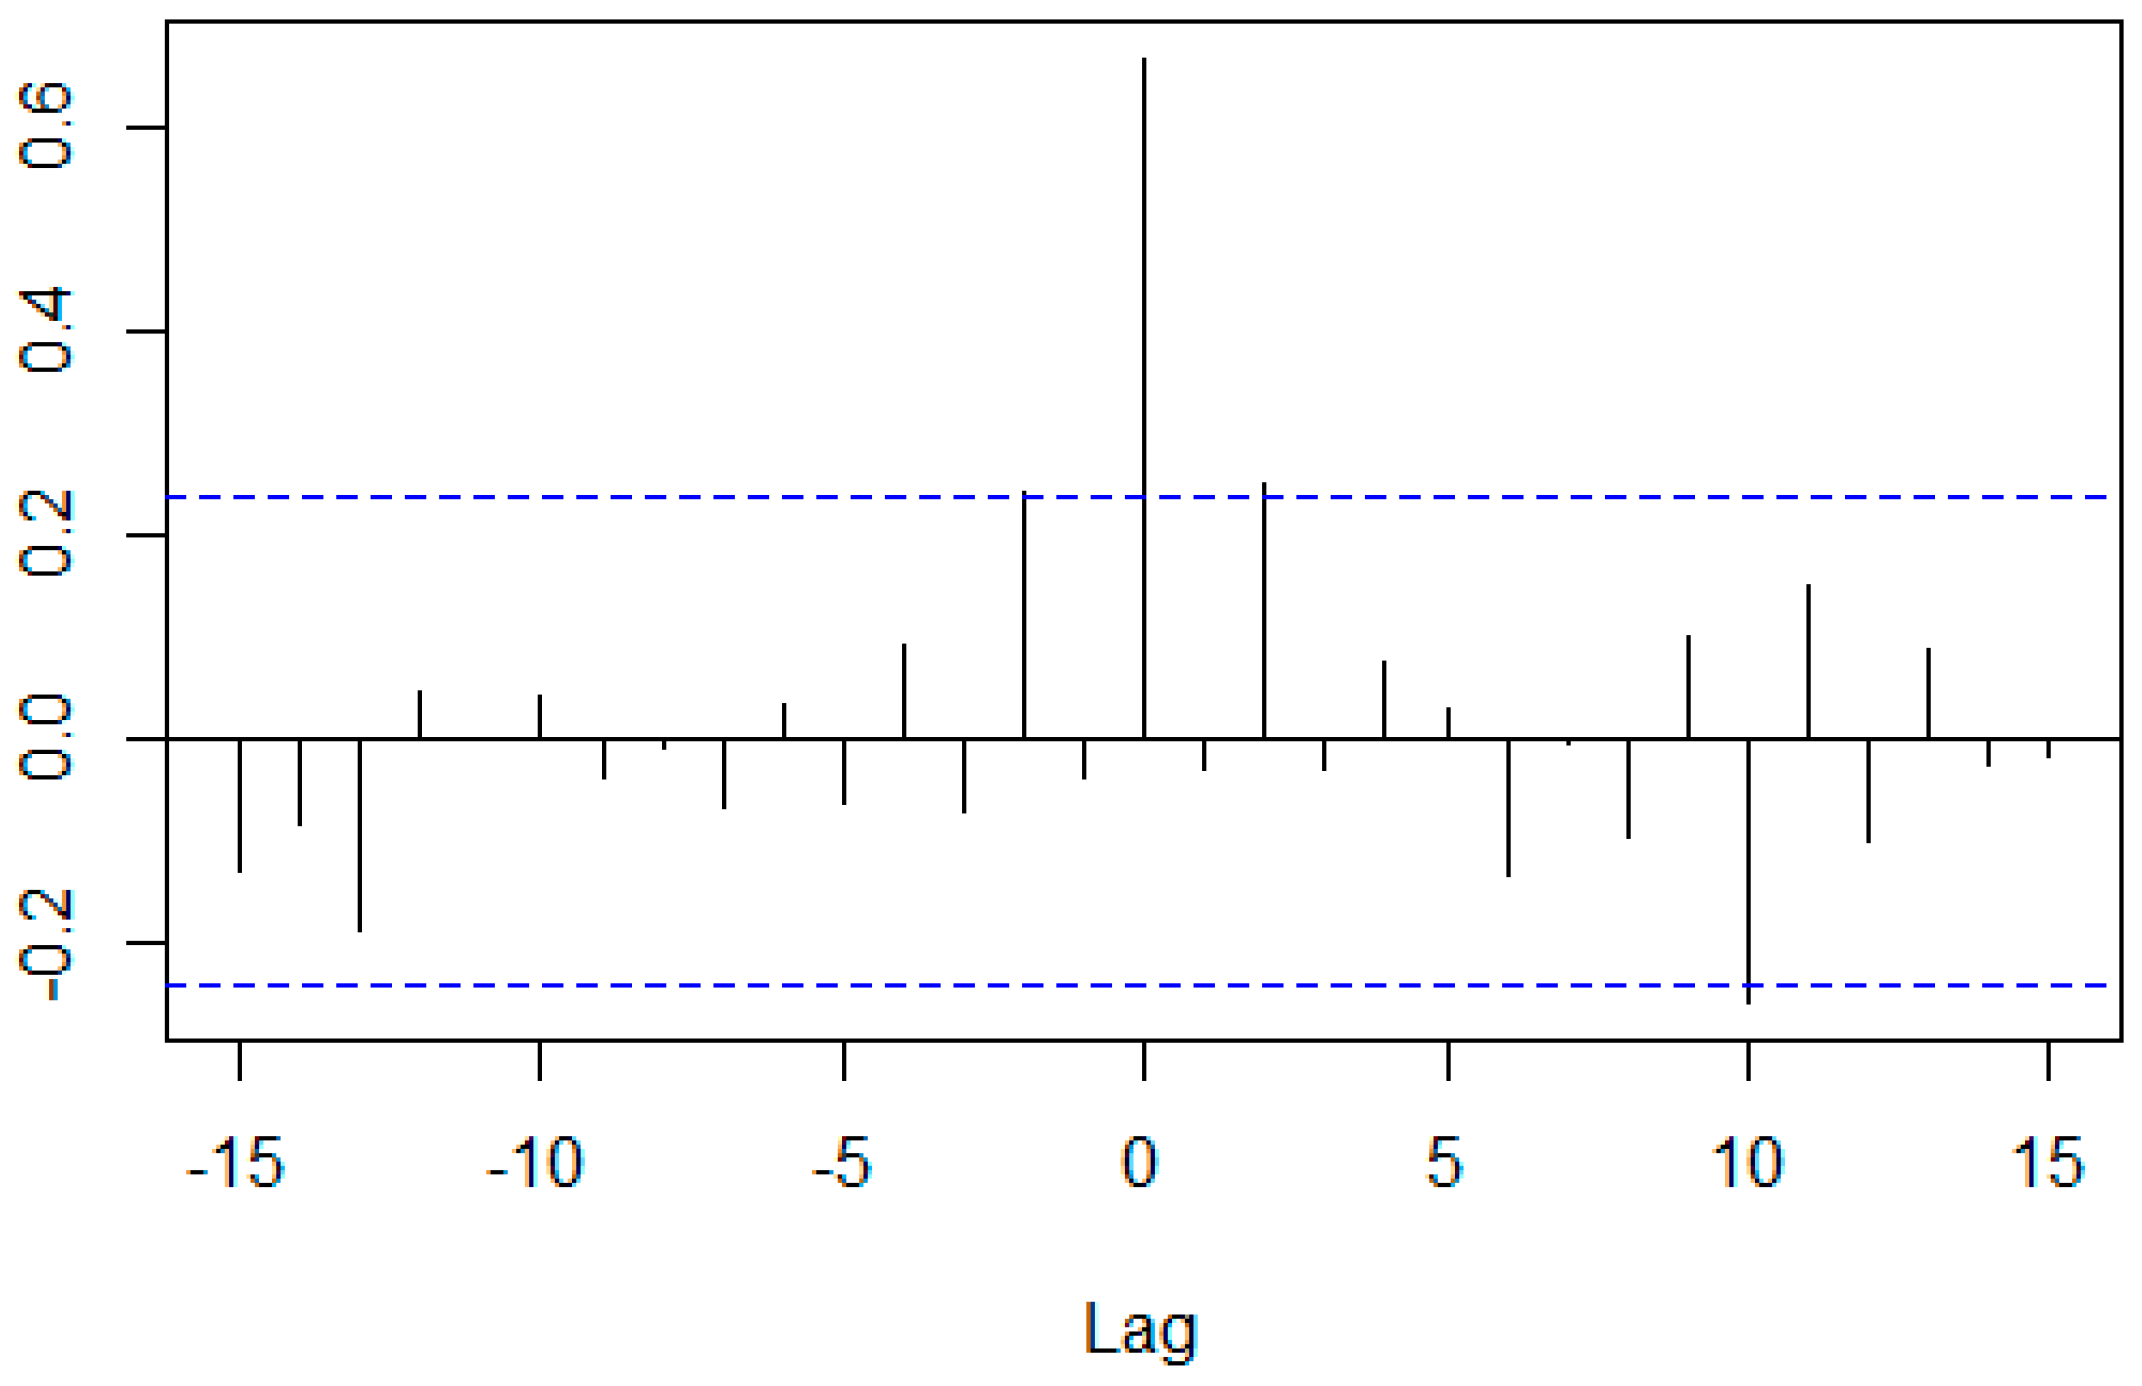
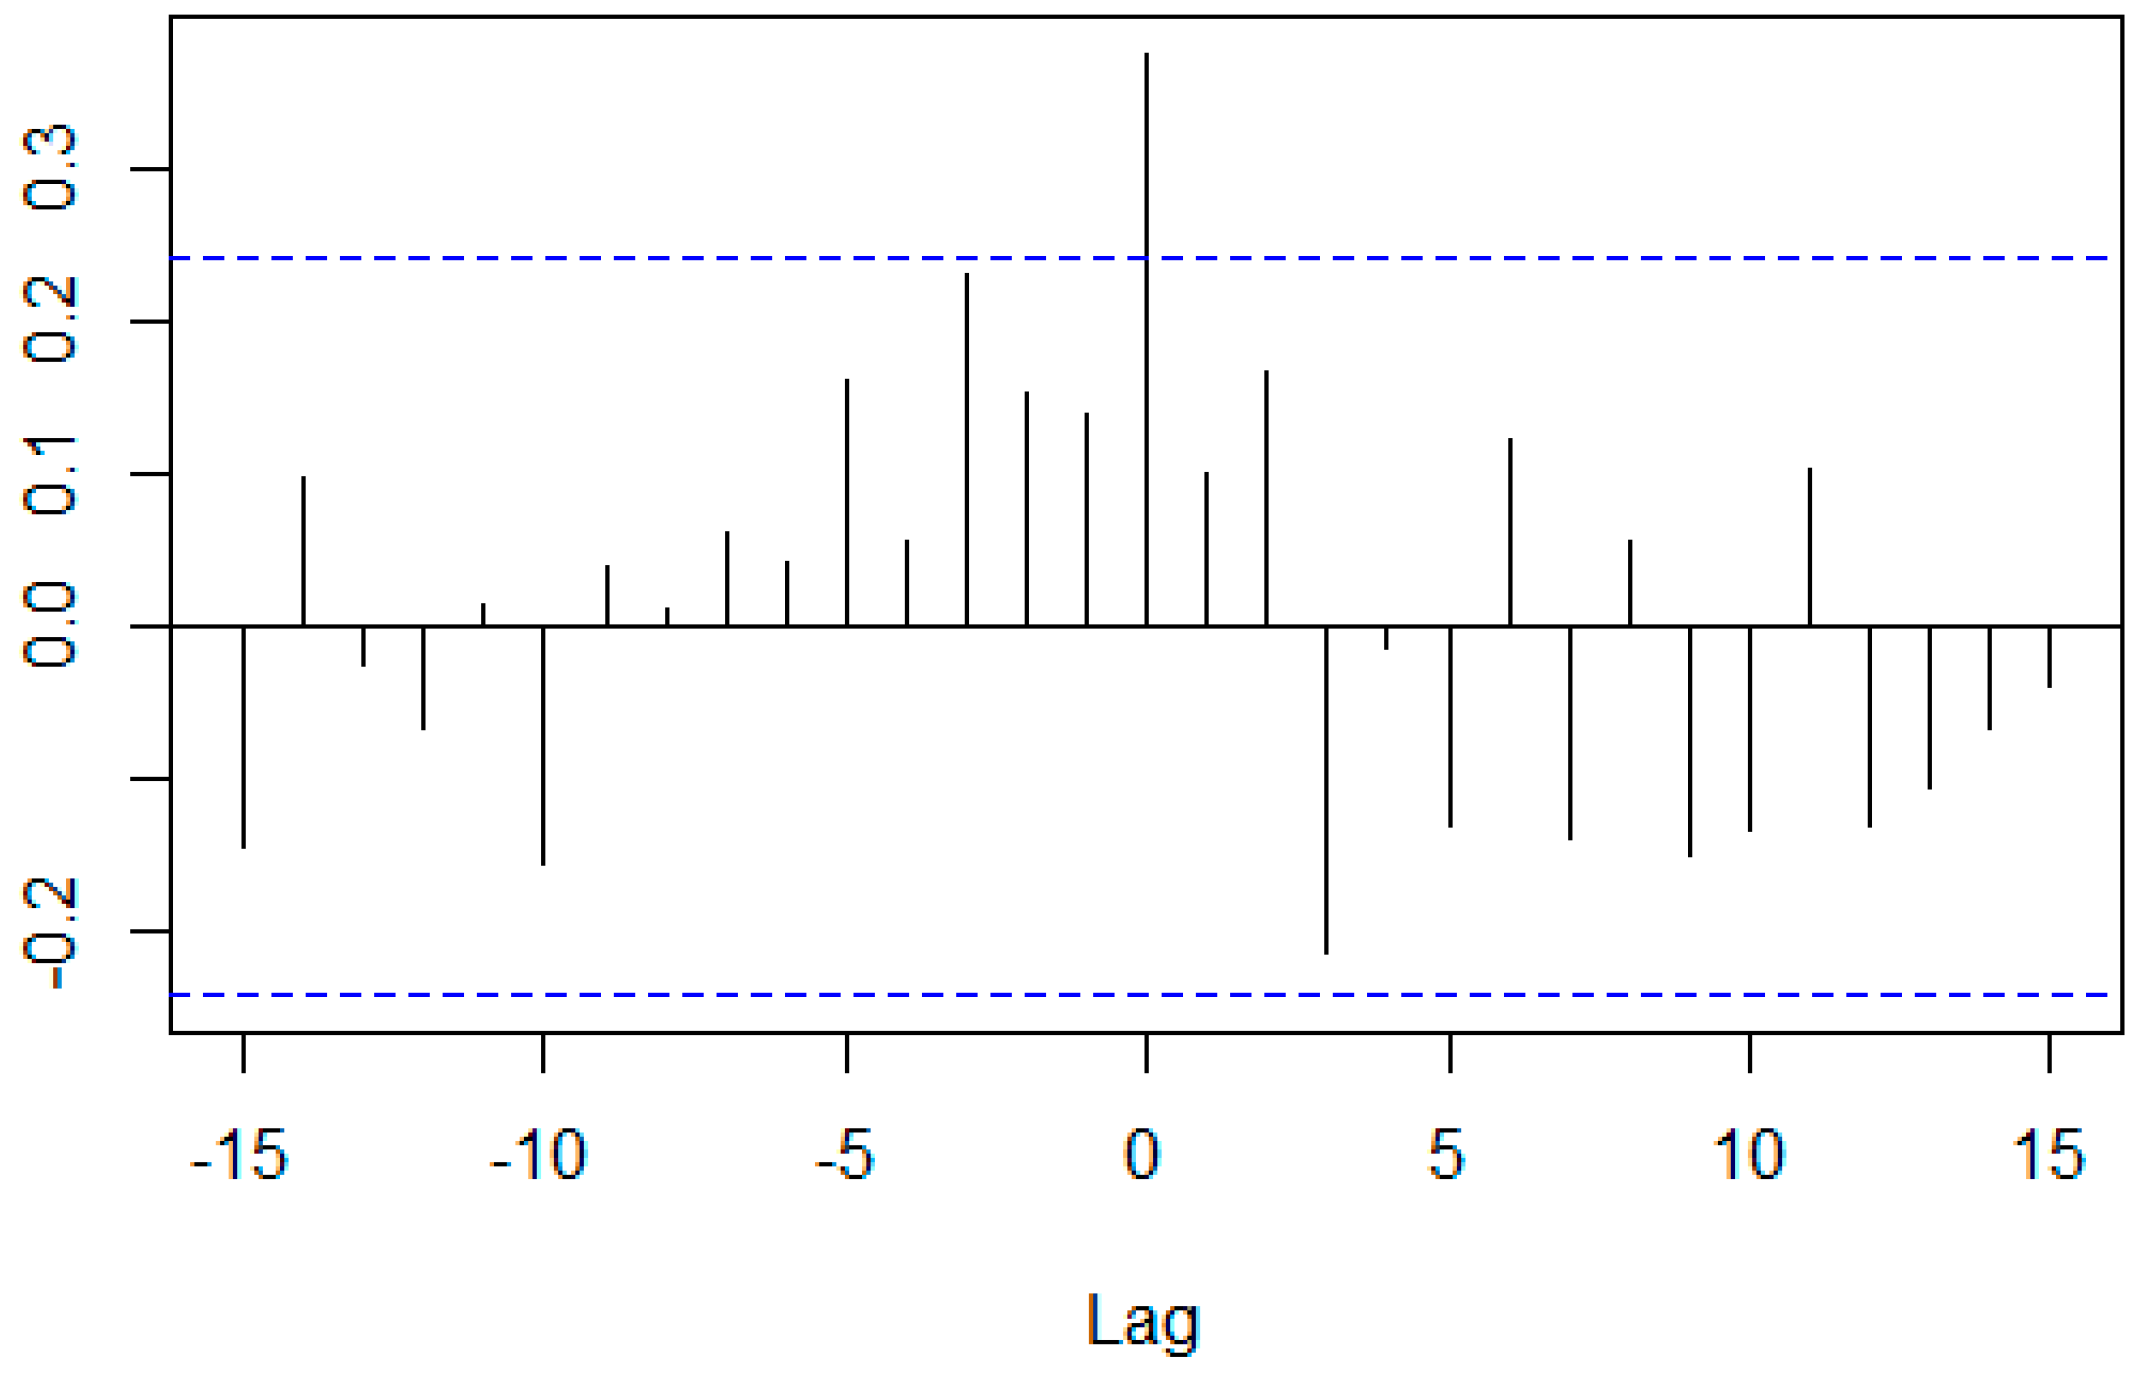
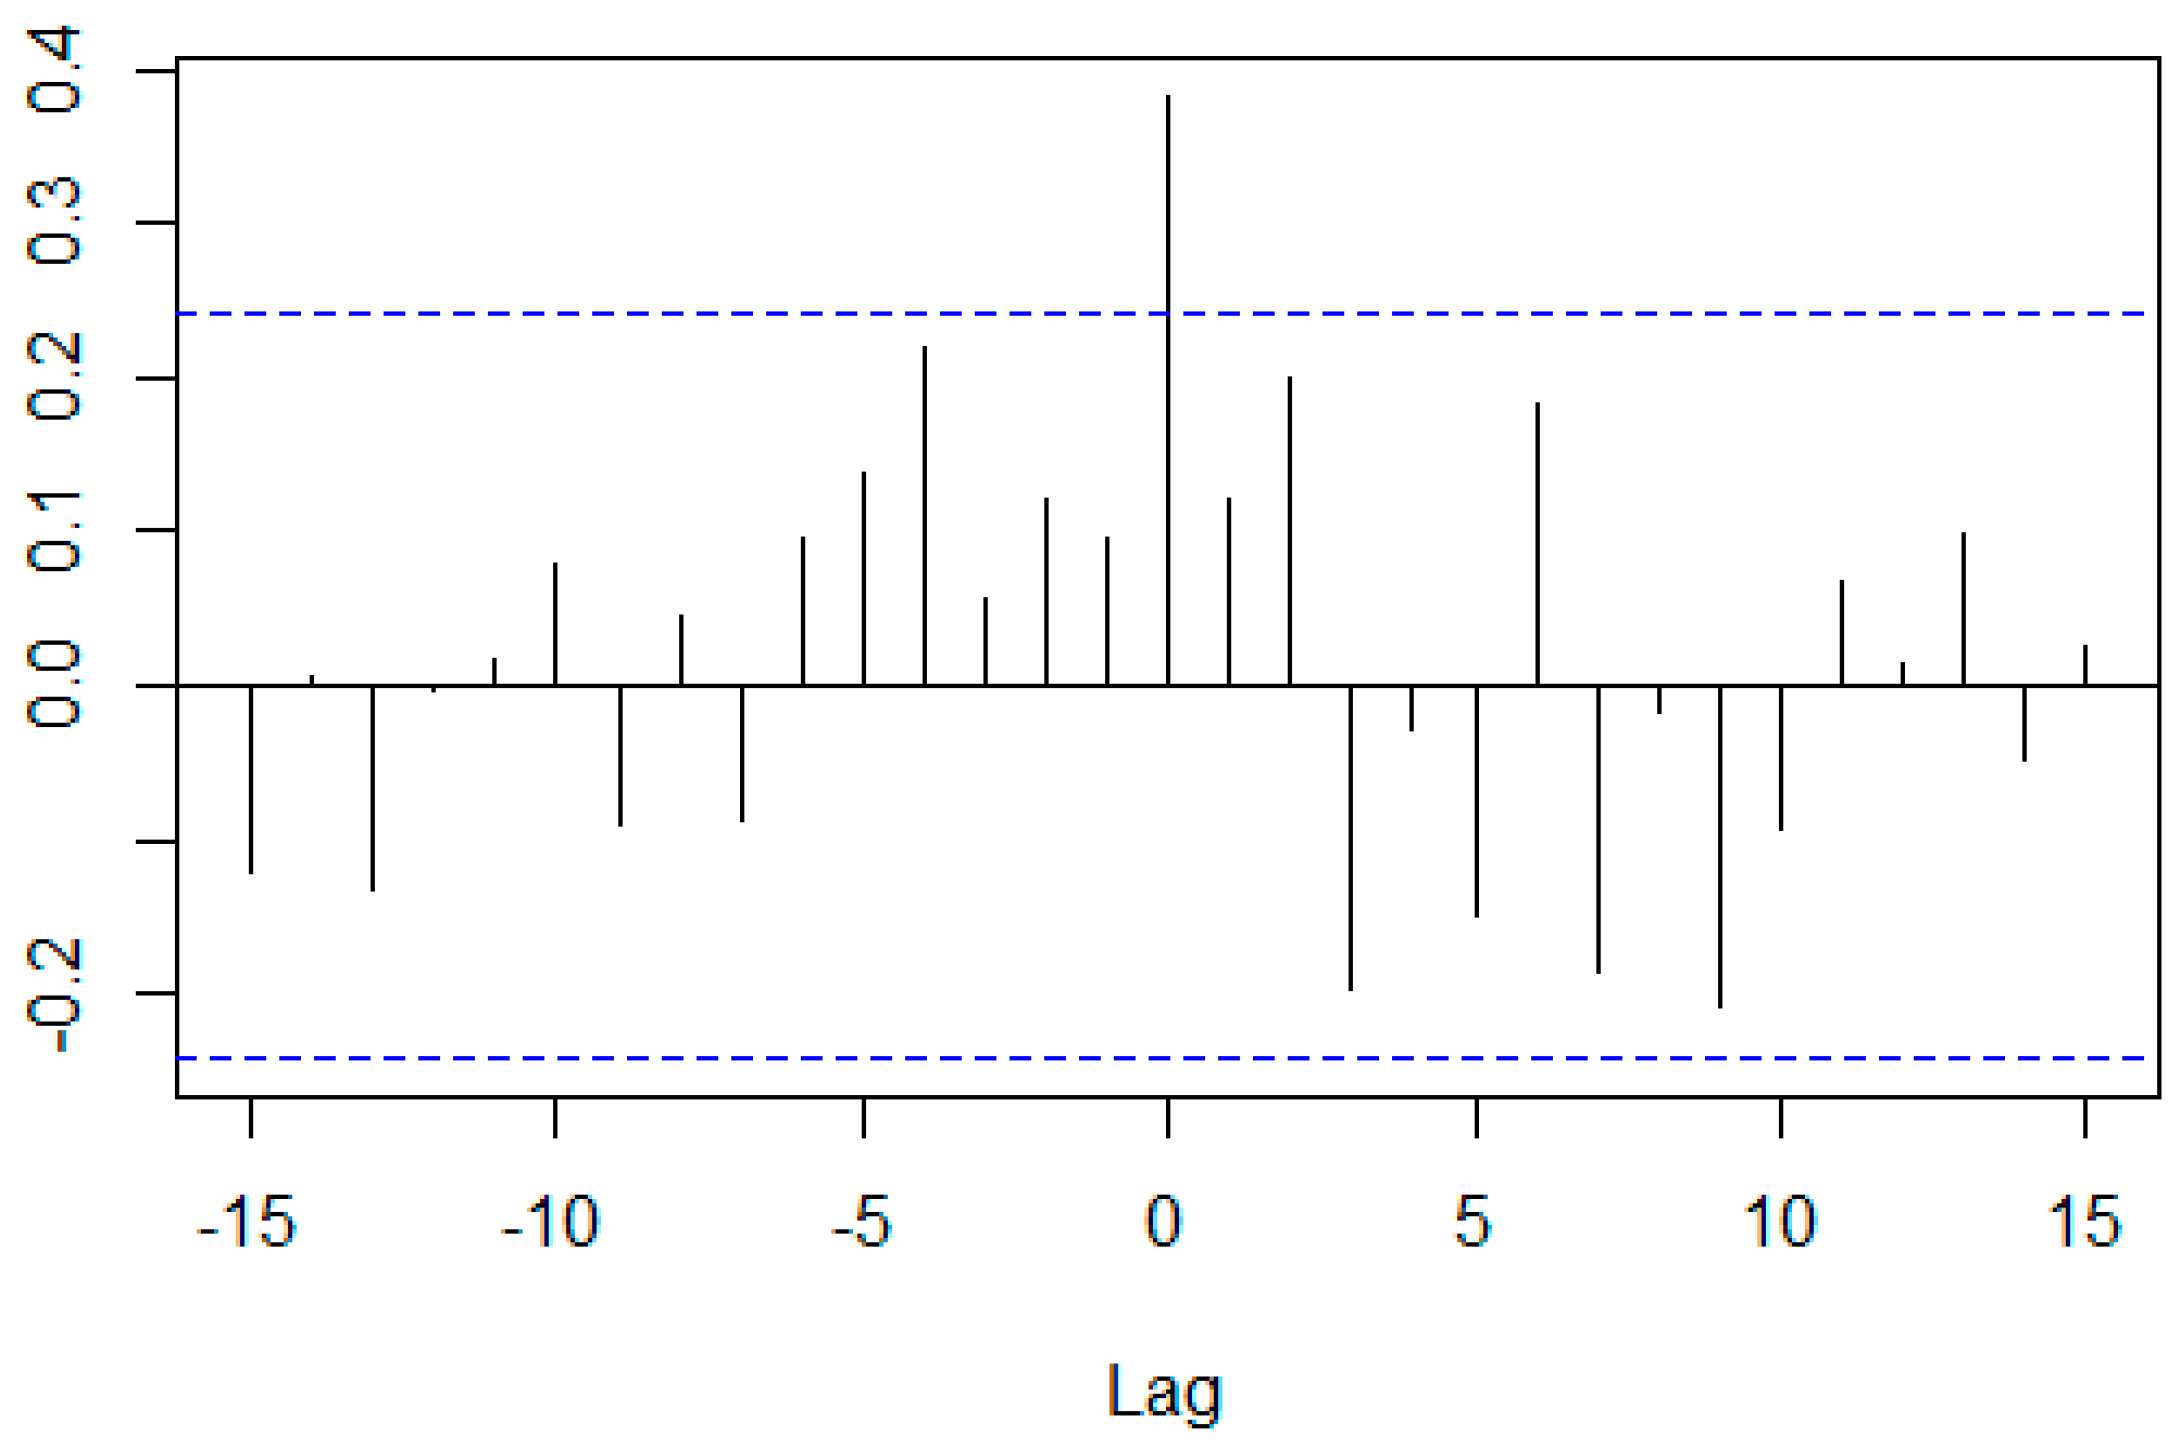
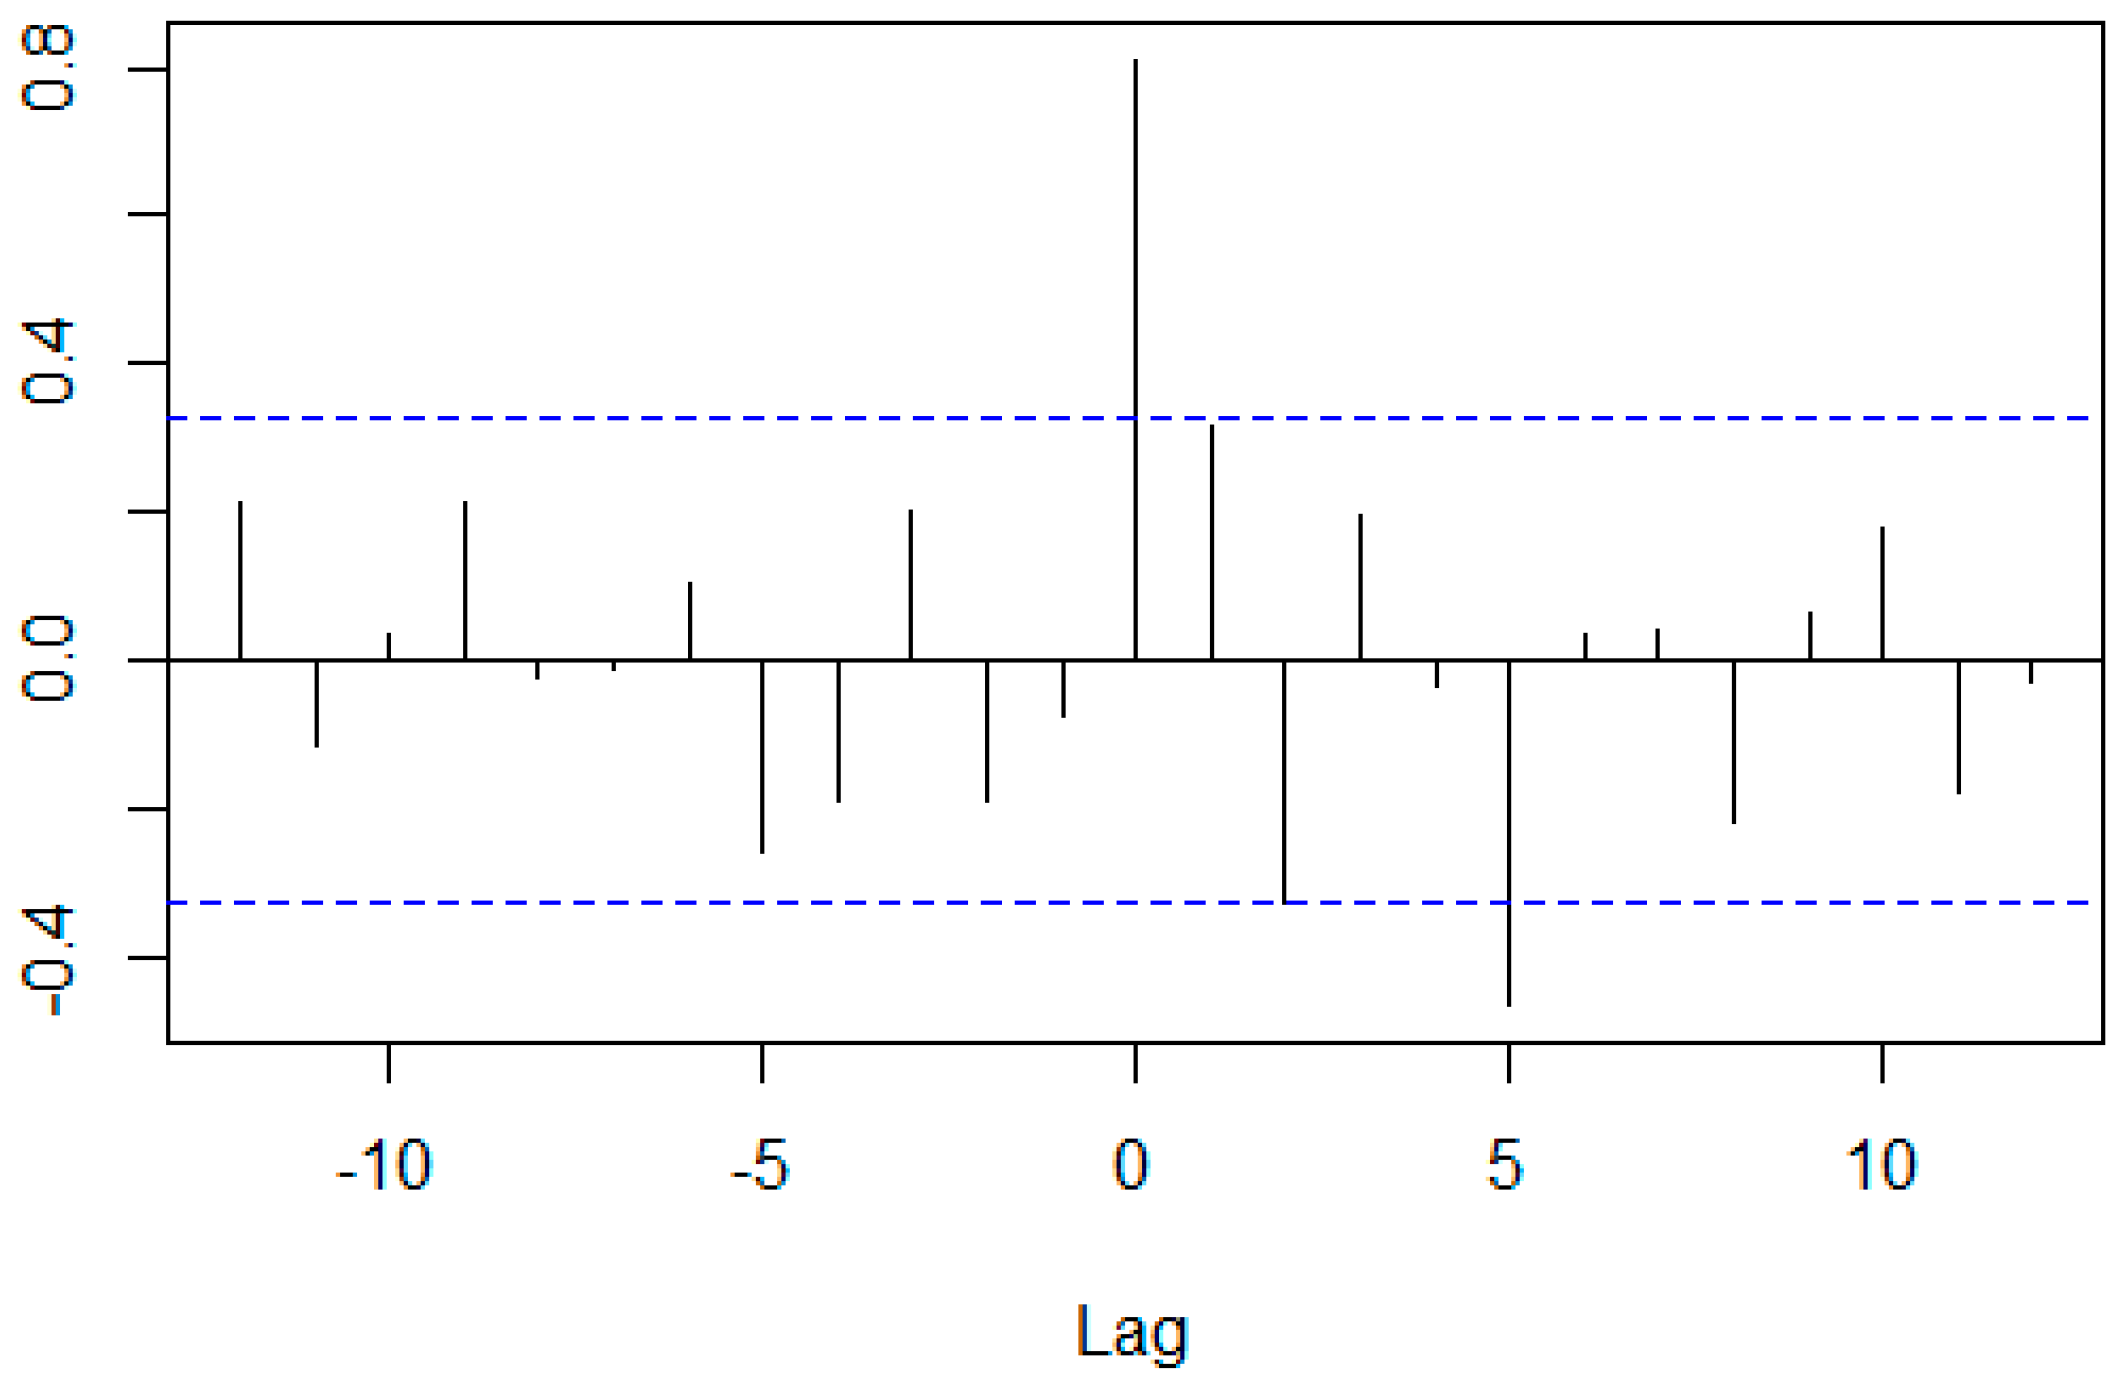
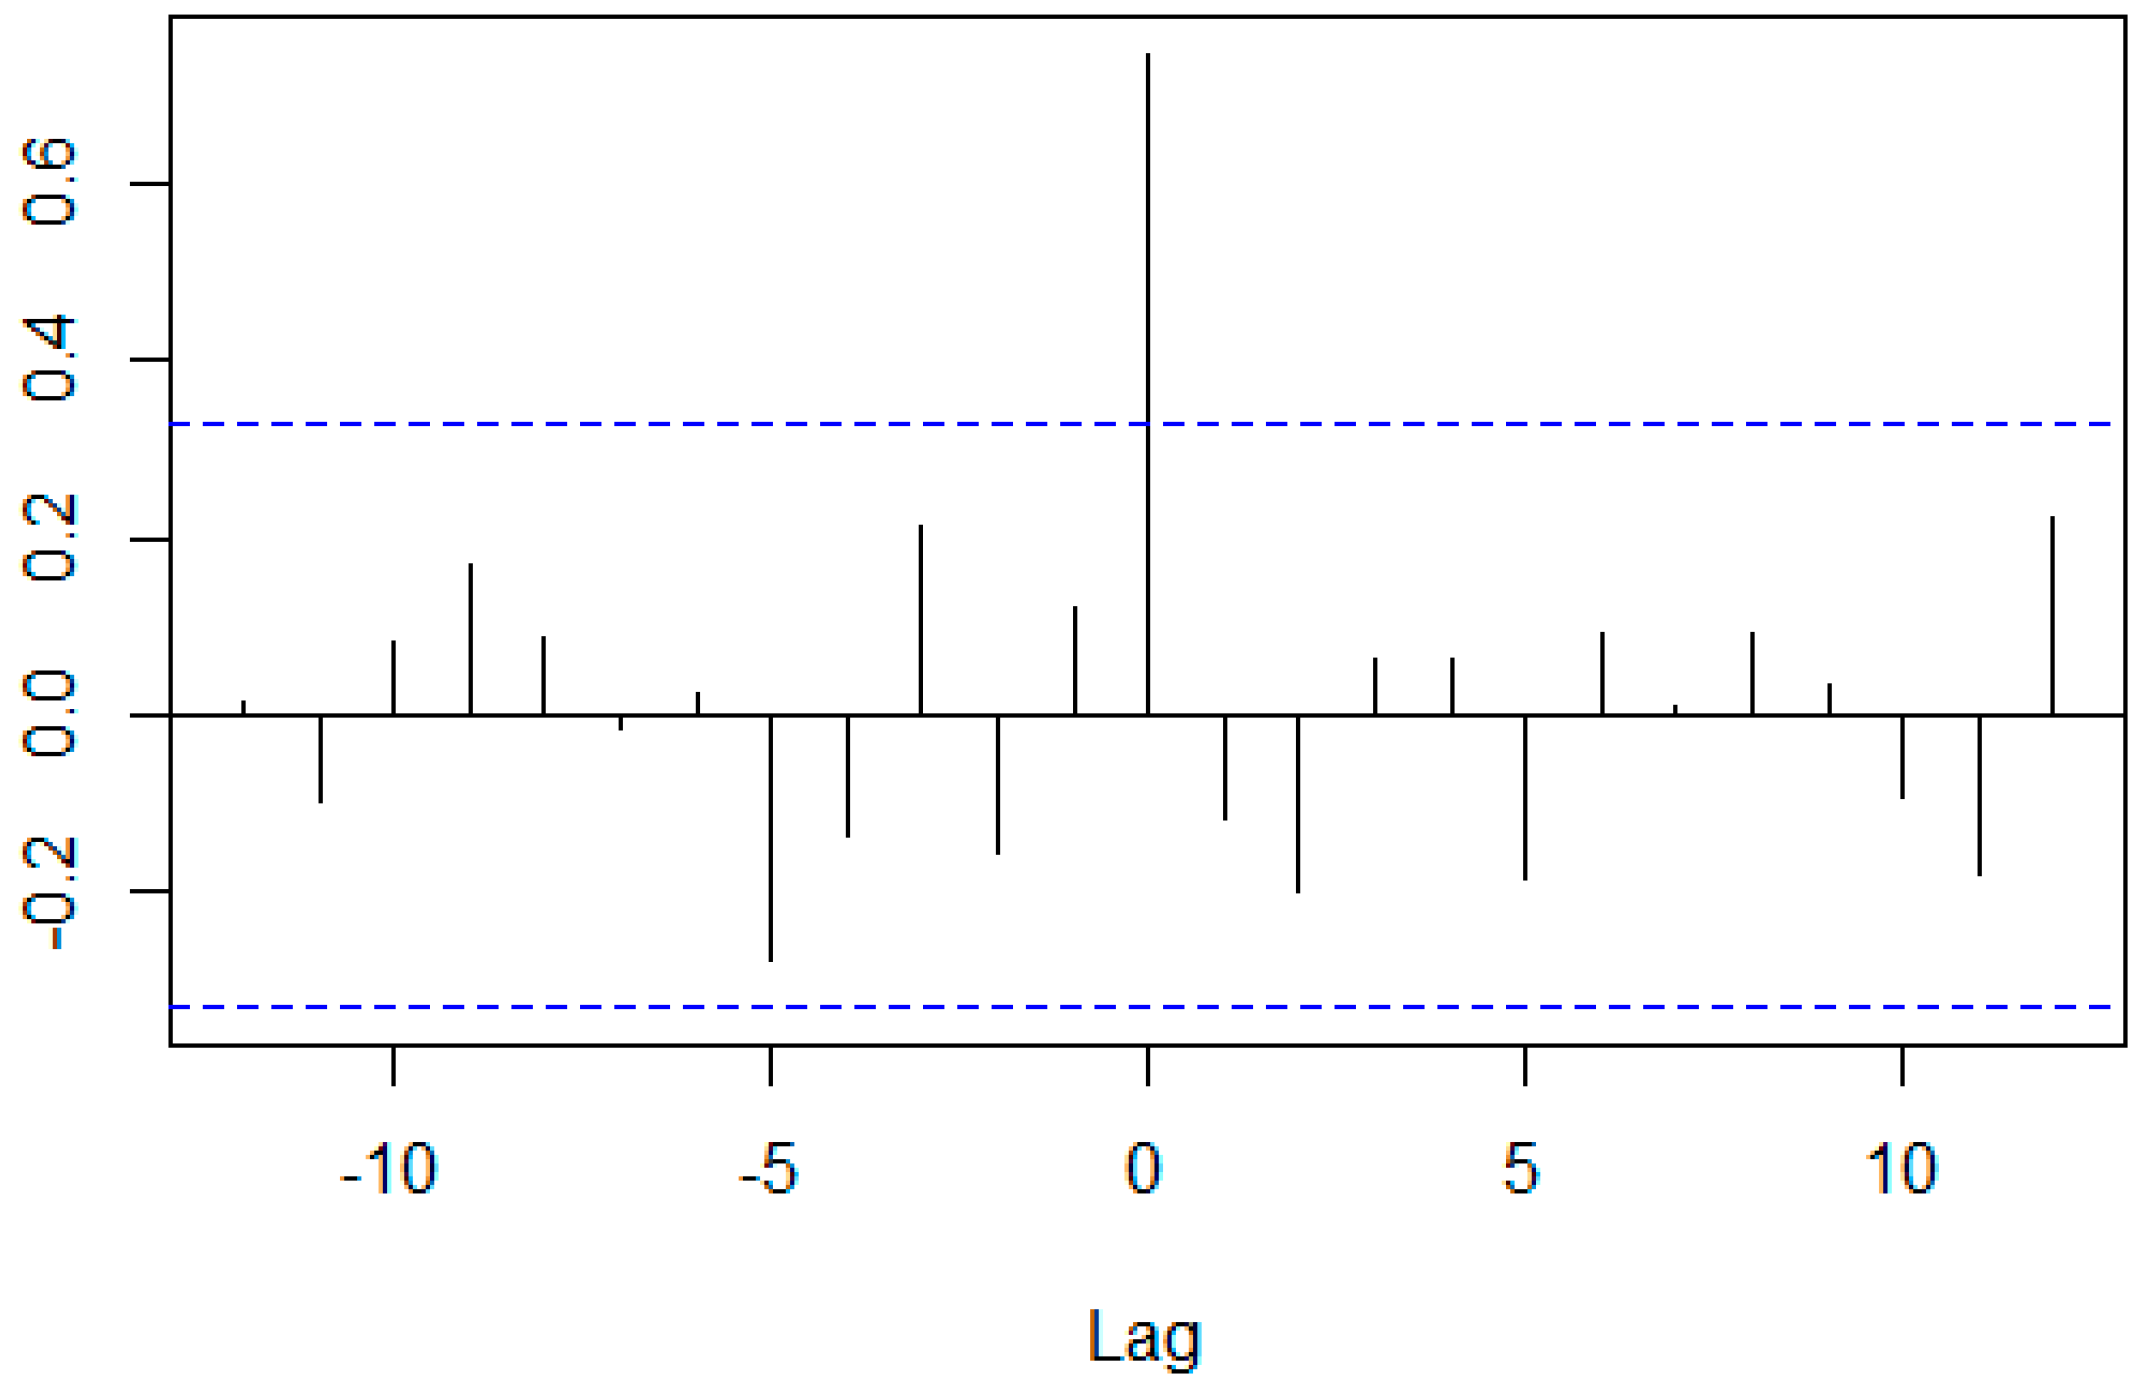
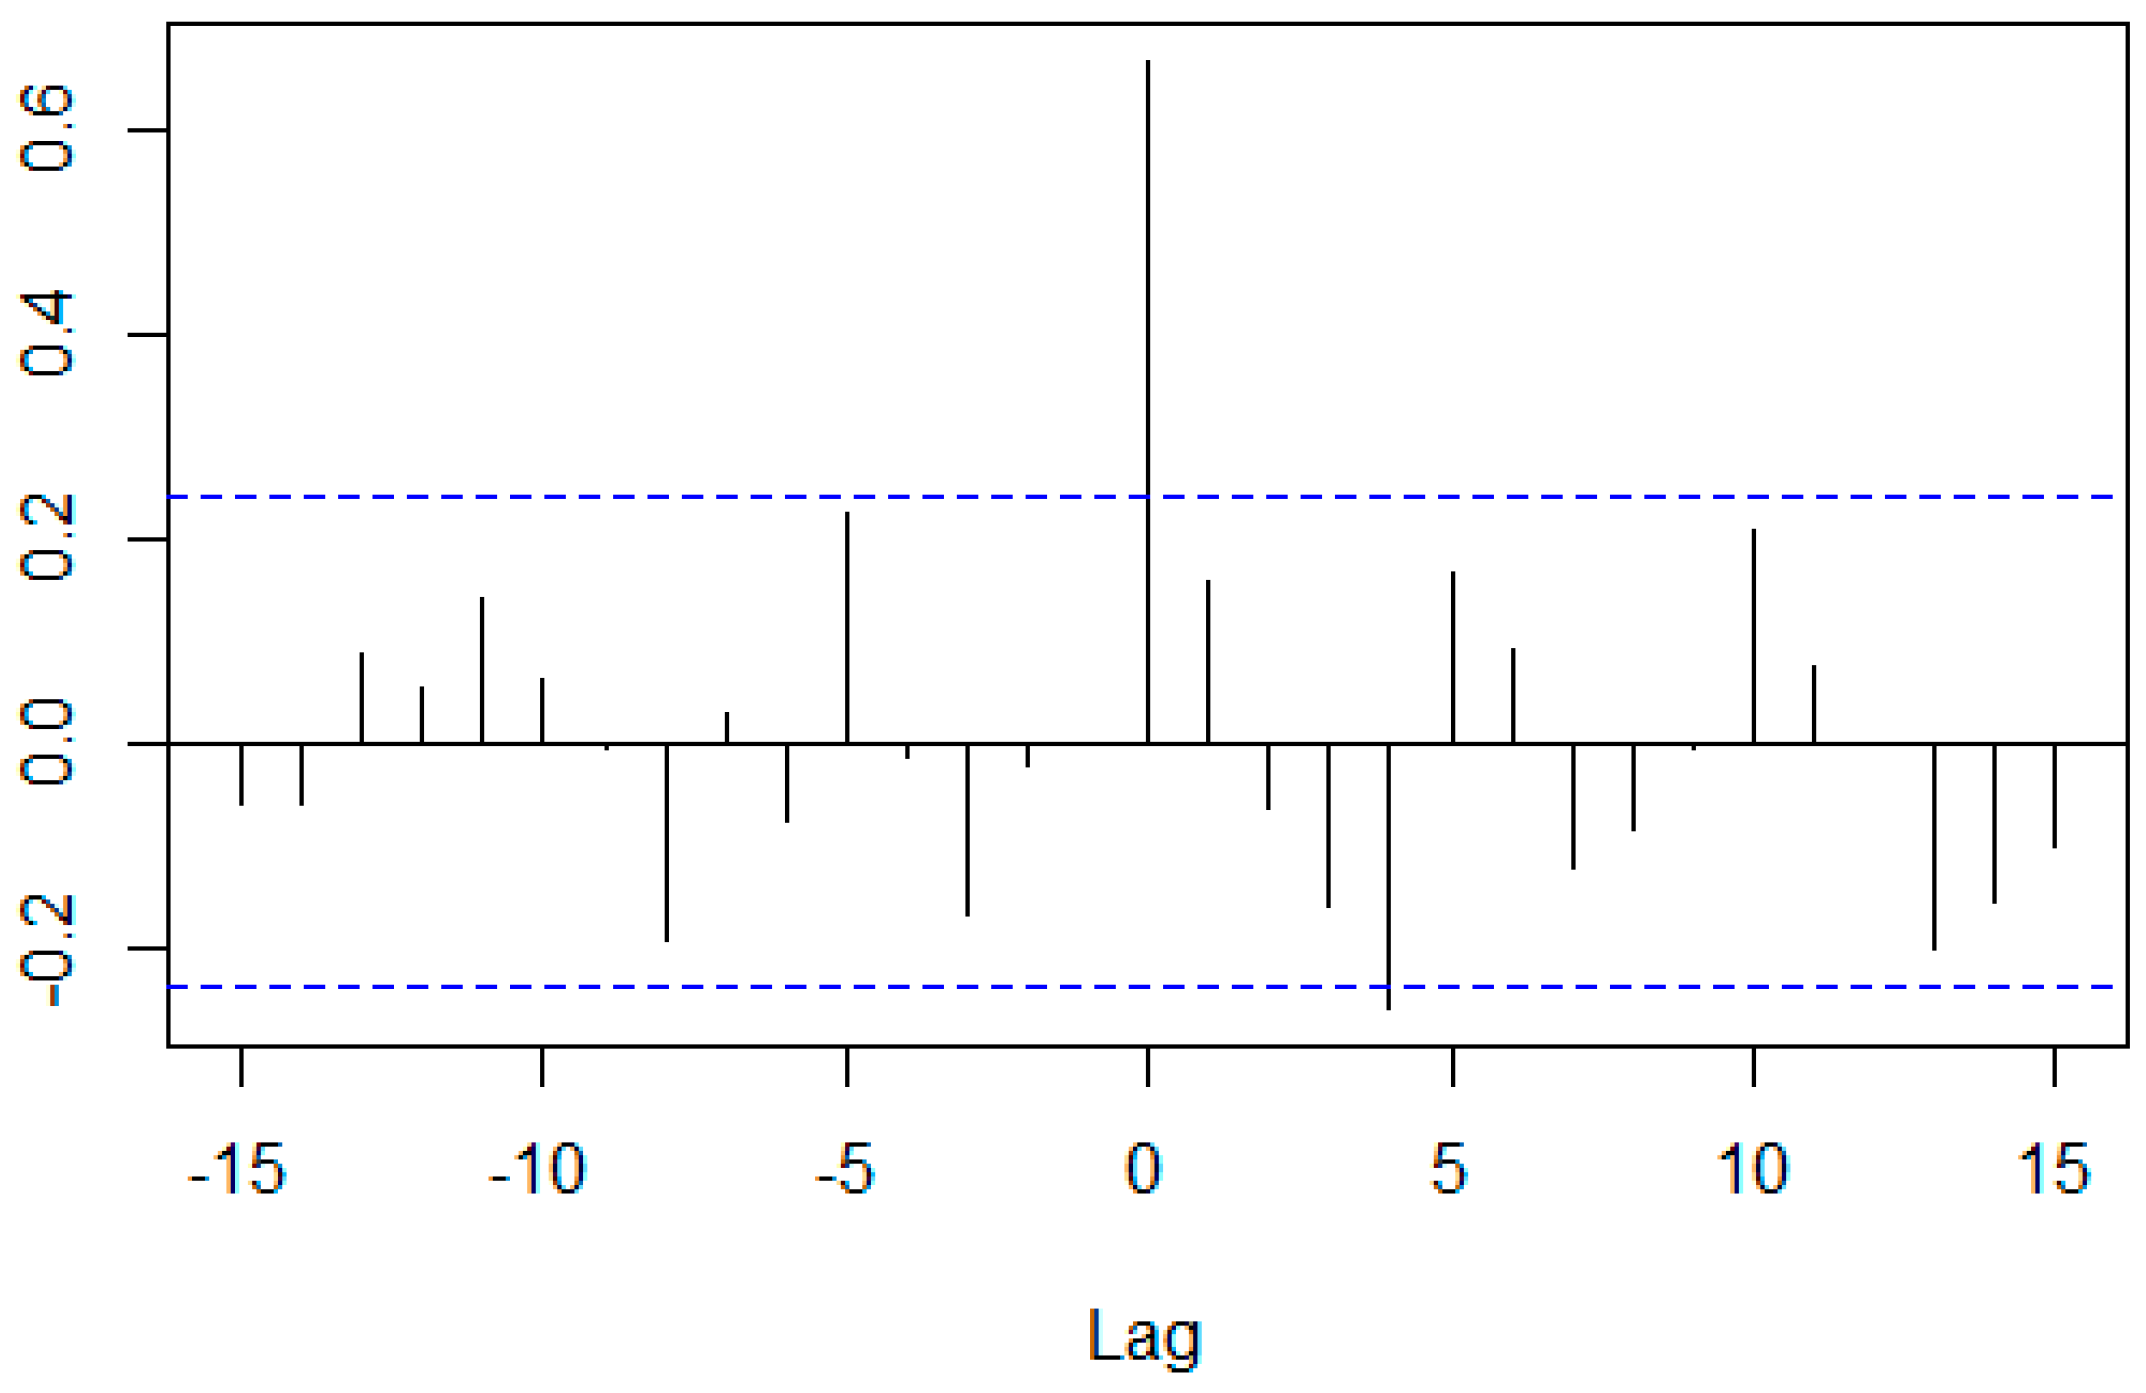
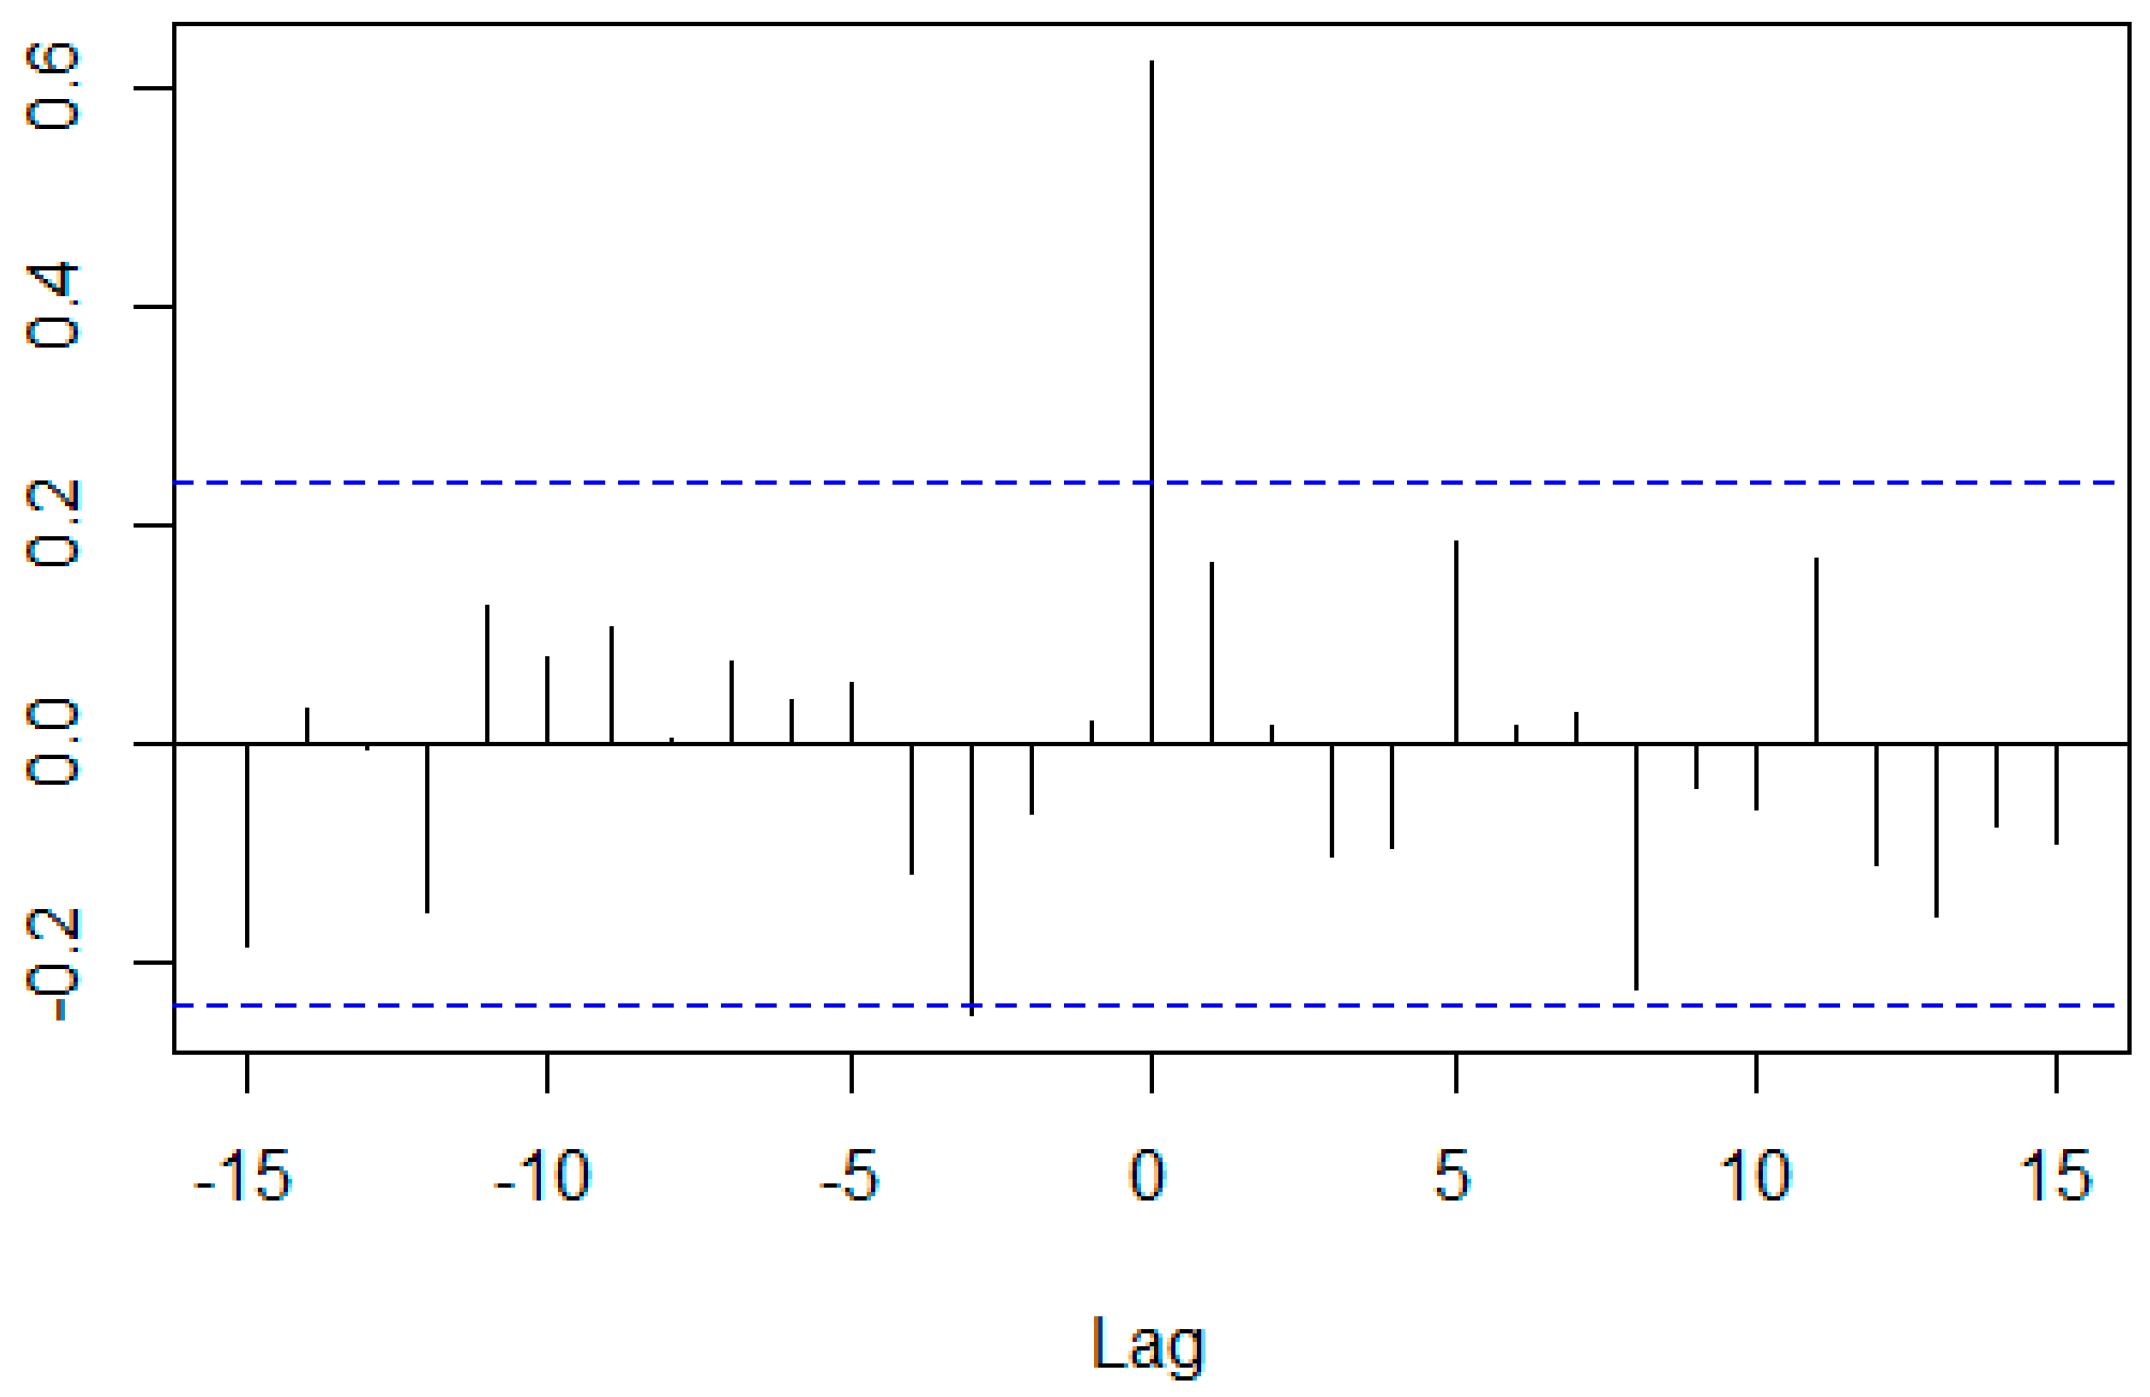
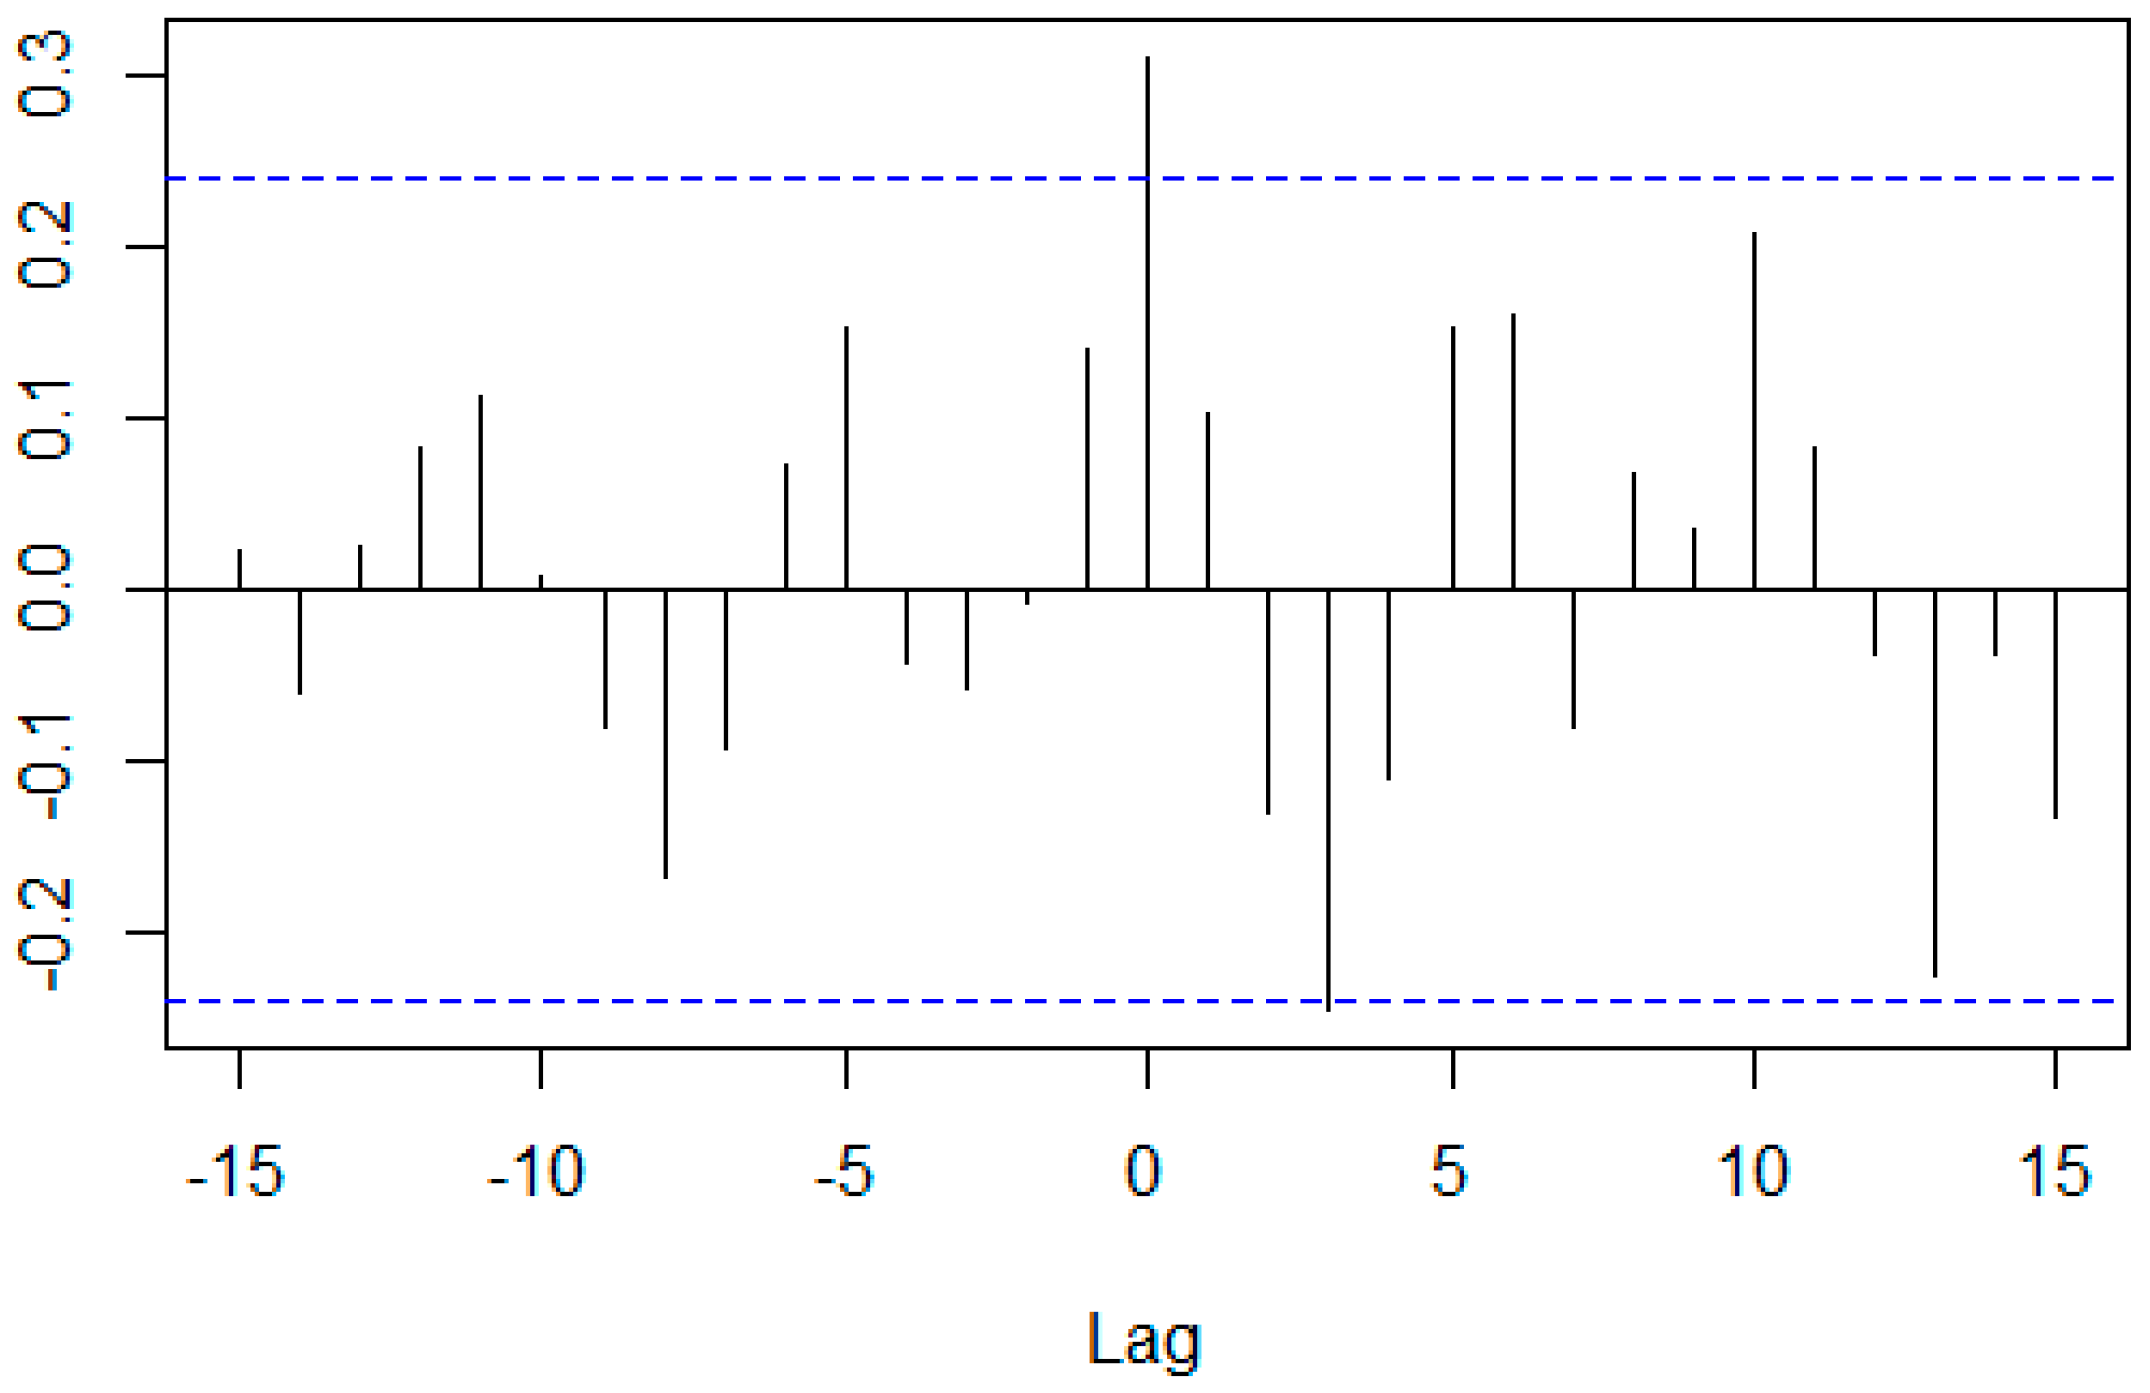
| 7 | The horizontal blue lines are the approximate 95% confidence interval. |
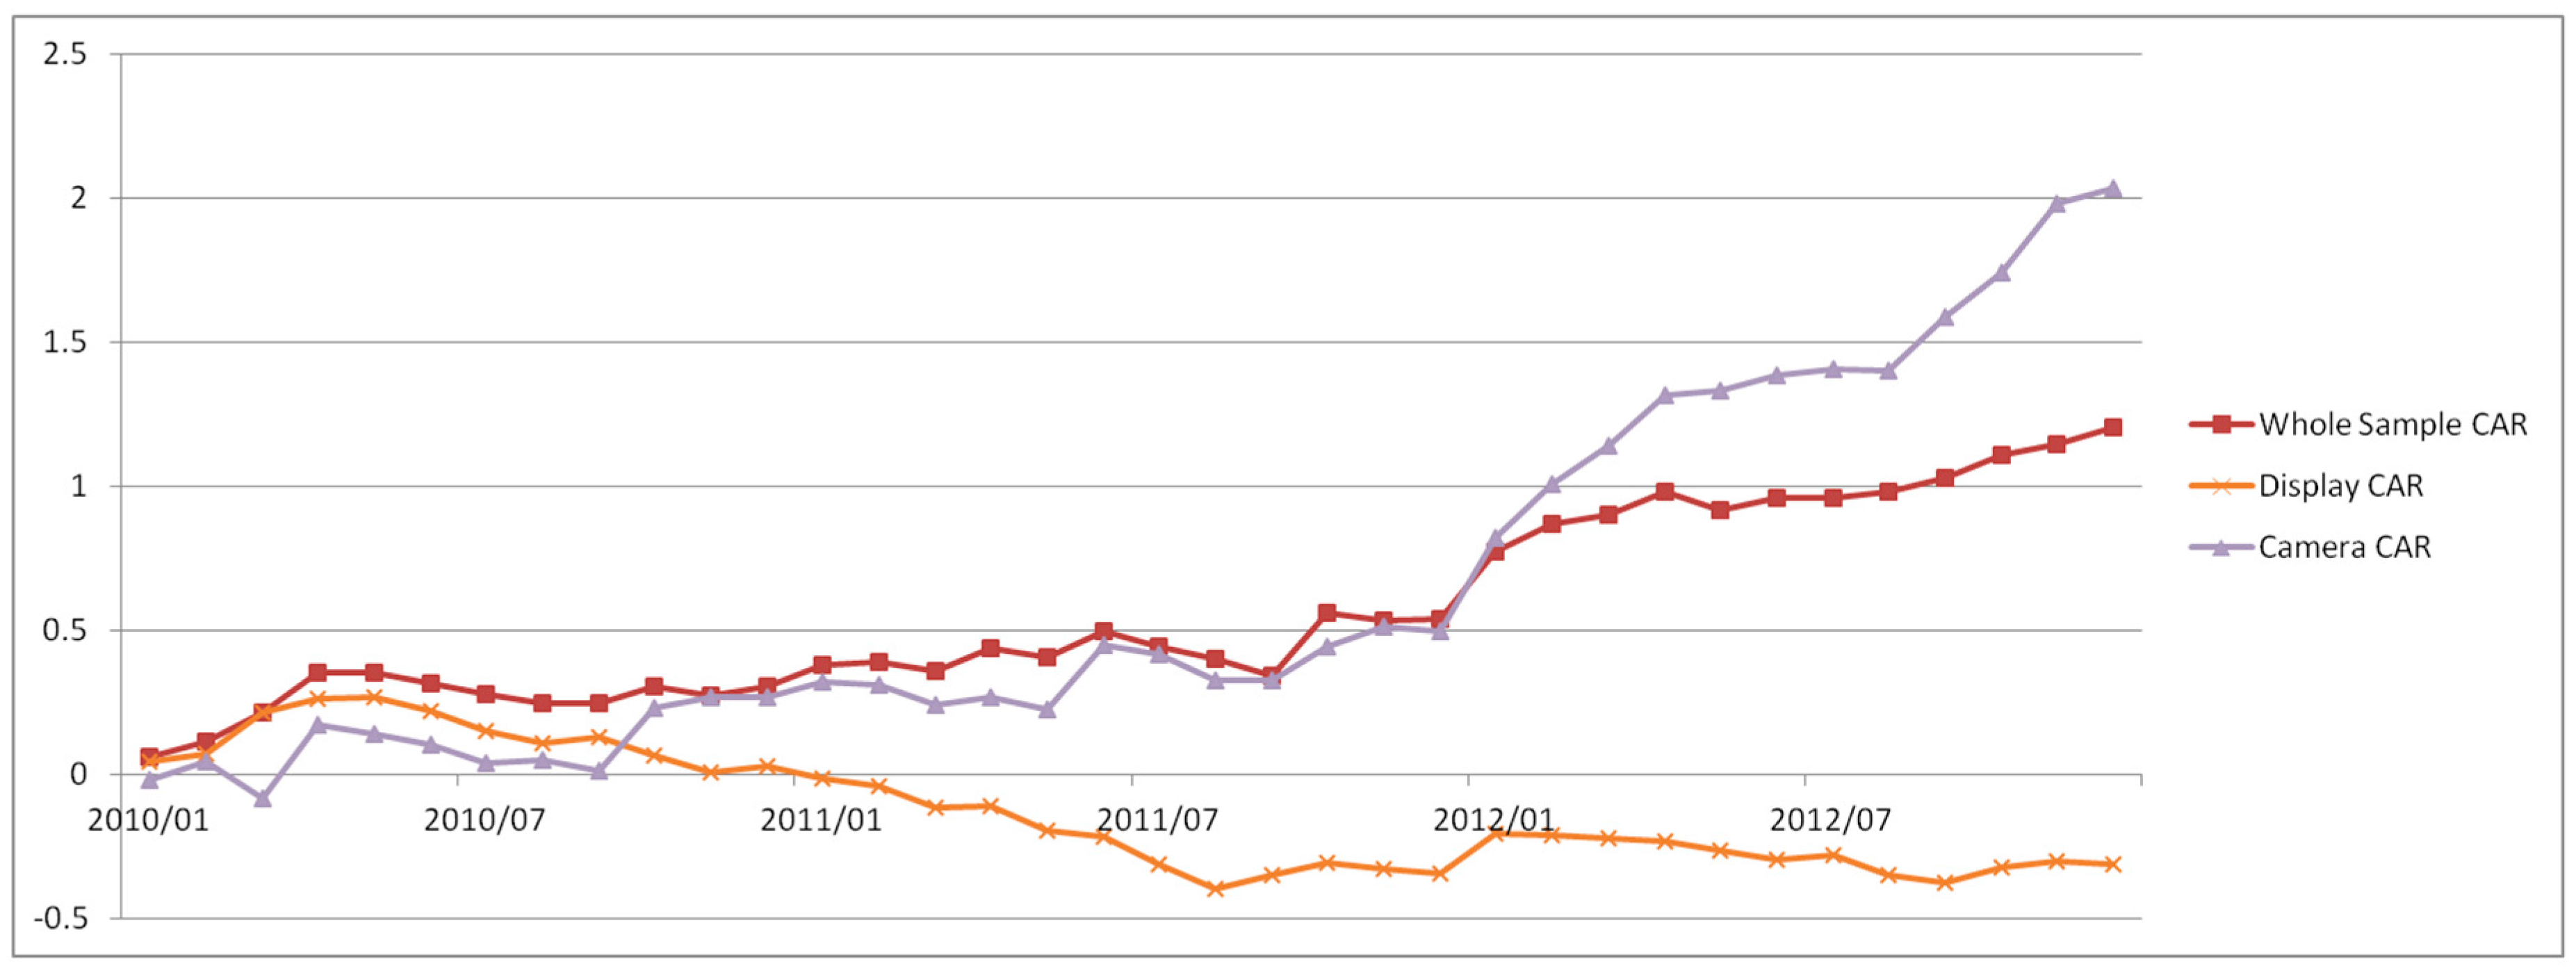



| Evaluation Period | Event Period |
|---|---|
| Jan 2007–Dec 2008 (Innovation Trigger) | Jan 2010–Dec 2012 (Peak of Inflated Expectations) |
| Month in which each company was listed-Dec 2008 (Innovation Trigger) | Jan 2010–Dec 2012 (Peak of Inflated Expectations) |
| Jan 2010–Dec 2011 (Peak of Inflated Expectations) | Jan 2013–Jul 2018 (Trough of Disillusionment) |
| Cross Correlation | CCC (Lag = 0) | ARIMA | p-Value of Prewhitened Data (by PP)4 | |||||
|---|---|---|---|---|---|---|---|---|
| Group Combination | Model | Coefficient5 | TS16 | TS2 | ||||
| ma | sar | drift | ||||||
| Whole sample & Display | 0.663 | ARIMA(0,1,0)(1,0,0)[12] with drift | 0.3531 | 3.4809 | 0.01 | 0.01 | ||
| Whole sample & Camera | 0.682 | ARIMA(0,2,1) | −0.8814 | 0.01 | 0.01 | |||
| Camera & Display | 0.322 | ARIMA(0,1,0) | 0.01 | 0.01 | ||||
| Cross Correlation | CCC (Lag = 0) | ARIMA | p-Value of Prewhitened Data (by PP) | |||||
|---|---|---|---|---|---|---|---|---|
| Group Combination | Model | Coefficient | TS1 | TS2 | ||||
| ma | sar | drift | ||||||
| Whole sample & Display | 0.703 | ARIMA(0,1,0)(1,0,0)[12] with drift | 0.3516 | 2.3482 | 0.01 | 0.01 | ||
| Whole sample & Camera | 0.651 | ARIMA(0,1,0)(1,0,0)[12] with drift | 0.3516 | 2.3482 | 0.01 | 0.01 | ||
| Camera & display | 0.328 | ARIMA(0,1,0) | 0.01 | 0.01 | ||||
| Cross Correlation | CCC (Lag = 0) | ARIMA | p-Value of Prewhitened Data (by PP) | |||||
|---|---|---|---|---|---|---|---|---|
| Group Combination | Model | Coefficient | TS1 | TS2 | ||||
| ma | sar | drift | ||||||
| Whole sample & Display | 0.749 | ARIMA(0,1,0) with drift | −1.3701 | 0.01 | 0.01 | |||
| Whole sample & Camera | 0.477 | ARIMA(0,1,0) with drift | −1.3701 | 0.01 | 0.01 | |||
| Camera & Display | 0.273 | ARIMA(0,1,0) | 0.01 | 0.01 | ||||
| Cross Correlation | CCC (Lag = 0) | ARIMA | p-Value of Prewhitened Data (by PP) | |||||
|---|---|---|---|---|---|---|---|---|
| Group Combination | Model | Coefficient | TS1 | TS2 | ||||
| ma | sar | drift | ||||||
| Whole sample & Display | 0.368 | ARIMA(0,1,0) | 0.01 | 0.01 | ||||
| Whole sample & Camera | 0.594 | ARIMA(0,1,0) | 0.01 | 0.01 | ||||
| Camera & Display | 0.170 | ARIMA(0,1,0) | 0.01 | 0.01 | ||||
| Cross Correlation | CCC (Lag = 0) | ARIMA | p-Value of Prewhitened Data (by PP) | |||||
|---|---|---|---|---|---|---|---|---|
| Group Combination | Model | Coefficient | TS1 | TS2 | ||||
| ma | sar | drift | ||||||
| Whole sample & Display | 0.668 | ARIMA(0,1,0) | 0.01 | 0.01 | ||||
| Whole sample & Camera | 0.374 | ARIMA(0,1,0) | 0.01 | 0.01 | ||||
| Camera & Display | 0.382 | ARIMA(0,1,0) | 0.01 | 0.01 | ||||
| Group Combination | Whole Sample & Display | Whole Sample & Camera | Camera & Display | |
|---|---|---|---|---|
| Coefficient Evaluation Period | ||||
| Jan 2010–Dec 2012 (Peak of Inflated Expectations) | 0.809 | 0.743 | 0.495 | |
| Jan 2013–Jul 2018 (Trough of Disillusionment) | 0.666 | 0.624 | 0.309 | |
© 2018 by the author. Licensee MDPI, Basel, Switzerland. This article is an open access article distributed under the terms and conditions of the Creative Commons Attribution (CC BY) license (http://creativecommons.org/licenses/by/4.0/).
Share and Cite
Lee, B. The Relationship between Technology Life Cycle and Korean Stock Market Performance. Int. J. Financial Stud. 2018, 6, 88. https://doi.org/10.3390/ijfs6040088
Lee B. The Relationship between Technology Life Cycle and Korean Stock Market Performance. International Journal of Financial Studies. 2018; 6(4):88. https://doi.org/10.3390/ijfs6040088
Chicago/Turabian StyleLee, BokHyun. 2018. "The Relationship between Technology Life Cycle and Korean Stock Market Performance" International Journal of Financial Studies 6, no. 4: 88. https://doi.org/10.3390/ijfs6040088
APA StyleLee, B. (2018). The Relationship between Technology Life Cycle and Korean Stock Market Performance. International Journal of Financial Studies, 6(4), 88. https://doi.org/10.3390/ijfs6040088


