Article

The Value Effect of Financial Reform on U.K. Banks and Insurance Companies

by
Teresa Valeria Parise
1 and
Vijay Shenai
2,*
1
Independent Researcher, University of Westminster, London W1W 7BY, UK
2
Independent Researcher, University of Lincoln, Lincoln LN6 7TS, UK
*
Author to whom correspondence should be addressed.
Int. J. Financial Stud. 2018, 6(3), 81; https://doi.org/10.3390/ijfs6030081
Submission received: 9 July 2018 / Revised: 9 August 2018 / Accepted: 29 August 2018 / Published: 11 September 2018

Abstract

:
In response to the financial crisis, a number of reforms to bank regulation have been introduced. Many of these reforms seek to improve the resilience of banks through making changes to their structure. In the U.K., the Banking Reform Act 2013 was enacted. This study attempts to examine the market’s reaction to this important financial reform, on the stock price of banks and insurance companies and contributes to the current regulatory debate. As reform proposals take time to get converted into Law, this paper focuses on three legislative events extracted from the Parliament website; the third reading at the House of Commons, the third reading at the House of Lords, and the Royal Assent, effectively the stages from which reform proposals convert to Law. This study employs an event study methodology, based on a sample consisting of 24 major banks and insurance companies listed on the London Stock Exchange (LSE) for which data are available from 30/11/2012 to 18/12/2013 covering all three events. The findings are that banks’ shares reacted positively, whereas insurance companies’ shares reacted negatively to the passage of the Banking Reform Act 2013 in the House of Commons (first event); insurance companies experienced negative returns, whereas banks’ returns did not react significantly in relation to the passage of the Act in the House of Lords (second event); and finally, banks’ shares reacted positively while insurance companies’ shares reacted negatively when the Act received the Royal Assent (third event). One of the main intentions of the Banking Reform Act 2013, was to contain the risk taken by banks. Market reaction on banks’ shares shows that the market accepted this; on the other hand, the negative effect on the shares of insurance companies would imply that insurance companies are perceived to have taken on some additional risk as a consequence of the Act.
JEL Classification:
G21; G22

1. Introduction

The U.K. financial system was badly hit by the 2007–2009 global financial crisis, exposing a series of weaknesses that increased the severity of the crisis and its impact on the economy. Weaknesses in the existing regulatory system were revealed and set the agenda for new regulatory reform. Many of those reforms have now been implemented, and others have progressed significantly over the past years. For example, in the European Union, there has been agreement on the coming into force of the procedures that are required to implement Basel III. Moreover, the Liikanen Group has been setup to recommend on bank structural reform in the European Commission. The U.S. has been the protagonist of a number of regulatory initiatives including rules implementing the Volcker Rule, stemming from the Dodd–Frank act of 2010. This study focuses on the most important response, in the U.K., to the 2007–2009 financial crises which is the Financial Services (Banking Reform) Act 2013 and its impact on banks and insurance companies.
As fully explained by Putnis (2014), the Banking Reform Act 2013 provides the outline for the implementation of many recommendations of the Independent Commission on Banking (ICB), a committee established by the Government in June 2010 to develop recommendations for reforming the U.K. banking sector. The recommendations that were put forward into the Banking Reform Act 2013 included a plan to make sure that, in the future, catastrophic losses in the investment banking of large banking groups would not harm the viability of its high street banking operations. The solution to the problem was to “ring fence” retail bank services from wholesale and investment banking services (Mashiandaro and Suardi 2014; Putnis 2014; Casu et al. 2015). The endeavour to make banks safer for the retail client and the taxpayer, however comes with additional costs to be incurred by banks (Morse 2015). Alternatively, Korotana (2016) argues that a regulatory regime based on the concept of ‘whistle blowers’ and economic incentives (also found in Dodd-Frank Act) may be better suited than the style of ring fencing proposed in the Banking Reform Act (2013).
Past studies have looked at different aspects of banking regulation related to: diversification, performance and risk (Stiroh 2004; Mercieca et al. 2007; Elsas et al. 2010), to banking stability and efficiency (Freixas and Rochet 1997; Chortareas et al. 2013) and also to the reaction of the stock market after the implementation of Acts and regulations in the U.S. (Amoako-Adu and Smith 1995; Carow and Heron 2002; Andriosopoulos et al. 2015). There is also much interest from the literature to exploit the issues of capital adequacy requirement with Zhang et al. 2008 and Chalermchatvichien et al. 2014 emphasizing that higher capital adequacy requirement has a positive effect on bank stability. Conversely, Blum (1999) argues that an inadequate level of capital adequacy requirement ends up by increasing the fragility of the banking system. While reviewing these aspects within the topic of banking regulation, a gap emerged: the reaction of the market to banks’ and insurance companies’ value in UK in response to the Banking Reform Act 2013. Most of the previous studies have been concerned with the U.S. banking regulation environment; particularly, Andriosopoulos et al. (2015) examined the wealth and risk effect of the Dodd-Frank Act of the U.S. In contrast, this research focuses on the U.K. financial environment.
The regulatory environment in U.K. financial services has dramatically changed over the past two decades. Extra attention has been devoted to banking regulation, especially after the recent financial crises when the society has experienced that if the wholesale banking system collapses, taxpayers and the whole economy face huge costs. The motivation for this paper rests on researching the role that banking regulation plays in creating a suitable environment for financial institutions and the impact it has on banks’ and insurance companies’ values.
In the English legal system, most of the time, the law responds only after financial turmoil (Putnis 2014; Casu et al. 2015). Thus the topic is an area worthy of study as changes in the environment such as new law or regulations can influence the way financial firms operate, consequently this can affect the firm’s earnings and alter the firm’s share prices. Andriosopoulos et al. (2015) pointed out that the rationale in studying the reaction of the stock market to financial regulations is that the market itself is the best judge of the efficacy of financial reforms and their impact of the risk and return for financial institutions. The importance of research in this field became even more apparent when other researchers make evident, the lack of studies on the impact that the Banking Reform Act 2013 had on banks’ and insurance companies’ value.
The intention of the Banking Reform Act 2013 is to safeguard consumers and maintain stability in the financial system with the ultimate intent of making the banking system safer. Barth et al. (2006) emphasise the fact that, even though research in the area of banking regulation is copious, much more commentary and discussion are needed. To gain a deeper understanding of these issues, two main activities are tackled: a review of the relevant literature to discuss empirical findings around the topic and collection and testing of empirical data. Firstly, the literature review will examine all the factors around the Banking Reform Act 2013 through the topic of banking regulation; various themes will be covered such as diversification, risk-taking, financial stability performance and stock market reaction to regulations. Secondly, the empirical analysis will be focusing on examining the effects that the Banking Reform Act 2013 had on banks and insurance companies by analysing the stock returns for these two groups before and after the event day.

1.1. Overall Aim and Objectives of the Research

The overall aim of this research is to gain an understanding of the impact that the Banking reform Act 2013 had on the stocks of Banks and Insurance companies at various stages of legislation. Empirical evidence on the economic consequences of the Act will be provided through analysis of the market’s reaction at key events leading the passage of the Act. Many countries responded to the recent financial crises with new reforms such as Basel III, Banking Reform Act 2013 in the U.K. and Dodd–Frank Act in the U.S. all have been subject of discussions and criticisms from financial institutions and industry organizations. After the implementation of these reforms, it is essential to analyse their impact on the value of affected firms, such as banks and insurance companies, so that a better prediction can be made when similar events happen in the future. Furthermore, given the confusion of the many financial reforms, which have been implemented after the 2007–2009 financial crisis, it is all the more important to try and clarify the real impact that the most important reform implemented in the last decade in the U.K. had on banks and insurance companies which form the major part of financial institutions.
In the literature, there is no information on the impact of the Banking Reform Act 2013, on banks and insurance companies, thus the main aim of this research is to remedy this gap by analysing the effect of this legislation in the U.K. Three objectives of dominant importance have been identified helping to achieve the aim of this research:
(1) Evaluate critically, models and frameworks relevant to support academic works in coping with the topic of banking regulation.
(2) Examine the market’s reaction to the stock price of banks and insurance companies around the key events leading to the passage of the Banking reform Act 2013.
(3) Assess whether banks and insurance companies are differently affected by financial reform.
The first objective draws attention to the reasons for banking regulation along with its emerging issues and will form the core for the literature review. Achievement of the other objectives will show where this research will make a key contribution to the banking regulation field. The tool to achieve this is the collection and the analysis of empirical data. The three objectives are not to be seen as independent from each other but rather as all linked and surrounding the subject of the study which is banking regulation and their effect on the value of intended parties.

1.2. Value of the Research

This study makes contributions in different ways for academic research and practice. First, to the best of knowledge, this study is the first investigating the market reactions to the Banking Reform Act 2013 in U.K. This study adds to the debate on the impact of the Banking Reform Act 2013 on banks and insurance companies by providing empirical evidence. The empirical findings can be informative for the debate on banking regulation, and be useful to regulator and financial institution managers in shaping the future path of the financial service industry.

1.3. Structure

In the first section, an overview of the study along with the background, aim and objectives was presented. The rest of this paper is organised as follows: the second section covers the literature review where the gap in present research is identified. The third section outlines the justification for the methodology used to achieve the aim and objectives of the study. Section four consists of the analysis of data and the findings. Section five provides a critical appraisal of the results. Finally, section six concludes with a reflective summary of the paper, limitations, and recommendations. The last part of the study contains an alphabetical listing of sources referred to in this work. The Harvard system of referencing has been applied in this work.

2. Literature Review

This section will present a critical discussion of the most important works conducted in banking regulation. From the literature review, it is identified that there is a gap in the stock market reaction of banks and insurance companies to the Banking Reform Act 2013. This section focuses on the first objective defined in the previous section. The strategic forces pushing government and financial institutes to impose more regulation in the economy are also evaluated. The topics of banking efficiency, diversification, performance, and risk absorbing are explored to better define the gap in the literature. In the last part, a discussion on the stock market reaction to regulatory act and reform are presented. At the end of this section, it is hoped that the reader is better informed in those areas with a critical understanding of the key issues presented and that a clear focus and justification will emerge for empirical research in this field.

Literature Review

The financial sector is one of the most heavily regulated sectors in the economy and the banking area is by far the most heavily regulated industry. The literature on bank regulatory practices is copious. Financial regulation and supervision are needed to protect the banking and financial system. Sometimes, the reasons for banking regulation are not clear from a theoretical prospective; two contrasting views emerging as explained more fully by Barth et al. (2006). The “public interest view,” as stated by Barth et al. (2013), sustained that the government regulates banks through the correction, or elimination, of market failure, such as monopoly or externalities with the ultimate intention of benefitting the public. From this perspective, a powerful supervisory agency that directly monitors and discipline banks can (a) reduce corruption and enhance the efficiency of capital allocation and (b) encourage a sufficient degree of competition to boost the efficiency of intermediation.
In contrast to traditional economic views, which maintain that stronger official supervision will increase bank performance and stability, the ineffective-hand view did not expect any improvement in terms of bank performance and stability (Barth et al. 2006). The “private interest view” holds that regulation impedes bank efficiency because it is often used to promote the interest of the few without caring about the interest of the whole public (Barth et al. 2013). This can happen, for example, when government regulates banks to facilitate the finance of the government expenditures to funnel credit to politically attractive ends, and in a more general way to maximize the welfare interest objective of politicians and bureaucrats. In this context, a more detailed argument in the literature emerges; this includes arguments from proponents and opponents of banking reforms. People belonging to the first philosophy feel that regulatory activities are important because it is necessary to restore confidence in the banking sector and improve credit system, and as a result, the economy will be less vulnerable to recession (Hryckiewicz 2014). More importantly, proponents of regulatory intervention argue that such actions do not negatively affect the banking sector. For example, Dam and Koetter (2012) analysed that strong banking regulation can, not only improve bank managements by enforcing discipline on it but, also incentivise banks to increase the monitoring function. In the UK, the main reform of the Banking Reform Act (2013) was to ring-fence retail client deposits from any form of Investment Banking activity. The endeavour was conducted to make banks safer for the retail client and the taxpayer, however comes with additional costs to be incurred by banks (Morse 2015). Alternatively, Korotana (2016) argues that a regulatory regime based on the concept of ‘whistle blowers’ and economic incentives (also found in Dodd–Frank Act) may be better suited than the style of ring fencing proposed in the Banking Reform Act (2013).
There are a number of works against banking regulation, for example Gropp and Vesela (2004) argued that these actions cause more harm than good to the banking sector. A fact that is often discussed in the literature is that banking regulation increases moral hazard due to the decline in market discipline and banks’ anticipation of bailouts. In addition, Fahri and Tirole (2012) showed that systematic regulation policies cause a collective moral hazard problem because they allow banks to access cheaper capital, so that they would increase their borrowings and reduce their liquidity. In this context larger banks, which might be supposed to be “too big to fail”, are more strongly incentivised than smaller banks to undertake risky strategy due to the government safety net.
Casu et al. (2015) reported an analysis of causes of moral hazard such as deposit insurance, lender of last resort, and “too big to fail”; especially this last one is caused by the government safety net. Furthermore, many of the market failures can culminate in moral hazard problems because the risk taking party does not bear all of the associated costs of their activities but gains all of the associated benefits. Such moral hazard, as pointed out in The Turner Review (2009), can infect the entire financial markets forcing many of their participants to take an excessive amount of risk.
The topic of market failure, which can be caused by asymmetric information or negative externality, is very commonly discussed in the literature; indeed this can be considered one justification for banking regulation. As accentuated by Casu et al. (2015) banking regulation can take different forms from deposit insurance to capital requirement, bank licensing, and regular examinations of banks. Goodhart et al. (1998) analysed systematic regulation as regulation concerned mainly with the safety and soundness of the financial system, whereas prudential regulation deals mainly with consumer production, and finally, conduct of business focuses on how banks and financial institutions conduct their businesses. Regulators’ main concern is that the failure of one bank can have a contagious domino effect leading to the failure of other banks. Bush (2009) argued that one of the main reasons for the recurring debate is that many regulatory agencies supervising the banking sector have failed to prevent banking crises or bank collapses in several countries. Bank failure is in fact connected to banking crises, a review of the available literature on the last financial crisis revealed a number of potential market failures that could have caused different financial markets to deviate from their standard functions. The Turner Review (2009) examined some examples: (a) information deficiencies in both securitization markets and the market of home loans; (b) markets were not competitive; and (c) the presence of regulatory interventions such as the use of depositor protection schemes and bank bailouts. Rajan (2010) and Wilmarth (2011) argued that the main cause of the financial crises was the excessive risk-taking by financial institutions.
The Banking Reform Act 2013 is the main regulatory response to the financial crises in the U.K. and, this research will add value to this line of literature by providing evidence regarding the market’s evaluation of the effectiveness of the present Act. Chortareas et al. (2013) argued that banking regulation can take the form of precise rules, but is often inaccurate if such rules do not actually reflect risks faced by banks; this could lead to holding either excessive or not enough capital. More importantly, he explained that insufficient capital increases the risk of bank failure while unnecessary capital imposed excessive costs on the bank. He also suggested that to find a balance some extreme regulations needed to be introduced, for example, the Basel Committee II established a list of “best practices” for the regulation and supervision of banks in order to improve stability of the system, risk management practices, and market discipline via enhanced risk based capital and the disclosure requirement. Particular attention has been given to the capital adequacy requirement covered into Pillar 1 of Basel II which aimed to provide tools so that banks can hold less risky portfolios and manage the risk-taking behaviours of banks (Zhang et al. 2008).
There is nowadays, a large amount of theoretical and empirical work on how the capital adequacy requirement has an effect on the stability of the banking system. Some studies such as Blum (1999) argue that an inadequate level of the capital adequacy requirement ends up by increasing the fragility of the banking system, whereas other studies found evidence that a higher capital adequacy requirement has a positive effect on the bank stability (Zhang et al. 2008; Chalermchatvichien et al. 2014). Additionally, an important study conducted in banking regulation by Barth et al. (2004) showed that the link between capital requirements and stability was not strong enough under Basel I. Arnold (2014) and Casu et al. (2015) argued the fact that Basel II capital rules allowed the largest banks to use their own internal models for assessing risk and capital adequacy positions, lead the big banks to hold less capital for regulatory purpose. This, inevitably, contributed to the 2007–2009 banking crisis. Indeed Basel II aimed to improve the assessment of the risk-weighted assets used to compute the capital adequacy ratio; however this has also been the central point of many criticisms as it should have paid more attention to provision of effective rules and guidance for the management risk (Tchana 2012). More recently, a new regulatory framework has been introduced, Basel III, which require banks to hold more capital and higher quality capital than under Basel II, moreover this will oblige banks to respect three additional ratios: leverage ratio, liquidity coverage ratio, and net stable funding ratio, these three constraints along with the capital ratio, which existed before, have to be compliant simultaneously. McNamara et al. (2014) argued that Basel III strongly increases the complexity of bank management by introducing these new three ratios and by the requirement for more and higher loss absorbing capital.
Another strand of literature looks into the relationship between the measure of bank diversification, performance, and risk. Elsas et al. (2010) provided strong evidence that bank diversification did not reduce shareholder value but instead improved bank profitability and overall value. By contrast, the Leaven and Leaven (2007) study is very much relevant to this part of the literature, the criticism by these authors’ work is that diversification has a negative impact on bank performance, however there are instruments that could be put in place to overcome these impacts. Elsas et al. (2010) showed that the difference of these opposite views was due to the diverse measures for banks value and also because they did not use a profitability control in their major regression. Furthermore, Stiroh (2004) finds that diversification is associated with more volatile activities and lower risk-adjusted return. On the other hand, Stiroh and Rumble (2006), Mercieca et al. (2007), Beale et al. (2007), and Demirguc-Kunt and Huizinga (2010) examined that diversification of financial institutions is offset by greater exposure to more volatile activities and that bank performance could be improved by diversifying revenues. Finally, some recent studies, such as Duchin and Sosyura (2014), argued that the overall risk for banks is increasing specially for those institutions where regulations are strongly politically influenced as they are more likely to receive financial support.
To end this section: past studies have looked at market reactions to deregulatory Acts and reforms. As pointed out by Andriosopoulos et al. (2015) the rationale in these studies is that the market is the best judge of the efficacy of financial reforms and their impact of the risk and return for financial institutions. Schäfer et al. (2013) analysed the reaction of the stock return of banks from four major regulatory reforms (Dodd–Frank Act in the U.S., the reforms proposed by the Vickers report in the U.K., the restructuring law and bank levy in Germany, and the too-big-to fail regulation in Switzerland) in the aftermath of the subprime crises employing an event study methodology and focusing on Europe and United States. They found that all reforms succeeded in reducing bailout expectations, especially for systemic banks, and that banks’ profitability was also affected as equity returns were resultantly lower. Carow and Heron (2002) tested the reaction on the stock market to the passage of the Financial Services Modernization Act of 1999 (FSMA); they found negative returns for commercial banks and positive returns for investment bank and insurance companies around the announcement of the Act. In a similar study, Hendershott et al. (2002) found that insurance companies responded positively to deregulation and that these companies gained most of the benefits. Other studies, such as Carow (2001), reported that insurance companies, compared with other financial institutions, have important and positive stock price reaction after the impact of deregulation. Finally, Johnston and Madura (2000) analysed financial institutions, including commercial banks, insurance companies, and brokerage and found that they generally have a positive and important valuation effect upon merger announcements. There seems to be a lack of studies focusing specifically on this area in the United Kingdom, as the current literature is primarily focused on U.S. markets.
There are a large amount of studies in the literature examining the impact of changes in bank regulation on bank equity value, for example Madura and Bertunek (1995) found a positive response to the passage of the 1991 Federal Deposit Insurance Corporation Improvement Act by small and medium-sized banks, but a negative effect on large banks. Spiegel and Yamori (2003) examined the impact of two important regulatory reforms in Japan on bank equity values.
While previous literature has documented different aspects of financial reforms in the banking sector, no research has been dedicated to the measurement of risk adjusted returns and abnormal returns specifically associated with important legislative dates of the Banking Reform Act 2013 in the U.K. This study will bridge this gap by examining the effects of legislative dates on stocks and how banks and insurance companies should adjust to appropriately manage portfolio risk.

3. Methodology

The aim of the current research is to assess the market reaction to the Banking Reform Act 2013 on banks’ and insurance companies’ values at various stages of the passage of legislation. This research will remedy a gap by analysing the effect of this legislation on the U.K. stock market. Different research philosophies have been reviewed in order to find a methodology suitable to achieve the aim. Nowadays, there are a variety of efficient techniques available to conduct financial analysis from simple ratios to sophisticated mathematical and statistical models. There are different methodologies for analysing the stock market reaction to some special events. Some authors’ work consulted methods using some nonparametric methodologies such as data envelopment analysis (DEA). However, this method is mostly used to gain insights into the comparative efficiency of companies during the price-setting process and is a useful tool for comparative efficiency analysis (Cubbin and Tzanidakis 1998). Event study methodology was published by Brown (1985). This is a very effective way to assess the impact of an event on the stock prices of companies.
Kleinow et al. (2014) emphasised that event study methodology is suitable for evaluating the effect of regulatory events because the momentum around the point of time of the announcement can be ‘captured.’ The methodology goes back to Fama et al. (1969) (FFJR) who firstly examined if and why stocks show ‘unusual’ (abnormal) price developments in the months preceding and following stock split. Since then, event studies have become a very useful methodology in finance. This method is widely used in the academic field to analyse the relationship between stock price and new information such as announcements, changes in regulations, new pieces of legislation, and so on. The principle behind this methodology is that capital markets are efficient and will quickly incorporate the financial consequence of events. Moreover, an event study helps to make better prediction for the future about whether a similar event could have a positive or negative influence.
Informally talking, what is being ascertained is, whether, as a result of an event happening, the return is normal or abnormal. In order to isolate the impact of the event on stock price, it is important to distinguish between the expected return and the unexpected return on stock; the expected return is calculated using parameters estimated from a period prior to the event and then the abnormal return is identified (Rani et al. 2012).
Mackinlay (1997) constituted a clear and compact guide through the event study methodology; he reported that a number of approaches are available to calculate the normal return of a given security. These can be loosely grouped in two categories: statistical and economic. Models in the first category are based on some statistical assumptions concerning the behaviour of asset returns. In contrast models from the second category rely on assumptions concerning investors ‘behaviour’ and are not based solely on statistical assumptions. Mackinlay (1997) also reported two extra methods for modelling the normal return: (a) constant mean return model and (b) the market model. The market model is by far the most popular used, and is the one used for this research. This model is described widely in the literature, for example, Hillier et al. (2010) provide a detailed description of it. This is a statistical model and relates the return of any given security to the return of the market portfolio.
Market model is considered to be superior to other models as it removes the portion of the return that is related to variation in the market return, the variance of the abnormal return is reduced and the probability of being able to isolate the effects of a specific event increases. The benefits of using the market model depend on the R2 of the market model regression. The higher the R2 the greater is the variance reduction of the abnormal return (Dharmarathne 2013).
Event study methodology is widely used in studying the reactions of regulatory reforms on bank equity and the literature on the specific topic is copious. Among the most important are Eyssell and Arshadi (1990) who analysed the effect that financial institutions had after imposing a new capital requirement under Basle Committee reforms. Andriosopoulos et al. (2015) analysed the wealth and risk effect of the financial reforms in the United States; they found that national banks, state banks, investment banks, and finance firms experienced negative valuations after the implementation of the Dodd–Frank Act.

3.1. Aim and Objectives

The overall aim of this research is to gain an understanding of the impact that the Banking reform Act 2013 had on the stocks of Banks and Insurance companies at various stages of legislation. This research study has three interrelated objectives set within the context of stock market reaction to Banking Reform Act 2013.
(1) Evaluate critically, models and frameworks relevant to support academic works in coping with the topic of banking regulation.
(2) Examine the market’s reaction to the stock price of banks and insurance companies around the key events leading to the passage of the Banking reform Act 2013.
(3) Assess whether banks and insurance companies are differently affected by financial reform.
Objective 1 was initially addressed in the second section in the form of review of literature. Objectives 2 and 3 are achieved in this research through the collection and analysis of the empirical data obtained from the event study analysis.

3.2. Method of Analysis

Based on the discussion of the literature above, it is felt that an event study methodology would be suitable for this study. The analysis focuses on measuring the effects of the key legislative events of the Banking Reform Act 2013 on the value of a sample of banks and insurance companies. The starting point to conduct an event study methodology is the definition of an estimation period and event windows. The estimation period, which is defined as the period prior to the occurrence of the event, will be 120-trading days before the legislative process (the legislative process involving key events span 94 trading days from 9 July 2013, first event, to 18 December 2013 last event). The legislative process is not included in the estimation period to prevent the events from influencing the normal performance model parameter estimates. Moreover, a gap between the estimation period and the first event window is required due to information leakages. In the present study, a gap of one month is allowed (Rani et al. 2012). The event window is the number of days before and after the event date over which the abnormal return is cumulated. The choice of the event window is somewhat arbitrary and as reported by Mackinlay (1997) there is no sound empirical basis for choosing a particular time period around an event. For the purpose of this study, the event window is a period of five trading days to capture the leakage effect for the first event. For the second and third events an event window of +3 −3 is selected due to the limitation of data.

3.3. Legislative Dates

The major legislative dates, which are expected to have a material impact on security pricing, were extracted from the U.K. Parliament website. In order for the Bill to become an Act of Parliament, it must be approved in the same form by both Houses: Common and Lord. There are five stages in each House where the Bill is debated and amendments are possible. Extra attention has been devoted to choose the event dates. Mackinlay (1997) and Lamdin (2001) strongly argued the fact that studies of regulatory changes have an inherent problem in identifying the events as the parliamentary life of a new law is often very complicated and long, for example, an incorrectly placed period may obscure the abnormal return that occurred or, if the news were gradually released a revaluation effect may have occurred, but may be difficult to detect through the market noise. However, after a wide analysis of the whole Banking Reform Act 2013 process, it was decided to focus on the most important passage date of the Bill in each House, which is the final debate and occurs on the day of the third reading, at this stage the bill cannot be further amended. That is the reason why two of the three legislative dates are the third readings in the House of Commons, and third reading in the House of Lords. Once the Bill has completed all the parliamentary stages, it is ready to receive the Royal Assent; this is when the Queen formally agreed to make the Bill an Act of Parliament (law), and thus this is the third legislative dates for the analysis (U.K. Parliament 2016). Finally, the three dates focused on were the following: (a) third reading House of Commons on 9 July 2013; (b) third reading House of Lord on 9 December 2013; and (c) Royal assent on 18 December 2013.

3.4. Sample Design

For examining the impact of the legislative dates on stock return a sample of banks and insurance companies (life and nonlife) are selected from the London Stock Exchange website (see Appendix B for details) using the Financial Times all share index. Even though researchers such as Brown (1985) argued that daily data comport a number of issues in conducting an event study analysis, there are others such as Konchitchki and O’Leary (2011) who assert that is better to use daily data rather than weekly or monthly as such data allow more informative examination of the event of interest and more precise measurement of abnormal return. A company must satisfy the following criteria in order to be included in the sample. Firstly, the company must be traded on the London Stock Exchange. Secondly, the companies must have continuous returns data available on Yahoo Finance from 30/11/2012 to 18/12/2013 (timeline) and has to be traded at least 70% of the trading days. The final sample comprises 24 companies: six banks and 18 insurance companies (see Appendix A for more details).

3.5. Data and Market Index

The starting point for many problems of interest in finance is the collection of time series of prices. For this research, daily prices of banks and insurance companies were downloaded from Yahoo finance. The data for the market index has been downloaded from the same source.
Campbell et al. (1997) suggested that it is preferable to work with returns instead of prices and he provided two main reasons for this. Firstly, return of an asset is a complete and scale-free summary of the investment opportunity. Secondly, series are easier to handle than prices because they have more attractive statistical proprieties. For academic purposes, returns are computed on natural logarithm differences, transforming them into a continuous compounded time series. Log-returns have the attractive property of been time additive. Another important feature is that if log-returns are normally distributed, then the log of prices will follow the same pattern and they cannot take negative values. Finally, the logarithmic transformation of data generally reduces the skewness. It can therefore be said that log-returns are preferred as they established a better normality (Danielsson 2011; Brooks 2014). A stock market index shows how a portfolio of share prices changes over time providing an indication of the market trend. The accepted practice is to use the market wide index as a proxy for the Market Portfolio. In this study, the FTSE-All share index is used as a proxy for the Market Portfolio in the UK stock market. As the beta of individual stocks in the sample is calculated, use of the FTSE All share Index allows the computation of risk-adjusted abnormal returns.

3.6. Efficient Market Hypothesis

The notion of efficient capital markets (Fama 1970) provides an essential hypothesis for event study methodology. According to the Efficient Market Hypothesis, prices of securities fully reflect available information on the securities. The efficient market hypothesis is linked with the notion of a random walk, used in the finance literature to describe a price series where all price changes represent random departures from previous prices. More precisely, in the semi-strong form of the market, security prices reflect all publicly available information and the effect of an event will be reflected immediately in security prices. If the stock market would not react quickly and accurately to new information it would not be possible to understand if the event affected the stock price. As new information is made available in the market, investors are expected to impound this information into the firm’s stock price to capture the expected effect on the firms’ value. Or said differently, all the information in past prices will be reflected in today’s prices (Malkiel 2003). Historical data is used for this research; therefore, the assumption is that the stock market is efficient in a semi-strong form.

3.7. Stock Return and Market Return

Daily actual returns for banks, insurance companies and the entire stock market were computed by taking the natural logarithmic differences on daily closing prices (i.e., from the day’s stock price and the previous day’s stock price, with a non-missing price to the current day).
Stock Return
R i t = L n ( P t / P t 1 )  
where,
  • L n = Natural logarithm;
  • R i t = the rate of return of firm i on day t;
  • P t = closing share price on day t;
  • P t 1 = closing share price on day t − 1 (previous trading day).
Daily actual returns for the stock market index were computed by taking the natural logarithmic differences on daily closing market index value (i.e., from the day’s market index value and the previous day’s market index value, with a non-missing value to the current day).
Market Return
R m t = L n ( F T A S I t / F T A S I t 1 )  
where,
  • R m t = Return of the FTAS all share index for the tth day;
  • Ln = Natural Logarithm;
  • F T A S I t = FTAS index value for the current day;
  • F T A S I t 1 = FTAS index value for the previous day.

3.8. Bench Mark Model

The important parameter β is found from the market model. Regression analysis produces estimates of regression intercept αand regression slope β which are used to compute the expected return. This regression model, based on the capital asset pricing model (CAPM), assumes a linear connection between the return of the market portfolio R m t and the return of a stock R i t with αi and βi as parameters of the regression. Firstly, the market model is used to estimate α and β using the data for the estimation period; these were estimated by an ordinary least square (OLS) regression using excel. In the regression analysis the market returns are considered as an independent variable, while the return of the firm is the dependent variable.
For any security i the market model is:
R i t = α i + β i · R m t + ε i t  
E ( ε i t ) = 0 ; var ( ε i t ) = δ 2  
where,
  • R i t = return on company i on day t;
  • R m t = return on a market portfolio of stock on day t;
  • α i = intercept;
  • β i = systematic risk of stock i (slope coefficient);
  • ε i t = disturbance term of the regression (Kleinow et al. 2014; Dharmarathne 2013);
  • var ( ε i t ) = δ 2 , a constant; means residuals are homoscedastic.

3.9. Estimating Abnormal Return

As highlighted by Rani et al. (2012) the key issue in event studies is to understand what proportion of the price movement is actually caused by the event of interest. In other words, it is necessary to extract the impact of one particular event on stock returns and determine whether the stock price reacted around the day of the event. The unexpected reaction of the stock price is called abnormal return which is simply the difference between the normal or expected return and the actual return. The abnormal return measures the magnitude of price reaction attributable to the event.
First of all, the expected return of the firms are forecasted using the following equation:
E ( R i t ) = α i + β i R m t  
where,
  • E ( R i t ) = to the expected return on firm i on day t;
  • α i = estimated regression intercept of stock i;
  • β i = the estimated systematic risk of stock i.
Then the abnormal return (AR) are calculated for the event period using the following formula:
A R i t = R i t E ( R i t )  
where,
  • A R i t = is the abnormal return of the firm i during the event period;
  • R i t = is the return of the firm i on day t in the event period;
  • E ( R i t ) = is the expected return on the firm i on day t in the event period.
After having found the abnormal return the next step is to calculate the average abnormal return (AAR) for each day in the event window in order to get a representative measure and is calculated as follow:
A A R t = 1 N i = 1 N A R i t  
where N is the number of the firms in the sample.
Event studies usually focus on examining the cumulative abnormal return (CAR). This indicates the extent to which the market adjusts the firm value in response to ‘new information’ over the relevant period. The advantage of using CAR is that the abnormal return (AR) alone may not be a powerful indicator, if a leakage of information occurs. In the present study, CARs for the pre-event window are calculated as follows:
CAR on the event zero is the abnormal return on day zero;
CAR on day +1 is the abnormal return on day +1;
And then the CARs are calculated by adding the abnormal return upward for example, CAR on day +2 is the sum of the abnormal return of day 1 and day 2, CAR on day +3 is the sum of the abnormal return of day 1, 2, and 3.
The CARs are averaged out over the sample over a relevant period and the resultant value is termed as CAAR (cumulative average abnormal return (CAAR)) and has the power of capturing the total abnormal return for the entire relevant period (n).
C A A R = P A A R t  
where, t = 1 to P

3.10. Significance Testing (Parametric) for AAR and CAAR

When the process finally reaches the hypothesis testing, there exist numerous different tests to choose from, the suitable tests depend on the characteristic of the study as well as the sample and each one tests the null hypothesis that abnormal returns are zero.
In this study, the significance of average abnormal returns (AAR) and cumulative abnormal return (CAAR) for the event period will be tested using the t-statistic. This is a parametric test and assumes that the individual firm’s abnormal return is normally distributed. In this step, it is necessary to understand if AR indicates that the event had a real effect on the price of the company’s stock. According to Binder (1998), the market model method assumes that the average abnormal return for the sample as measured by the average alpha value should be zero.
The t-statistic are calculated as follows:
HO mean of AAR = 0 assume Rit ≈ (0; ð2)
where ð2 is the variance of AR in the event period.
The null hypothesis is rejected if the test statistic exceeds the critical value, in this case corresponding to the 5% or 10% tails region. When the null hypothesis is rejected the AAR is statistically different from zero and thus abnormal returns are generated.
Significance of average abnormal returns (AAR) was tested using the following formula:
S 2 ( A R t ) = 1 n 1 i = 1 n ( A R t A A R t ) 2  
S E 2 ( A A R ) = 1 n S 2 ( A R ) t  
S E ( A A R t ) = 1 n S 2 ( A R t )  
Significance of CAAR was tested using the following formula:
S E ( C A A R ) = P · S 2 ( A A R t )  
T ( C A A R ) = C A A R t S E ( C A A R ) t  
where P = number of days over which AAR are cumulated (Dharmarathne 2013).

4. Analysis and Findings

This section reports the results of the event study. Firstly, a background of the Banking Reform Act 2013, along with the expected impact on banks and insurance companies is presented.
The sample of 24 companies is divided into two categories: six banks and 18 insurance companies.
The three legislative dates (events) focused on are the following:
  • Third reading House of Common on 9 July 2013;
  • Third reading House of Lord on 9 December 2013;
  • Royal assent on 18 December 2013.
The events, along with different event windows, are tested firstly for banks and then for insurance companies. This section is structured as follows:
First of all, for both groups, banks and insurance companies, daily t statistic and cumulative t statistic values are evaluated. The empirical findings for banks are then successively presented followed by the insurance companies, referring to the tables (one for each event) which include AAR and CAAR as well as results of t-test conducted to measure statistical significance for AAR and CAAR.

4.1. The Impact of the Banking Reform Act 2013 on U.K. Financial Institutions

The Banking Reform Act 2013 was enacted following over 12 months of consultation and negotiation. This is a very comprehensive reform for the U.K. financial system and influences nearly all financial market participants and financial institutions national and internationally. More precisely, this research focuses on the part of the Act which may have an impact on banks and insurance companies (life and nonlife). Firstly, the part of the Act which might have a direct effect on banks includes the recommendations of the Independent Commission on Banking (ICB) because it introduced restrictions on asset securitisation from mortgage loans and other limitations in order to impose a higher standard of conduct. In addition, it prohibits the investment in hedge funds and private equity funds. By doing so, these banks face a number of effects such as additional costs and a reduction of income streams and profitability due to the fact that ICB limits the banks ‘activities in property trading.’ On the other hand, taxpayers may benefit from the Banking Reform Act 2013, as the ring fencing, still in the process of implementation, would further protect them from hypothetical recession. Moreover, it is important to underline the ultimate intent of the Banking reform Act 2013 which is to make the banking system safer. The negative impact of UK Banking reform for the economy as a whole, through additional costs to be incurred by banks on ‘ring fencing’ is argued by Morse (2015). Finally, the Banking Reform Act has limited coverage for insurance companies. Indeed, these are also required to be regulated by Prudential Regulator Authors’ Authority which belongs to the Bank of England. Thus, the impact from the Banking Reform Act can be both positive and negative.

4.2. T-Statistic Analysis for Banks

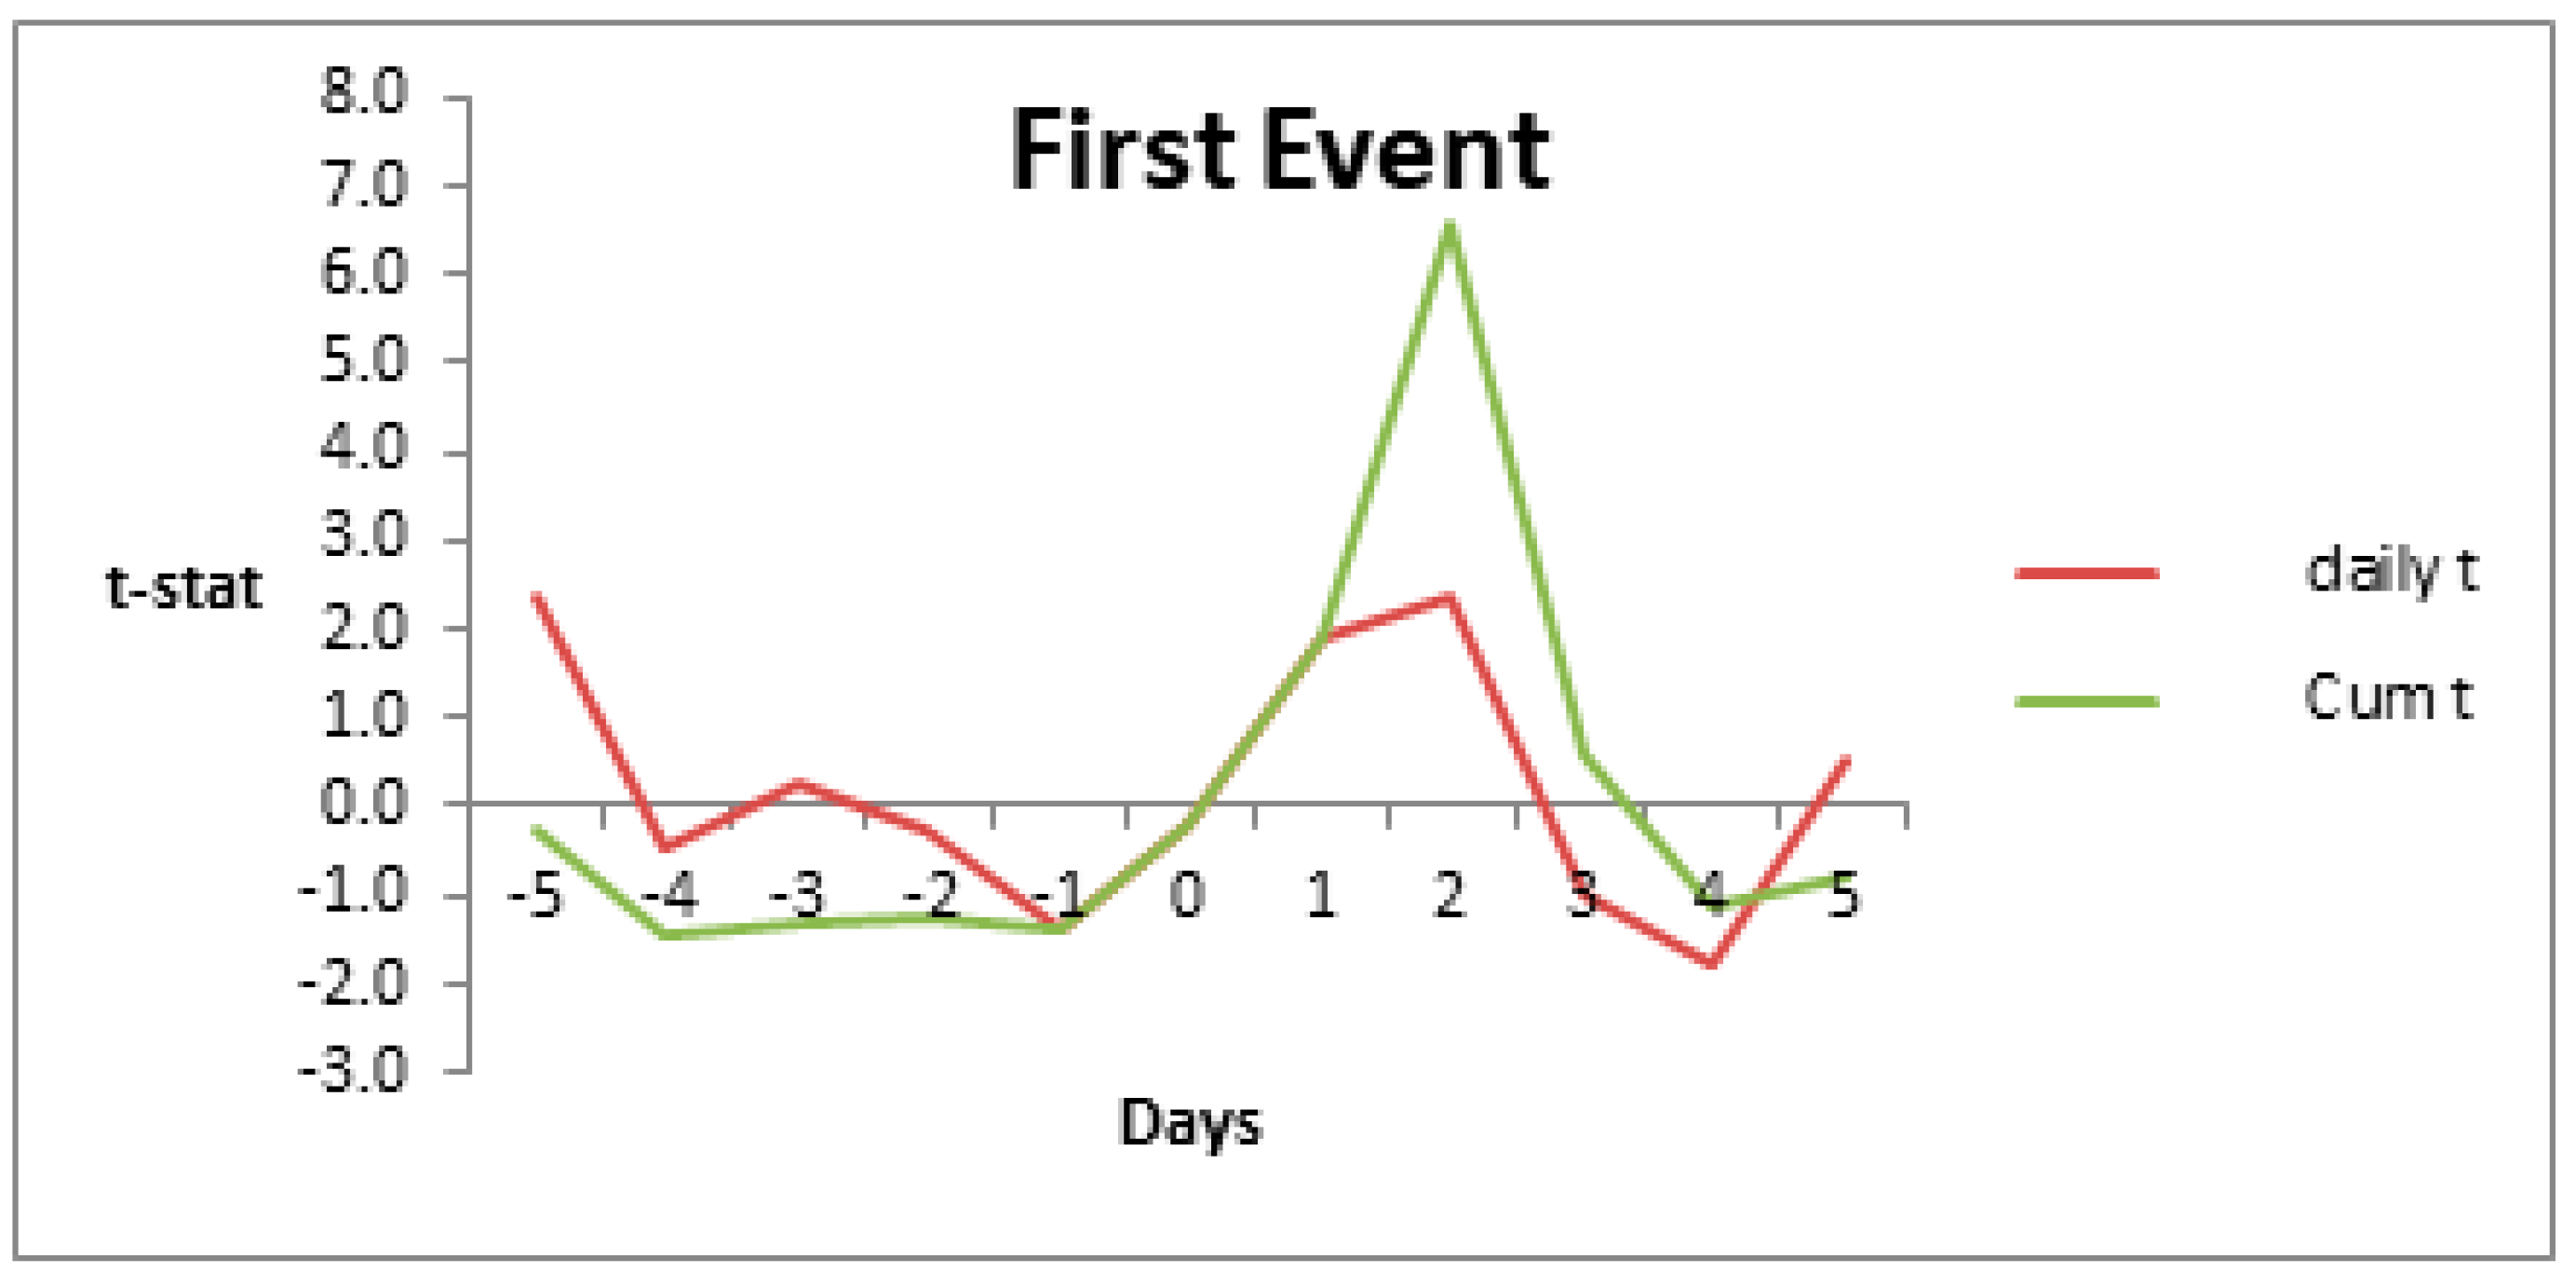
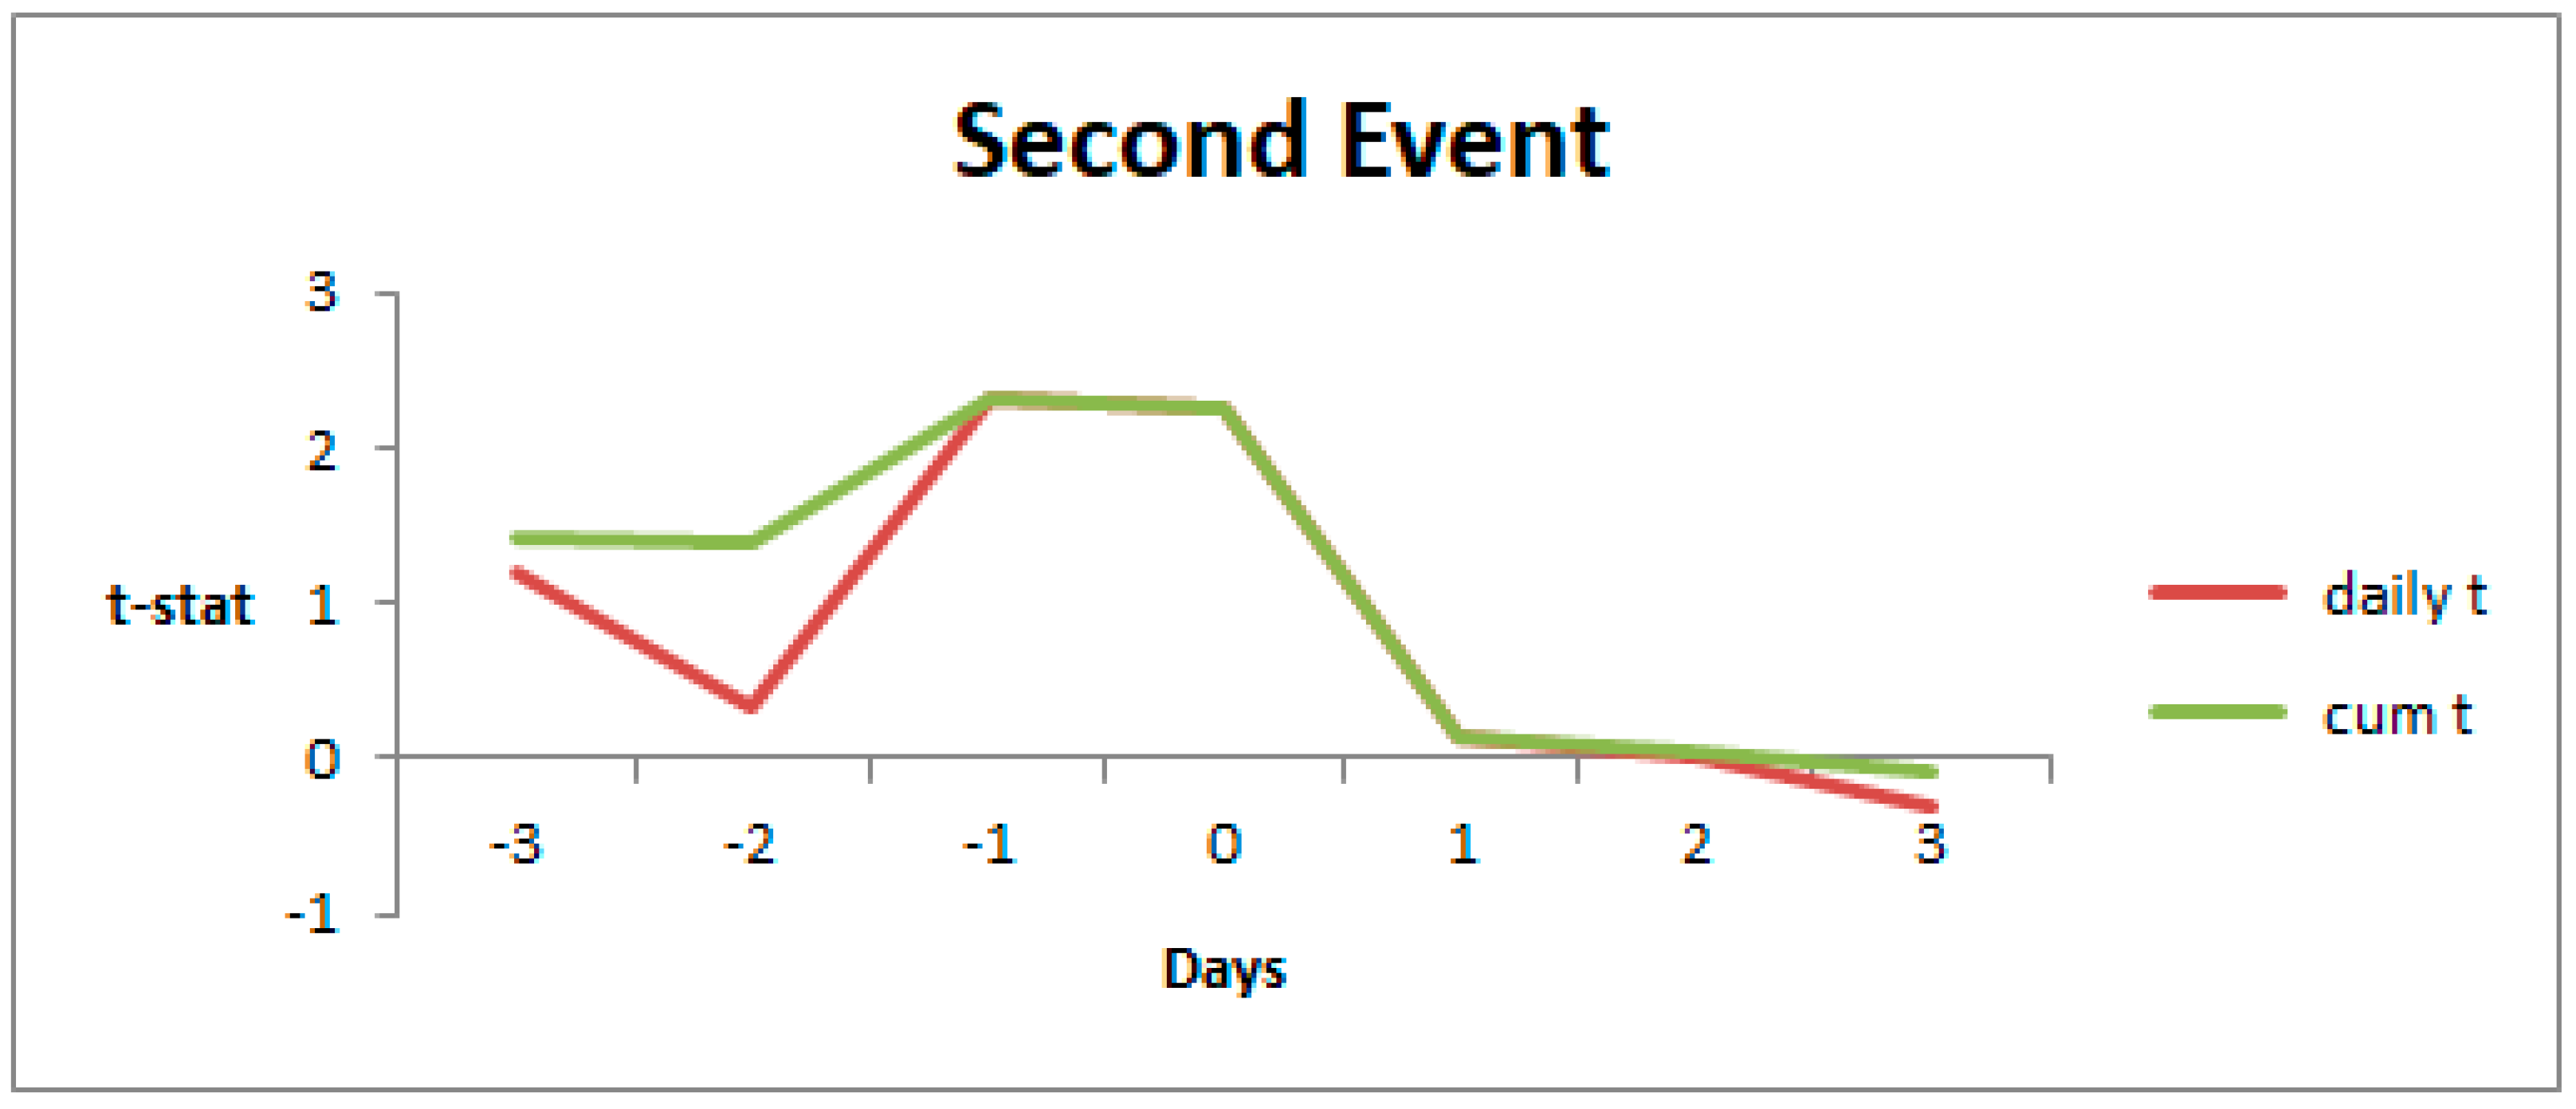
From the overall sample of 24 companies there are six banks. Figure 1, Figure 2 and Figure 3 show daily t statistic and the cumulative t values for the three events, reporting these on vertical axis and days during the event period along the horizontal axis. The critical values for the six banks (Pearson’s table) are reported in Table 1.
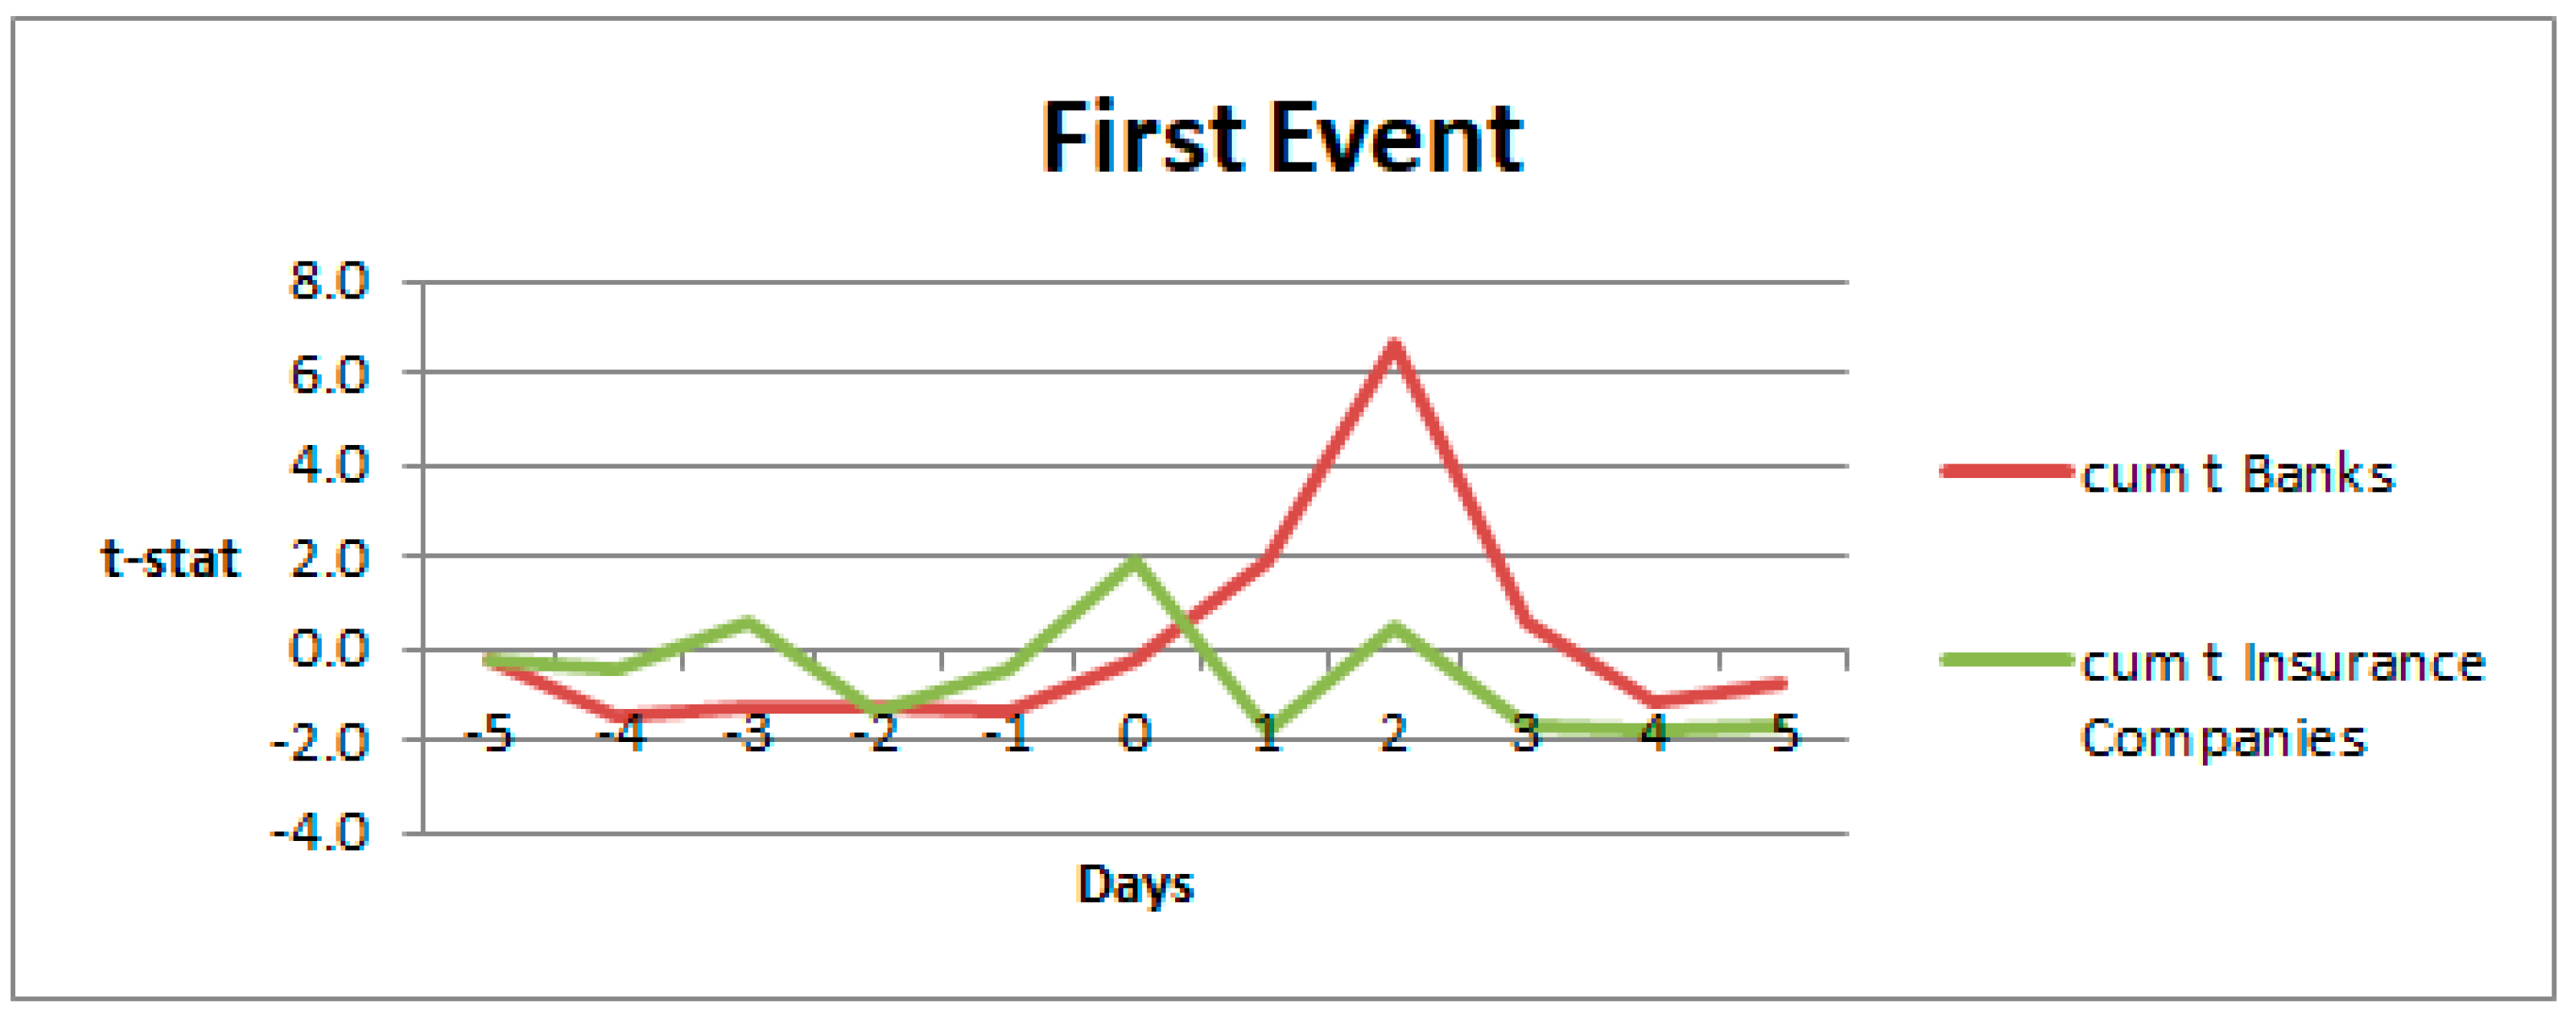
Figure 1 is associated with the first event over a window period starting from day −5 to day +5. The figure shows that values fluctuated positively as well as negatively throughout the time. There were two statistically significant values at 5% and 10% on day −5 and 2 2.354110773 and 2.385461061, respectively. The cumulative t values showed only one high statistically significant value which was 6.596230877 on day 2 indicating a net positive reaction of banks associated to the first event. The whole pattern suggests that the stock price of banks, in relation to the first event, reacted positively for the first three days and then the prices went slightly down for the following two days, after which it shows an upward trend.
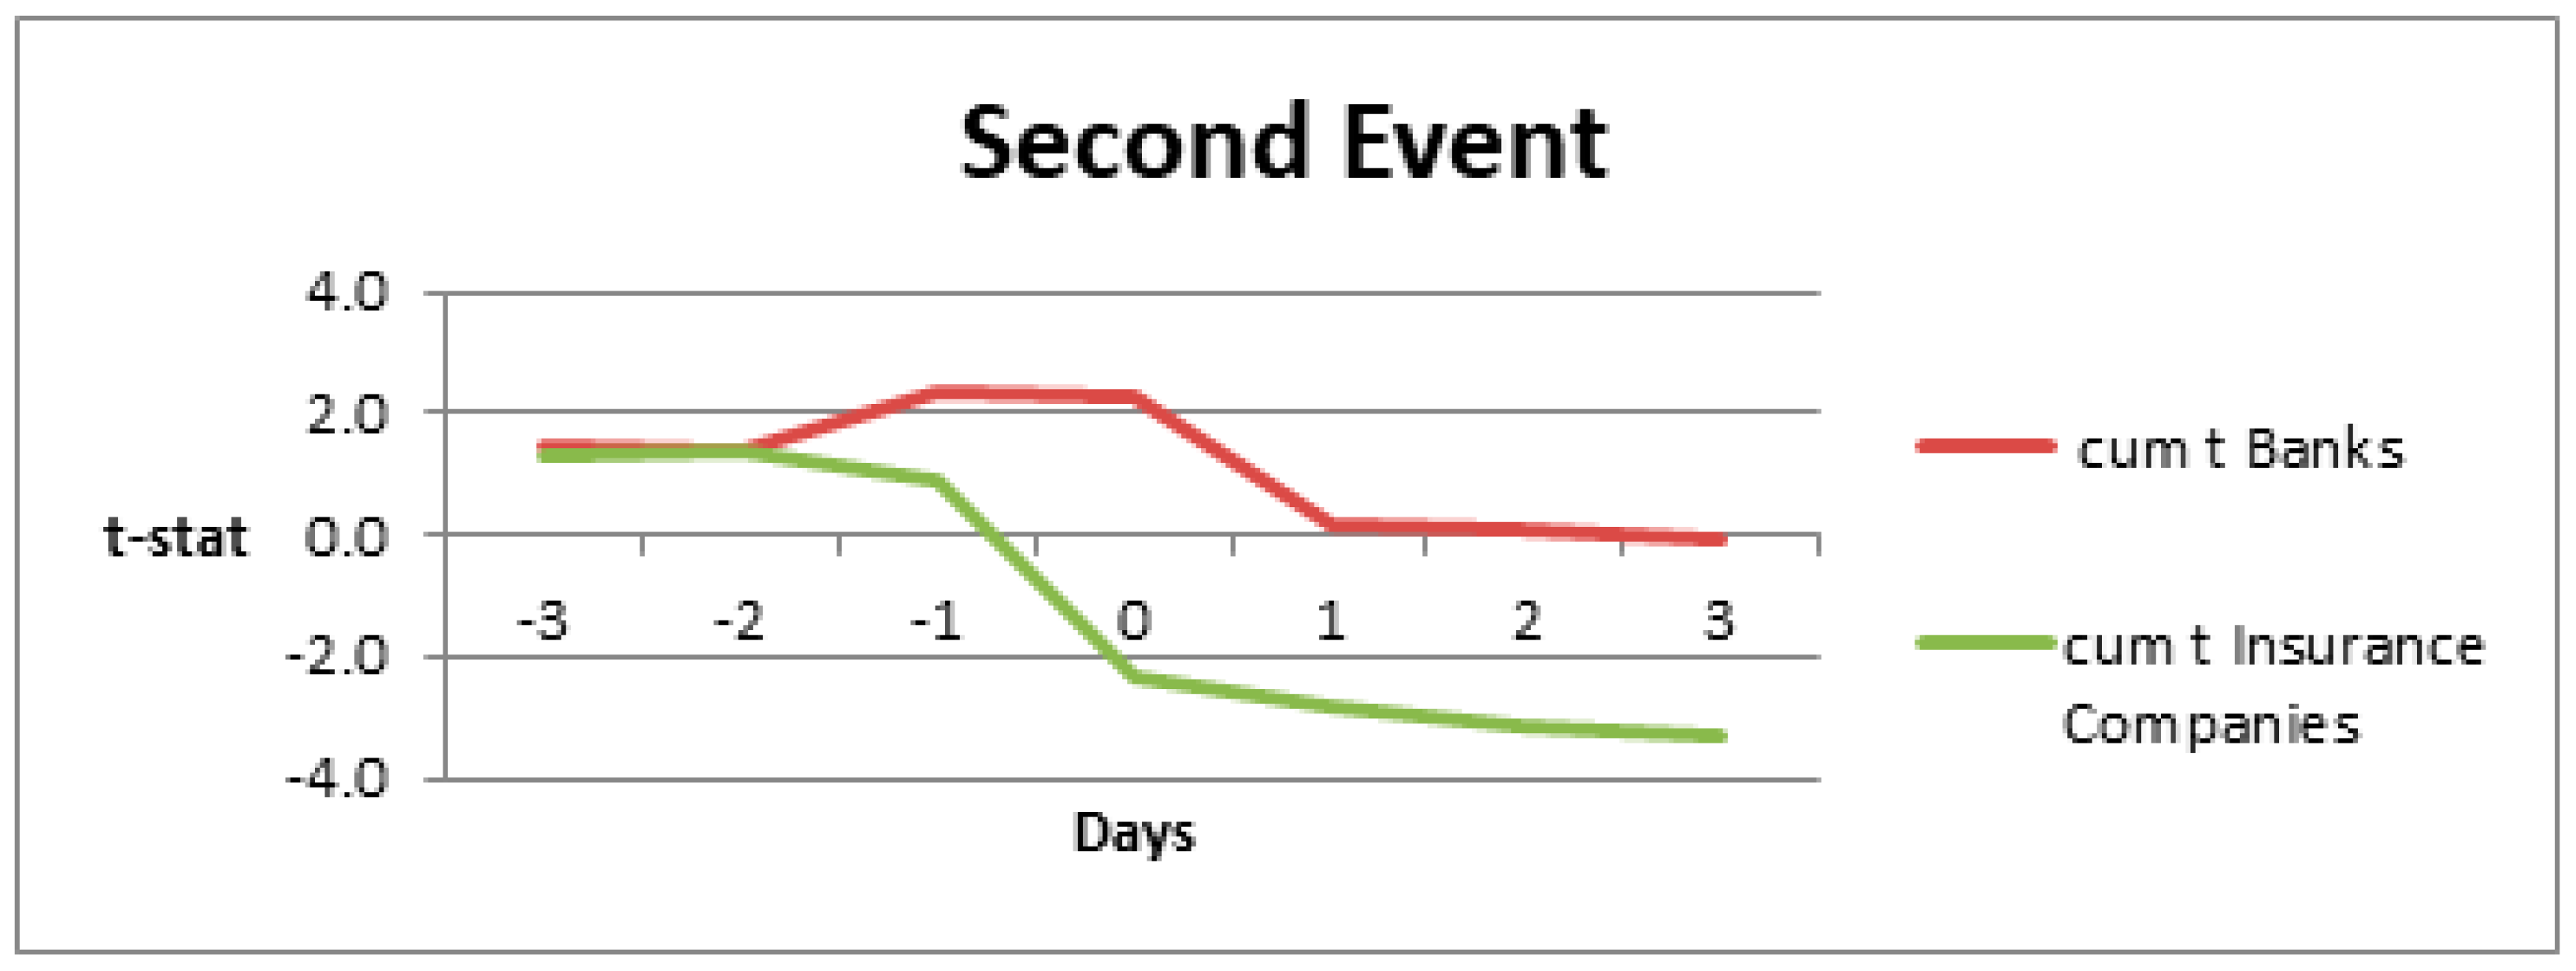
Figure 2 is associated with the second event over a window period starting from day−3 to day +3. There were two statistically significant values at 5% and 10%; one on the event day and one on day −1 which were 2.25 and 2.33, respectively. The cumulative t presented the same statistically significant values. This, as the previous event, suggests a slightly positive impact of banks’ share price throughout the passage of the reform.
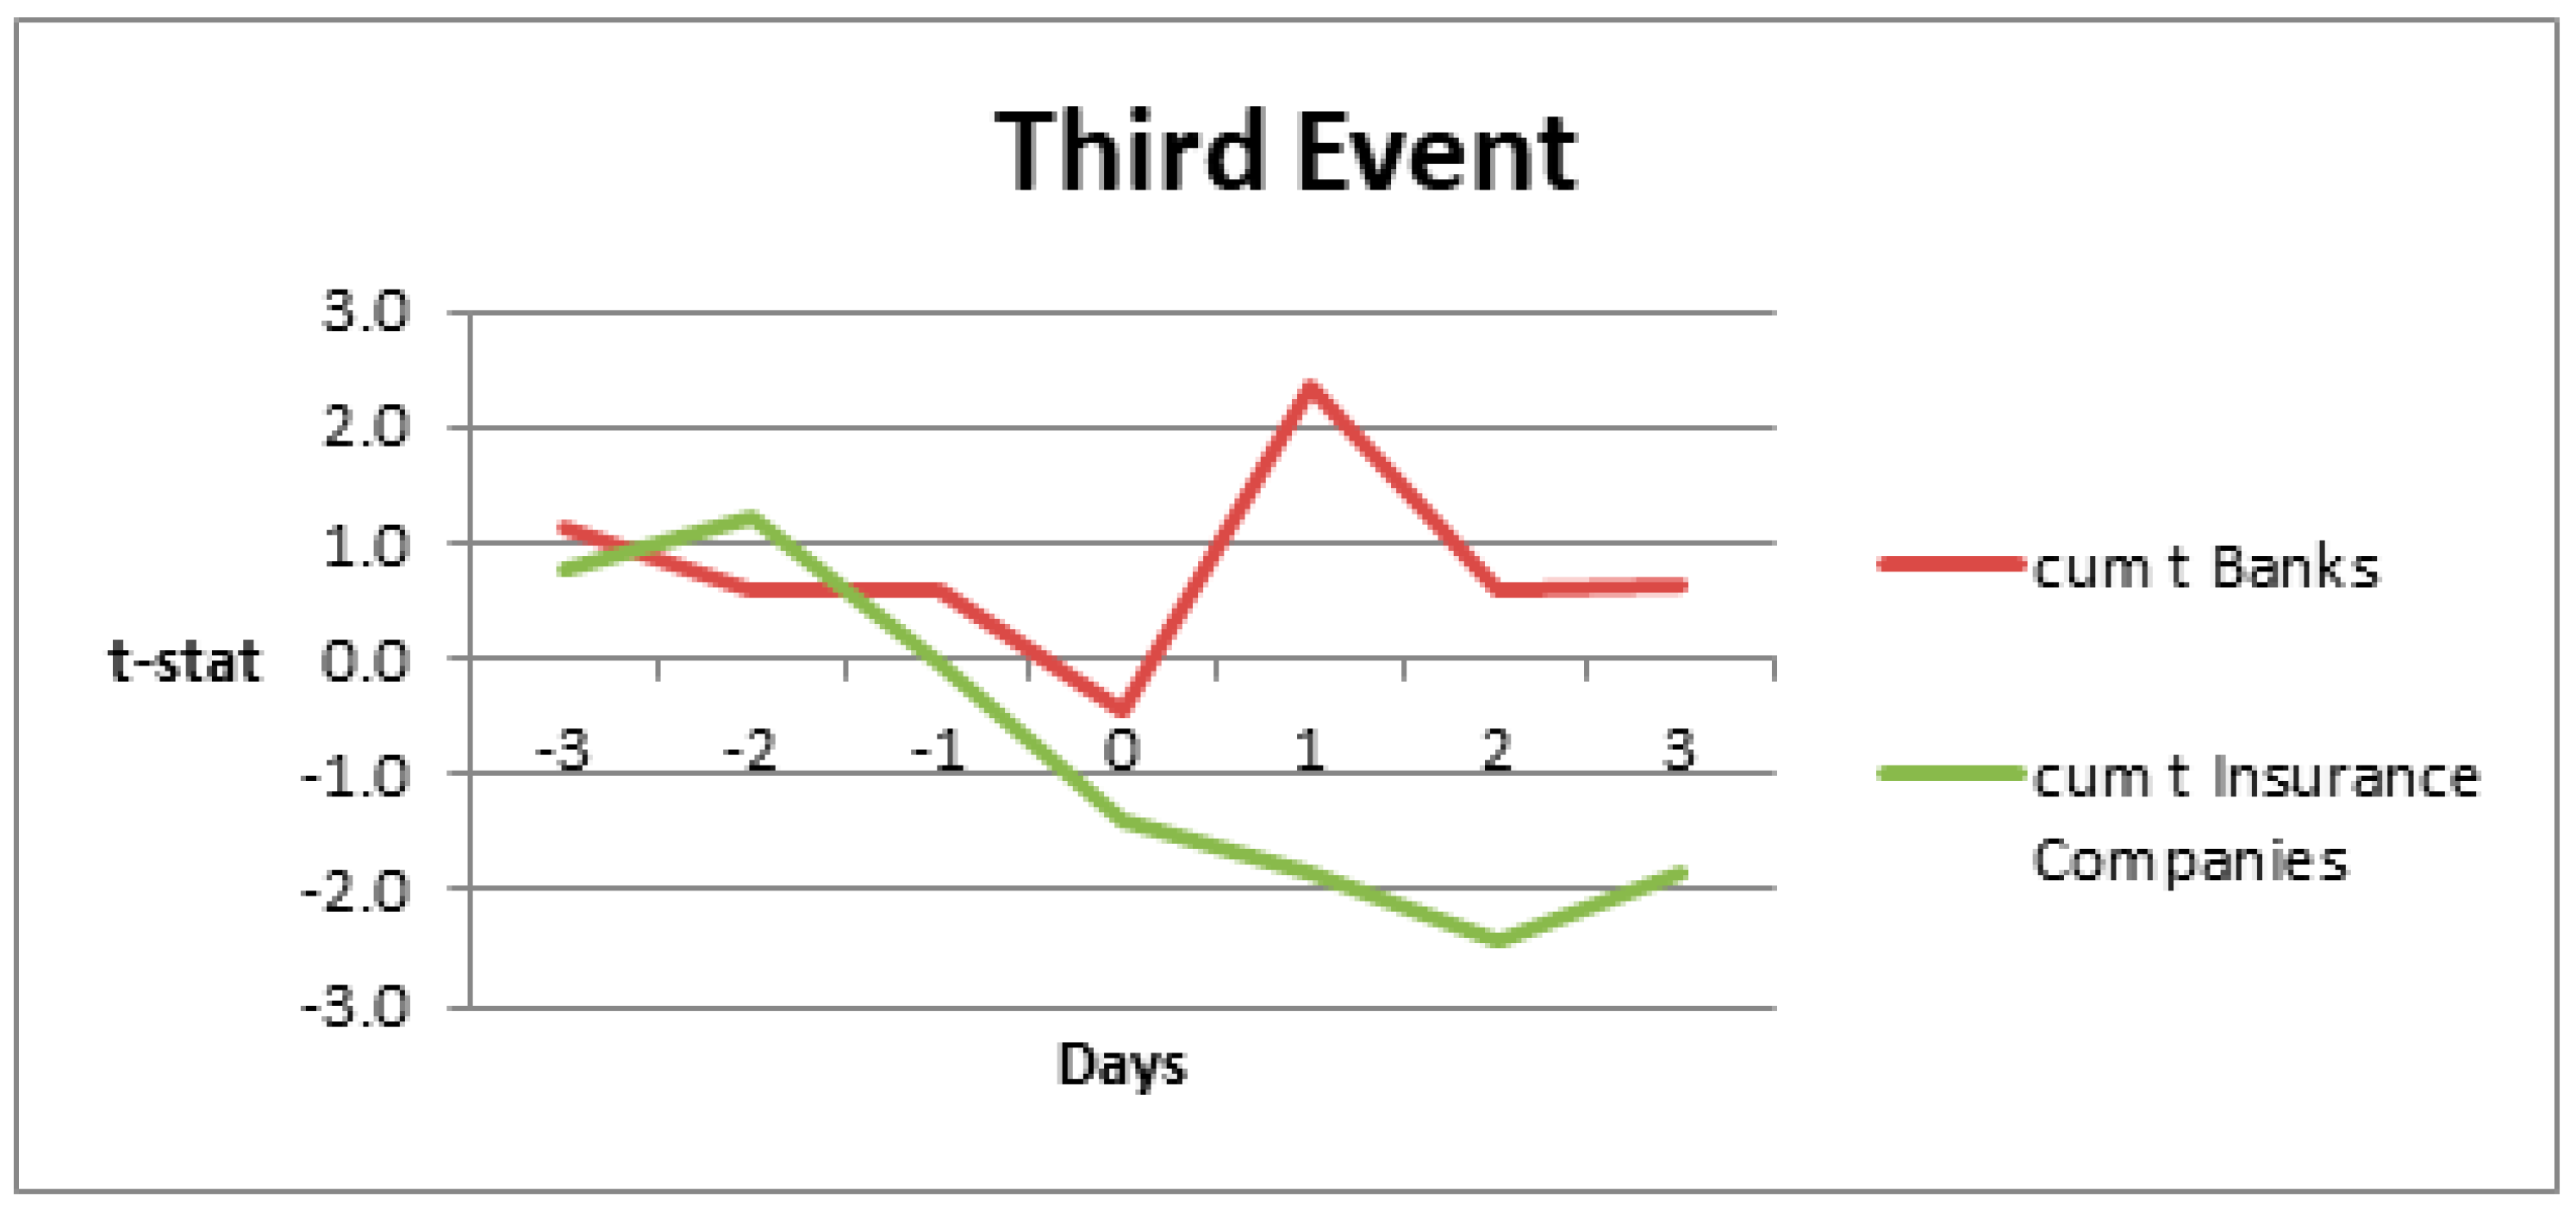
Finally, Figure 3 is associated with the third event over a window period starting from day −3 to day +3. The pattern shows that these values were decreasing before the event day and then characterised from a quick positive response on day 1 where the t statistic and the cumulative t value was 2.34 which was statistically significant at 10%. On this occasion, it seems that banks had a positive reaction.

4.3. Empirical Findings for Banks

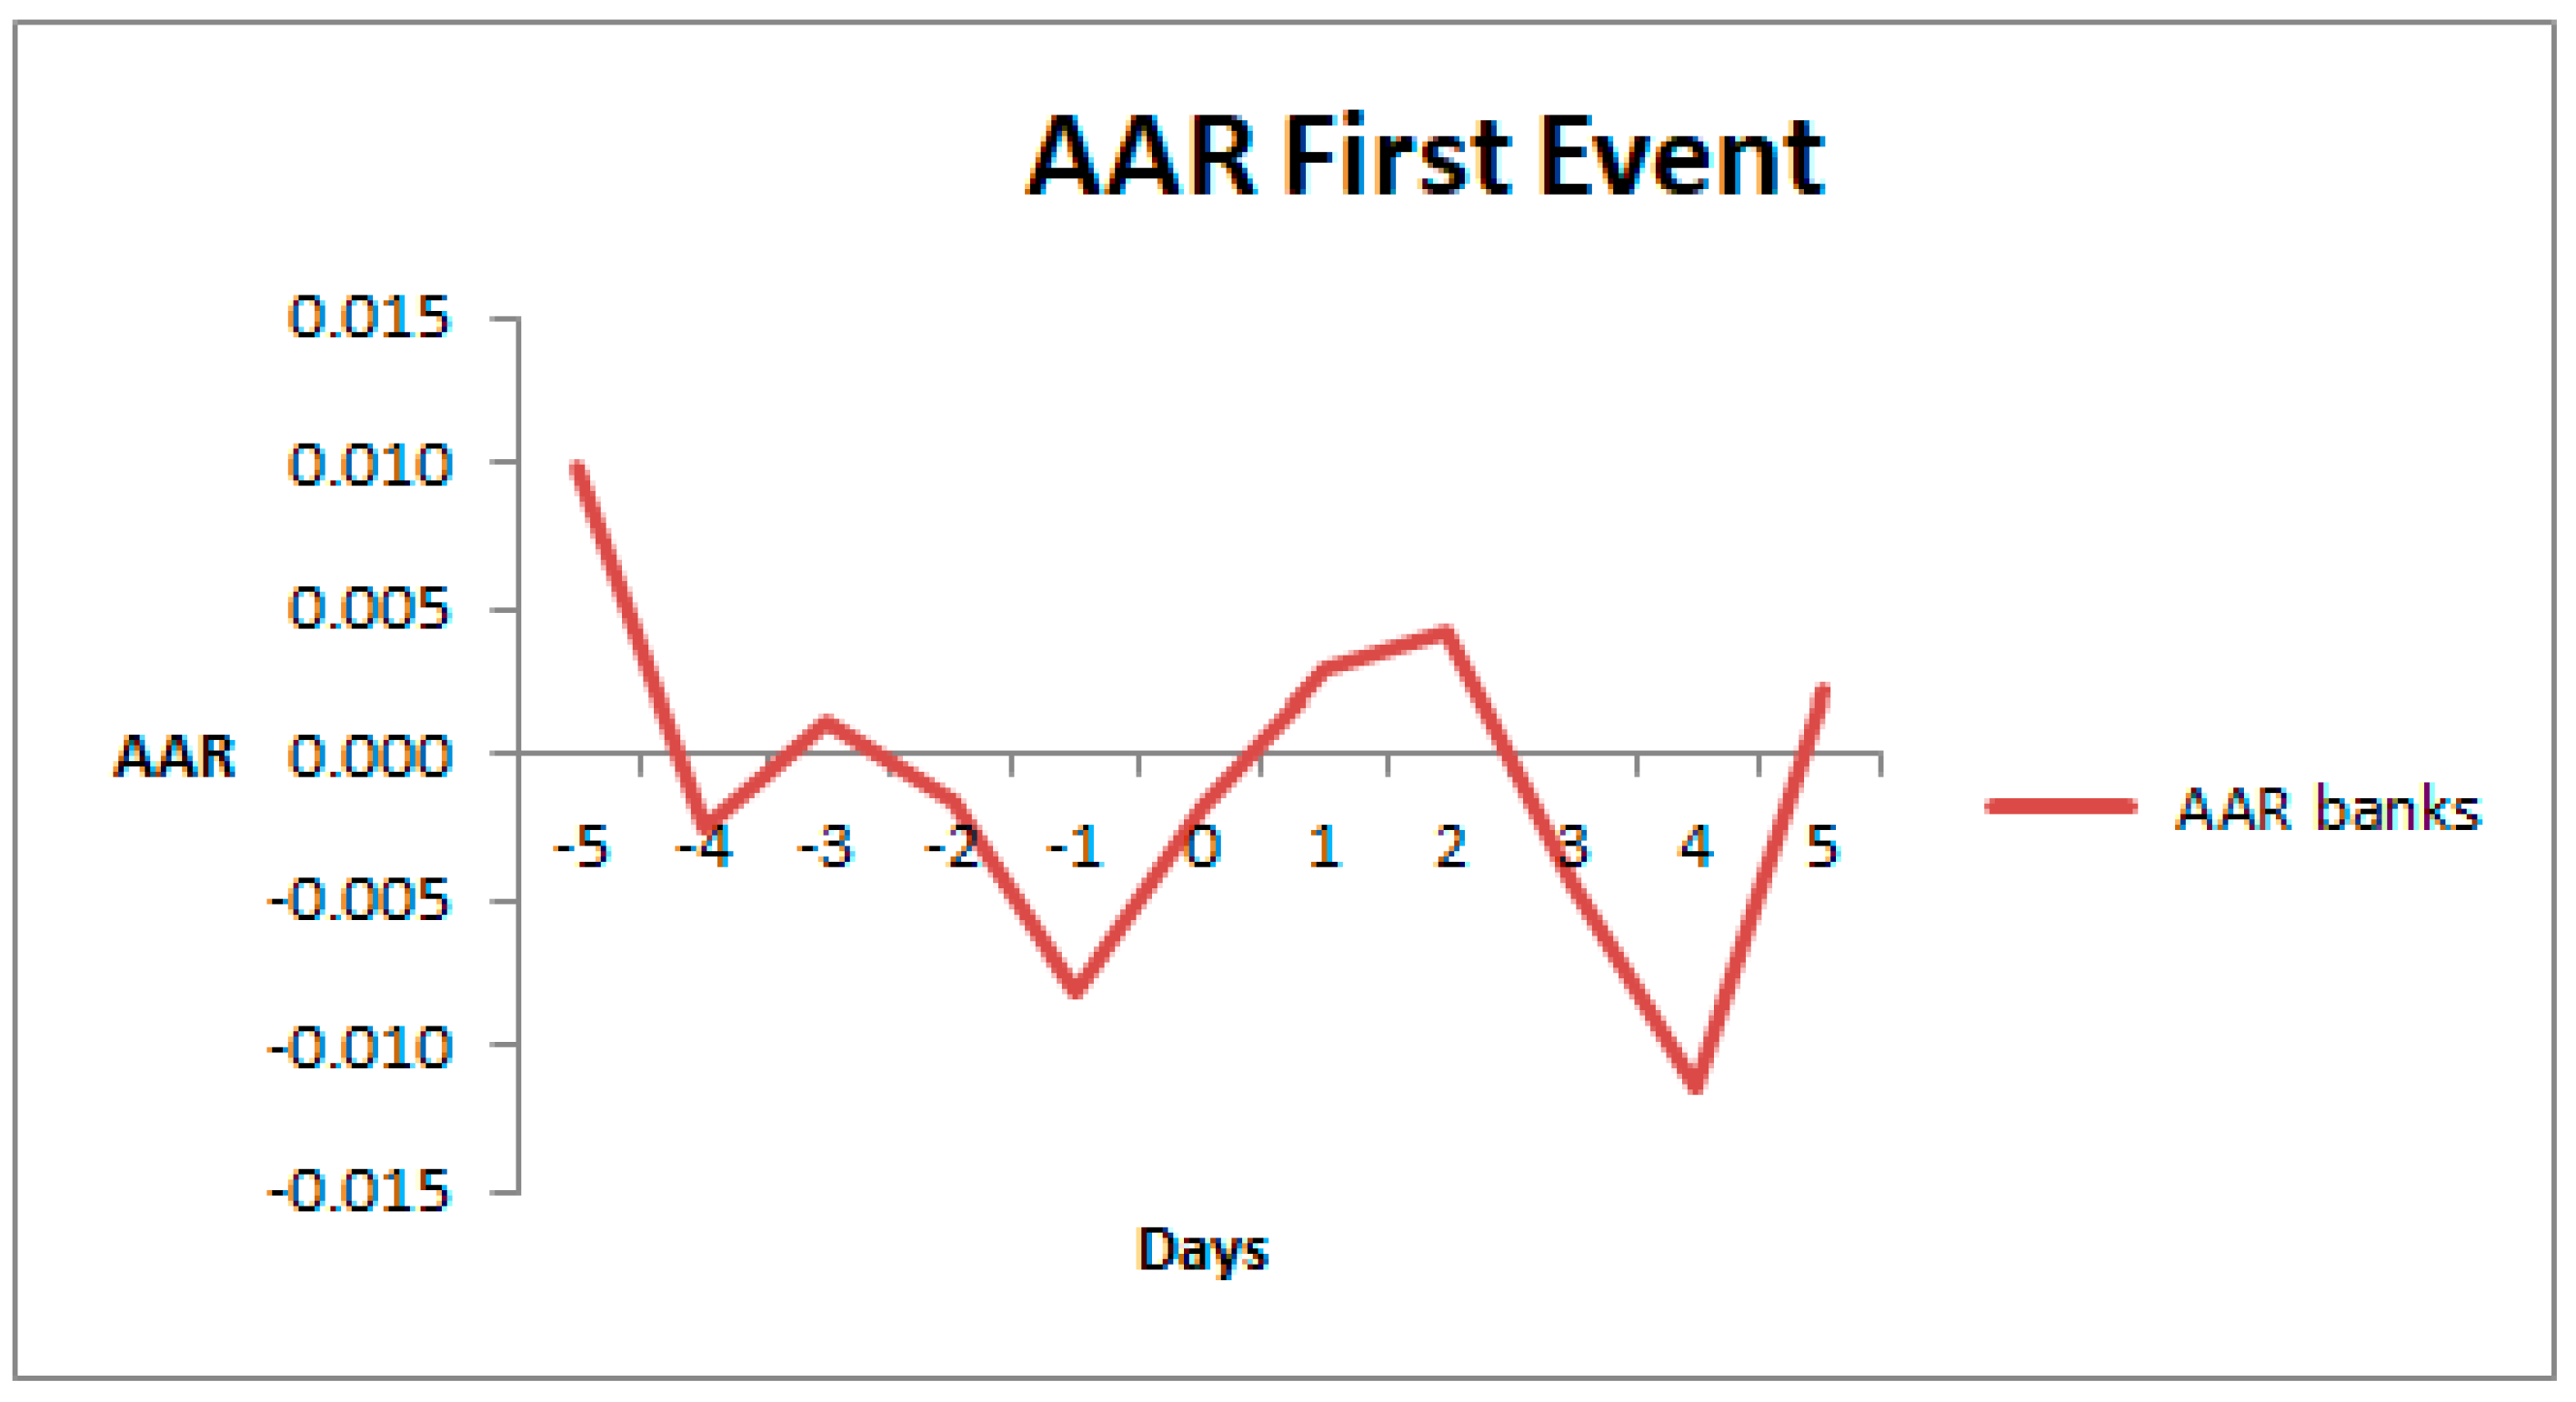
The daily AAR and CAAR are presented in the next tables along with the results of the t statistic test. AAR values were plotted in order to make the impact for banks clearer. Table 2 represents empirical findings for the first event. It revealed that the AAR on the event day was −0.0018249 it does not give any evidence of statistically significance. Additionally, it shows that AAR of days −5 was 0.00982271 statistically significant at 10%. This suggested that the market reacted earlier than the actual event. However, because this happened five days before the event date it might be an effect of other external factors such as economic, politic, or social news. During the post event period AAR on day 2 was 0.00427891 statistically significant at 10%. This indicates that the market reacted even later than the announcement of the event as can be seen from Figure 4.
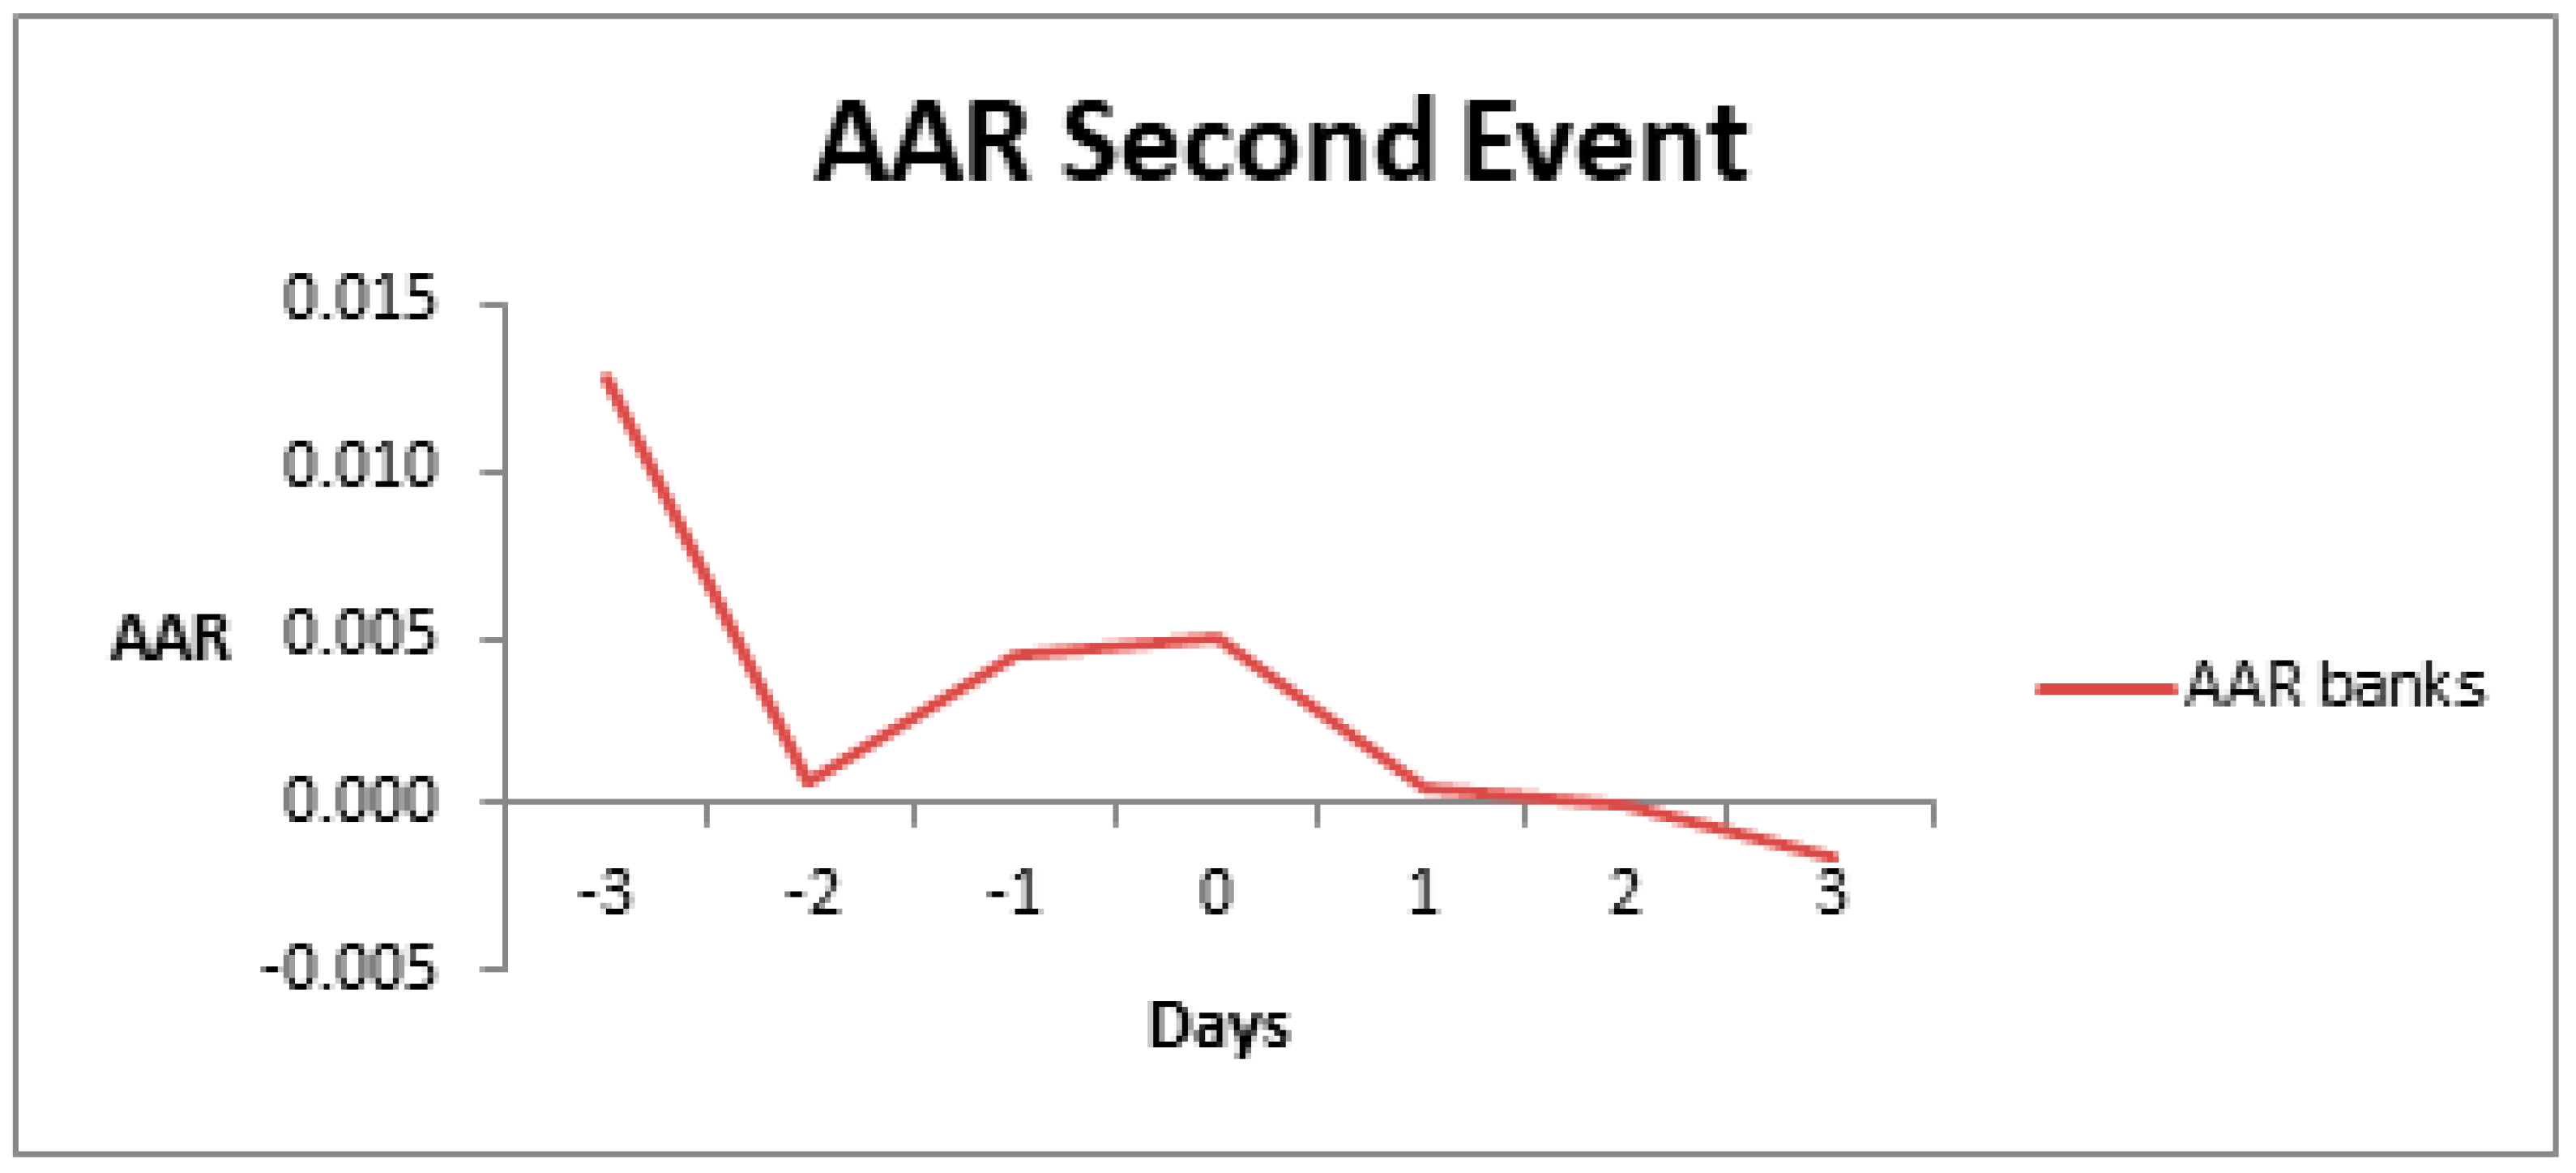
Table 3 represents empirical findings for the second event. Findings reported in the table illustrates that the AAR on the event day was 0.005036 statistically significant at 10% and 5%. This gives evidence that the news reflected immediately on the share price of banks. On day −3 the AAR was 0.01270, the highest in the event window, but not statistically significant. AARs were plotted, in Figure 5, to present a clearer picture of the impact.
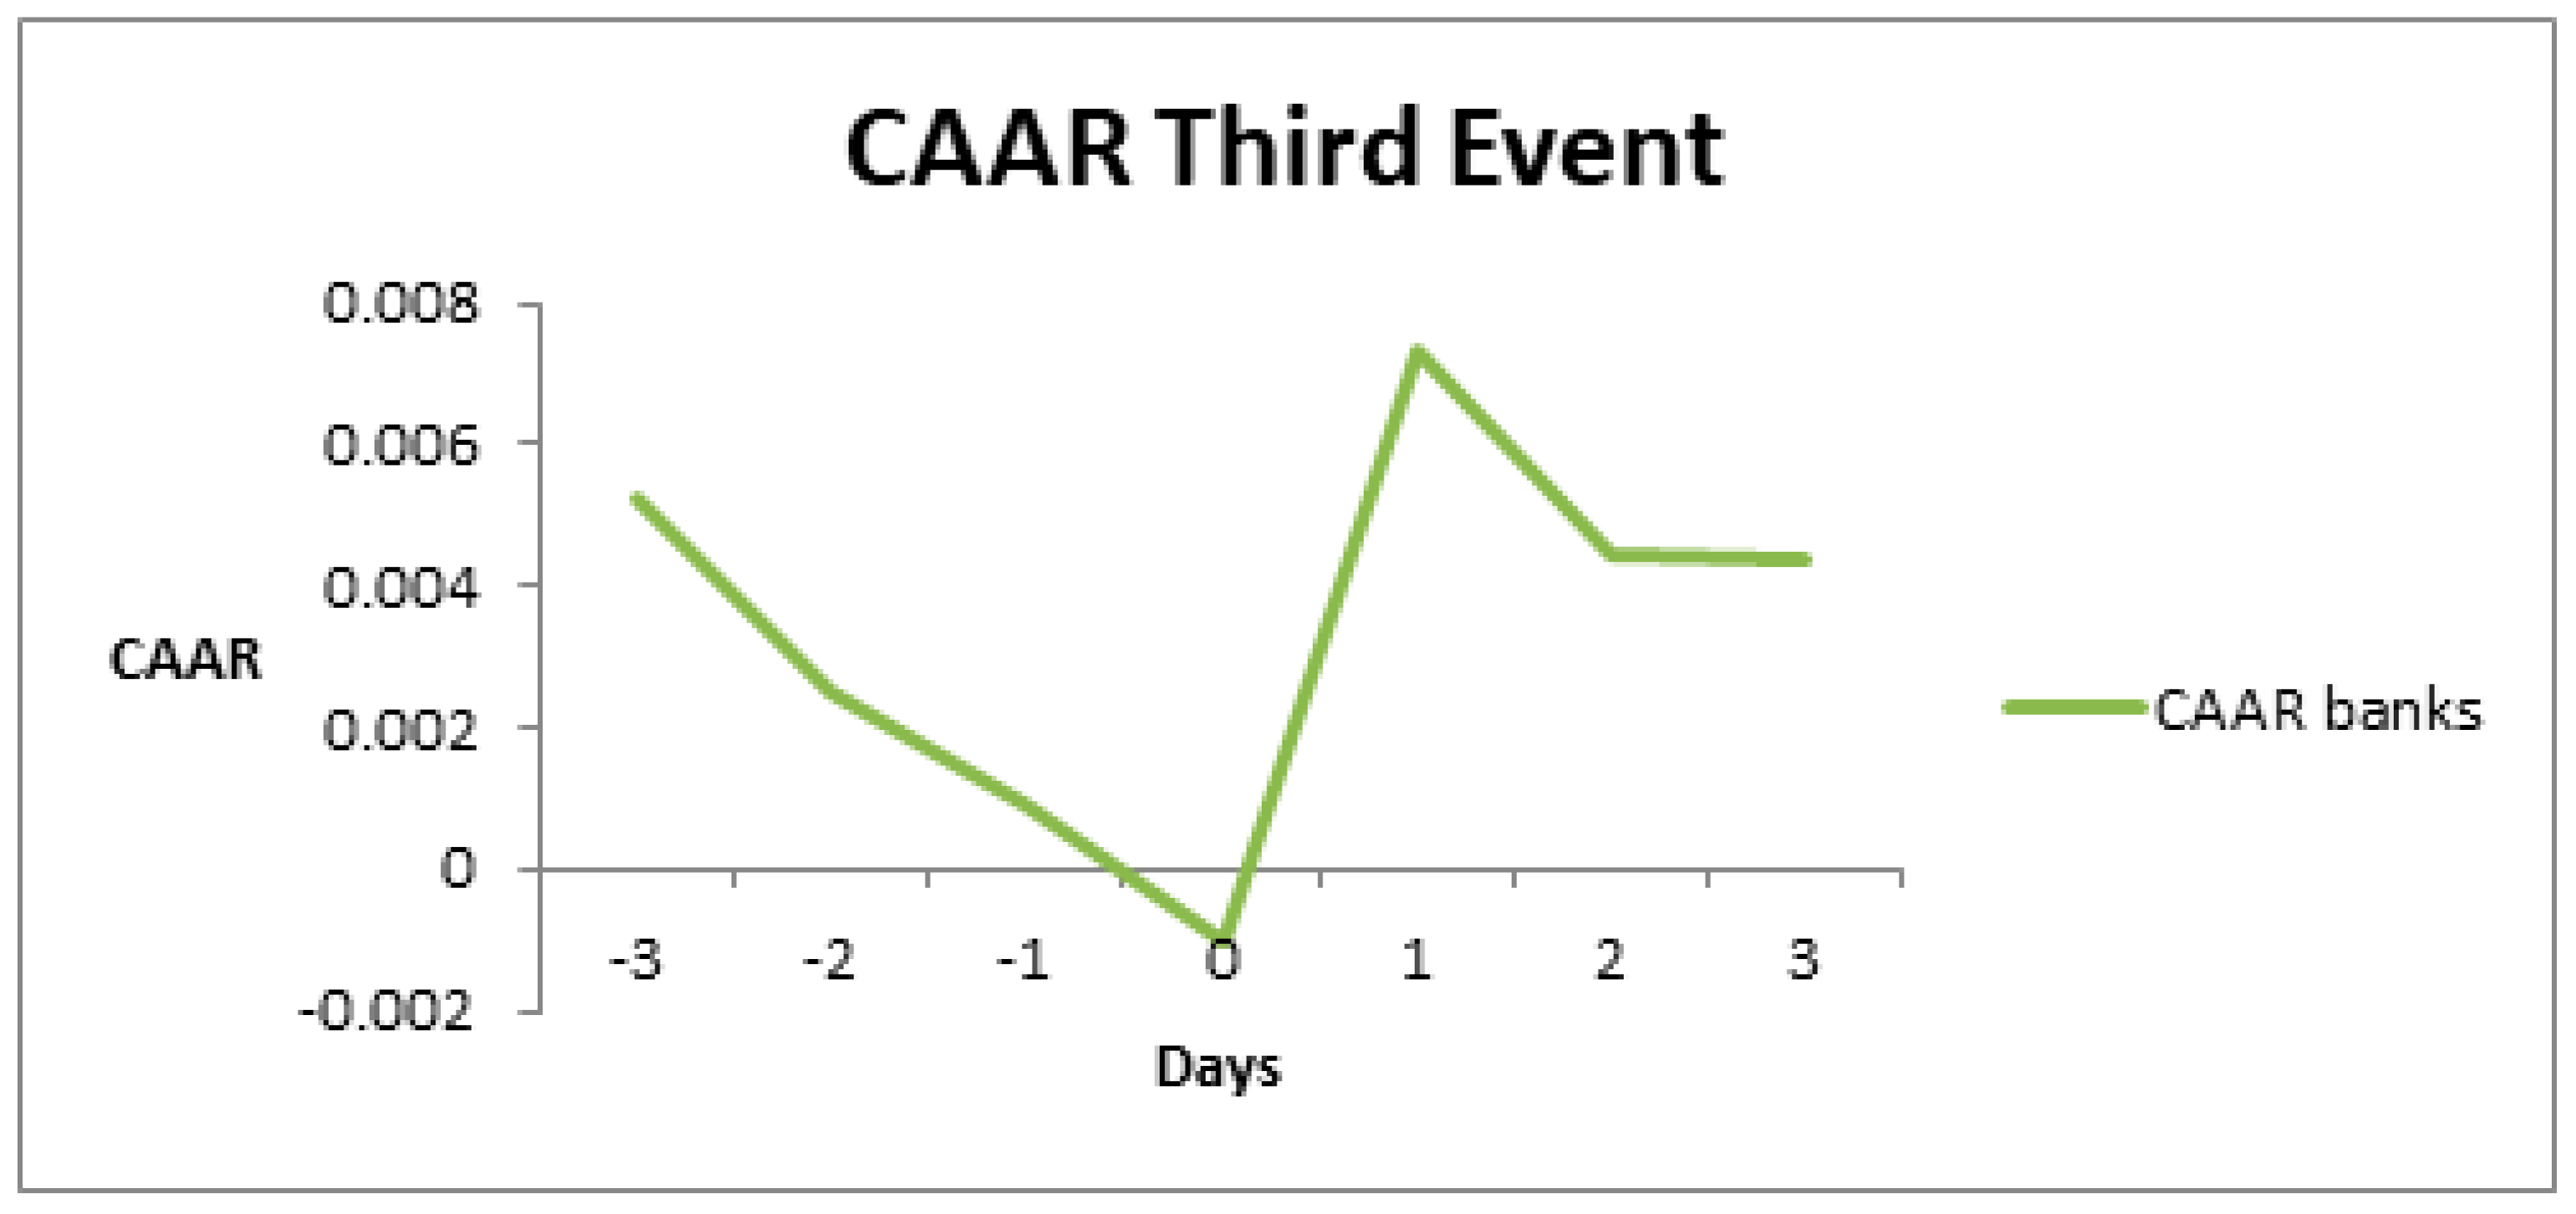
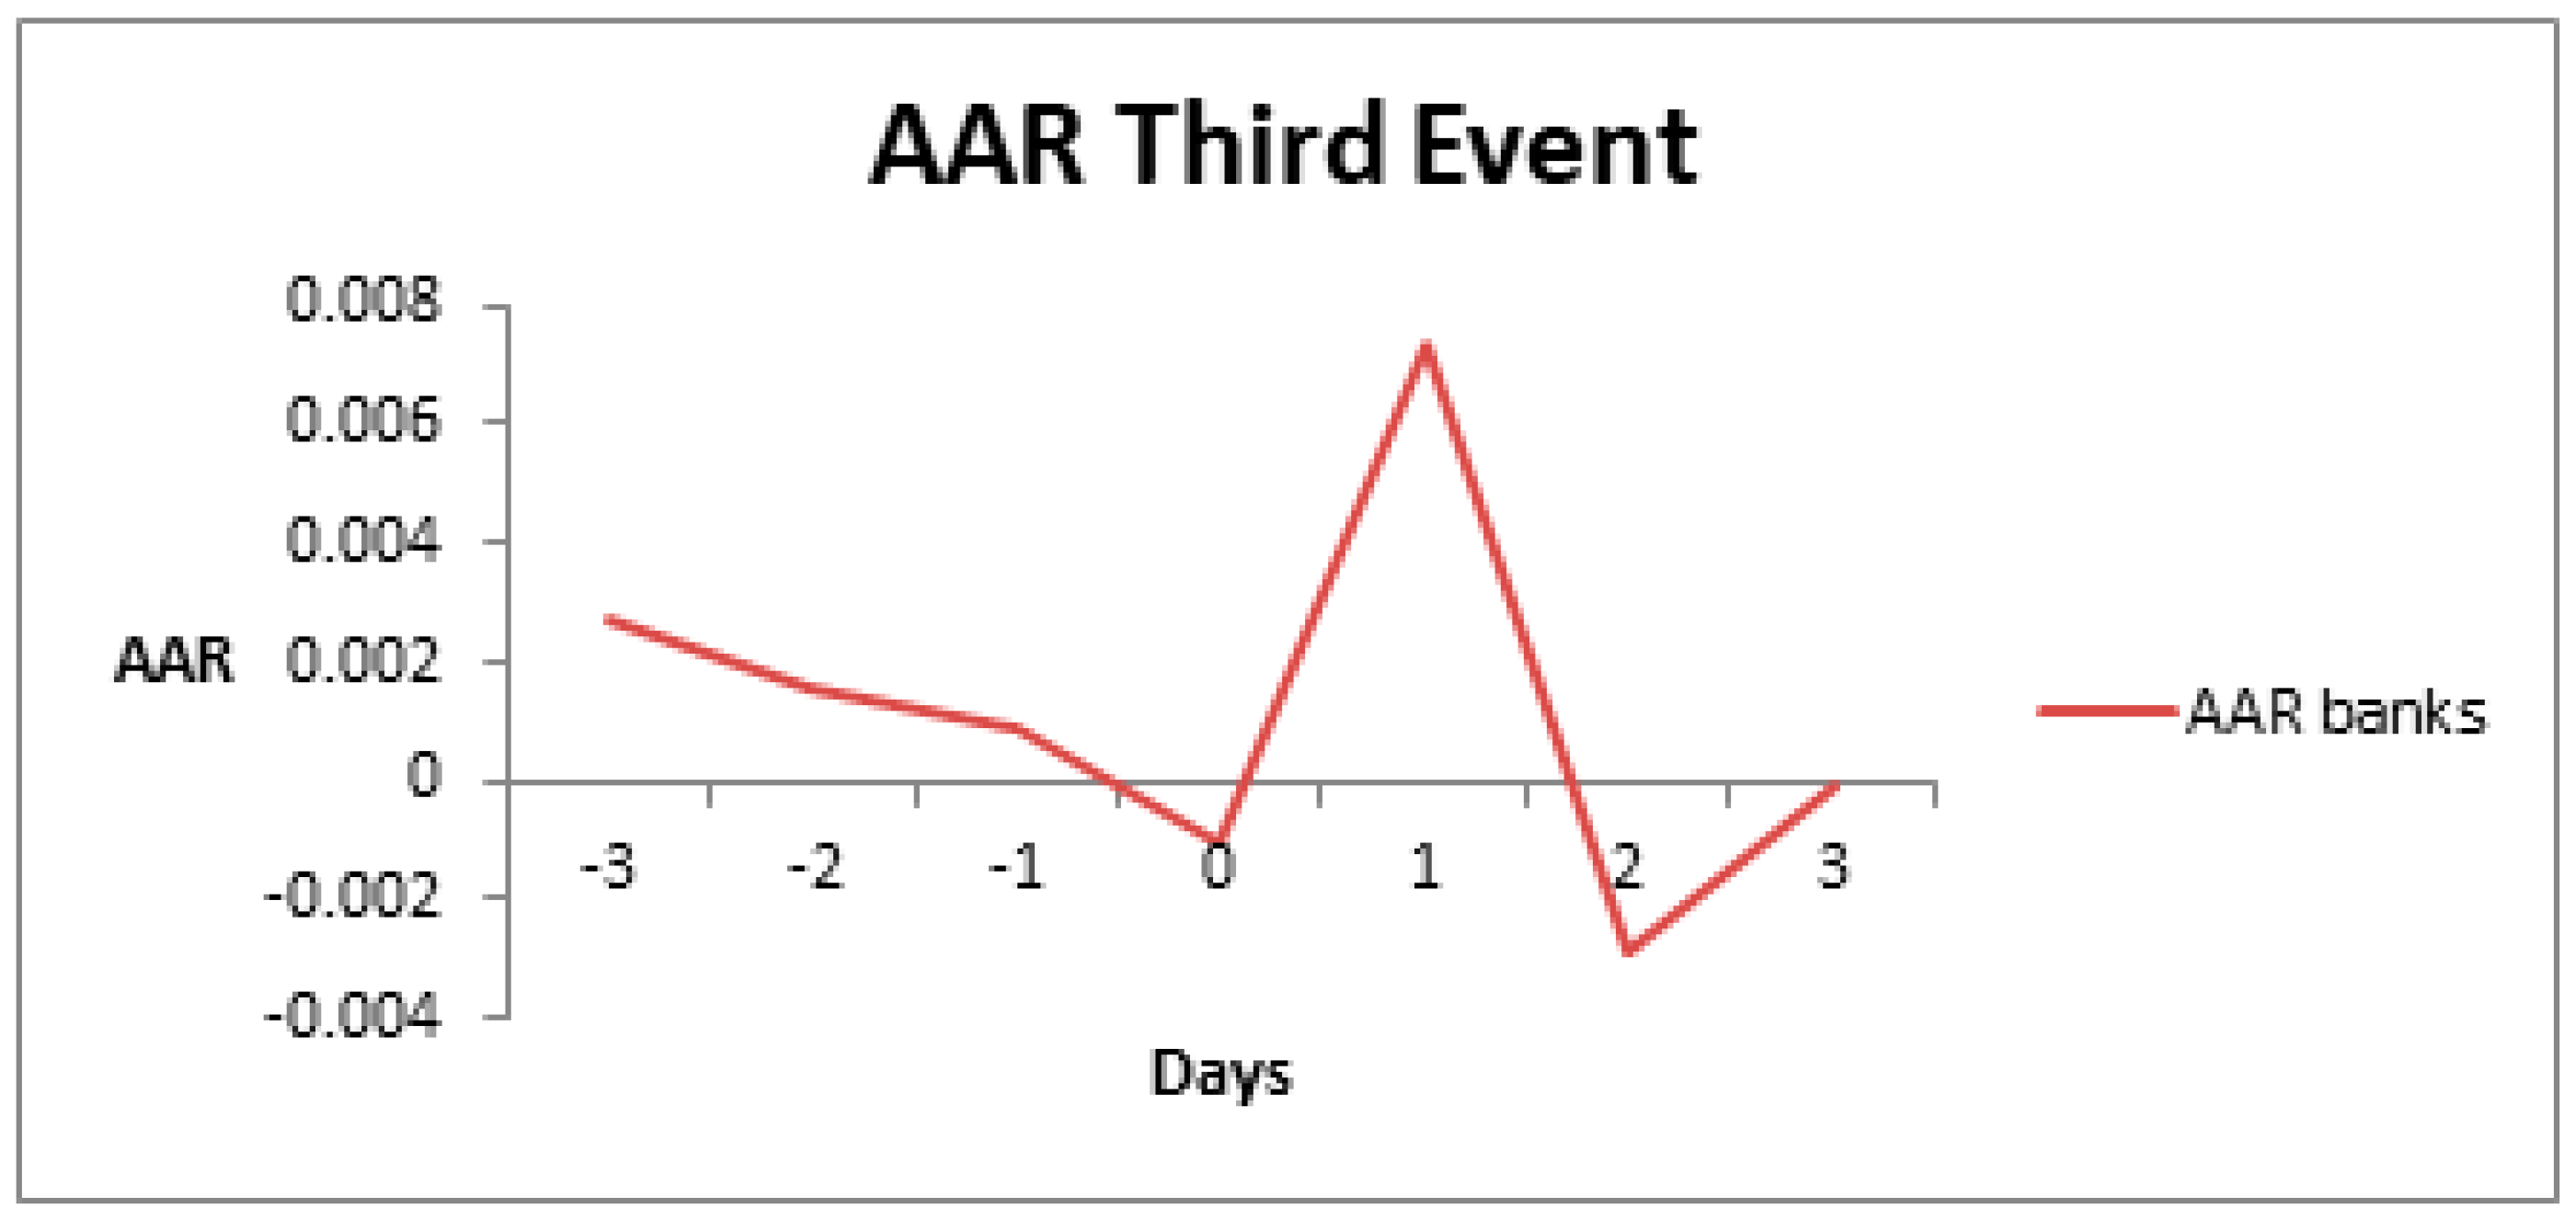
Finally, Table 4 represents empirical findings for the third event. For this particular event the news did not alter significantly the pattern of banks’ stock returns. This could be due to the fact that the market already anticipated this development. However, in the post event window on day +1 the AAR was 0.007341 and was statistically significant at 10%. AAR have been plotted, in Figure 6, to illustrate the pattern of the reaction.

4.4. T-Statistics Analysis for Insurance Companies

From the overall sample of 24 companies there were 18 insurance companies. The three following figures present the daily and cumulated t statistics for insurance companies, reporting these values on the vertical axes and days along the horizontal axis.
The critical values for the 18 insurance companies are reported in Table 5.
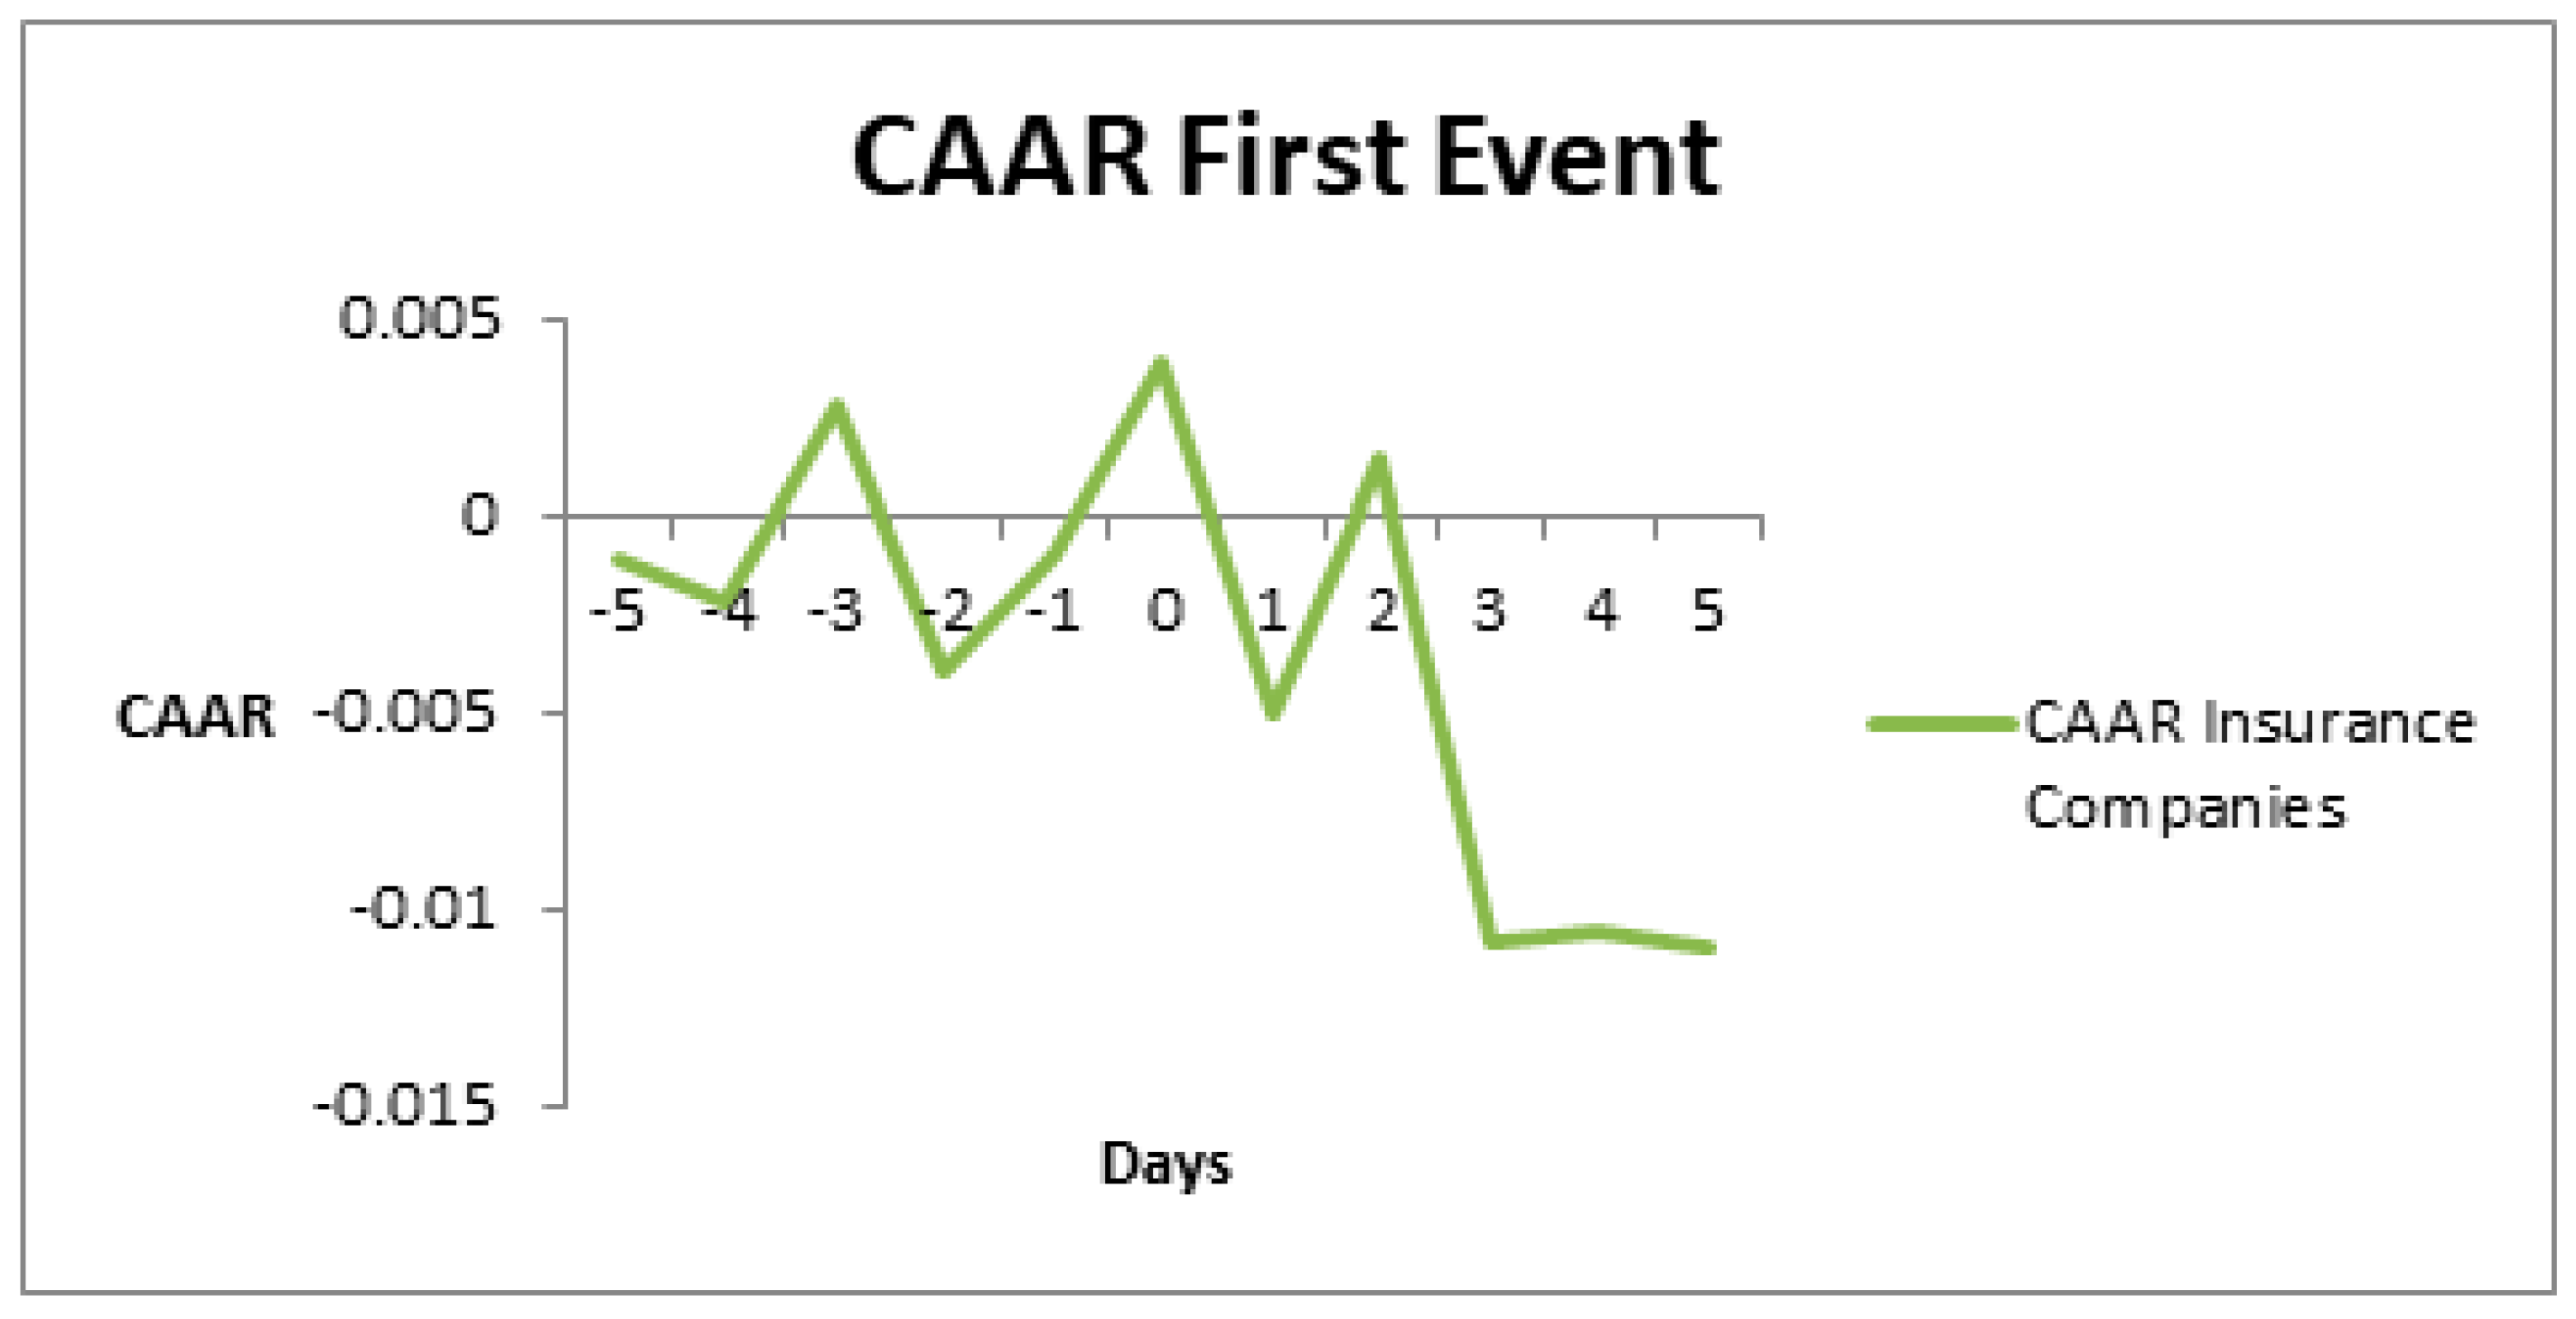
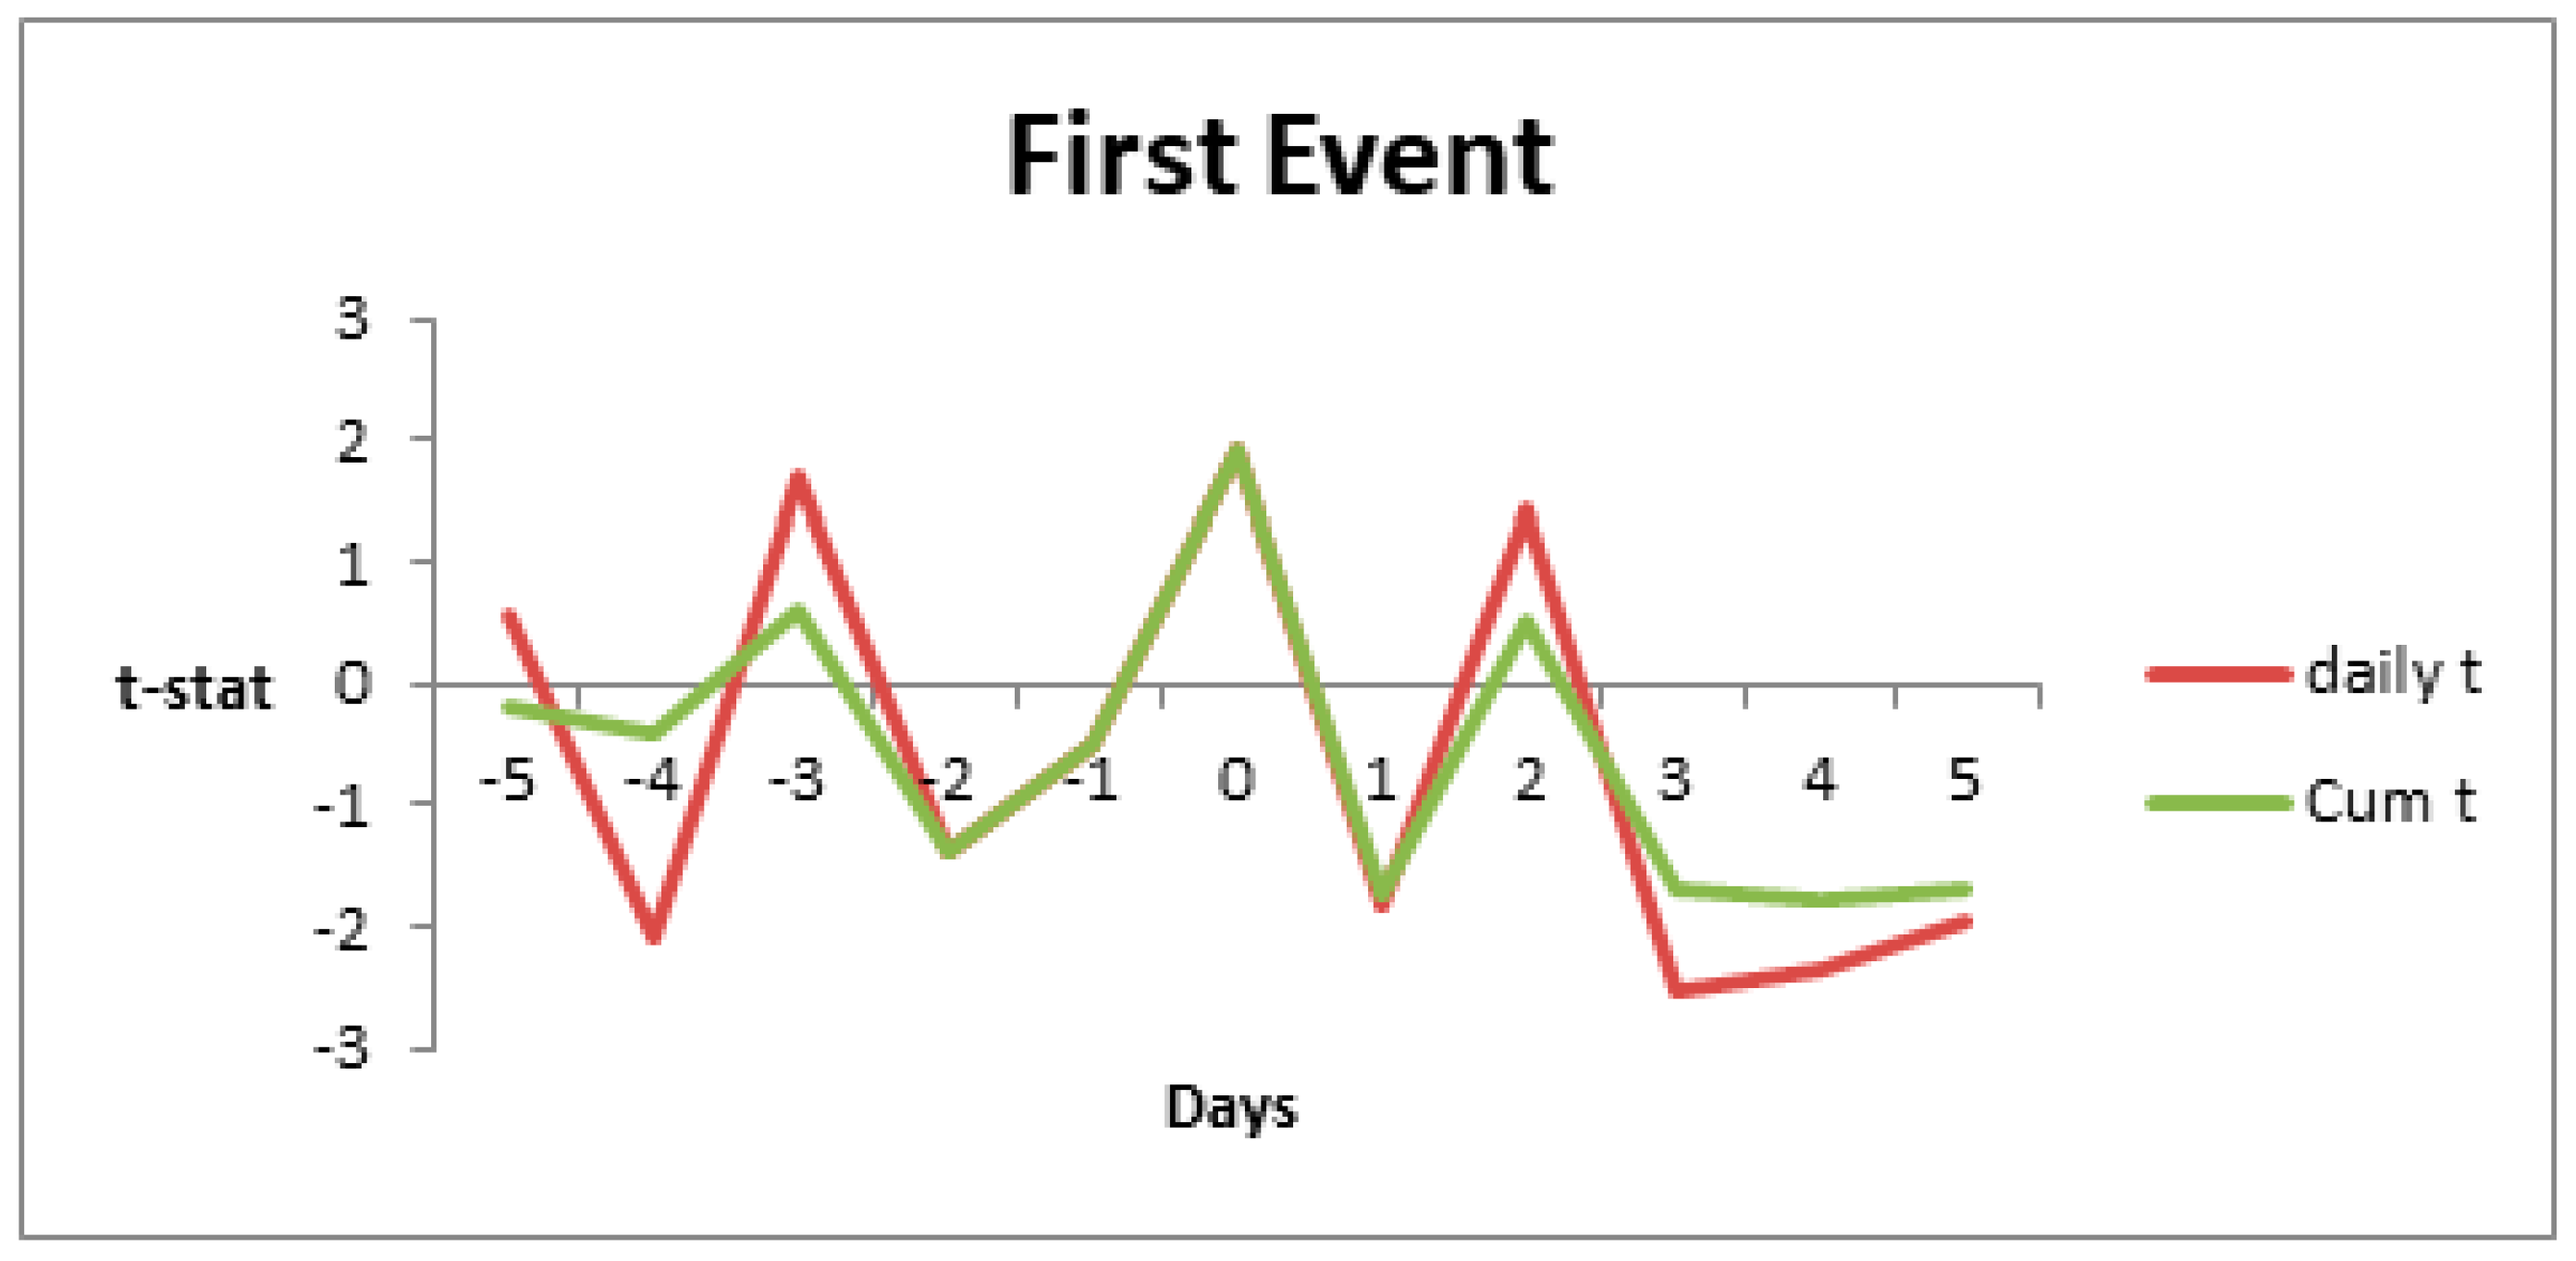
Figure 7 relates to the first event over a window period starting from day −5 to day +5 and shows that both series fluctuated positively as well as negatively. However, these values dropped in the post event window on day 3, 4, and 5, more precisely, daily t statistics were statistically significant at 5% and 10% on day 1, 3, 4, and 5 with values −1.84315645; −2.54529159; −2.34910317, −1.96717798, respectively, and cumulative t were statistically significant at 5% and 10% on day 1 and 4 with values −1.743156445 and −1.793377224, respectively. The whole pattern may suggest that the share price reacted negatively to the event with a delayed reaction or, because the reaction started at day 2, there might have been some other events occurring along to the event. AAR has been plotted, in Figure 7, to illustrate the pattern of the reaction.
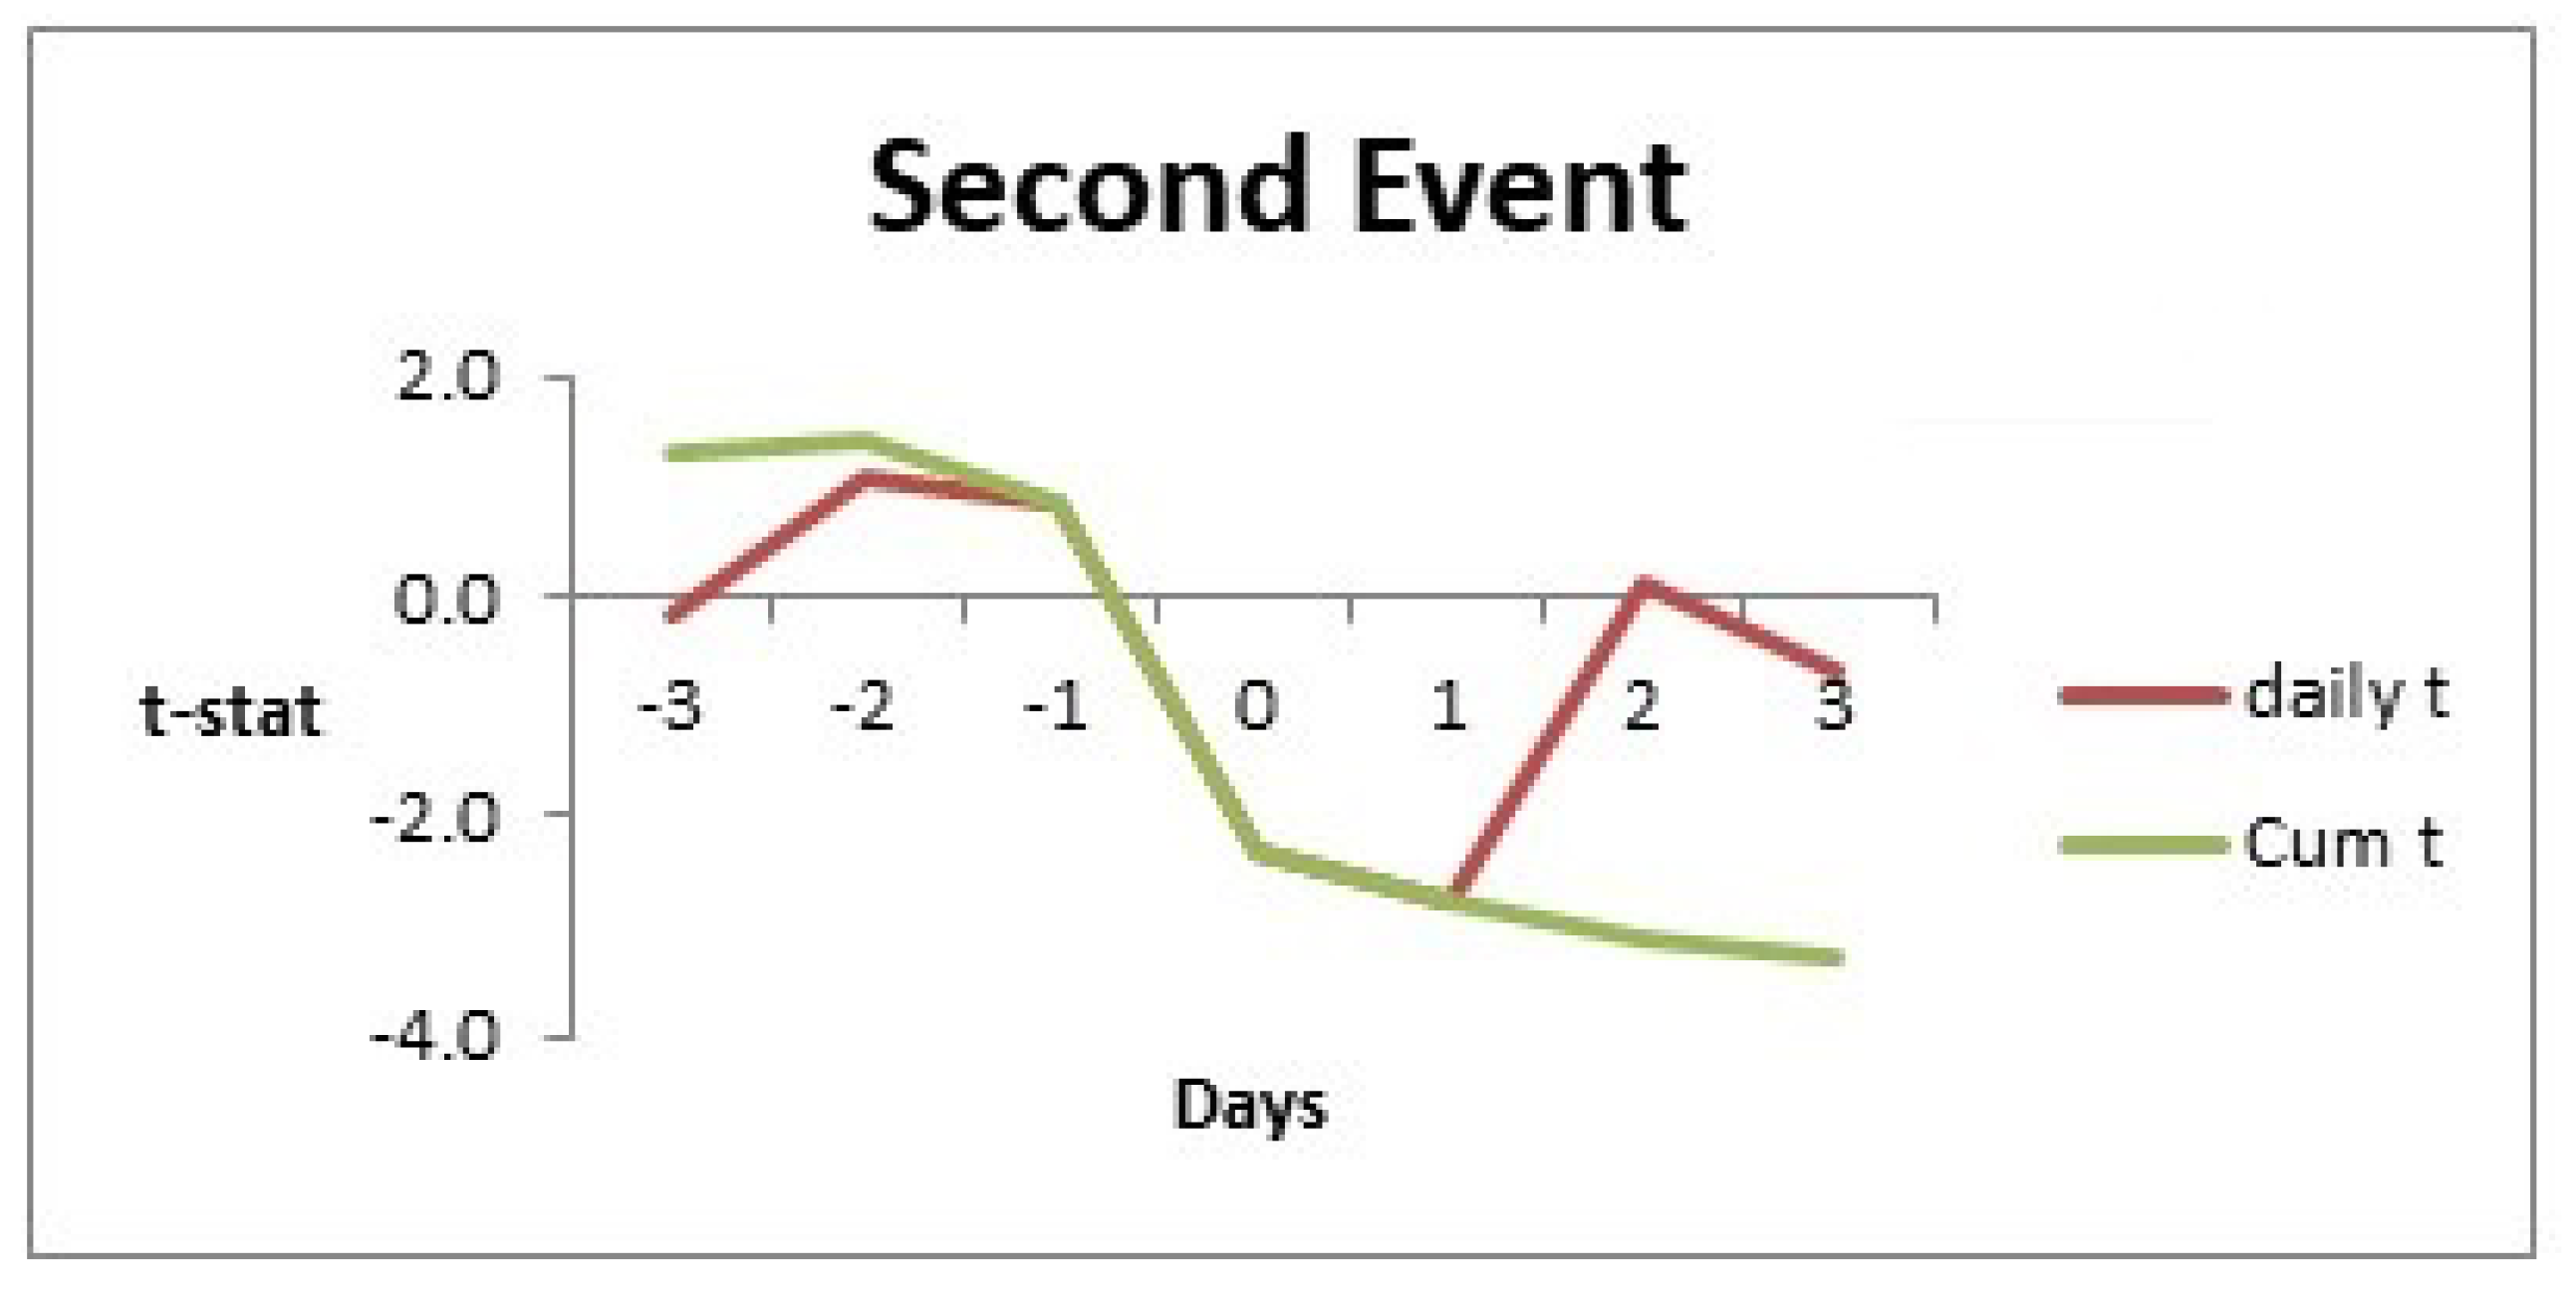
Figure 8 relates to the second event over a window period starting from day −3 to day +3. As can be seen, for both series, values were positive in the pre-event window, and then plummet just before the event day. On the one hand, daily t statistic values presented only two values statistically significant at 5% and 10%, on the event day and day −1, −2.33033 and −2.79999, respectively. On the other hand, the cumulative t showed a negative reaction for the whole post event window included the event day with values −2.33033; −2.79999; and −3.13392, respectively; −3.30548 all statistically significant at 5% and 10%. In this case, there was a negative reaction to the insurance companies’ share price.
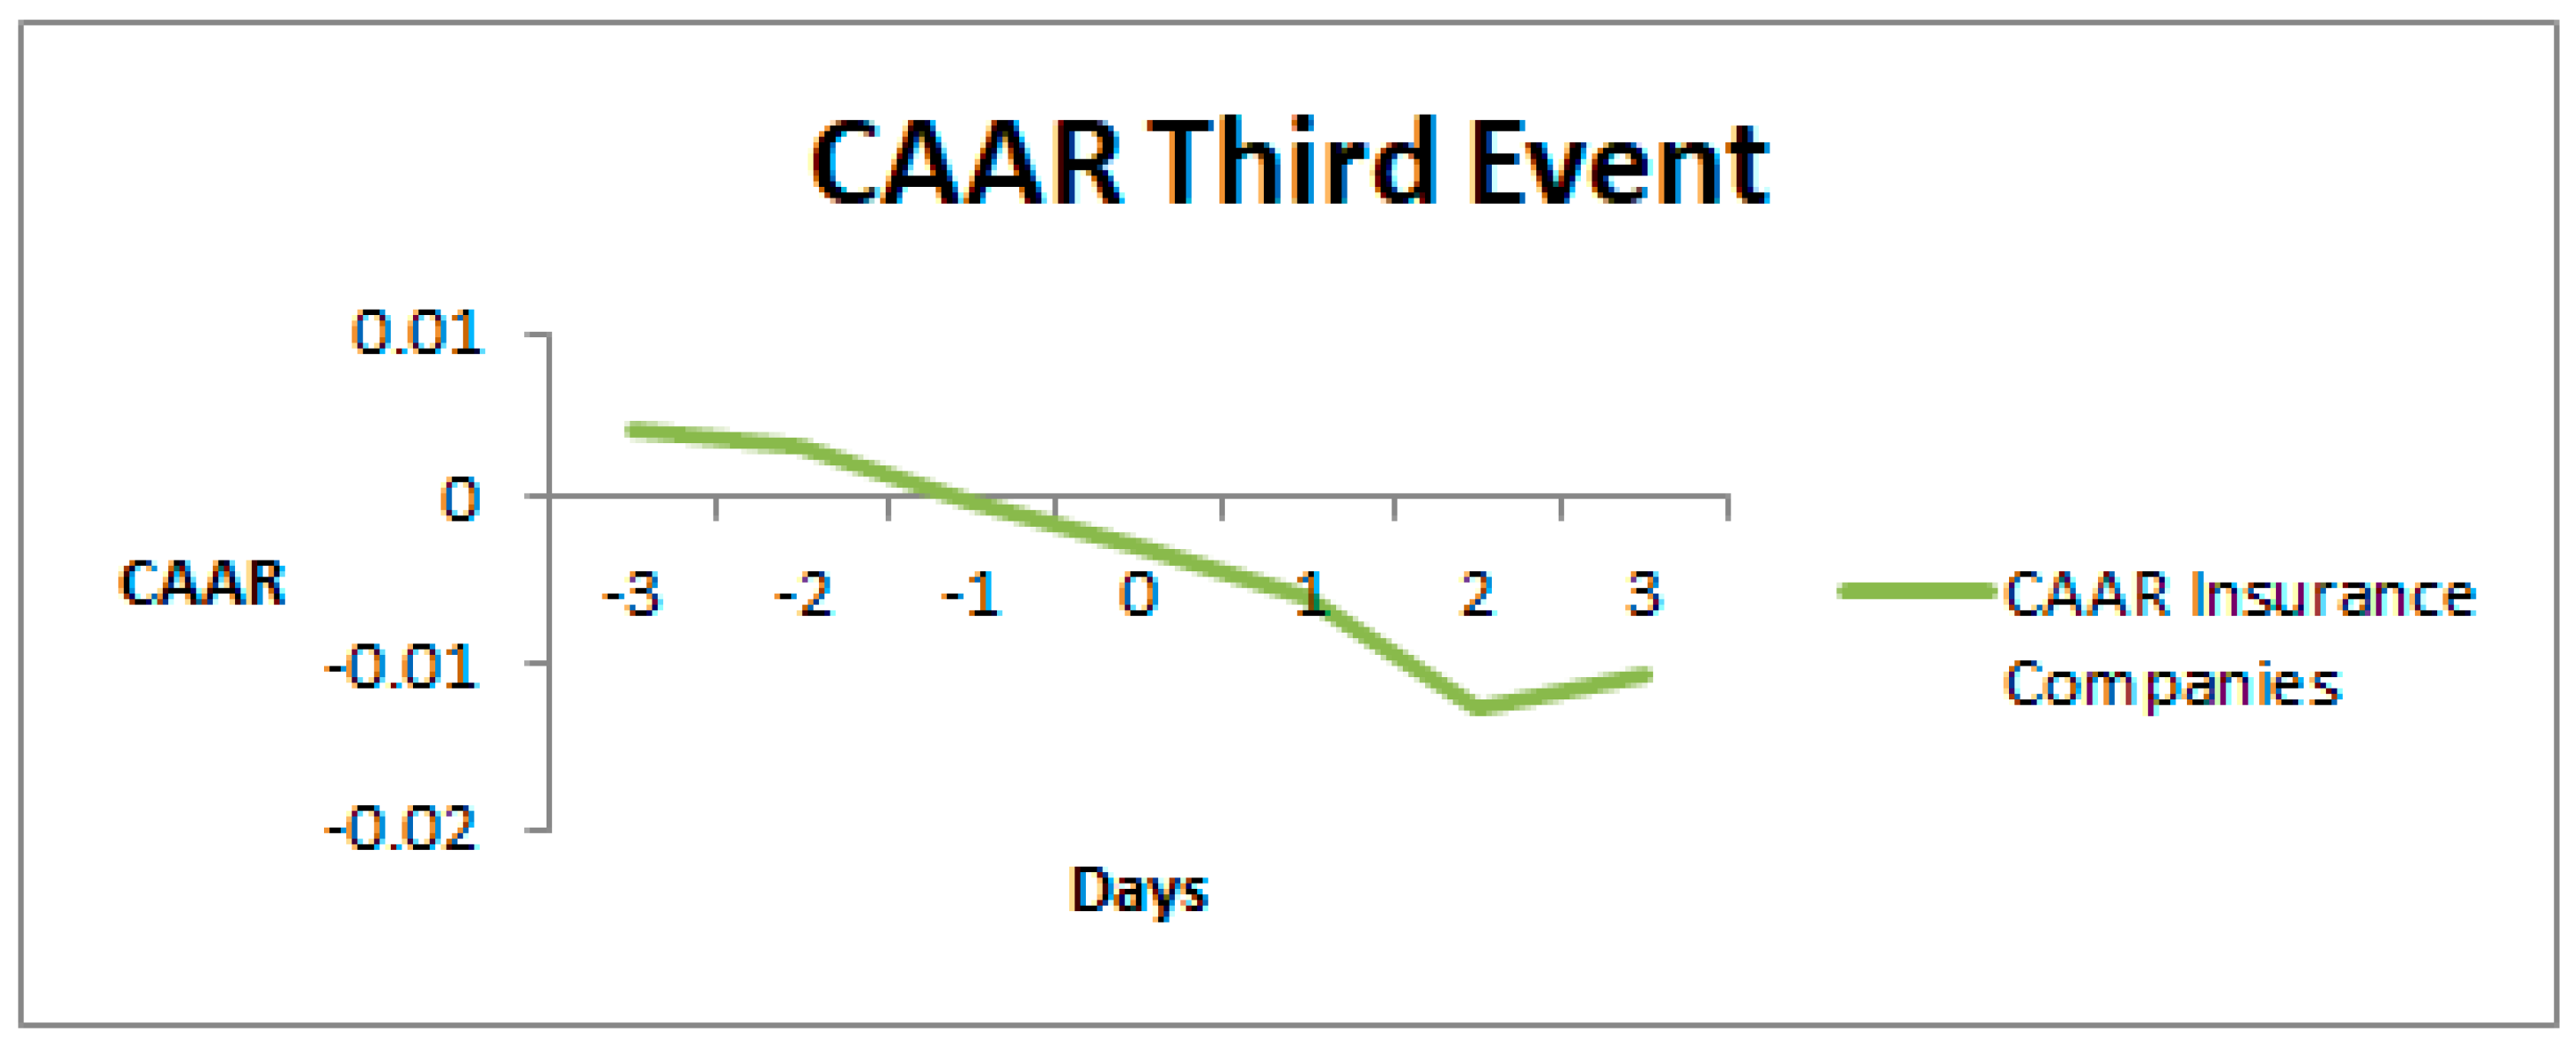
In conclusion, Figure 9 relates to the third event over a window period starting from day −3 to day +3. This pattern is similar to the second event; in fact it shows a negative reaction from insurance companies. There is only one statistically significant value on day 1 which was −1.84805 negative and statistically significant at 5%. Conversely, cumulative t presented all negative statistically significant values on days −1 −2 and −3, −1.84805; −2.44562; and−1.85014, respectively.

4.5. Empirical Findings for Insurance Companies

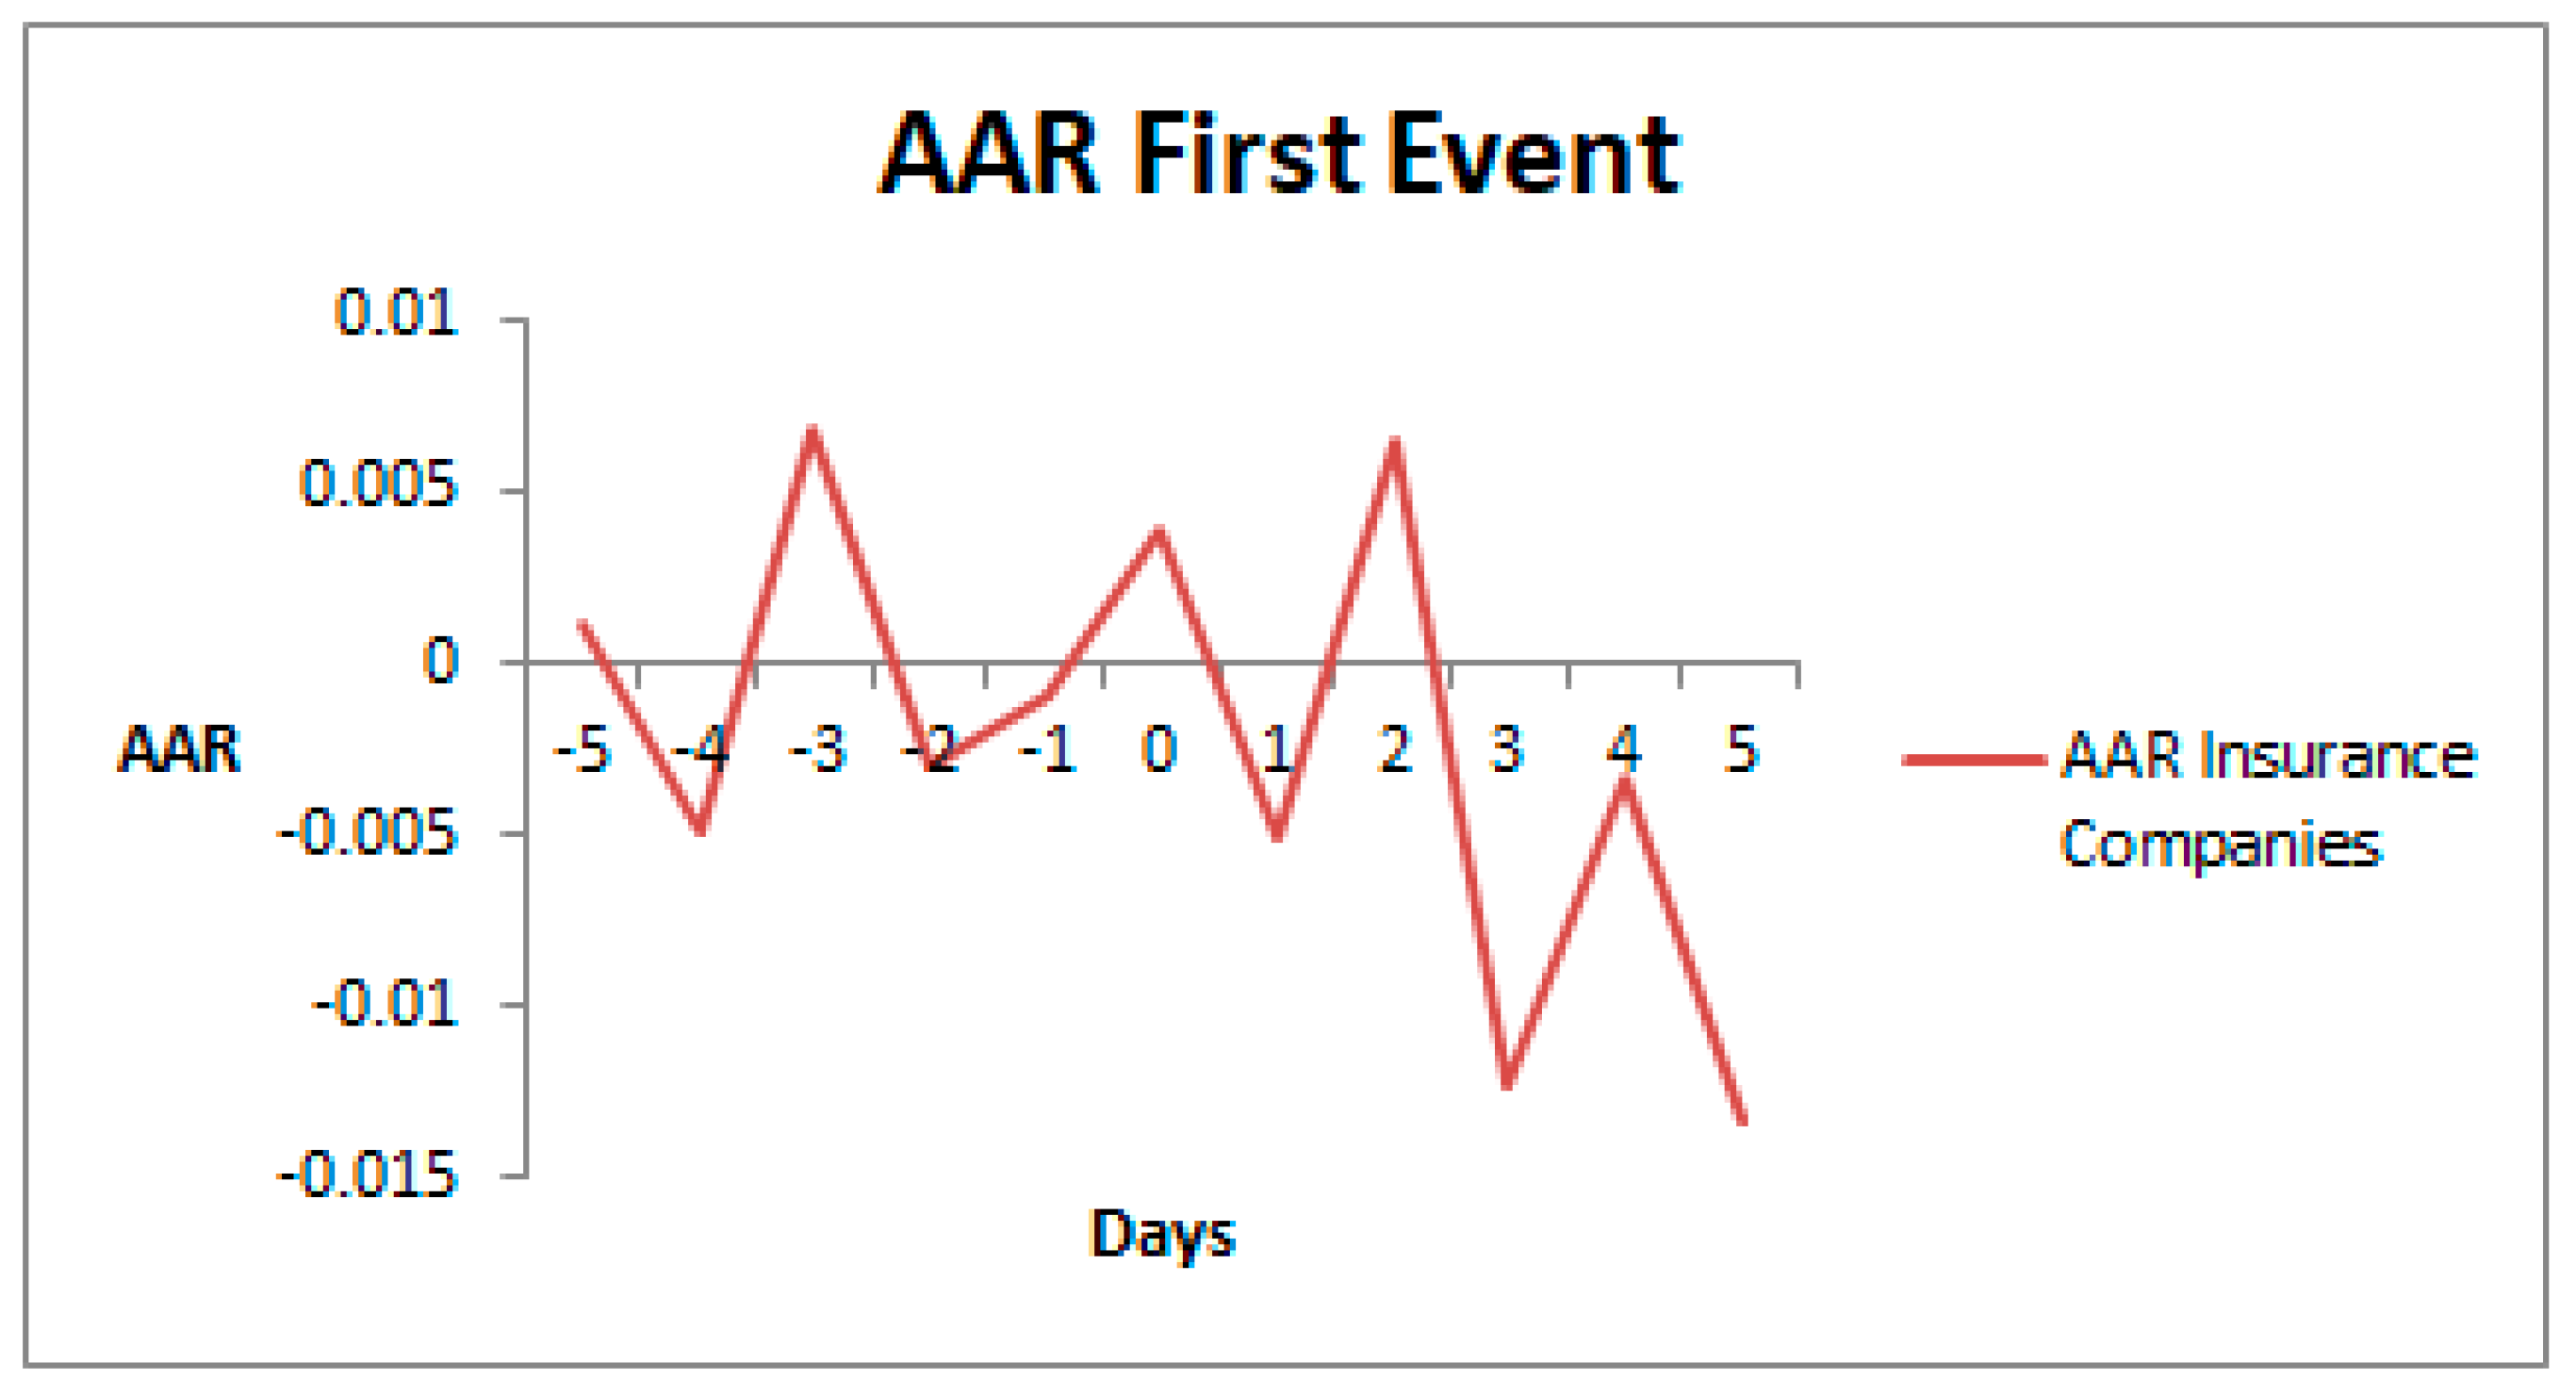
The daily AAR and CAAR are presented in the next tables along with the t statistic test. AAR values were plotted to provide a better picture of the reaction of insurance companies. Table 6 illustrates empirical findings for the first event. AAR for the event day was 0.00387735, statistically significant at 10%. Additionally, it shows that the AAR of day −4 was −0.00489615, statistically significant at 5% and 10%. This implies that the market reacted earlier than the actual event. During the post event window the AAR for the days 1,3,4, and 5 were respectably −0.00510419, −0.01225773, −0.00331292, and −0.01325873 all of them were statistically significant at 5% and 10%. This indicated that the market reacted even after the event was made and was a negative reaction as it showed Figure 10. These findings, however, should be interpreted with caution since the markets may have been affected by events unrelated to Banking Reform Act 2013 that occurred at the same time as some of the legislative steps.
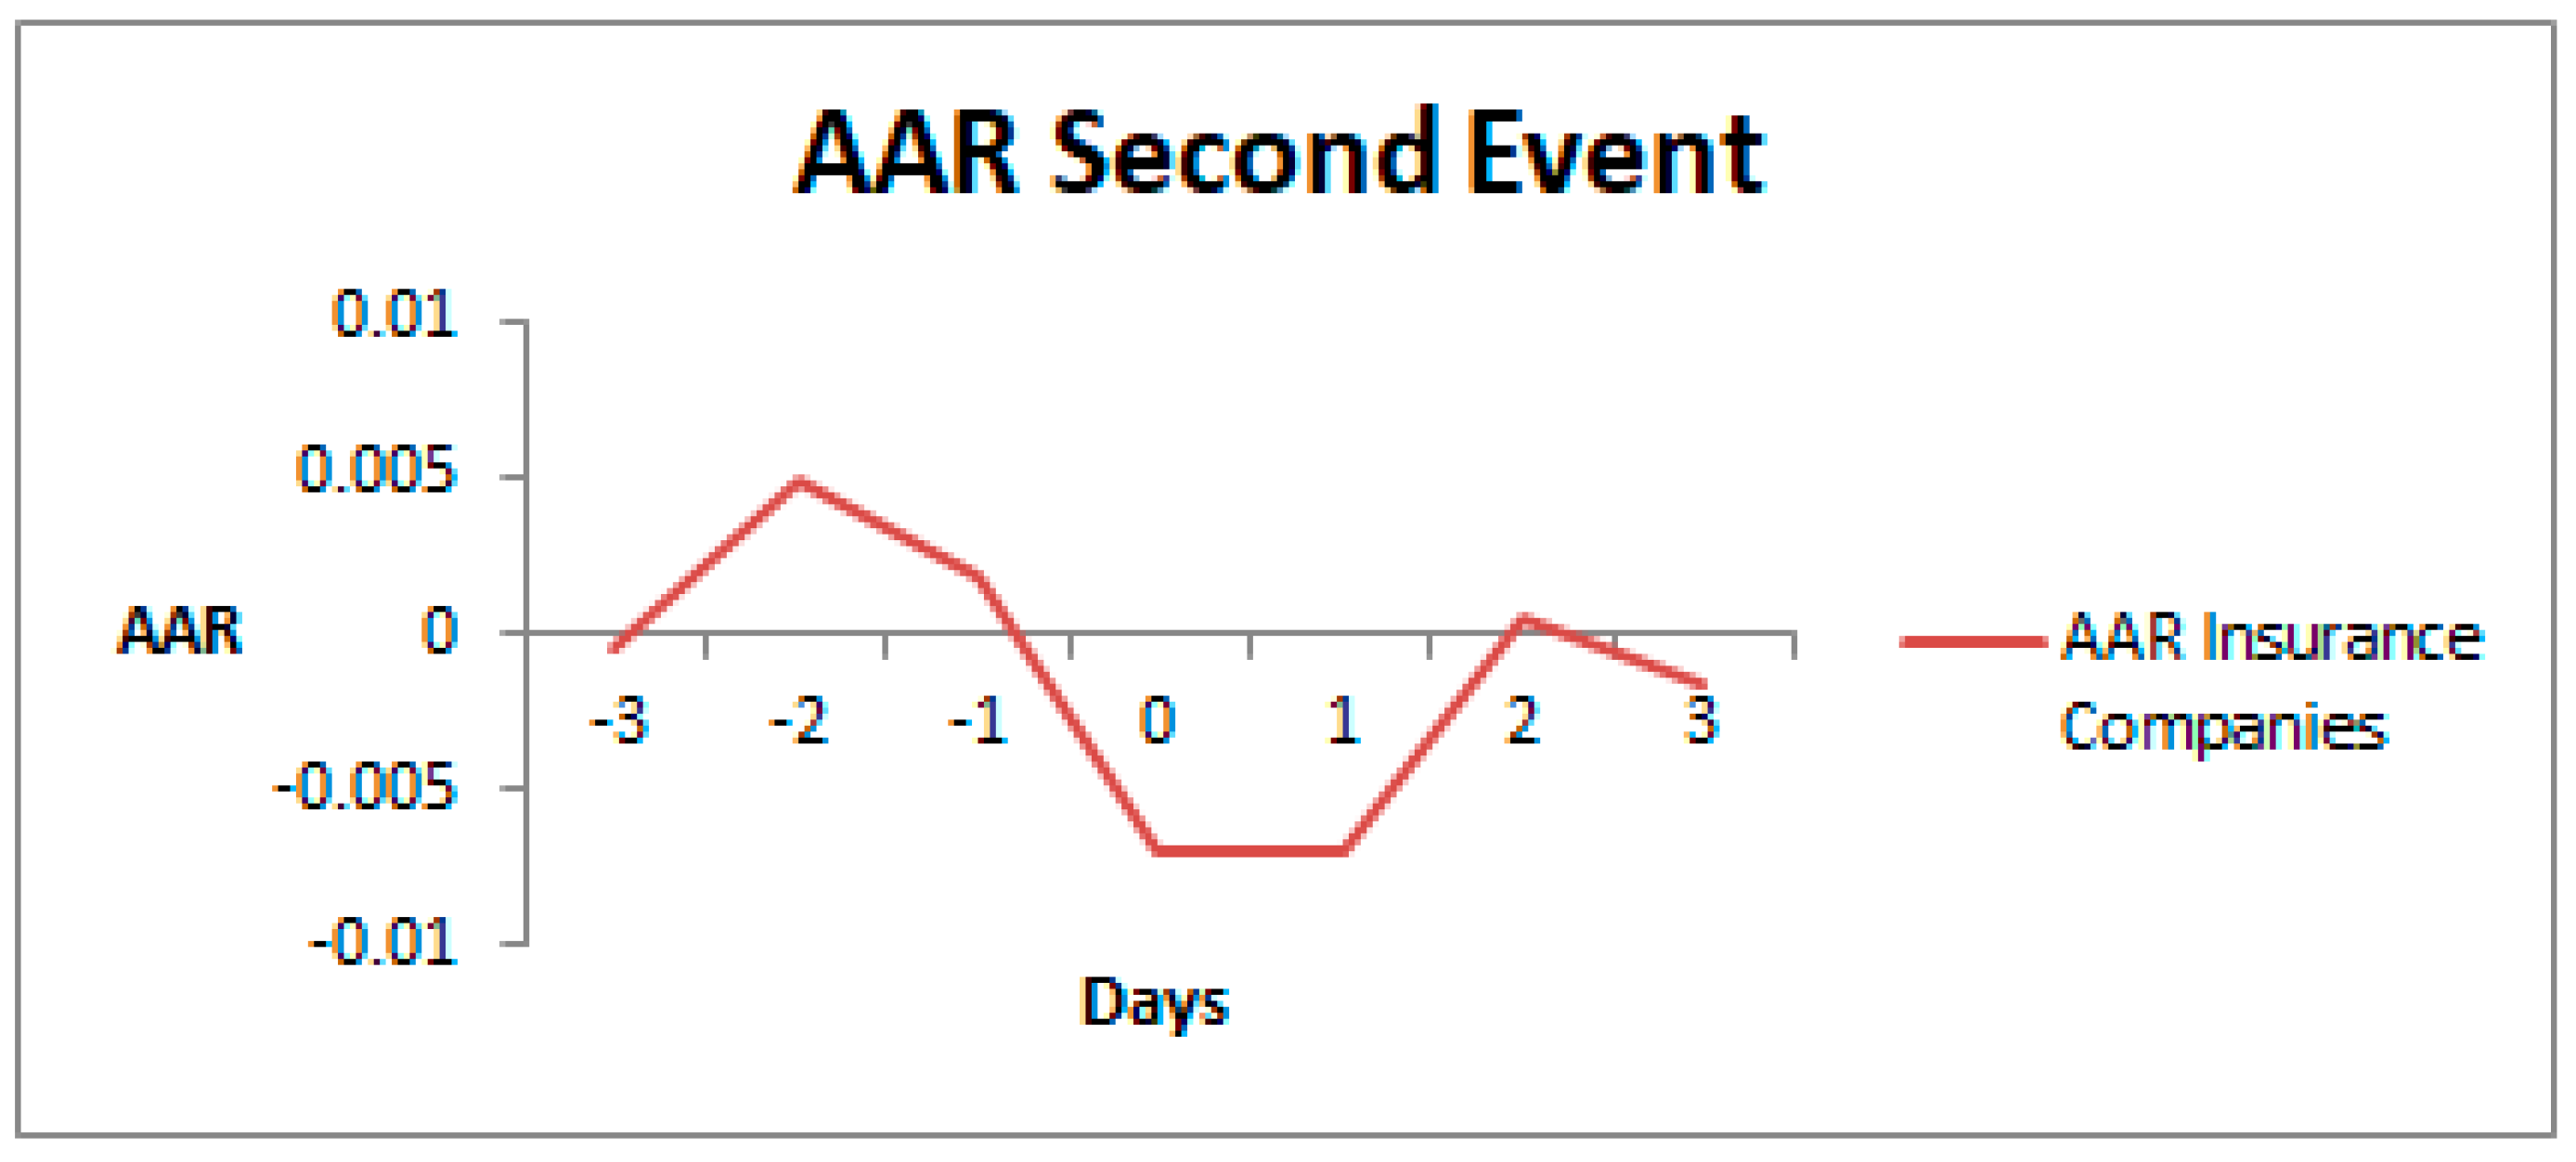
Table 7 represents the empirical finding for the second event. The table reported the AAR and the CAAR along with the t statistic over a window period starting from day −3 to day +3. The AAR on the event day was −0.00701562, the highest in the event period and statistically significant at 5% and 10%. At this stage the news immediately reflected the share price of insurance companies and this continues even after, as the AAR on day +1 was −0.00694735 and statistically significant at 5% and 10%. From the Figure 11 it seems that insurance companies’ shares reacted negatively.
Lastly, Table 8 presents the empirical finding for the third event over an event window starting from day −3 to day +3. The AAR for the event day was negative, −0.00702, and not statistically significant. Conversely, the day +1, presented a negative AAR −0.00601 which was statistically significant at 10%. This indicated that the market reacted negatively after the event was realised as showed in Figure 12.
CAARs for each event and for both banks and insurance companies are reported in Appendix B. As earlier stated, the advantage of using CAAR is that the sample abnormal return (AAR) alone may not be a powerful indicator if a leakage of information occurs. CAARs, by capturing the cumulative effect of the AARs, adjust for this.

5. Discussion

5.1. Comparison of the Effect on Banks and Insurance Companies

In this section a comparison between the reaction of the market to banks and insurance companies, for each event, is presented and the discussion is associated with the pictures (one for each event) which showed the trend reaction on the group of companies. This section concludes with a critical discussion on the results and comparison of the results with the existing literature.
Event 1
As can be seen from Figure 13 the reaction of banks is characterised from a net positive reaction on day 2: this is positive and highly statistically significant, however, because it is the only statistically significant value in the post window it could be associated to some other events that happened concurrently with our first event. The reaction of insurance companies was overall negative related to the passage of the Banking Reform Act 2013 in the House of Commons.
Event 2
Figure 14 illustrates that insurance companies experienced negative returns, whereas bank returns did not react significantly in relation to the passage of the Act in the House of Lords.
Event 3
Finally Figure 15 shows a positive reaction from banks and a negative and net reaction from insurance companies when the Act received the Royal Assent.
Overall, the impact of banks from the Banking Reform Act 2013 seems to be slightly positive and this is consistent with the fact that the Banking Reform Act 2013 was in favour of making banks safer, notwithstanding additional costs to be incurred on ‘ring fencing’ activities (Morse 2015). Contrarily, for insurance companies there was evidence of a negative reaction. A discussion on the possible reasons for these phenomena is provided in the next paragraph.

5.2. Discussion of Results

From the above illustrations, it emerges that the reaction of the market to the Banking Reform Act 2013 for insurance companies was deeper than that for the banks, and negative. There are two key risks that affect banks and insurance companies: moral hazard and adverse selection. Moral hazard is the risk that the existence of insurance will cause the policyholder to behave differently than he would without insurance. Barth et al. (2004) highlighted the fact that the existence of deposit insurance in banks influences depositors in lacking of incentives to monitor banks and this encourages banks to take more risk. This process increased the moral hazard problem of deposit insurance.
Fahri and Tirole (2012) discussed that with deposit insurance, banks can engage in some risk strategies, for example, they could impose a higher interest rate to depositors increasing their deposit base and then use the funds to make some risky loan. They found that deposit insurance is a source of moral hazard, and that insured banks tend to participate in high risk activities. In this context larger banks, which might be supposed to be “too big to fail,” are more strongly incentivised than smaller banks to undertake risky strategies due to the government safety net. As a consequence, banks engage in riskier activities due to the fact that they are, to some extent, covered by insurance companies, and these last ones will be more adversely affected as a result of banks’ riskier activities. This is coherent with the result of the event study as insurance companies are more adversely affected than banks. The fact that insurance companies are more deeply affected can be also linked to the problem of adverse selection. This describes the problem insurance companies have when they cannot distinguish between good and bad risks. Other studies which are concerned with evaluating the stock market reaction to the passage of regulatory events found results similar to the present one. Andriosopoulos et al. (2015) tested the effect that the Dodd–Frank Act had on a sample of financial institutions: they found that banks experienced negative valuations whereas insurance companies registered an increase in the systematic risk. Amoako-Adu and Smith (1995) found an increase of the systematic risk for insurance companies and not a significant effect for banks’ returns.

6. Conclusions

In this section, the extent to which the aim and objectives have been achieved is assessed. Finally, limitations and recommendations of the research are presented.

6.1. Research Objective: Summary of Findings and Conclusions

The overall aim of this research was to gain an understanding of the impact that the Banking Reform Act 2013 had on the stocks of Banks and Insurance companies at various stages of legislation. The sample for the study comprised of six major banks and 18 insurance companies in U.K. The effects of key legislative events are measured by applying an event study methodology. The first objective was covered in the literature review, where research done by others was discussed and we highlighted some emerging issues surrounding the topic of banking regulation. Different aspects have been covered such as diversification, performance, risk, banking stability, and efficiency and also, the reaction of the stock market after the implementation of Acts and regulations. The implementation of this objective was useful as it helped to establish a theoretical framework for the topic of banking regulation and the gap in the literature. Objective two was covered in the third section and provided a rationale and justification for the method used to implement the research: event study methodology. Objective three was discussed in the fourth and fifth sections, in which the results of the event study methodology have been evaluated. From this it emerged that the market reaction to banks value, overall, was not particularly significant, but it showed some positive effects; whereas the market reaction to insurance companies was negative in all stages of the passage of the Banking Reform Act 2013. An explanation for such market reactions can be that, while banks in general are perceived by the market to be less risky, through financial reform, notwithstanding additional costs to be incurred on ‘ring fencing’ activities (Morse 2015); the market is pessimistic about the implication for insurance companies because of the problems of ‘moral hazard’ and adverse selection. Some rogue banks may continue their risky activities clandestinely, while getting insurance. Thus, overall, the aim of the research has been achieved. This study contributes to the literature on banking reform by assessing its impact on the stock prices of banks and insurance companies during the passage of the act.

6.2. Limitations

Any empirical research usually suffers from some limitations, and this study is not an exception. Firstly, the sample size used for the study accounted for only six banks and 18 insurance companies. The number of banks should have been bigger as the major impact of the Banking Reform Act 2013 was mainly on the banking system. The small sample of banks was due to the fact that other banks were not trading constantly in the estimation period. Secondly, the only methodology now available to properly capture event study effects through risk-adjusted abnormal returns is the event study methodology. Newer, better methods may be discovered in the future. Thirdly, the precise estimation periods are identified through reasoning, as in the case of regulation, it is otherwise difficult to identify the event dates due to the complexity of the legislative process (Mackinlay 1997; Lamdin 2001).

6.3. Recommendations

As there is a lack of research focusing on the reaction of the stock market to the Banking Reform Act 2013, future studies might, for example, focus on this topic including other financial institutions such as brokers, pension funds, building societies, and saving institutions. This research study could also be progressed by conducting qualitative research, for example, interviewing the managers of the bank or insurance companies to ascertain their views and opinions on the passage of the Banking Reform Act 2013. Finally, data permitting, longer event windows could be used to capture the market reaction over a longer period of time.

Author Contributions

The contribution to this article is distributed as follows: T.V.P. 50%, V.S. 50%.

Conflicts of Interest

The authors declare no conflict of interest.

Appendix A

List of banks and Insurance companies
BanksLife Insurance CompaniesNonlife Insurance Companies
Bank of Georgia Holdings PlcAvivaAdmiral group Plc
BarclaysLegal and General Group PlcAmlin Group Plc
HSBC Holdings PlcOld Mutual Plc OrdBeazley Group Plc
Lloyds Banking GroupPhoenix Group HoldingsDirect Line
Standard CharteredST. James’s Place PlcHiscox LTD ORD
Royal Bank of Scotland GroupStandard LifeJardine Lloyds Thompson group Plc
Chesnare PlcLancashire Holdings Limited
Hansard PlcRSA Insurance Group Plc
Prudential PlcNovea Group Plc

Appendix B

Figure A1. CAARs for banks associated with the first event. Source: Authors’ work.
Ijfs 06 00081 g0a1
Figure A2. CAARs for banks associated with the second event. Source: Authors’ work.
Ijfs 06 00081 g0a2
Figure A3. CAARs for banks with the third event. Source: Authors’ work.
Ijfs 06 00081 g0a3
Figure A4. CAARs for insurance companies associated with the first event. Source: Authors’ work.
Ijfs 06 00081 g0a4
Figure A5. CAARs for insurance companies associated with the second event. Source: Authors’ work.
Ijfs 06 00081 g0a5
Figure A6. CAARs for insurance companies associated with the third event. Source: Authors’ work.
Ijfs 06 00081 g0a6

References

  1. Amoako-Adu, Ben, and Brian F. Smith. 1995. The wealth effect of deregulation of Canadian financial institutions. Journal of Banking and Finance 19: 1211–36. [Google Scholar] [CrossRef]
  2. Andriosopoulos, Kostas, Ka Kei Chan, Panagiotis Dontis-Charitos, and Staikouras Sotiris. 2015. The Wealth and Risk Effects of U.S. Financial Reform: The Case of Financial Institutions. Working paper, series 15–16. Available online: https://ideas.repec.org/a/eee/finsta/v33y2017icp366-379.html (accessed on 15 March 2018).
  3. Arnold, Glen. 2014. Banking, Financial Times Guides. London: Pearson. [Google Scholar]
  4. Barth, James, Gerard Caprio, and Ross Levine. 2004. Bank regulation and supervision: What works best? Journal of Financial Intermediation 13: 205–48. [Google Scholar] [CrossRef]
  5. Barth, James R., Gerard Caprio, and Ross Levine. 2006. Rethinking Bank Regulation: Till Angels Govern. New York: Cambridge University Press. [Google Scholar]
  6. Barth, James R., Chen Lin, Yue Ma, Jesús Seude, and Frank M. Song. 2013. Do bank regulation, supervision and monitoring enhance or impede bank efficiency? Journal of Banking and Finance 37: 2879–92. [Google Scholar] [CrossRef]
  7. Beale, Lieven, Olivier De Jonghe, and Rudi Vander Vennet. 2007. Does the stock market value bank diversification? Journal of Banking and Finance 18: 351–95. [Google Scholar] [CrossRef]
  8. Binder, John. 1998. The event study methodology since 1969. Review of Quantitative Finance and Accounting 11: 111–37. [Google Scholar] [CrossRef]
  9. Blum, Jürg. 1999. Do capital adequacy requirements reduce risks in banking? Journal of Banking and Finance 23: 755–71. [Google Scholar] [CrossRef]
  10. Brooks, Chris. 2014. Introductory Econometrics for Finance, 3rd ed. New York: Cambridge University Press. [Google Scholar]
  11. Brown, Stephen J., and Jerold B. Warner. 1985. Using daily stock return: The case of event study. Journal of Financial Economics 14: 3–31. [Google Scholar] [CrossRef]
  12. Bush, Andreas. 2009. Banking Regulation and Globalization. Oxford: Oxford University Press. [Google Scholar]
  13. Campbell, John Y., Andrew Lo, and A. Craig MacKinlay. 1997. The Econometrics of Financial Markets. Princeton: Princeton University Press. [Google Scholar]
  14. Carow, Kenneth A. 2001. The wealth effect of allowing bank entry into the insurance industry. Journal of Risk and Insurance 68: 129–50. [Google Scholar] [CrossRef]
  15. Carow, Kenneth A., and Randall A. Heron. 2002. Capital market reactions to the passage of the Financial Services Modernization Act of 1999. The Quarterly Review of Economics and Finance 42: 465–85. [Google Scholar] [CrossRef]
  16. Casu, Barbara, Claudia Girardone, and Philip Molyneux. 2015. Introduction to Banking, 2nd ed. London: Pearson. [Google Scholar]
  17. Chalermchatvichien, Pichaphop, Seksak Jumreornvong, Pornsit Jiraporn, and Manohar Singh. 2014. The effect of the Ownership Concentration on capital adequacy, liquidity and capital stability. Journal of Financial Services Research 45: 219–40. [Google Scholar] [CrossRef]
  18. Chortareas, Georgios E., Claudia Giordone, and Alexia Ventuori. 2013. Financial Freedom and bank efficiency: Evidence from the European Union. Journal of Banking and Finance 37: 1223–31. [Google Scholar] [CrossRef]
  19. Cubbin, John, and George Tzanidakis. 1998. Regression versus data development analysis for efficiency measurement: An application to the England and Wales regulated water industry. Utility Policy 7: 75–85. [Google Scholar] [CrossRef]
  20. Dam, Lammertjan, and Michael Koetter. 2012. Bank bailouts and moral hazard: Empirical evidence from Germany. The Review of Financial Studies 25: 2343–80. [Google Scholar] [CrossRef]
  21. Danielsson, Jon. 2011. Financial Risk and Forecasting: The Theory and Practice of Forecasting Market Risk, with Implementation in R and Matlab. London: John Wiley. [Google Scholar]
  22. Demirguc-Kunt, Asli, and Harry Huizinga. 2010. Bank activity and funding strategies: The impact on risk and return. Journal of Finance and Economy 98: 626–50. [Google Scholar] [CrossRef]
  23. Dharmarathne, Dunusinghe. 2013. Stock price reaction to dividend announcements and information efficiency in Sri Lankan share market. International Journal of Research in Social Sciences 3: 100–11. [Google Scholar]
  24. Duchin, Ran, and Denis Sosyura. 2014. Safer ratios, riskier portfolios: Banks’ response to government aid. Journal of Financial Economics 113: 1–28. [Google Scholar] [CrossRef]
  25. Elsas, Ralf, Andreas Hackethal, and Markus Holzhauser. 2010. The anatomy of bank diversification. Journal of Banking and Finance 6: 1274–87. [Google Scholar] [CrossRef]
  26. Eyssell, Thomas, and Nasser Arshadi. 1990. The Wealth Effects of the Risk-based Capital Requirement in Banking: The Evidence from the Capital Markets. Journal of Banking and Finance 14: 179–97. [Google Scholar] [CrossRef]
  27. Fahri, Emmanuel, and Jean Tirole. 2012. Collective moral hazard, maturity mismatch, and systemic bailouts. American Economic Review 102: 60–93. [Google Scholar]
  28. Fama, Eugene. 1970. Efficient Capital Markets: A Review of theory and empirical work. The Journal of Finance 25: 383–417. [Google Scholar] [CrossRef]
  29. Fama, Eugene F., Lawrence Fisher, Michael C. Jensen, and Richard Roll. 1969. The adjustment of stock price to new information. International Economic Review 1: 1–21. [Google Scholar] [CrossRef]
  30. Freixas, Xavier, and Jean-Charles Rochet. 1997. Microeconomics of Banking. Cambridge: The MIT Press. [Google Scholar]
  31. Goodhart, Charles, Philipp Hartmann, David Llewellyn, Liliana Rojas-Suarez, and Steven Weisbrod. 1998. Financial Regulation: Why, How and Where and Now? London: Routledge. [Google Scholar]
  32. Gropp, Reint, and Jukka Vesela. 2004. Deposit insurance, moral hazard and market monitoring. Review of Finance 8: 571–602. [Google Scholar] [CrossRef]
  33. Hendershott, Robert J., Darrell E. Lee, and James G. Tompkins. 2002. Winners and losers as financial services provides converge: Evidence from the Financial Modernization Act of 1999. The Financial Review 37: 53–72. [Google Scholar] [CrossRef]
  34. Hillier, David, Stephen Ross, Randolph Westerfield, Jeffrey Jaffe, and Bradford D Jordan. 2010. Corporate Finance. UK: McGraw-Hill Education. [Google Scholar]
  35. Hryckiewicz, Aneta. 2014. What do we know about the impact of government interventions in the banking sector? An assessment of various bailout programs on bank behaviour. Journal of Banking and Finance 46: 246–65. [Google Scholar] [CrossRef]
  36. Johnston, Jarrod, and Jeff Madura. 2000. Valuing the potential transformation of banks into financial services conglomerates: Evidence from the city group merger. The Financial Review 35: 17–36. [Google Scholar] [CrossRef]
  37. Kleinow, Jacob, Tobias Nell, Silvia Rogler, and Andreas Horsch. 2014. The value of being systemically important: Event study on regulatory announcements for banks. Applied Financial Economics 24: 1585–604. [Google Scholar] [CrossRef]
  38. Konchitchki, Yaniv, and Daniel E. O’Leary. 2011. Event study methodologies in information system research. International Journal of Accounting Information Systems 12: 99–115. [Google Scholar] [CrossRef]
  39. Korotana, Muhammed Shabir. 2016. The Financial Services (Banking Reform) Act 2013: Smart Regulatory Regime? Statute Law Review 37: 195–211. [Google Scholar] [CrossRef]
  40. Lamdin, Douglas J. 2001. Implementing and interpreting event studies of regulatory changes. Journal of Economics and Business 53: 171–83. [Google Scholar] [CrossRef]
  41. Leaven, Luc, and Ross Leaven. 2007. Is there a diversification discount in financial conglomerates? Journal of Financial Economics 85: 331–67. [Google Scholar] [CrossRef]
  42. Mackinlay, A. Craig. 1997. Event studies in Economics and Finance. Journal of Economic Literature 35: 13–39. [Google Scholar]
  43. Madura, Jeff, and Kenneth Bartunek. 1995. Valuation effect of the EDIC improvement Act. Journal of Applied Finance and Economy 5: 191–98. [Google Scholar] [CrossRef]
  44. Malkiel, Burton G. 2003. The Efficient Market Hypothesis and Its Critics. The Journal of Economic Perspectives 17: 59–82. [Google Scholar] [CrossRef] [Green Version]
  45. Mashiandaro, Donato, and Mattia Suardi. 2014. Public interest and lobbies in reforming banking regulation: Three tales of ring fencing. International Review of Economics 61: 305–28. [Google Scholar] [CrossRef]
  46. McNamara, Christian, Wedow Michael, and Metrick Andrew. 2014. Basel III B: Basel III Overview (November 1, 2014). Yale Program on Financial Stability Case Study 2014-1B-V1. Available online: https://ssrn.com/abstract=2576939 or http://dx.doi.org/10.2139/ssrn.2576939 (accessed on 15 March 2018).
  47. Mercieca, Steve, Klaus Schaeck, and Simon Wolfe. 2007. Small European banks: Benefits from diversification? Journal of Banking and Finance 31: 1975–98. [Google Scholar] [CrossRef]
  48. Helen, Morse. 2015. The Negative Impact of UK Banking Reform. Available online: http://www.keepcalmtalklaw.co.uk/the-negative-impact-of-uk-banking-reform/ (accessed on 15 March 2018).
  49. Putnis, Jan. 2014. The Banking Regulation Review, 5th ed. London: Law Business Research. [Google Scholar]
  50. Rajan, Raghuram G. 2010. Faulty Lines: How Hidden Fractures Still Threaten the World Economy. Princeton: Princeton University Press. [Google Scholar]
  51. Rani, Neelam, Surendra S. Yadav, and P. K. Jain. 2012. The Impact of Domestic Mergers and Acquisitions on Acquirer Shareholders’ wealth in India. Global Journal of Flexible Systems Management 13: 179–93. [Google Scholar] [CrossRef]
  52. Schafer, Alexander, Isabel Schnabel, and Beatrice Weder. 2013. Financial Sector Reform: Has Anything Happened? Social Science Research Today. Available online: http://www.voxeu.org/sites/default/files/file/DP9502.pdf (accessed on 15 March 2018).
  53. Spiegel, Mark M., and Nobuyoshi Yamori. 2003. The impact of Japan’s financial stabilization laws on bank equity values. Journal of the Japanese and International Economies 17: 263–82. [Google Scholar] [CrossRef]
  54. Stiroh, Kevin J. 2004. Diversification in Banking: Is noninterest income the answer? Journal of Money, Credit and Banking 36: 853–82. [Google Scholar] [CrossRef]
  55. Stiroh, Kevin J., and Adrienne Rumble. 2006. The dark side of diversification: The case of U.S. financial holding companies. Journal of Banking and Finance 30: 2131–61. [Google Scholar] [CrossRef]
  56. Tchana, Fulbert Tchana. 2012. The welfare cost of banking regulation. Journal of Economic Modelling 29: 217–32. [Google Scholar] [CrossRef]
  57. The Turner Review. 2009. A Regulatory Response to the Global Banking Crises, March; London: Financial Services Authority. Available online: http://www.fsa.gov.uk/pubs/other/turner_review.pdf (accessed on 15 March 2018).
  58. U.K. Parliament. 2016. Bill Stages Financial Services (Banking reform) Act 2013. Available online: http://services.parliament.uk/bills/2013-14/financialservicesbankingreform/stages.html (accessed on 15 March 2018).
  59. Wilmarth, Arthur E. 2011. The Dodd-Frank Act: A Flawed and Inadequate Response to the Too-Big-to-Fail Problem. Oregon Law Review 89: 951–1057. [Google Scholar]
  60. Zhang, Zong-Yi, Jun Wu, and Qiong-Fang Liu. 2008. Impact of capital adequacy regulation on risk-taking behaviours of banking. Systems Engineering Theory & Practice Online 28: 183–89. [Google Scholar]
Figure 1. Daily t for AAR and cumulative t for CAAR. Source: Authors’ work.
Ijfs 06 00081 g001
Figure 2. Daily t for AAR and cumulative t for CAAR. Source: Authors’ work.
Ijfs 06 00081 g002
Figure 3. Daily t for AAR and cumulative t for CAAR. Source: Authors’ work.
Ijfs 06 00081 g003
Figure 4. Average Abnormal Return (AAR) for banks. Source: Authors’ work.
Ijfs 06 00081 g004
Figure 5. Average Abnormal Return (AAR) for banks. Source: Authors’ work.
Ijfs 06 00081 g005
Figure 6. Average Abnormal Return (AAR) for banks. Source: Authors’ work.
Ijfs 06 00081 g006
Figure 7. Daily t for AAR and cumulative t for CAAR. Source: Authors’ work.
Ijfs 06 00081 g007
Figure 8. Daily t for AAR and cumulative t for CAAR. Source: Authors’ work.
Ijfs 06 00081 g008
Figure 9. Daily t for AAR and cumulative t for CAAR. Source: Authors’ work.
Ijfs 06 00081 g009
Figure 10. AAR for insurance companies. Source: Authors’ work.
Ijfs 06 00081 g010
Figure 11. AAR for insurance companies. Source: Authors’ work.
Ijfs 06 00081 g011
Figure 12. AAR for insurance companies. Source: Authors’ work.
Ijfs 06 00081 g012
Figure 13. Cumulative t for banks and cumulative t for insurance companies. Source: Authors’ work.
Ijfs 06 00081 g013
Figure 14. Cumulative t for banks and cumulative t for insurance companies. Source: Authors’ work.
Ijfs 06 00081 g014
Figure 15. Cumulative t for banks and cumulative t for insurance companies. Source: Authors’ work.
Ijfs 06 00081 g015
Table 1. Critical values for banks. Source Pearson’s table.
n90%95%
61.94322.4469
Table 2. Event study results of banks for the first event. Source: Authors’ work.
DaysAARDaily tCAARCum t
−50.0098227062.354110773−0.00152527−0.239963756
−4−0.002547702−0.488265881−0.01134798−1.459776681
−30.001036850.253884339−0.00880028−1.291806185
−2−0.001644783−0.250706832−0.00983713−1.253369214
−1−0.008192347−1.394492962−0.00819235−1.394492962
0−0.001824896−0.213751714−0.0018249−0.213751714
10.0029136381.9071677190.002913641.907167719
20.0042789122.3854610610.007192556.596230877
3−0.004493174−1.0126165550.002699380.583842776
4−0.011447998−1.803607101−0.00874862−1.136690033
50.002186580.521691758−0.00656204−0.766597964
Table 3. Event study results of banks for the second event. Source: Authors’ work.
DaysAARDaily tCAARCum t
−30.0127081.204512370.0179011.432923445
−20.0007030.315274620.0051941.389929197
−10.004492.32821750.004492.328217496
00.0050362.251180220.0050362.251180219
10.0004810.130966430.0004810.13096643
2−3.5E-05−0.003994730.0004460.050677917
3−0.00151−0.32428565−0.00106−0.09138378
Table 4. Event study results of banks for the third event. Source: Authors’ work.
DaysAARDaily tCAARCum t
−30.0027617881.532503020.0052521041.11791881
−20.0015570280.350569740.0024903160.601357008
−10.0009332890.575132260.0009332890.575132257
0−0.000996711−0.43527602−0.000996711−0.435276022
10.0073413112.340090970.0073413112.34009097
2−0.002861946−0.496126180.0044793660.585357406
3−0.000116855−0.048237610.0043625110.613579994
Table 5. Critical values for insurance companies. Source Pearson’s table.
n90%95%
181.73412.1009
Table 6. Event study results of insurance companies for the first event. Source: Authors’ work.
DaysAARDaily tCAARCum t
−50.00103370.57522204−0.001132−0.202113676
−4−0.00489615−2.08152502−0.002165−0.432066938
−30.00676191.680866740.00273080.613063542
−2−0.00299097−1.38346544−0.004031−1.403667183
−1−0.0010401−0.48997638−0.00104−0.489976382
00.003877351.921791120.00387741.921791117
1−0.00510419−1.84315645−0.005104−1.743156445
20.006472411.424728820.00136820.514303459
3−0.01225773−2.54529159−0.01089−1.683655575
4−0.00331292−2.34910317−0.010577−1.793377224
5−0.01325873−1.96717798−0.010994−1.711182394
Table 7. Event study of insurance companies for the second event. Source: Authors’ work.
DaysAARDaily tCAARCum t
−3−0.00047671−0.167950.0061867021.288804
−20.004811171.0970650.0066634121.410326
−10.001852240.8647610.0018522370.864761
0−0.00701562−2.33033−0.00701562−2.33033
1−0.00694735−2.79999−0.00694735−2.79999
20.000416710.124594−0.00653064−3.13392
3−0.00157969−0.66801−0.00811033−3.30548
Table 8. Event study result of insurance companies for the third event. Source: Authors’ work.
DaysAARDaily tCAARCum t
−30.001040890.212110.0040880.788743
−20.003196360.9611990.0030471.23271
−1−0.00014894−0.05713−0.00015−0.05713
0−0.00302539−1.39158−0.00303−1.39158
1−0.0060134−1.84805−0.00601−1.84805
2−0.00672324−1.43014−0.01274−2.44562
30.002080960.977023−0.01066−1.85014