Abstract
This contribution takes a new look at the gravity equation model in relation to foreign direct investment (FDI) of leading industrialized countries which presents a useful basis for assessing certain potential impacts arising from BREXIT—the envisaged leaving of the EU by the United Kingdom. The gravity equation estimated subsequently allows one to consider the case of BREXIT and the broader role of EU membership and other variables. Looking at the period from 1985 to 2012 for a dataset which contains 34 OECD (Organisation for Economic Co-operation and Development) countries, Pseudo Poisson Maximum Likelihood (PPML) dyadic fixed estimations take into account a broad set of approaches and variables. Besides the traditional variables of the EU/EU single-market membership of the source country and of the host country, we further consider the role of trade openness as well as corporate tax rates and the ratio of inward FDI stock to total capital stock. The analysis shows that trade openness is a variable which can be largely replaced by the inward FDI stock/capital stock ratio so that gravity FDI modeling with a strong emphasis on trade openness is likely to overstate the role of trade and to understate the role of relative FDI accumulation effects. The implication for BREXIT analysis is that the UK will face three impulses for FDI inflows: (1) leaving the EU single market will strongly reduce FDI inflows; (2) if foreign ownership in UK capital stock should strongly increase in the run-up to the BREXIT year 2019, part of the dampening effects of leaving the EU will be mitigated by the increase of the FDI stock/capital stock ratio, which in turn is likely to reflect a Froot–Stein effect related to real pound depreciation for 2016–2018; (3) to the extent that the UK government will want to reinforce output growth through higher FDI inflows, a reduction of corporate taxation could generate high effects but could also stimulate a downward international corporate tax reduction game.
JEL Classification:
C32; E65; F21; F23; O52
1. Introduction
BREXIT will have considerable effects in OECD (Organisation for Economic Co-operation and Development) financial markets in regard to capital flows, including foreign direct investment (FDI) dynamics. FDI, in addition to trade dynamics, is a key element of the economic linkages in Europe, North America, and Asia. Since multinational companies stand for firms with ownership-specific advantages (Dunning 1998), one may expect that FDI inflows also bring international technology transfers. In the case of greenfield investment, inflows also have a positive effect on capital accumulation (Blomström and Kokko 1998; Blomstrom et al. 2000; Herrmann and Lipsey 2003). With BREXIT—the envisaged leaving of the EU by the United Kingdom—the economic links between the United Kingdom and the EU/EEA will be weakened (HM Government 2016; Welfens 2017a), as reduced future British access to the EU single market will be part of a new regime for the UK and the EU27 (all EU-members except UK). Depending on sectoral free-trade agreements yet to be negotiated, there could be at least partial free trade between the UK and the EU27 after 2019, the actual exit year, which raises a question about the role of trade openness as well as the role of FDI dynamics. In addition, the impact of the EU membership/EU single-market membership is not clear and equal for all its members in terms of trade and FDI. If the EU–UK negotiations would lead to a “soft” BREXIT, namely continued membership of the UK in the EU Customs Union (CU) or a set of wider sectoral agreements on trade and FDI liberalization, the negative effects of BREXIT on British inward FDI would be mitigated, as we show in our study.
This holds since existing EU production networks of British firms could largely be maintained. Without single-market membership, rules of origin will become relevant post-BREXIT for UK firms. To the extent that UK production becomes less attractive after 2019, negative FDI inflow effects and increasing outflows are to be expected. Regarding BREXIT-related survey results on FDI, the findings of EY (2018) from spring 2018 among 440 foreign investors in the UK (big multinational companies) clearly indicate that over a time period of three years, many firms from Asia and the EU—less so from the US—are considering divestment in the UK post-BREXIT. There is some sectoral variation, namely, 16% of chemical/pharmaceutical businesses, 16% of financial services, and 14% of business services companies anticipate moving facilities in the next three years. This is considerable when compared to only 4% of manufacturers. In the long run, about 50% of foreign investors in the UK are considering relocating part of their assets internationally, which implies that FDI gravity modeling (empirical macroeconomic models which analyze global trade and FDI linkages on a bilateral basis) could be useful for understanding BREXIT-related adjustment. This does not mean to overlook that some new changes in the circumstances in which BREXIT takes place cannot be considered in the subsequent empirical analysis of the paper.
In its February 2018 inflation forecast, the UK’s central bank reported the findings of its Decision-Maker Panel (DMP) Survey, showing that firms which rank BREXIT among their top three sources of uncertainty have reduced investment spending in 2017 H1 (Bank of England 2018). The more than 2000 companies in the DMP Survey could be split into firms with controlling foreign ownership and firms with dominant domestic ownership, but so far the Bank of England has not made the split sample data available, data which would be quite useful for the group of strong goods exporters, most of them with EU27 destinations. It is noteworthy that from a theoretical perspective, lower British FDI inflows relative to GDP will put pressure on the Bank of England to raise interest rates in nominal and real terms unless net exports of goods should increase relative to GDP, which, however, is unlikely in the medium term since the EU-related trade-diversion effects of BREXIT for the UK should be considerable—again under the assumption of no Customs Union membership. Hence, FDI flow dynamics will have an indirect impact on international portfolio flow dynamics.
The relevance of FDI inflows for BREXIT dynamics is rather strong because a key part of the debate about the referendum refers to the question of GDP losses (e.g., HM Government 2016; Erken 2017) or real GNI (Gross National Income) losses (Welfens 2017b). The forecast revisions of the Office for Budget Responsibility already suggest, comparing the November 2017 forecast up to 2020 with the figures of the November 2015 forecast, that overall investment in 2016–2020 is reduced by about 30% and output for 2020 by almost 5%. Since the share of foreign ownership in the UK in 2016 was 17%, part of the reduced investment and output dynamics will be related to foreign investors. It is noteworthy that, for example, the US subsidiaries in the UK alone stood for about 7% of UK output in 2014.
The gravity equation estimated subsequently allows one to consider the case of BREXIT and the broader role of EU membership. Looking at the period from 1985 to 2013 for a dataset which contains 34 OECD countries, Pseudo Poisson Maximum Likelihood (PPML) dyadic fixed estimations take into account a broad set of approaches and variables. Besides the traditional variables of the EU/EU single-market membership of the source country and of the host country, we further consider the role of trade openness as well as corporate tax rates and the ratio of inward FDI stock to total capital stock, as those variables have a very special impact on the UK economy, as described in Section 3. The analysis shows that trade openness is a variable which can be largely replaced by the inward FDI stock/capital stock ratio so that gravity FDI modeling with a strong emphasis on trade openness is likely to overstate the role of trade and to understate the role of relative FDI accumulation effects. While the corporate tax level is indeed important, we do not find a significant impact of real exchange rates.
2. Literature Review
2.1. Selected BREXIT FDI Aspects
It is useful to emphasize that the Treasury’s study (HM Government 2016) on the long-run benefits of British EU membership—or, in a mirror perspective, the cost of BREXIT—has suggested that the UK could witness a 10% real income loss in the long run. The analytical focus of the Treasury reports is primarily on trade and only partly on FDI when modeling the key economic effects of reduced future British access to the EU single market. It is not fully clear what higher FDI barriers imposed on the UK by the EU27 after March 2019 could mean, but clearly there would be serious economic effects that could already be gauged by referring to the study of Francois et al. (2013) on the economic effects of a Transatlantic Trade and Investment Partnership (TTIP) on the EU28 (all EU-member countries) or the study by McGrattan and Waddle (2017) estimating the effect of BREXIT on FDI and production structure. Basically, in Chapter 6 of that study, the authors present some FDI gravity modeling and consider the scenario that the transatlantic barriers to trade would be reduced to the same level as the intra-EU FDI barriers, which are assumed to be a quarter lower than transatlantic FDI barriers. The result of a hypothetical elimination of the extra transatlantic barrier is more transatlantic FDI and an 11% employment increase in US subsidiaries in the EU28. One may add that BEA statistics show that US-cumulated FDI in the EU28 accounts for about 3% of gross domestic product. Based on the derived employment effects, one would naturally assume that the induced output expansion effects from reduced-FDI barriers would be 0.33% of GDP. In a mirror perspective, one may ask the question of how strongly EU27 barriers faced by UK firms would increase after March 2019 and how serious therefore real output reduction effects in the UK could be in the context of British FDI reduction in the EU—or, if there should be arguments for an expansion of British FDI in the EU, how large output and employment effects would be for the EU27.
Barrell and Pain (1997) have presented a multisector panel data analysis for UK outward FDI and German outward FDI which shows, as key drivers of FDI: the output of the host country; the technological strength—knowledge-based assets—in the form of the stock of patents registered in the US by domestic firms; the relative unit costs in the respective home country; country-specific and industry-specific indicators for labor relations—namely, the number of strikes in host countries; the exchange rate stability; and the ratio of interest payments relative to the cash-flows in the case of UK firms, which is an industry indicator for the EU single market as well as a services sector indicator for the EU single market, plus a financial indicator for firms. While the German model showed significant results for business sector profitability and the growth of real equity prices, a tighter financial situation reduces outward FDI. Regarding the single market variables, both the industrial sector variable and the services sector variable showed a significant impact. The implications from the Barrell/Pain approach with respect to BREXIT are thus threefold for UK industrial outward FDI if one considers it rather likely that the UK’s leaving of the EU will reduce profitability of UK firms, lead to higher exchange rate instability, and reduce British access to the EU single market:
- British FDI outflows will reduce in the EU and this should dampen knowledge accumulation in EU27 countries;
- Taking additionally into account the arguments of Froot and Stein (1991), British FDI outflows—with an emphasis on international M&As (Mergers and Acquisitions)—will particularly reduce to those EU27 countries where the real appreciation (a mirror of pound depreciation) is rather high. One may assume that the Eurozone’s appreciation rate will be higher than that of other EU countries to the extent that BREXIT itself will create nervous markets for some time and thus could reinforce the role of Germany, France, the Netherlands, and Luxembourg as typical safe-haven countries in the Eurozone. Thus, one should consider real exchange rate effects and control for them in FDI gravity models, especially in the case of drastic policy changes such as BREXIT.
One may also argue that the real depreciation of the pound observed in 2016/2017—about 14% in the year after the British EU referendum of 23 June 2016—will, in line with the Froot and Stein (1991) argument, reinforce international M&As in the UK; at the same time, greenfield investment will reduce in the context of slower output growth. It should be emphasized that higher shares of foreign capital ownership in the UK—reflecting international M&As in the BREXIT context—imply that consumption growth will reduce since consumption is proportionate to gross national product, not to GDP. With a higher share of foreign capital ownership in the UK, dividend payments transferred abroad, as a share of British GDP, will increase and hence GNP growth will be smaller than GDP growth until a new steady state is reached (Welfens 2017a, 2017b). We therefore note that the share of foreign capital ownership within a country highly matters for FDI inflow.
2.2. FDI Dynamics within the EU
Regarding EU countries, FDI should be expected to be affected by major institutional changes, such as the creation of the EU itself in 1957, major enlargement rounds (e.g., UK, Denmark, and Ireland joining the EU in 1973; and the EU’s eastern enlargement in 2004), and the establishment of the EU single market. Free trade and foreign direct investment as well as free portfolio capital flows plus free migration are the four pillars of the EU single market created in 1993—with free trade in goods already having been established in the period between 1957 and July 1968. To some extent, foreign direct investment and trade in goods and services could be substitutes, namely in the context of tariff jumping where foreign investors create subsidiaries abroad in order to bypass import tariffs. After 1993, this could be a relevant case only for investors from third countries. At the same time, one should not overlook that the elimination of FDI barriers in the EU single market gave incentives to create European production networks, a perspective that was reinforced by the two-stage EU eastern enlargement in 2004 and 2007.
In a single market, foreign direct investment and trade should be substitutes or complements for macroeconomic and structural reasons:
- To the extent that trade reinforces specialization and that, in turn, specialization gains raise factor productivity, there will be enhanced investment opportunities, particularly in those countries where technology-intensive Schumpeterian sector production has increased. Jungmittag and Welfens (2016) has shown in an empirical analysis for the EU15 (all EU-members previous 2004) that output in those EU countries which have achieved more high-technology specialization is raised through trade. According to the theory of asset-seeking foreign direct investment (e.g., Makino et al. 2002; Ivarsson and Jonsson 2003), such a specialization pattern will attract higher FDI inflows as foreign investors seek to acquire firms with technological advantages that are complementary to the respective foreign firm’s core research and production activities.
- The combination of regional free trade and free capital flows implies that there are particular opportunities for regional production networks in the EU. As offshoring (i.e., imports of intermediate products as intra-MNC (Multinational Companies) trade) and international/interregional (intra-EU) and regional outsourcing is reinforcing the international competitiveness of multinational firms, such firms, following the OLI (Ownership-, Location- and Internalization Advantages) approach of Dunning (Dunning 2001), should increase production abroad. In the case of EU countries, this implies that FDI outflows to third countries (e.g., to the US) should increase.
- As trade-related specialization gains raise per capita income, demand for differentiated products will increase and those products in turn stand for technology-intensive and knowledge-intensive goods that are typically produced by multinational companies. If the economic logic of production suggests that producers should have production in geographic proximity to markets (e.g., Raff and Von der Ruhr 2001), it is obvious that multinational production would expand in a way that enhances FDI. This points to a positive reciprocal link between trade and FDI.
- The single market enhances trade in intermediate products which will raise the productivity of internationalized firms in a way that will contribute to more exports as more productive firms can benefit through higher export shares (Melitz 2003). Hence, there is a reciprocal link between FDI and trade in this respect.
- Another reciprocal link between trade and FDI comes from the fact that FDI inflows go along with international technology transfer for the host country—and in the case of greenfield investment, with a higher capital stock in the host country—so that output and gross national income, respectively, are raised. Therefore, imports will be raised and, following the logic of the trade gravity model, both imports and exports would increase. Hence, trade will be raised as well so that there is a positive reciprocal link between FDI and trade.
Oligopolistic interdependence could also play a role (Knickerbocker 1973). If there is an oligopoly, there will be an interdependence reaction of leading firms. For example, if multinational companies from the US invest in the EU in certain sectors—say, in the pharmaceutical sector—EU firms could fight back and try to take over US pharmaceutical firms. If the relevant market is the EU, there could also be an intra-EU FDI intensification where, for example, German firms take over some firms in France, the UK, and Italy, which would induce counterattacks in the form of foreign FDI inflows from French, British, and Italian investors willing to invest in Germany. The implication of such EU interdependency would be that the EU single market is a strong driver of foreign direct investment inflows in the US. Tariff jumping could also play a role in the context of BREXIT—however, EU import tariffs outside agriculture are only about 3% (Lawless and Morgenroth 2016). A more serious aspect would have to be considered in the case of sectoral EU–UK FTAs since this brings rules of origin into play: a typical requirement would be, judging by the international FTAs of many OECD countries, that there is a 60% local content requirement imposed on the UK. British firms with established European production networks thus would have to close down some of the production facilities in EU27 countries, or British subsidiaries on the continent and in Ireland would be sold. UK firms might, however, also consider whether additional FDI outflows to EU countries could be useful in order to avoid costly regulatory costs—for example, in the case of pharmaceuticals.
2.3. Gravity FDI Flow/Stock Studies Targeting the EU
Membership in currency and policy unions and their effect on trade and FDI attractiveness historically find broad interest amongst researchers and policy makers, with the literature comprising thousands of studies. Therefore, we focus especially on FDI flows and stocks and the effect an EU membership can potentially have in order to anticipate the “worth” of a membership concerning FDIs. While it is important to look at this area as new data becomes available and variables of interest change over time,1 we take the forthcoming BREXIT as a reason to accurately analyze this topic further. In this regard, we use various methods and data and compare our results amongst each other as well as with previous studies, in an attempt to discern a clear-cut picture in the so far partly contradicting pattern.
The first important study using a modern EU FDI gravity model comes from Straathof et al. (2008), who analyze the internal market effect, more specifically, EU membership, on trade and FDI. Deviating from previous FDI studies which suggest that flow and stock depend on variables such as country size (GDP, population) and the distance between partners (see Straathof et al. 2008, pp. 51–52), they more specifically point to the gravity studies of Brenton et al. (1999) and Egger and Pfaffermayr (2004). Whilst the former authors create a single model for each country instead of a combined study, Egger and Pfaffermayer split EU integration into three separate phase models. The aim of Straathof et al. (2008) therefore was to close this gap and show the EU’s effect on FDI in a combined model. They follow those two previous studies in using OECD FDI stock data instead of flow data, as they see those as presenting a “better proxy for the sales activities of foreign affiliates as a measure of the capital stock”, (Straathof et al. 2008, p. 53). They use bilateral data of 30 OECD countries from 1981 to 2005 for their country-year fixed effect model, covering the 1986, 1995, and 2004 EU enlargements, noting that they struggle with data availability and bad data quality, particularly relating to the 1980s.2 Their findings show that bilateral FDI within EU countries are 28% higher than between non-EU countries, and that EU countries attract 14% more FDI from EU-outsiders than non-EU countries.
Next, we take a closer look at the study by Fournier et al. (2015), who examine the EU single market effect with a gravity fixed effect (on country level) Pseudo Poisson Maximum Likelihood (PPML) model on trade and inward FDI. Their contribution to previous studies is to include product market regulation, employment protection, and trade intensity (i.e., the ratio of trade to GDP) to the analysis. Using OECD flow data, their findings for the linear regression OLS (Ordinary Least Squares) method are a surplus of 57% if the target country is an EU member and a surplus of 48% if the origin country is an EU member. Findings for the favored PPML methodology are a surplus of 48% if the target country is an EU member and a surplus of 58% if origin country is an EU member. If both countries are EU members, no significant effect is found.
The study by Bruno et al. (2016) is the most advanced and precise study so far and therefore a good reference point for our study. They use bilateral FDI flow data of all 35 OECD countries from 1985 to 2012 and test it with dyadic fixed and time fixed OLS and PPML methodology. They use classical gravity variables, GDP, and GDP per capita of both the target and origin countries, while for all pairs the country-pair-specific characteristics such as distance, common language, cultural past, etc., are controlled for via dummies for each possible pair. If the target country is an EU member, the OLS methodology predicts a surplus of 33%, and the PPML estimator predicts a surplus of 38% in terms of FDI inflows. An EU FDI origin country will send 129% (PPML) more FDI than a non-EU origin country, which exaggerates previous studies by far. They apply their study using EU membership directly to BREXIT, assuming that if a country leaves the EU, the losses incurred will be opposite to the gains realized when a country joins the EU. While this is indeed a strong assumption, especially since bilateral FDI data is only available up to 2012/2013 for OECD countries, such a gravity FDI BREXIT study can give indications on how and to what extent FDI flow and stock will be affected. Furthermore, questions still remain regarding to what degree UK will actually “leave” the EU.3 This is important when discussing “soft” or “hard” BREXIT. However, such a distinction was not made by Bruno et al. (2016). They only proxied BREXIT as the opposite of a country joining the EU without further discussion.
A recently published working paper by Barrell et al. (2017) also examines EU membership, exchange rate volatility, and common currencies. They use FDI outward stocks (divided by a GDP deflator) as the dependent variable for selected OECD countries in the years from 1995 to 2012. Their findings show that bilateral FDI stocks are at least 50% higher if both countries are members of the EU4. However, this effect is mainly due to the EU single market. Furthermore, a decline in exchange rate volatility leads to increasing FDI. Common currencies seem to have little to no effect. Further, general FDI gravity variables such as GDP, distance, and trade openness are shown to be significant. In Section 3, we therefore introduce the exchange rate aspect into our model.
Folfas (2011) and Wojciechowski (2013) use Hausman–Taylor gravity estimators to determine FDI flows between EU countries. Their reason not to utilize PPML models is that time-invariant variables such as distance represent critical variables in their research question. The exclusion of fixed effects leads to different results concerning the variable “EU membership”, which has to be taken into account when comparing their findings with Fournier et al. (2015) and Bruno et al. (2016). Folfas (2011) focuses especially on the corporate tax rates of countries as a driver of FDI (low tax rates attract FDI, tax haven effect) and controls for offshore financial centers, naming Cyprus, Luxembourg, and Malta in particular, via a dummy variable. He finds no significant effect of EU membership on FDI flows, although he does find a significant tax haven effect and significant variables representing cultural similarity. Wojciechovski, however, finds a significant effect if both countries are in the European Economic and Monetary Union. We pick up their idea on including corporate tax levels into a FDI gravity model in Section 3.
One clear drawback of using OLS is that zero flow (or stock) observations mislead the results, especially if this is combined with too many missing values, as is the case especially in the earlier years. Even though bilateral OECD FDI flow data quality is superior to UNCTAD (United Nations Conference on Trade and Development) data, this has to be strongly considered. In general, UNCTAD data has the advantage of being globally available (2001–2012), but as it is collected by national statistical authorities, the data collection methods are not uniform—contrary to the OECD. With UNCTAD, bilateral inflow data can deviate by up to a multiple of the counterpart’s reported outflow. Missing values are very often also problematic, especially for Asian and Latin American countries. Researchers working with UNCTAD data prefer using stocks instead of flows, as due to the large stock figure, annual deviations will not present a significant problem. Also it is easier to “fix” data holes by averaging previous and subsequent annual stocks. For our purpose, OECD flow data prove more consistent than stock and UNCTAD flow/stock data, although we do also control for stock. Table 1 compares the findings of the most important EU gravity studies utilizing OECD data and illustrating models used.

Table 1.
EU-membership and its effect on FDI; gravity studies.
Due to data structure and quality, PPML dyadic fixed panel estimation is the clear model of choice: we use PPML estimators in the gravity framework with fixed effects for each possible country pair5 (dyadic) and for each year6 (panel). For an in-depth review of eight of the most popular estimation methods for gravity models see Kareem et al. (2016), who carefully explain the relative merits of alternative approaches; there, PPML is identified to be the preferable methodology. It shall be noted that the conclusion that Whyman and Petrescu (2017) draw in their literature review on BREXIT gravity FDI modeling by interpreting the results of different models as being either optimistic or pessimistic is somewhat misleading, as PPML is superior. It is therefore emphasized that the results of the model with the best fit is noted as “central”.
As we evaluate the methodology used by Bruno et al. (2016) as being the most suitable for the available data (Silva and Tenreyro 2011; Head and Mayer 2014; Kareem et al. 2016), we base our study on their work, especially as they apply their findings to the implications of BREXIT. However, we pick up open questions from previous literature and additionally control for corporate income tax and tax havens (Folfas 2011), the (relative) size of foreign owned capital stock (Jungmittag and Welfens 2016), and real exchange rates (Barrell et al. 2017). Trade will be included in the model by constructing the classical openness-indicator of relative exports and imports to GDP. Additionally, we want to check whether the properties of an EU membership is the driving force of FDI flows, or if we can reduce the explanatory power to the characteristics of being a member in the single market, as suggested by Barrell et al. (2017). This leads us to the formulation of the following hypotheses:
- EU (EU single market) membership of target and origin country will increase FDI flows.
- Trade openness will increase FDI flows.
- Corporate tax level constrains FDI flows.
- A higher relative FDI stock will attract more FDI flows. The FDI stock variable is considered relative to the total capital stock that may be assumed to implicitly reflect some path dependency as well as reinvestment of profitable subsidiaries abroad (as we want to explain, FDI inflows endogeneity might be a potential problem; this is addressed by lagging this variable by one period).7
- A low real exchange rate (to USD) will attract more FDI flows—depreciation of the home currency stimulates higher FDI inflows.
3. Econometric Specification and Data
3.1. Theoretical Foundation of the Gravity Model
Newton’s law of gravitation serves as an eponym for the gravity model of trade, where the countries GDPs serve as pull factors stimulating trade and the distance between them as a push factor constraining it.8 Anderson and Van Wincoop (2003) provide the sound econometric basis for a broad range of models utilized in empirical research. Shepherd (2016) refers to the traditional models as “intuitive”, contrary to the “structural” gravity models, as they underlie the microeconomic foundation by bringing the consumer side, production side, and trade cost together. In its simplest form, exports from country i to country j depend on their economic size Y and trade cost t’. However, more recently, gravity models have also been used to predict FDI flows and stocks from origin to target country and find a broad empirical fit. In order to capture multilateral resistance terms9 in structural models, the fixed effects panel data estimation method established itself as useful, see Anderson (2011) and Head and Mayer (2014). In panel-structured data, time-varying country and dyadic fixed effects control for national characteristics as well as characteristic relationships which would probably be largely unobservable otherwise. However, all time invariant variables such as the distance between the countries or trade agreements (if constant over panel) are captured by those fixed effects, which makes it hard to interpret them. Country-specific variables can overcome this by constructing them bilaterally.10
For our estimation, we derive the model in log-linearized form under consideration of common econometric misspecifications in modern gravity modelling, especially panel data implications, as unveiled by Baldwin and Taglioni (2007) and Silva and Tenreyro (2006). The dependent-variable FDI flow from origin country—o to target country (destination country)—d in time period—t is defined as follows:
with the following notation:
- —regression constant (—regression estimators respectively),
- —characteristics of the origin country (GDP, GDP/capita, EU membership),
- —characteristics of the target country (GDP, GDP/capita, EU membership, openness, R&D (Research and Development) investment, ICT (Information and Communication Technology) investment, corporate tax level, relative FDI stock),
- —characteristics of the relationship between country pairs (distance, cultural and historical differences, etc.),
- —dyadic fixed effects, i.e., one dummy variable for each possible set of partner countries, controls for all unobservables and satisfies the multilateral resistance requirement),
- —time fixed effects, i.e., one dummy variable for each year,
- —error term.
As most components of are not time-varying, they coincide with dyadic fixed effects. It is assumed that common culture and history does not change significantly over the relatively short period of about 30 years.
3.2. Data
3.2.1. Definition and Sources
Data for FDI flows (in current USD) is obtained from the OECD due to higher data quality compared to UNCTAD, as mentioned above. An additional benefit is the longer time series available (1985–2013), even though there is almost no data available for 2013 (only if new data sets would become available will an updated regression be possible). One drawback, however, is that important relevant newcomers to FDI such as Russia or China are not included; OECD countries account for roughly 70% of global FDI flows (UNCTAD 2017). This first step of data quality evaluation is highly necessary in order to understand the tradeoffs we need to accept, as well as to discuss potential biases by including only OECD countries in the econometric analyses.
GDP and GDP per capita (in current USD) is obtained from the World Bank, as is data for openness (import + export/GDP). Corporate tax on a country level from 1985 to 2007 is obtained from Mintz and Weichenrieder (2010) and from KPMG (data available 2003–2017). Relative FDI stock is obtained by dividing FDI in-stock (the total FDI inward position of the target country in current USD; data source: OECD) by total inward capital stock (capital stock at constant 2011 national prices; converted into current USD via the price level of capital stock, price level of USD in 2011 = 1; data source: Feenstra et al. 2015). Therefore, we use FDI stock in current USD over total capital stock in current USD; the variable describes a relative index and we do not have to deflate numbers. Index is lagged by one year to minimize the endogeneity problem annual FDI flow can have on FDI stock index. We applied the Durbin–Wu–Hausman test in order to check if our specification has achieved avoiding an endogeneity problem: The null hypothesis that the variable “foreign_capstock_share_lagged” is endogenous can be rejected (p-value = 0.8571), while the null hypothesis that the variable “foreign_capstock_share” is endogenous must be accepted (p-value = 0.0000).11 Therefore, the BREXIT-related findings are robust.
Real exchange rates are calculated as follows: nominal exchange rates to USD multiplied by the US consumer price index, divided by the home consumer price index (data source: OECD). Taking logs is necessary, as statistical outliers are by definition very large for a big fraction of the data. Finally, when controlling for the EU single market, we introduce a dummy variable representing whether the European Economic Area agreement is ratified, including EU28, Iceland, and Norway. Switzerland is additionally included, as bilateral treaties with the EU mirror a very similar relationship. We decided not to include Turkey, as we find heavy institutional deviance (especially migration and legislation). Table 2 gives an overview on the main variables utilized.
Table 2.
List of Variables.
3.2.2. Treating Missing Values
For the period from 1985 to 2012, our dataset contains 34 OECD countries (without Latvia which joined the OECD only in 2016) and 29,262 possible bilateral FDI flows. Dropping 13,903 observations due to missing values (listwise deletion) leaves the dataset with 15,359 observations, of which 5278 are negatives or zeroes, characterizing the problems with regard to OLS estimations (see Kareem et al. 2016). While Bruno et al. (2016) address this issue by assigning very small values to nonobserved or zero flows, we do not want to follow this quite strong assumption, especially due to well-known weaknesses regarding the inaccuracy of FDI data. We will concentrate solely on the explanatory power of the PPML model, which fits the data quite well, and use OLS only as a robustness check. Utilizing listwise deletion seems an adequate solution, as more than 15,000 observations are fully sufficient for gravity modelling (for comparison: (Straathof et al. 2008) and (Fournier et al. 2015) work with roughly 11,000 observations for their FDI gravity analyses). That way we additionally avoid extensive matrix calculations which commonly occur in two-way fixed effects estimations involving large datasets as described by Stammann (2017). The econometric solution they offer for handling large amounts of data is not applicable so far with PPML models. As a drawback, a possible selection bias must be noted; however, we assess this bias to be smaller than the bias which would occur by assuming missing data equals zero flow.
3.2.3. Treating Negative Values
As neither PPML nor OLS estimators work with negative values, this leaves us with three options: re-scaling flows,12 dropping flows, or setting flows equal to zero. While the first is not straightforward to interpret, dropping flows would result in a larger bias than when setting negatives to zero.13 While this is indeed a strong assumption, as pointed out by Folfas (2011), we will follow their approach in order to be able to use PPML estimators, leaving us with 15,359 observations, of which 5278 represent a flow of one USD. To distinguish between “real” and “negative” one-dollar-flow (zero flow), a dummy is inserted. According to UNCTAD data, before 1985, the total amount of FDI flows was relatively low, gaining importance in the 1990s and speeding up from 1997, especially within the EU and USA. Portugal and Spain joined the EU in 1986, Austria, Sweden, and Finland in 1995, and Estonia, Latvia, Lithuania, Poland, the Czech Republic, Slovakia, Hungary, Slovenia, Malta, and Cyprus in 2004.
3.2.4. Special Role of UK in Descriptive Data
The corporate tax levels of FDI target countries are expected to have an impact on FDI inflows, as described by Folfas (2011). Within our dataset of 34 OECD countries, we label Iceland, Ireland, Luxembourg, and Switzerland as “tax havens”, attracting firms with relatively good business conditions; corporate taxes are part of firm-friendly conditions, but do not define tax havens per se.14 In recent years, the UK converges to the group of tax havens in terms of the corporate tax level, see Figure A1 in the Appendix A. This is regarded with special interest when discussing the findings of hypothesis 3 in the context of BREXIT.
Another critical explanatory variable in our analysis is the relative FDI stock size of the various countries. For the regressions, we use OECD data for reasons referred to above, even though UNCTAD stock data is to some degree more reliable. Ireland, as an example of a tax haven country, has relatively high values of foreign capital, similar to the Netherlands. The USA, Germany, and Mexico are on similar levels below 10%, while 16% of the UK capital stock is comprised of foreign owned facilitates (see Figure A2 in the Appendix A). Again, the special role the UK takes in those descriptive statistics will be discussed with regard to hypothesis 4 and BREXIT.
4. Empirical Findings
4.1. PPML Dyadic Fixed Estimations
Findings from the preferred PPML estimator are presented in Table 3. Several models were developed, all including country-pair fixed effects (“dyadic fixed effects”), i.e., one dummy variable for each FDI origin to target direction. It should be noted that not only country-relationship (as, for example, the classical gravity variable “distance”) but also direction matters.15 We clustered the regression by country pairs in order to avoid problematic variance matrix calculations (singular or nonsymmetric variance matrices occur with large numbers of fixed effects dummies and missing data). Furthermore, we treated panel data via time dummies for each year.
Table 3.
Results for dyadic fixed panel data estimation using PPML estimators for FDI inflow.
Initially, one can see that the methodology fits the data well, as about 66% of FDI flows are explained by the model.16 Model (1) results are presented in the first column, showing the classical gravity variables of “size” via GDP and also GDP per capita, representing “wealth”. Distance, including all time nonvarying trading costs and time nonvarying country- and country pair-specific characteristics, is captured via fixed effects. This also explains the relatively high R-squared values. EU membership is also included in model (1) as a time-variant dummy variable, as is the real exchange rate. In columns (2), (3), and (4), the corporate tax rate on firms’ profits of the target country, trade openness indicating import/export activities, and the share of the capital stock which is owned by foreign countries was added.
Overall, the four models show a clear-cut picture without changes in the signs of significant coefficients and quite even results across models, with the exception of trade openness of a country. It loses explanatory power as soon as we control for FDI inward stock, suggesting that trade is closely linked with FDI.17
The effect of EU membership on FDI attractiveness and FDI outflows is mixed. While FDI attractiveness is not influenced by EU membership, countries send significantly more FDI abroad if they are a member of the EU. Specifically, FDI outflow is increased by 62% (origin_eu 0.480 ***, standard error 0.181). Origin country membership findings are in line with Fournier et al. (2015) and Bruno et al. (2016), while the effect of target-country membership lost significance when negative flows are checked for via a dummy. We therefore suggest considering multiple econometric approaches for negative dependent variables in gravity model settings.
Before going deeper into an analysis of the explanatory variables, we checked whether it is EU membership or rather participation in the EEA, i.e., access to the European single market, which has a significant impact on FDI flows. Table 4 shows the results as above, but the EU membership variables for both origin and target countries are dropped in exchange for variables indicating access to the European single market, yielding cumulative models (6), (7), (8), and (9).
Table 4.
Results for dyadic fixed panel data PPML estimation for FDI inflow, single market access as explanatory variable.
We noticed a shift in GDP and GDP per capita compared to the table above, which makes sense as EU countries’ and other countries’ access to the single market correlate unequally to those. All other variables remain similar, confirming the robustness of the results. In both model (3) and model (7), trade openness of the target country has a significant (and similar) impact on FDI flows. However, this effect vanishes in model (4) and (8), indicating a correlation between trade and FDI stock. Both the corporate tax rate and the foreign owned share of the target country’s capital stock (flow-independent) have strong significant impacts in all models, as do the variables indicating participation in the EU single market.
4.2. Results
- The EU membership of the origin country has a significant impact on FDI flows, namely +62% if the origin country is an EU member. No significant impact on FDI flow concerning the target country and EU membership is found. This contradicts previous studies, especially Bruno et al. (2016), as they also use OECD flow data. We ascribe the different results to not controlling for negative flows, as we get similar results to Bruno et al. (2016) when we do not control for them. FDI origin country and EU membership findings mirror those in literature.When controlling for single market instead of pure membership, we find a highly significant impact of both origin and target country having access to it. Interpreting model (8), which includes the total set of variables of interest, a country attracts +42% FDI inflows and sends +83% FDI outflows if it has access to the EU single market. While this number seems very high, it mirrors previous findings (see Table 1).
- Hypothesis 1 is therefore accepted, indicating that access to the single market results in considerably higher FDI in- and outflows.
- Trade openness has a significant impact on FDI flows, with a 1% increase in openness leading to a 0.6% increase in FDI flows (model 7). When controlling for the share of foreign ownership of a country’s capital stock, the effect vanishes, as both variables correlate strongly (see Table A1 and Table A2 in the Appendix A). To the extent that there is an FDI stock endogeneity problem, one would take model (3) as the preferred version, which clearly indicates the strong relevance of trade intensity. If this network should be damaged through a modest EU–UK free trade agreement, serious negative post-BREXIT effects on FDI should be expected.
- Hypothesis 2 is neither accepted nor rejected. While many studies prove the significant impact of the classical openness indicator, we show that it is important to focus attention on other variables, especially the share of already existing foreign capital within a country. Further research concerning trade and FDI is needed (keywords: production to market, supply chain analysis, etc.), and will be discussed to some extent in the conclusion.
- The corporate tax level has a negative impact on FDI flows, with a 1% increase in the statutory corporate tax level leading to an almost 4% decrease in FDI flows, and therefore results are in line with Folfas (2011). This will have different implications on greenfield and brownfield investments, mainly impacting decisions on where to construct new production plants. In addition, this should be considered in the context of tax havens.
- Hypothesis 3 is accepted. High corporate tax levels in home countries constrain FDI inflows.
- If the foreign-owned share of a country’s capital stock (namely inward stock over capital stock, lagged by one year to control for annual inflow) increases by 1%, the FDI inflow will increase by 1.9%. On one hand, with an annually rising FDI stock by aggregated inflow, depreciated and growth-considered, the stock-flow relationship is straightforward. On the other hand, we are interested in the cluster and spillover effects which pre-existing investment has on further investment. By lagging stocks we neutralize the direct inflow effect, leaving only the cluster effect.These findings are assessed to have strong implications, especially when considering policy changes such as an exit from the EU. To mirror this effect more clearly, an intertemporal gravity model could be altered, which we suggest for future research in the field of FDI flows but especially stocks.
- Hypothesis 4, that the relative foreign share of the capital stock of a country attracts increasing FDI, is accepted.
- According to Barrell et al. (2017), we would suspect that a low real exchange rate vis-à-vis USD will attract a higher FDI inward flow. However, the real exchange rate of home country to USD does not significantly impact FDI inward flows. However, this variable may not be compiled in an optimal way and further research needs to be done.
- Hypothesis 5 is rejected.
5. Policy Implications and Future Research
We evaluated recent FDI literature and selected those variables which had the biggest impact on FDI flows and stocks between countries. FDI gravity models and the two common data banks for bilateral FDI, UNCTAD and OECD, were analyzed. Bilateral FDI data is assessed to be a bit disappointing, as the latest data we could get was for 2012 and for OECD countries only (due to large discrepancies in UNCTAD data), therefore only the PPML estimator in a dyadic fixed panel setting for gravity models seems to be adequate for an FDI analysis.18 EU membership and participation in the European single market are the critical variables of interest in our study, also due to the forthcoming BREXIT as well as the broader anti-European sentiments which could be witnessed in other countries in 2016/2017. We control for the size of the relative foreign capital stock within the target country, the statutory corporate tax rate of the target country, and the real effective exchange rates between partners. Our findings are in line with previous studies, although we suggest analyzing access to the EU single market instead of pure-EU membership (also due to higher R-squared in respective models).
This indicates that in the case of BREXIT, it will be important for the UK to remain in the EEA and to have similar bilateral treaties with the EU as Norway does, for example, which they could reach when achieving a soft Brexit. Considering the hard Brexit case, the UK would lose almost half their FDI inflows from other European countries in the long run (20 years plus), especially from the Netherlands, Belgium, and Luxemburg, but also Germany and France, amongst others. That a hard Brexit would have no impact on FDI inflows from EU outsiders shall be doubted, as discussed in detail below. UK FDI outflows, i.e., UK investments abroad, will also decrease in the long run. A solution to counteract decreasing FDI flows could be to decrease the statutory corporate tax rate, as a 1% decrease leads to 3–4% increase in flows. However, the statutory corporate tax rate of the UK has already reached a very low level, competing with other OECD tax haven countries. We would be careful in giving policy advice to further decrease the tax rate. The relatively large FDI stock in the UK will, however, absorb the BREXIT effect to a small degree or at least slow down the process of reducing FDI inflows. Considering the exchange rate of the British pound to USD, it can be suspected that a cheaper pound stimulates FDI activities, especially brownfield investments. However, we do not find a significant effect of real exchange rates against USD.
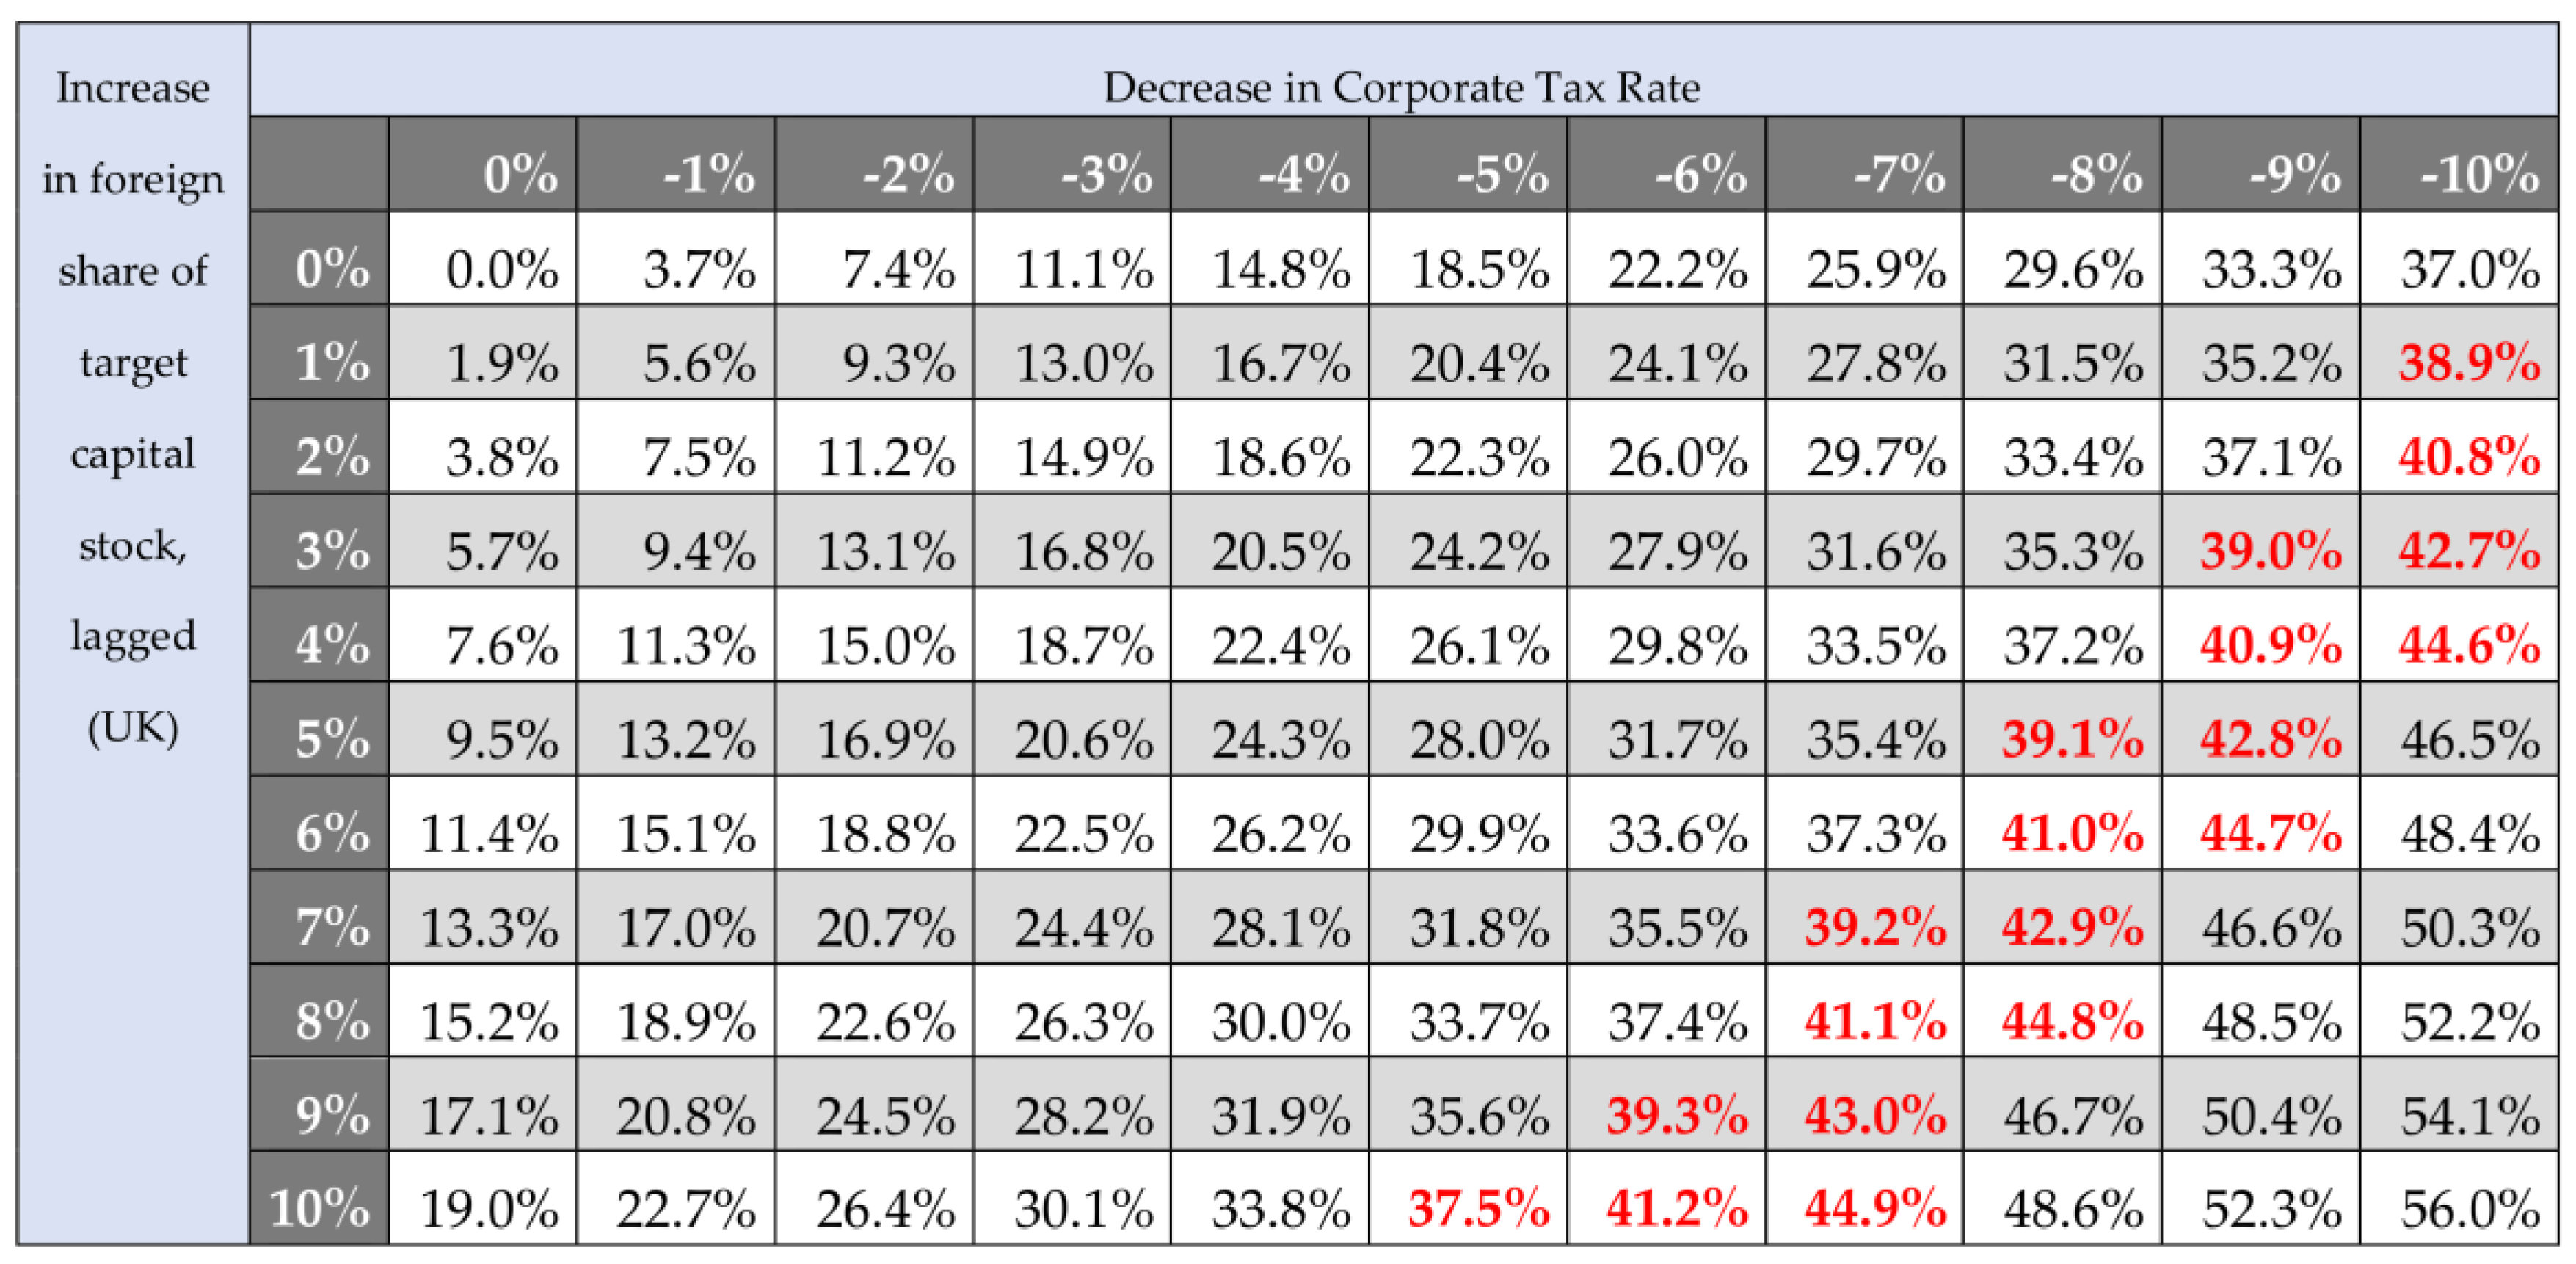
Figure 1 shows hypothetical combinations of changes in the statutory corporate tax rate which would be necessary to neutralize the combined effects of a hard Brexit (no EU single-market membership) and the various cases of an assumed increase in the foreign share of the target capital stock (for example, due to increasing M&A activities for 2015–2020). We have highlighted in red the required policy action in the sense of reducing the UK statutory corporate tax rate. As can be seen from the table, a given foreign share in the UK capital stock would require a reduction of a corporate tax rate by 11% to offset the BREXIT decision (interpreted here as losing access to the EU single market). If, for instance, the increase in the foreign share of the UK capital stock, driven by a real pound devaluation, would be 5%, the corporate tax rate would have to decrease by 8% in order to neutralize BREXIT in the long run.

Figure 1.
Scenario matrix for Corporate Tax and FDI Inward Stock Changes on FDI Inflows. Source: own calculations.
Taking into account that the total amount of FDI inflows of the countries considered has amounted to $0.735 trillion in 2012 and to $1.121 trillion in 2016, one gets a clear idea of just how important FDI inflows are. The reduction of the statutory corporate tax rate in the UK by 1% in 2017 and the US reduction of the statutory corporate tax rate by 15% should have a strong impact on the country breakdown of FDI flows in OECD countries. Taking into account the particular role of China, one could also include China into future enhanced FDI gravity modeling—once sufficient data for this country are available.
As regards BREXIT, the implication is that the UK would not only face a negative income effect related to reduced trade dynamics but that lower FDI inflows will also be relevant. As the UK government wants a hard BREXIT, it is clear that the full effect of the single market variable should be relevant unless some “quasi-EU membership” could be achieved in the form of a broad treaty on UK access to the EU single market. The approach presented here could also be applied to an FDI gravity equation with a specific sectoral analysis (see Figure A3 in the Appendix A), where financial services FDI are of particular interest in the case of the UK and BREXIT. Information and communication technology (ICT) FDI dynamics should also be of special interest since ICT is a major driver of innovation and growth in most OECD countries. The ICT sector might also be more footloose in the context of the relevant technologies so that the relevant parameter estimates should differ from the broader analysis presented here. For policy makers interested in targeting ICT sector inflows, additional insights from modified gravity modeling could indeed be quite important.
In particular, the approach presented could be applied to financial sector FDI flows and BREXIT analysis. As is well known from statistics (see Appendix A), about 30% of the British inward FDI stock consists of FDI in the financial services sector. Future UK–EU27 relations will most likely not reflect a continuation of the banks’ single passport which has allowed them to cover all banking services for clients in EU27 countries from the City of London as the UK’s global financial center. The European Central Bank, as well as the national prudential supervisors of EU countries, will require that banks offering financial services in the EU27 will have to get a separate banking license and to provide additional (separate) equity capital in order to be able to serve the EU single market post-BREXIT. The implication is that many British banks, US banks in London, Japanese banking subsidiaries in London, etc., will move banking activities—assets and staff—to EU27 countries, mostly Ireland, Germany, France, Luxembourg, and the Netherlands, so that one may anticipate a real Euro appreciation effect in the context of a structural adjustment in the British and Eurozone banking sectors. It is noteworthy that a study by Wyman (2017) has estimated the necessary additional capitalization needs of “London banks” doing business in EU27 could amount to close to €50 billion in a post-BREXIT situation. The implication then is that the overall supply of financial services in the EU27 should not change much compared to 2018 (the last full year of EU28 activities), but that there will indeed be a one-off FDI inflow effect in the EU27 financial services sector.
From a theoretical perspective, one may argue that FDI outflow/inflow patterns should differ by sectors if one considers technology intensity on the one hand and industrial versus financial sectors/firms on the other hand. Regarding the future access of British industrial firms to the EU27 single market, one may also point out that sectoral free trade agreements will typically require a minimum of 50–60% in value-added in the UK for British exports to qualify for duty free/preferred access to the EU single market. This implies that British firms will have to give up part of their existing EU28 production networks in order to raise the British value-added share from the current, often rather low, share of 30–40% in order to achieve the higher future minimum value-added shares. This implies a one-off disinvestment in EU27 countries by British firms on the one hand, and on the other hand it implies that the relative unit cost of many UK sectors which reduce their European supply chain production will increase. From the Barrell and Pain (1997) study, it is known for German multinational firms that relative unit costs are a significant FDI outward variable, and Germany’s outward FDI to the UK is about one quarter of all EU27 FDI in Great Britain. Thus the UK should face lower inward FDI flows from Germany (and other EU27 countries) in the future.
This, however, does not rule out that a massive real depreciation of the British pound would trigger larger international M&As in the UK. This would clearly have a negative impact on the growth of real national income (Z). If one considers a case of asymmetric cumulated FDI inflows only, we can write Z = Y(1 − α*ß), with α* denoting the share of foreign ownership in the capital stock, ß representing the share of profits in GDP under competition in goods and factor markets, and a Cobb-Douglas production function Y = Kß(AL)1 − ß with A representing technology and L labor respectively. The implication is that as an approximation (assuming α*ß to be close to zero), we can write lnZ = lnY − α*ß and therefore dlnZ/dt = dlnY/dt − ßdα*/dt. If BREXIT raises the share of foreign ownership in the UK capital stock by 10%, and we take the standard assumption that ß = 0.33, the growth rate of real income will be reduced by 3.3% through BREXIT. If the Treasury analysis of −10% of GDP due to BREXIT were correct, the total effect would be −13.3%. This is still an underestimation since UK–EU27 is a case of interdependency. Trade links, FDI links, and innovation links, with cumulated FDI capital accumulation contributing to Schumpeterian innovation dynamics, have to be considered simultaneously. Only in such a broader perspective can this lead to an understanding of output development over time.
One potentially important aspect that could be considered in future research is the changing geographical composition of UK FDI inflows post-BREXIT and the impact on sectoral FDI inflows and outflows in banking and finance in particular. For example, a higher inflow of US FDI in manufacturing and nonfinancial services is likely to go along with more US FDI inflows in banking and finance, where the US is a relatively strong source country in a global perspective. Manufacturing FDI inflows from advanced OECD countries are likely to bring a positive international technology transfer that could affect both economic growth and the long-run current account position of host countries. To the extent that higher US FDI outflows would overcompensate lower EU27 FDI outflows to the post-BREXIT UK, the overall FDI position of the UK is not weakened. However, a similar FDI result for the UK could have been expected under an EU–US TTIP agreement which had been envisaged under the Obama Administration but which was no longer a priority under President Trump.
Author Contributions
Paul J. J. Welfens conceived the main research question of the study concerning EU membership, which was supplemented together with Fabian J. Baier regarding corporate tax, exchange rates and FDI stock related variables as well as controlling for single market within the process of the study; Data collection and modelling were performed by Fabian J. Baier; Data analysis was done by Paul J. J. Welfens and Fabian J. Baier; Data interpretation and policy implications were compiled by Paul J. J. Welfens and Fabian J. Baier; Chapters “introduction” and “conclusion” were written by Paul J. J. Welfens, other chapters were written by Fabian J. Baier.
Acknowledgments
This paper is part of EIIW research funded by Deutsche Bundesbank; While the authors gratefully acknowledge funding from the Deutsche Bundesbank within the project “The Influence of Brexit on the EU28: Banking and Capital Market Adjustments as well as Direct Investment Dynamics in the Eurozone and other EU Countries”, opinions expressed within represent those of the authors and do not necessarily reflect the views of the Deutsche Bundesbank or its staff. We gratefully acknowledge editorial assistance by David Hanrahan (EIIW), data assistance by Lev Nazarov, comments by Andre Jungmittag, Frankfurt University of Applied Sciences and IPTS Sevilla, and EIIW seminar participants. We also gratefully acknowledge comments by three anonymous reviewers from the International Journal of Financial Studies. The usual caveat applies.
Conflicts of Interest
The authors declare no conflict of interest. The funding sponsors had no role in the design of the study; in the collection, analysis, or interpretation of data; in the writing of the manuscript, nor in the decision to publish the results.
Appendix A

Figure A1.
Corporate Tax Levels of Selected Countries. Source: Mintz and Weichenrieder (2010) (timeframe 1985–2008) and from KPMG (timeframe 2003–2017).
Figure A1.
Corporate Tax Levels of Selected Countries. Source: Mintz and Weichenrieder (2010) (timeframe 1985–2008) and from KPMG (timeframe 2003–2017).
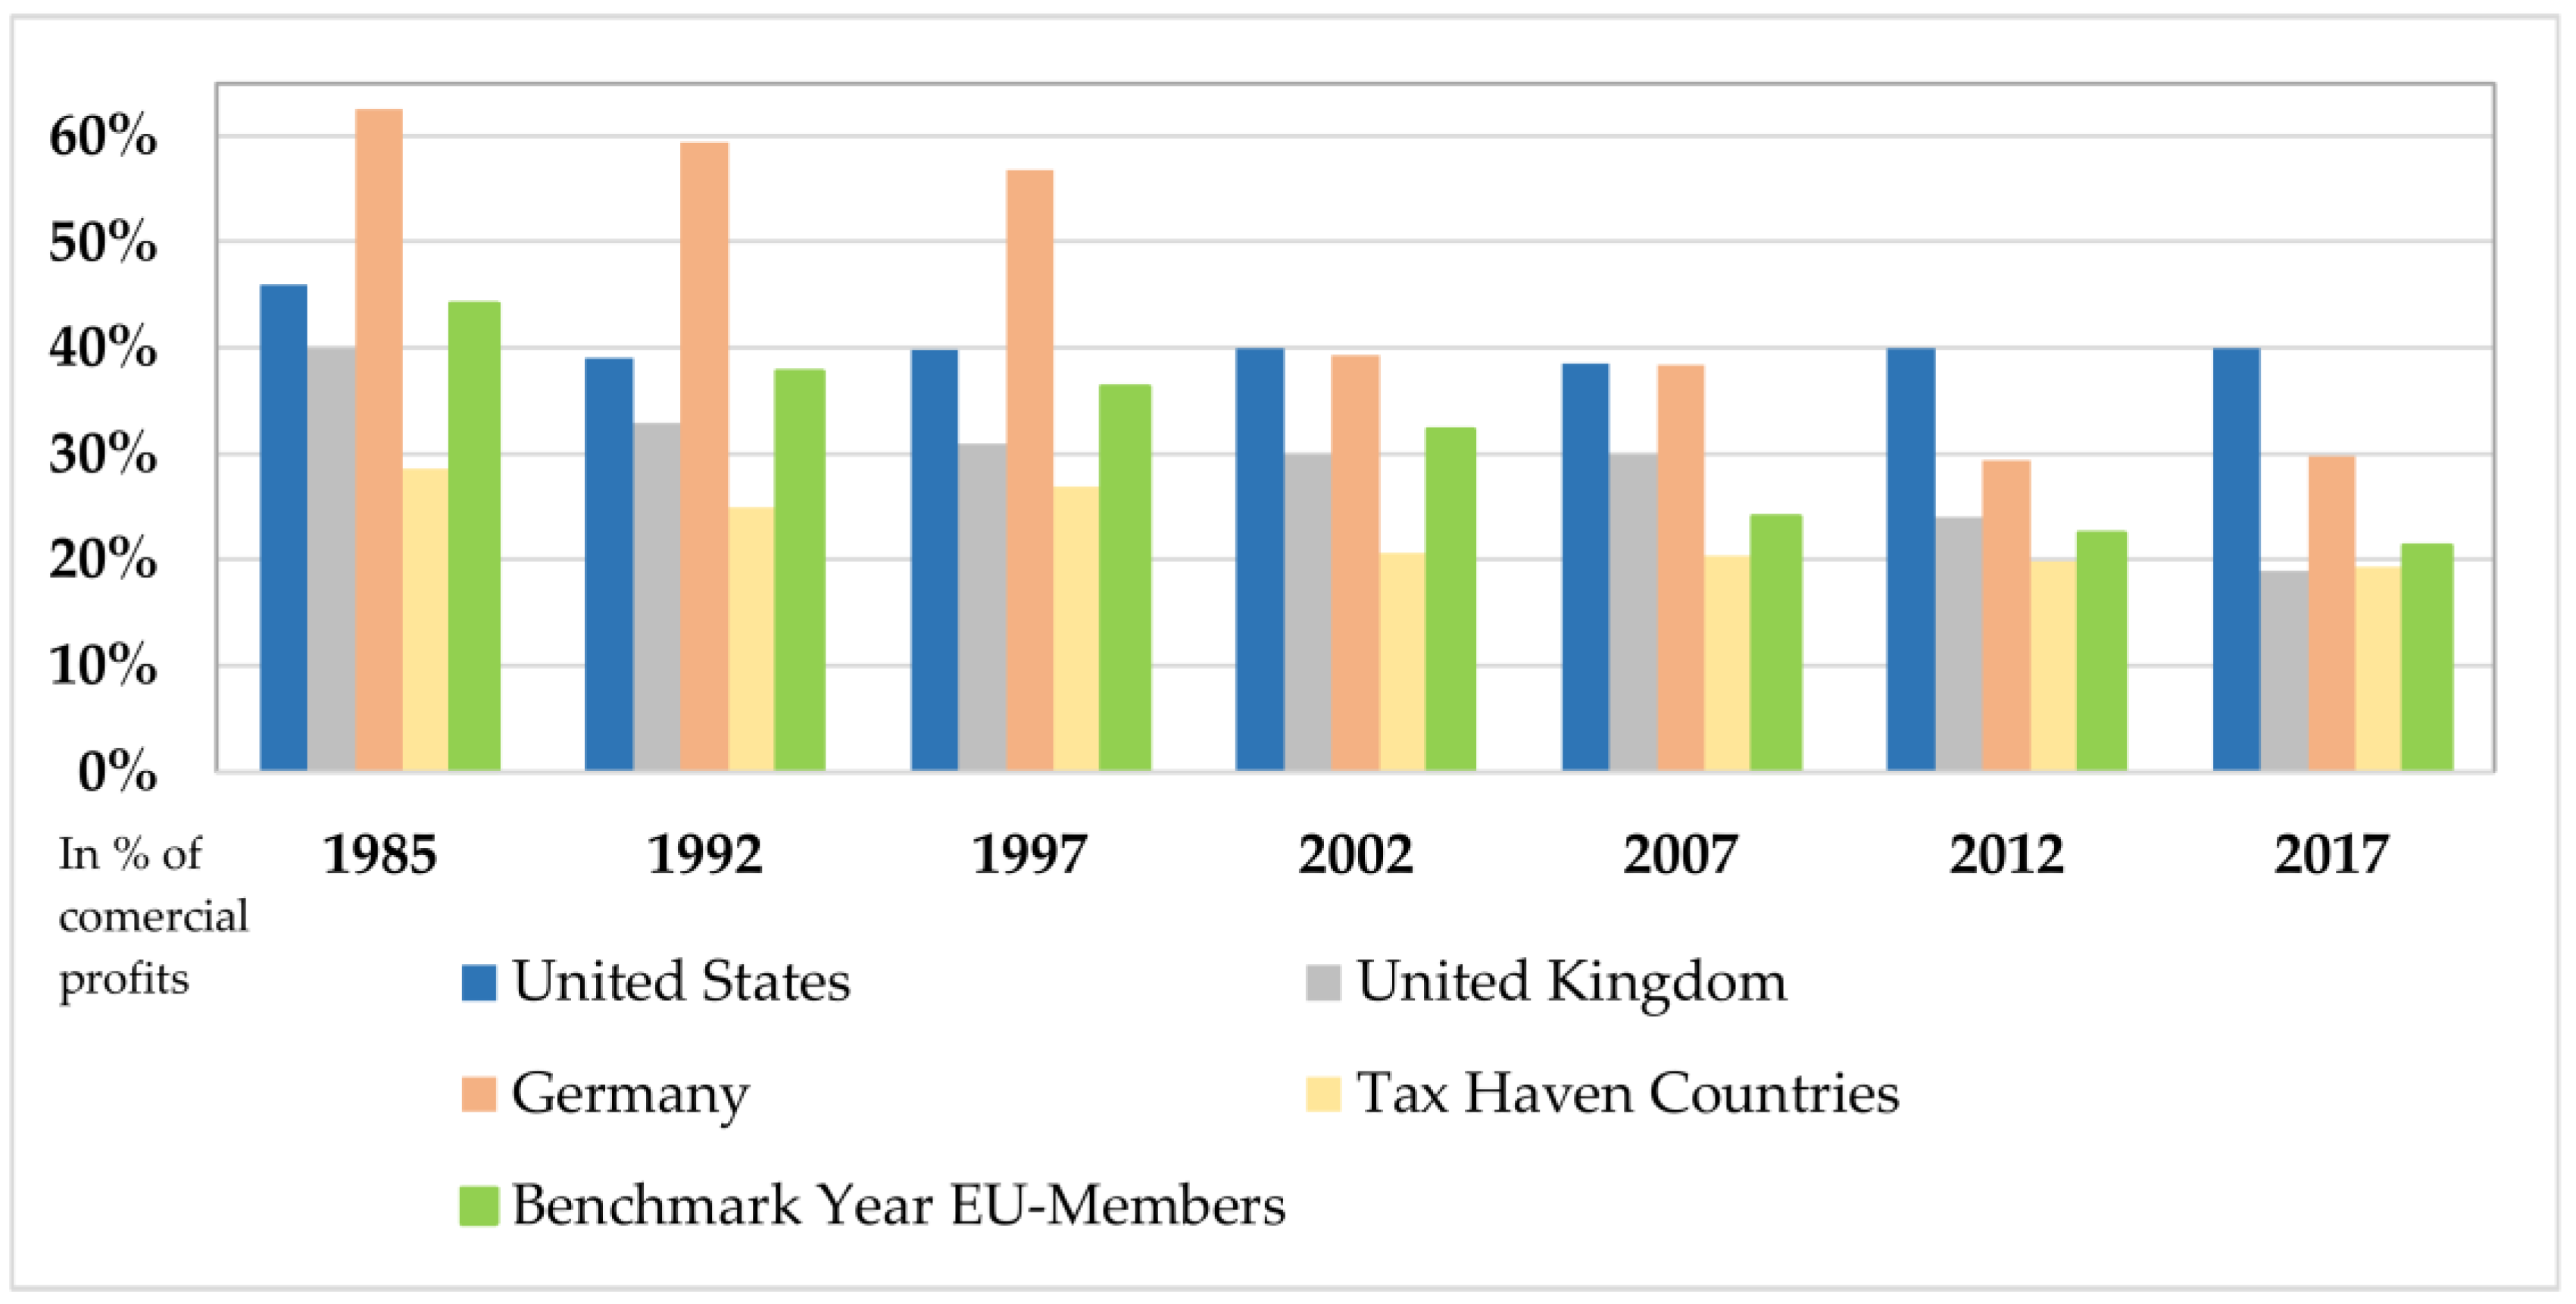
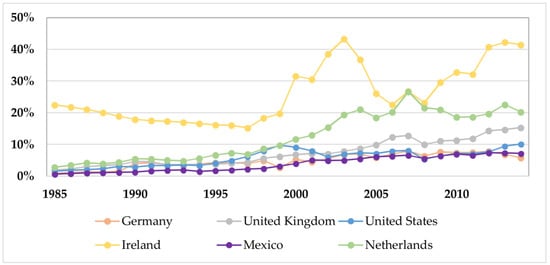
Figure A2.
FDI Inward Stock as Percentage of National Capital Stock. Source: UNCTAD.
Figure A2.
FDI Inward Stock as Percentage of National Capital Stock. Source: UNCTAD.
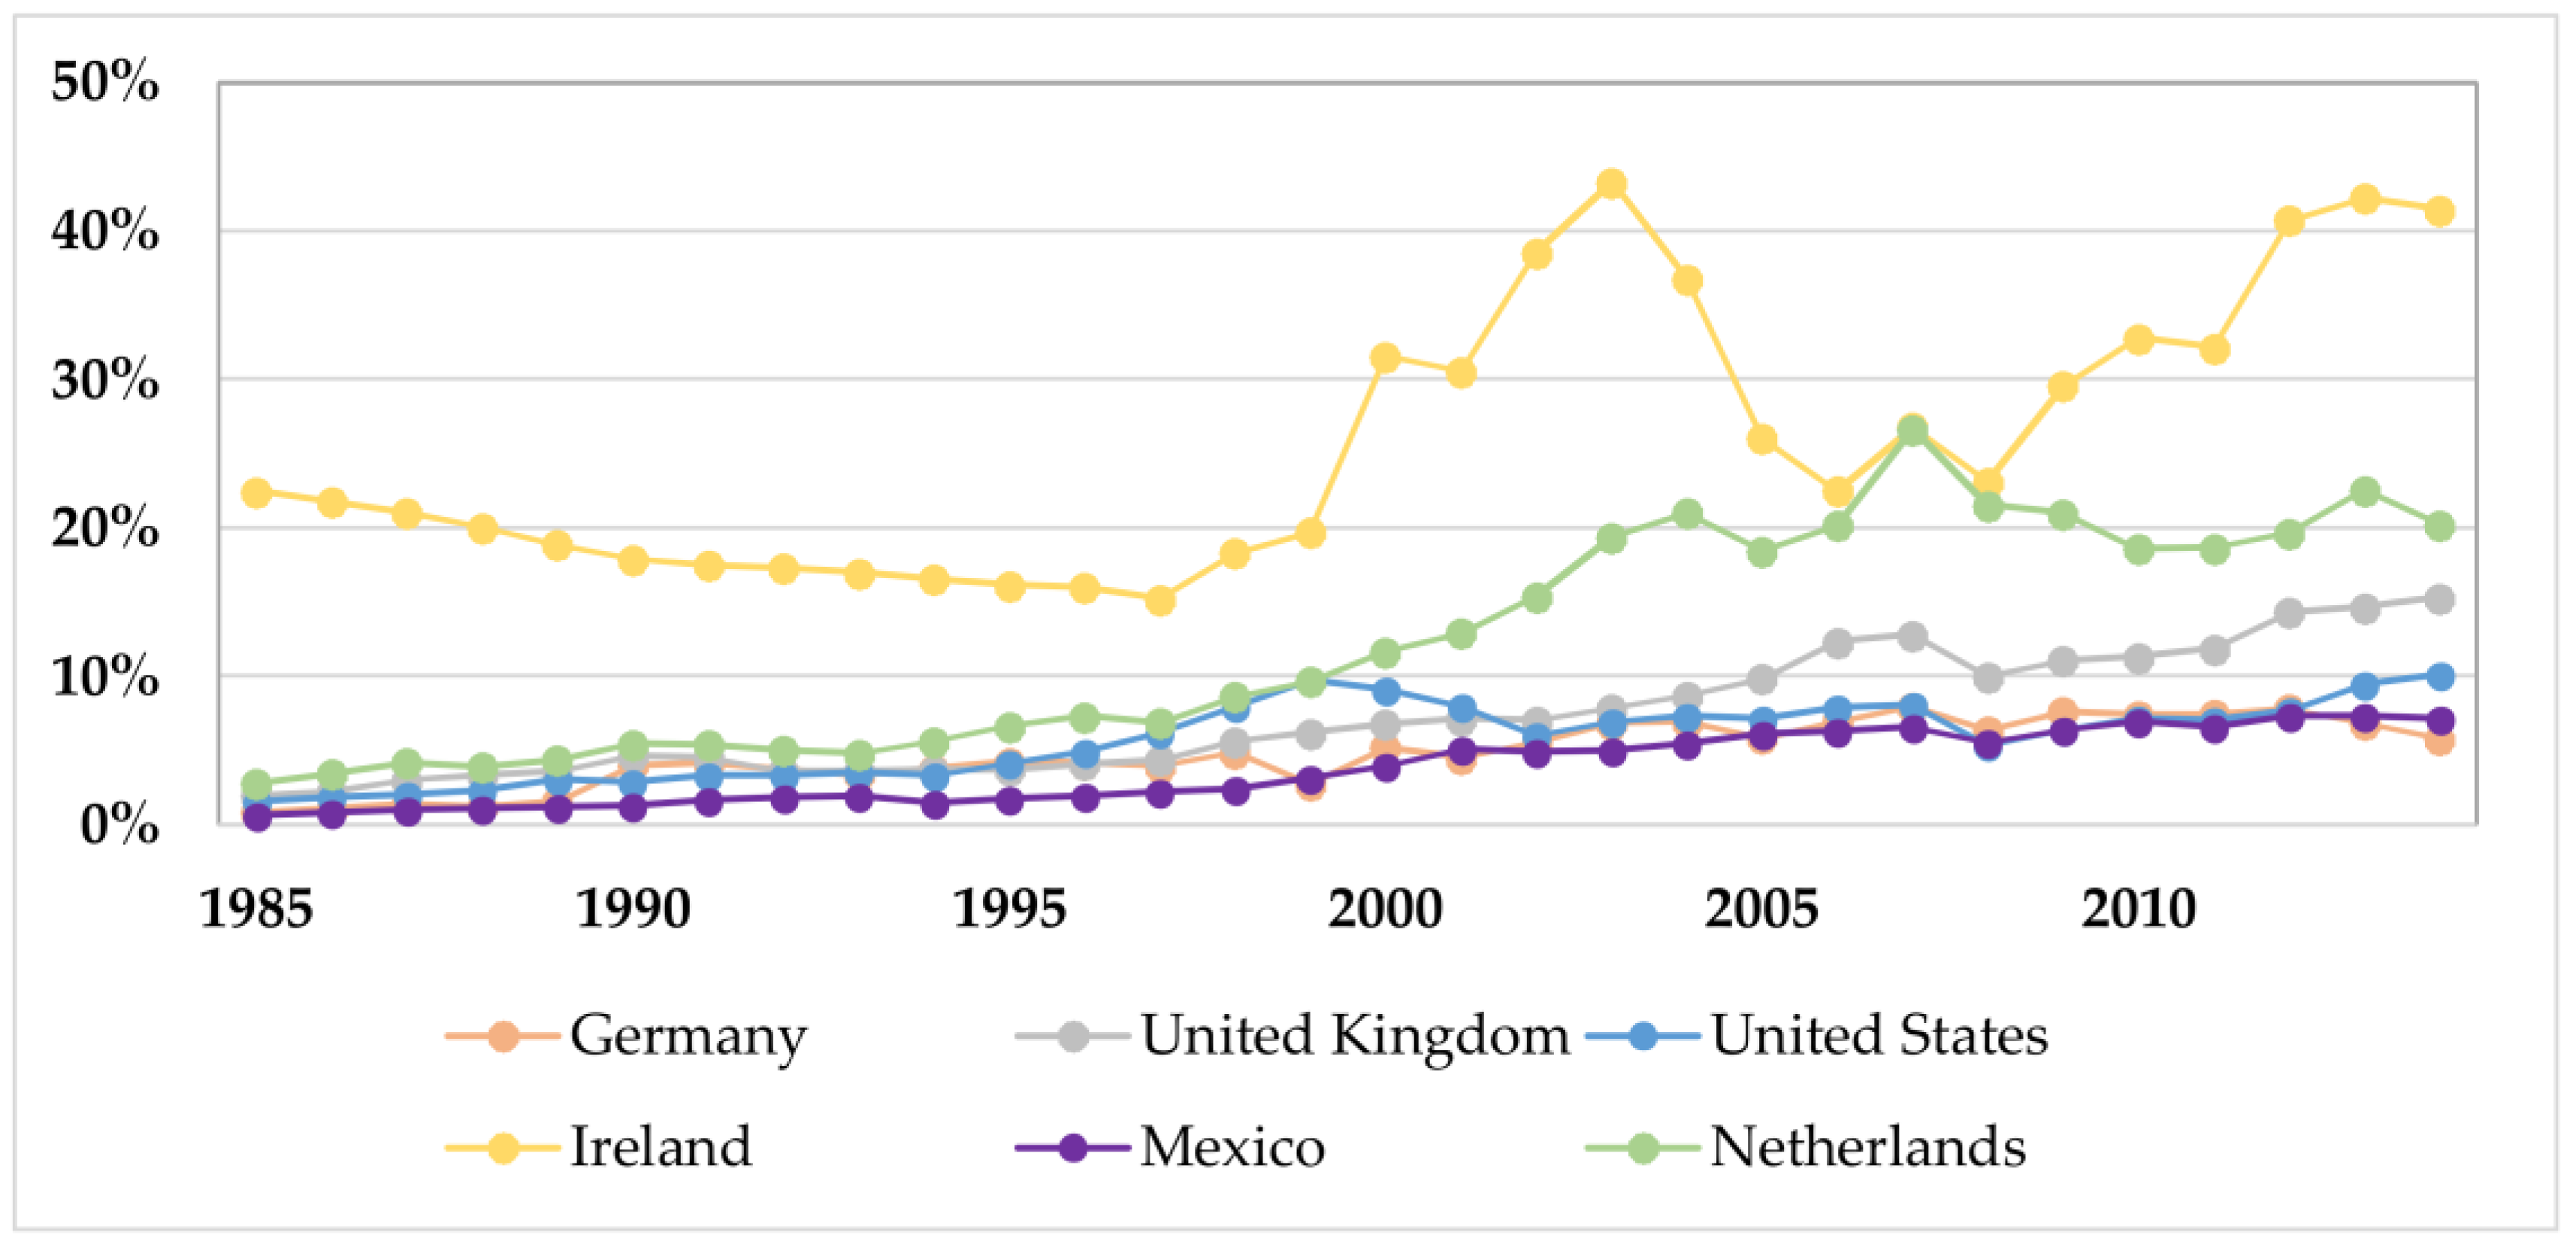
Table A1.
Correlation matrix for selected explanatory variables to FDI flow.
Table A1.
Correlation matrix for selected explanatory variables to FDI flow.
| Var_List | Ln_Target_Rer | Target_Corporate_Taxrate | Target_Openness | Foreign_Capstock_Share_Lagged |
|---|---|---|---|---|
| ln_target_rer | 1 | - | - | - |
| target_corporate_taxrate | −0.2153 | 1 | - | - |
| target_openness | −0.057 | −0.4553 | 1 | - |
| foreign_capstock_share_lagged | −0.1741 | −0.3248 | 0.7546 | 1 |
Source: own calculations.
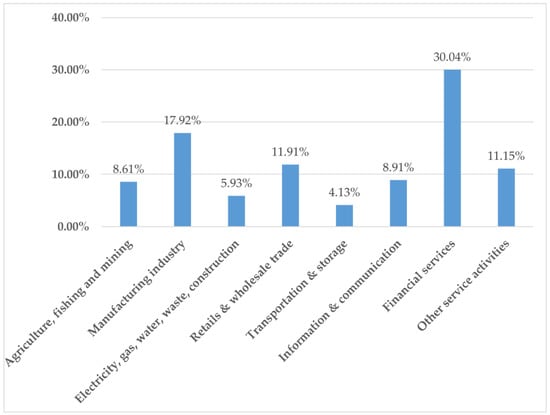
Figure A3.
FDI inward stock UK, by industry, 2015. Source: Office for National Statistics, UK, 2017.
Figure A3.
FDI inward stock UK, by industry, 2015. Source: Office for National Statistics, UK, 2017.
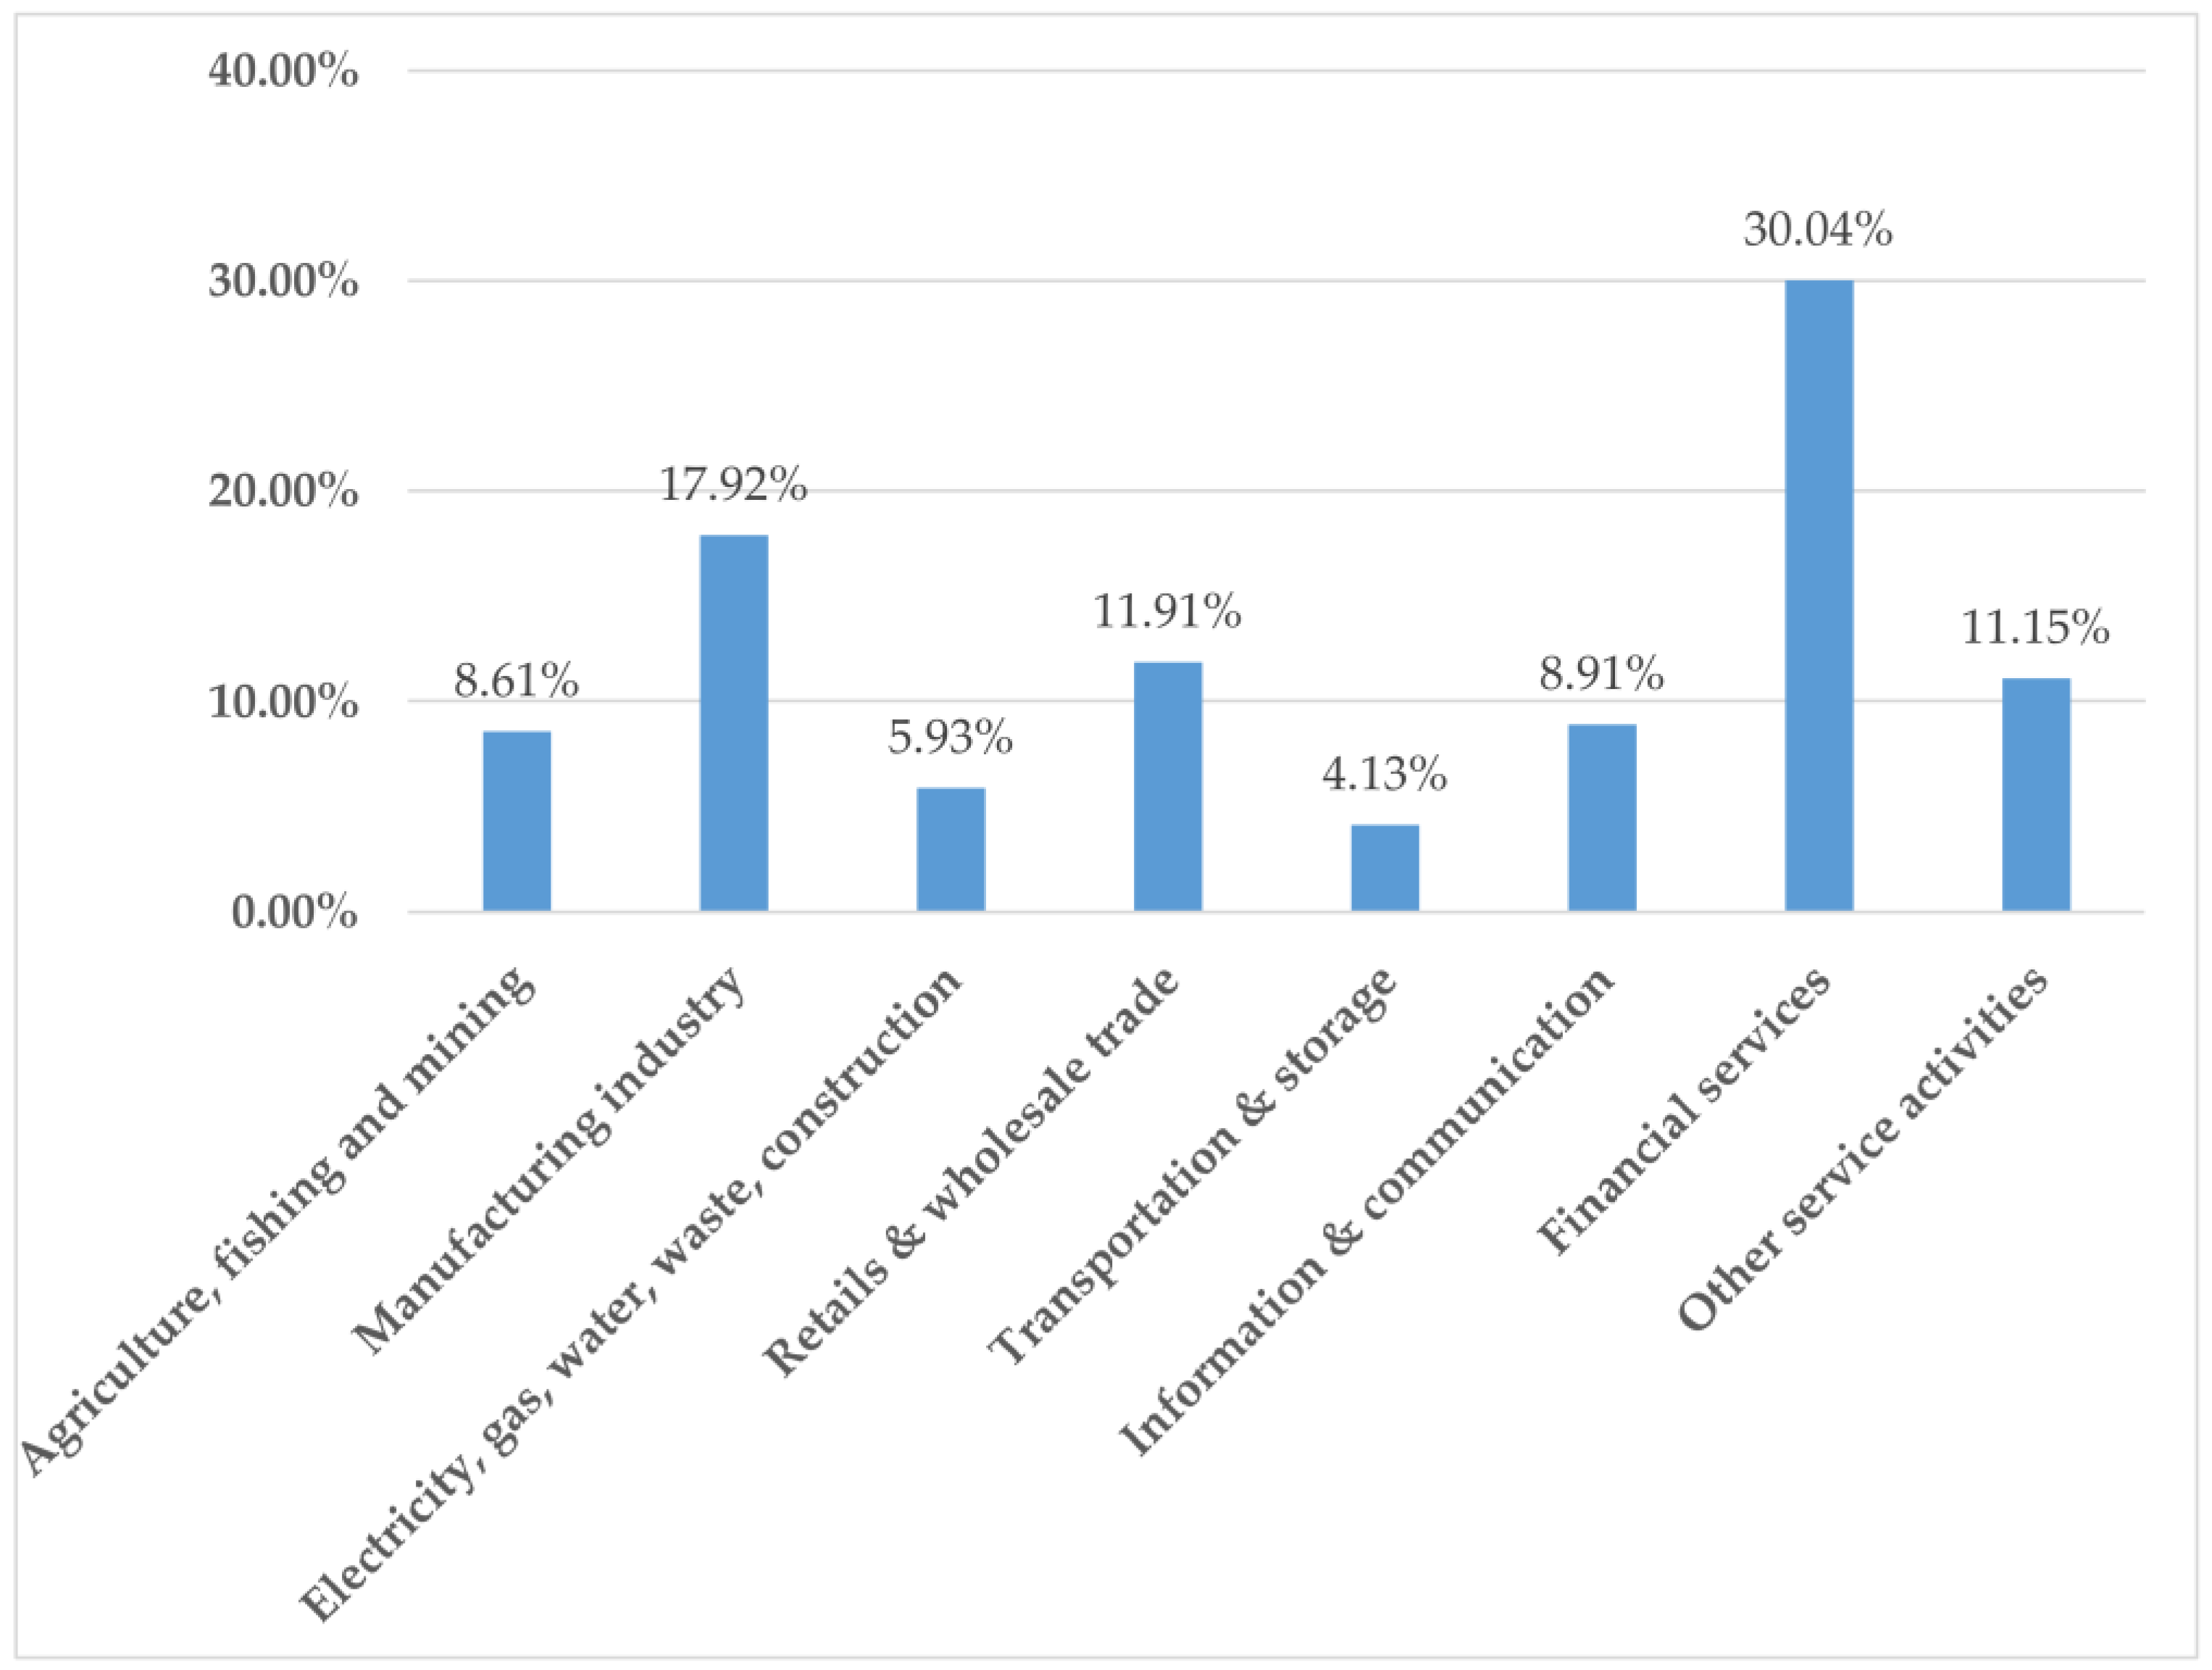
Table A2.
Correlation Matrix of all variables (excluded FE and “negative flow”-dummies).
Table A2.
Correlation Matrix of all variables (excluded FE and “negative flow”-dummies).
| Var_List | Target_Eu | Origin_Eu | Ln_Target_Gdp | Ln_Origin_Gdp | Ln_Target_Gdp_Per_Capita | Ln_Origin_Gdp_Per_Capita | Ln_Target_Rer | Target_Corporate_Taxrate | Target_Openness | Foreign_Capstock_Share_Lagged |
|---|---|---|---|---|---|---|---|---|---|---|
| target_eu | 1.0000 | - | - | - | - | - | - | - | - | - |
| origin_eu | 0.0167 | 1.0000 | - | - | - | - | - | - | - | - |
| ln_target_gdp | 0.0058 | -0.0148 | 1.0000 | - | - | - | - | - | - | - |
| ln_origin_gdp | −0.0079 | 0.0185 | −0.0346 | 1.0000 | - | - | - | - | - | - |
| ln_target_gdp_per_capita | 0.2972 | 0.0740 | 0.1925 | 0.0975 | 1.0000 | - | - | - | - | - |
| ln_origin_gdp_per_capita | 0.0518 | 0.2402 | −0.0281 | 0.3412 | 0.1777 | 1.0000 | - | - | - | - |
| ln_target_rer | −0.5343 | 0.0087 | −0.2104 | −0.0135 | −0.3051 | 0.0086 | 1.0000 | - | - | - |
| target_corporate_taxrate | −0.0426 | −0.1133 | 0.4799 | −0.1279 | −0.0479 | −0.2857 | −0.2153 | 1.0000 | - | - |
| target_openness | 0.3743 | 0.0674 | −0.4962 | 0.0744 | 0.2509 | 0.1698 | −0.0570 | −0.4553 | 1.0000 | - |
| foreign_capstock_share_lagged | 0.2622 | 0.0748 | −0.2341 | 0.0946 | 0.4953 | 0.1949 | −0.1741 | −0.3248 | 0.7546 | 1.0000 |
References
- Anderson, James E. 2011. The Gravity Model. Annual Review of Economics 3: 133–60. [Google Scholar] [CrossRef]
- Anderson, James E., and Eric Van Wincoop. 2003. Gravity with Gravitas: A Solution to the Border Puzzle. American Economic Review 93: 170–92. [Google Scholar] [CrossRef]
- Baldwin, Richard, and Daria Taglioni. 2007. Gravity for Dummies and Dummies for Gravity Equations. NBER Working Paper No. 12516. Cambridge: National Bureau of Economic Research. [Google Scholar]
- Bank of England. 2018. Inflation Report. London: Bank of England. [Google Scholar]
- Barrell, Ray, and Nigel Pain. 1997. Foreign Direct Investment, Technological Change, and Economic Growth within Europe. The Economic Journal 107: 1770–86. [Google Scholar] [CrossRef]
- Barrell, Ray, Abdulkader Nahhas, and John Hunter. 2017. Exchange Rates and Bilateral FDI: Gravity Models of Bilateral FDI in High Income Economies. Economics and Finance Working Paper Series, No. 17-07; London: Brunel University London. [Google Scholar]
- Blomström, Magnus, and Ari Kokko. 1998. Multinational Corporations and Spillovers. Journal of Economic Surveys 12: 247–77. [Google Scholar] [CrossRef]
- Blomstrom, Magnus, Ari Kokko, and Mario Zejan. 2000. Foreign Direct Investment: Firm and Host Country Strategies. Basingstoke: Palgrave Macmillan UK. [Google Scholar]
- Brenton, Paul, Francesca Di Mauro, and Matthias Lücke. 1999. Economic Integration and FDI: An Empirical Analysis of Foreign Investment in the EU and in Central and Eastern Europe. Empirica 26: 95–121. [Google Scholar] [CrossRef]
- Bruno, Randolph, Nauro Campos, Saul Estrin, and Meng Tian. 2016. Technical Appendix to ‘The Impact of Brexit on Foreign Investment in the UK’. Gravitating Towards Europe: An Econometric Analysis of the FDI Effects of EU Membership. London: Center for Economic Performance, London School of Economics and Political Science. [Google Scholar]
- De Benedictis, Luca, and Daria Taglioni. 2011. The Gravity Model in International Trade. In The Trade Impact of European Union Preferential Policies: An Analysis through Gravity Models. Edited by Luca De Benedictis and Luca Salvatici. Berlin: Springer. [Google Scholar]
- Dunning, John H. 1998. Location and the Multinational Enterprise—A Neglected Factor? Journal of International Business Studies 29: 45–66. [Google Scholar] [CrossRef]
- Dunning, John H. 2001. The Eclectric (OLI) Paradigm of International Production: Past, Present and Future. International Journal of the Econometrics of Business 8: 173–90. [Google Scholar] [CrossRef]
- Egger, Peter, and Michael Pfaffermayr. 2004. Foreign Direct Investment and European Integration in the 1990s. The World Economy 27: 99–110. [Google Scholar] [CrossRef]
- Erken, Hugo. 2017. The Permanent Damage of Brexit. Rabobank Special. Utrecht: Rabobank/Raboresearch. [Google Scholar]
- EY. 2018. Signs of a Brexit Impact on UK Foreign Direct Investment. Available online: http://www.ey.com/uk/en/newsroom/news-releases/18-03-29-signs-of-a-brexit-impact-on-uk-foreign-direct-investment (accessed on 12 April 2018).
- Feenstra, Robert C., Robert Inklaar, and Marcel P. Timmer. 2015. The Next Generation of the Penn World Table. American Economic Review 105: 3150–82. [Google Scholar] [CrossRef]
- Folfas, Paweł. 2011. FDI between EU Member States: Gravity Model and Taxes. ETSG 2011 Conference Paper. Warsaw: Warsaw School of Economics, Institute of International Economics. [Google Scholar]
- Fournier, Jean-Marc, Aurore Domps, Yaëlle Gorin, Xavier Guillet, and Délia Morchoisne. 2015. Implicit Regulatory Barriers in the EU Single Market: New Empirical Evidence from Gravity Models. OECD Economics Department Working Papers, No. 1181. Paris: OECD Publishing. [Google Scholar]
- Francois, Joseph, Miriam Manchin, Hanna Norberg, Olga Pindyuk, and Patrick Tomberger. 2013. Reducing Transatlantic Barriers to Trade and Investment. London: CEPR (for the European Commission). [Google Scholar]
- Froot, Kenneth, and Jeremy Stein. 1991. Exchange Rates and Foreign Direct Investments. Quarterly Journal of Economics 106: 1191–217. [Google Scholar] [CrossRef]
- Hayashi, Fumio. 2000. Econometrics. Princeton: Princeton University Press, pp. 233–34. [Google Scholar]
- Head, Keith, and Thierry Mayer. 2014. Gravity Equations: Workhorse, Toolkit and Cookbook. In Handbook of International Economics. Edited by Gene M. Grossman and Kenneth S. Rogoff. New York: Elsevier, vol. 4, chp. 3. pp. 131–95. [Google Scholar]
- Herrmann, Heinz, and Robert E. Lipsey. 2003. Foreign Direct Investment in the Real and Financial Sector of Industrial Countries. Berlin: Springer. [Google Scholar]
- HM Government. 2016. HM Treasury Analysis: The Long-Term Economic Impact of EU Membership and the Alternatives; London: HM Government.
- Ivarsson, Inge, and Thommy Jonsson. 2003. Local technological competence and asset-seeking FDI: An empirical study of manufacturing and wholesale affiliates in Sweden. International Business Review 12: 369–86. [Google Scholar] [CrossRef]
- Jungmittag, Andre, and Paul J. J. Welfens. 2016. Beyond EU-US Trade Dynamics: TTIP Effects Related to Foreign Direct Investment and Innovation. EIIW Discussion Paper No. 212. Bonn: Institute of Labor Economics. [Google Scholar]
- Kareem, Fatima Olanike, I. Martínez-Zarzoso, and B. Bruemmer. 2016. Fitting the Gravity Model If Zero Trade Flows Are Frequent: A Comparison of Estimation Techniques Using Africa’s Trade Data. Global Food Discussion Paper No. 77. Göttingen: Georg-August University Göttingen. [Google Scholar]
- Knickerbocker, Frederick T. 1973. Oligopolistic Reaction and Multinational Enterprises. Boston: Harvard University. [Google Scholar]
- Köhler, Matthias. 2018. An Analysis of Non-Traditional Activities at German Savings Banks—Does the Type of Fee and Commission Income Matter? Discussion Paper No. 01/2018. Frankfurt: Deutsche Bundesbank. [Google Scholar]
- KPMG. 2017. KPMG Corporate Tax Rates Table. Available online: https://home.kpmg.com/xx/en/home/services/tax/tax-tools-and-resources/tax-rates-online/corporate-tax-rates-table.html (accessed on 23 April 2018).
- Lawless, Martina, and Edgar L. W. Morgenroth. 2016. The Product and Sector Level Impact of a Hard Brexit across the EU. ESRI Working Paper No. 550. Tokyo: Economic and Social Research Institute. [Google Scholar]
- Makino, Shige, Chung-Ming Lau, and Rhy-Song Yeh. 2002. Asset-Exploitation versus Asset-Seeking: Implications for Location Choice of Foreign Direct Investment from Newly Industrialized Economies. Journal of International Business Studies 33: 403–21. [Google Scholar] [CrossRef]
- McGrattan, Ellen R., and Andrea Waddle. 2017. The Impact of Brexit on Foreign Investment and Production. Federal Reserve Bank of Minneapolis Research Department Staff Report 542 and NBER Paper w23217. Cambridge: National Bureau of Economic Research. [Google Scholar]
- Melitz, Marc J. 2003. The Impact of Trade on Intra-Industry Reallocations and Aggregate Industry Productivity. Econometrica 71: 1695–725. [Google Scholar] [CrossRef]
- Mintz, Jack, and Alfons Weichenrieder. 2010. The Indirect Side of Direct Investment—Multinational Company Finance and Taxation. CESifo Book Series; Cambridge: MIT Press. [Google Scholar]
- Raff, Horst, and Marc Von der Ruhr. 2001. Foreign Direct Investment in Producer Services: Theory and Empirical Evidence. CESifo Working Paper No. 598. Munich: CESifo Group Munich. [Google Scholar]
- Shepherd, Ben. 2016. The Gravity Model of International Trade: A User Guide. Herndon: United Nations Publication. [Google Scholar]
- Silva, J. M. C. Santos, and Silvana Tenreyro. 2006. The Log of Gravity. The Review of Economics and Statistics 88: 641–58. [Google Scholar] [CrossRef]
- Silva, J. M. C. Santos, and Silvana Tenreyro. 2011. Further Simulation Evidence on the Performance of the Poisson Pseudo-Maximum Likelihood Estimator. Economics Letters 112: 220–22. [Google Scholar] [CrossRef]
- Stammann, Amrei. 2017. Fast and Feasible Estimation of Generalized Linear Models with Many Two-Way Fixed Effects. Düsseldorf Working Paper. Düsseldorf: Heinrich Heine University. [Google Scholar]
- Straathof, Bas, Gert Jan Linders, Arjan Lejour, and M. Ã. Jan. 2008. The Internal Market and the Dutch Economy. Implications for Trade and Economic Growth. CPB Document No. 168. The Hague: CPB. [Google Scholar]
- Welfens, Paul J. J. 2017a. An Accidental BREXIT. London: Palgrave Macmillan. [Google Scholar]
- Welfens, Paul J. J. 2017b. The True Cost of BREXIT for the UK: A Research Note. EIIW Discussion Paper No. 234. Wuppertal: Universitätsbibliothek Wuppertal, University Library. [Google Scholar]
- Whyman, Philip B., and Alina I. Petrescu. 2017. The Economics of Brexit. A Cost-Benefit Analysis of the UK’s Economic Relationship with the EU. Berlin: Palgrave Macmillan, Springer International Publishing AG. [Google Scholar]
- Wojciechowski, Liwiusz. 2013. The Determinants of FDI Flows from the EU-15 to the Visegrad Group Countries—A Panel Gravity Model Approach. Entrepreneur Business and Economics Review 1: 7–22. [Google Scholar] [CrossRef]
- Wyman, Oliver. 2017. One Year on from the Brexit Vote—A Briefing for Wholesale Banks. London: TheCityUK. [Google Scholar]
| 1 | Some variables, such as distance, might lose importance with falling transport costs. Others, such as digitalization and innovation, gain due to globalization. |
| 2 | Therefore, they ran two models, 1981–2005 and 1994–2004. They did not find significant differences. |
| 3 | What is the decisive connection between an EU dropout and FDI flow/stock and to what extent; for example, currency union, policy union, migration, free trade areas, etc. |
| 4 | They use a two-step system Generalized Method of Moments (GMM) estimator for their gravity model. |
| 5 | Direction matters. |
| 6 | This is a workaround to more commonly used panel estimations with OLS in Stata, enabling calculation of panel-estimations with PPML. |
| 7 | The methodology of lagging endogenous variables with respect to time in order to mitigate potential endogeneity problems has become more popular in recent literature; in this regard we follow Köhler (2018). We also use cluster robust standard errors, clustered by country pair, and check the adequacy of the methodology via a Durbin–Wu–Hausman test. |
| 8 | Utilization of the model in economic research is described by De Benedictis and Taglioni (2011). |
| 9 | Outward and inward resistance: exports from country i to country j depend on trade costs of all possible export markets (outward resistance); imports into country i from j depend on trade costs of all possible import markets. |
| 10 | Controlling for EU membership in an era without entries or exits in a country fixed effects setting will not work (due to omitted variable bias). Bilateral dummies are constructed: (1) member exports to member; (2) nonmember exports to member; (3) member exports to nonmember; the non-non case acts as a baseline for interpretation. |
| 11 | Regressions were run separately just for the purpose of validation of variable exogeneity, with FDI inflow as a dependent variable and EU-membership and FDI capital stock share (lagged) as explanatory variables, using the xtivreg2 Stata command, see Hayashi (2000), as there is no endogeneity test implementable within the PPML. |
| 12 | Setting the smallest equal to zero and adding up. |
| 13 | In previous literature, this problem was not addressed in detail, although Fournier et al. (2015) and Bruno et al. (2016) seemed to have assigned zeroes (which then convert to one, in order to be able to also utilize OLS) to negatives instead of dropping them. Comparing their datasets and nondropped observations lead to this conclusion. |
| 14 | Countries with the lowest corporate tax levels include Ireland, Switzerland, Slovenia, Chile, the Czech Republic, Poland and Hungary. |
| 15 | For example, one dummy for Australia-Austria, but also one dummy for Austria-Australia. |
| 16 | For R-squared interpretation in PPML models we follow Shepherd (2016). |
| 17 | The variables target_openness and foreign_capstock_share_lagged show a correlation coefficient of 0.75, indicating that the capital stock variable swallows the explanatory power of trade openness; see Table A1 and Table A2 in the Appendix A. |
| 18 | Barrell et al. (2017) were the first to take on a different modelling approach. Their findings are quite similar to ours, however they did not use fixed effects and as well FDI stocks rather than FDI flows. |
© 2018 by the authors. Licensee MDPI, Basel, Switzerland. This article is an open access article distributed under the terms and conditions of the Creative Commons Attribution (CC BY) license (http://creativecommons.org/licenses/by/4.0/).