
Strategic Decision-Making and Social Skills: Integrating Behavioral Economics and Social Cognition Research

Abstract
:1. Introduction
1.1. Theory of Mind as a Central Process for Successful Strategic Decision-Making
1.2. Strategic Decision-Making and Autistic Traits in Normal Adults
1.3. The Present Study
2. Results
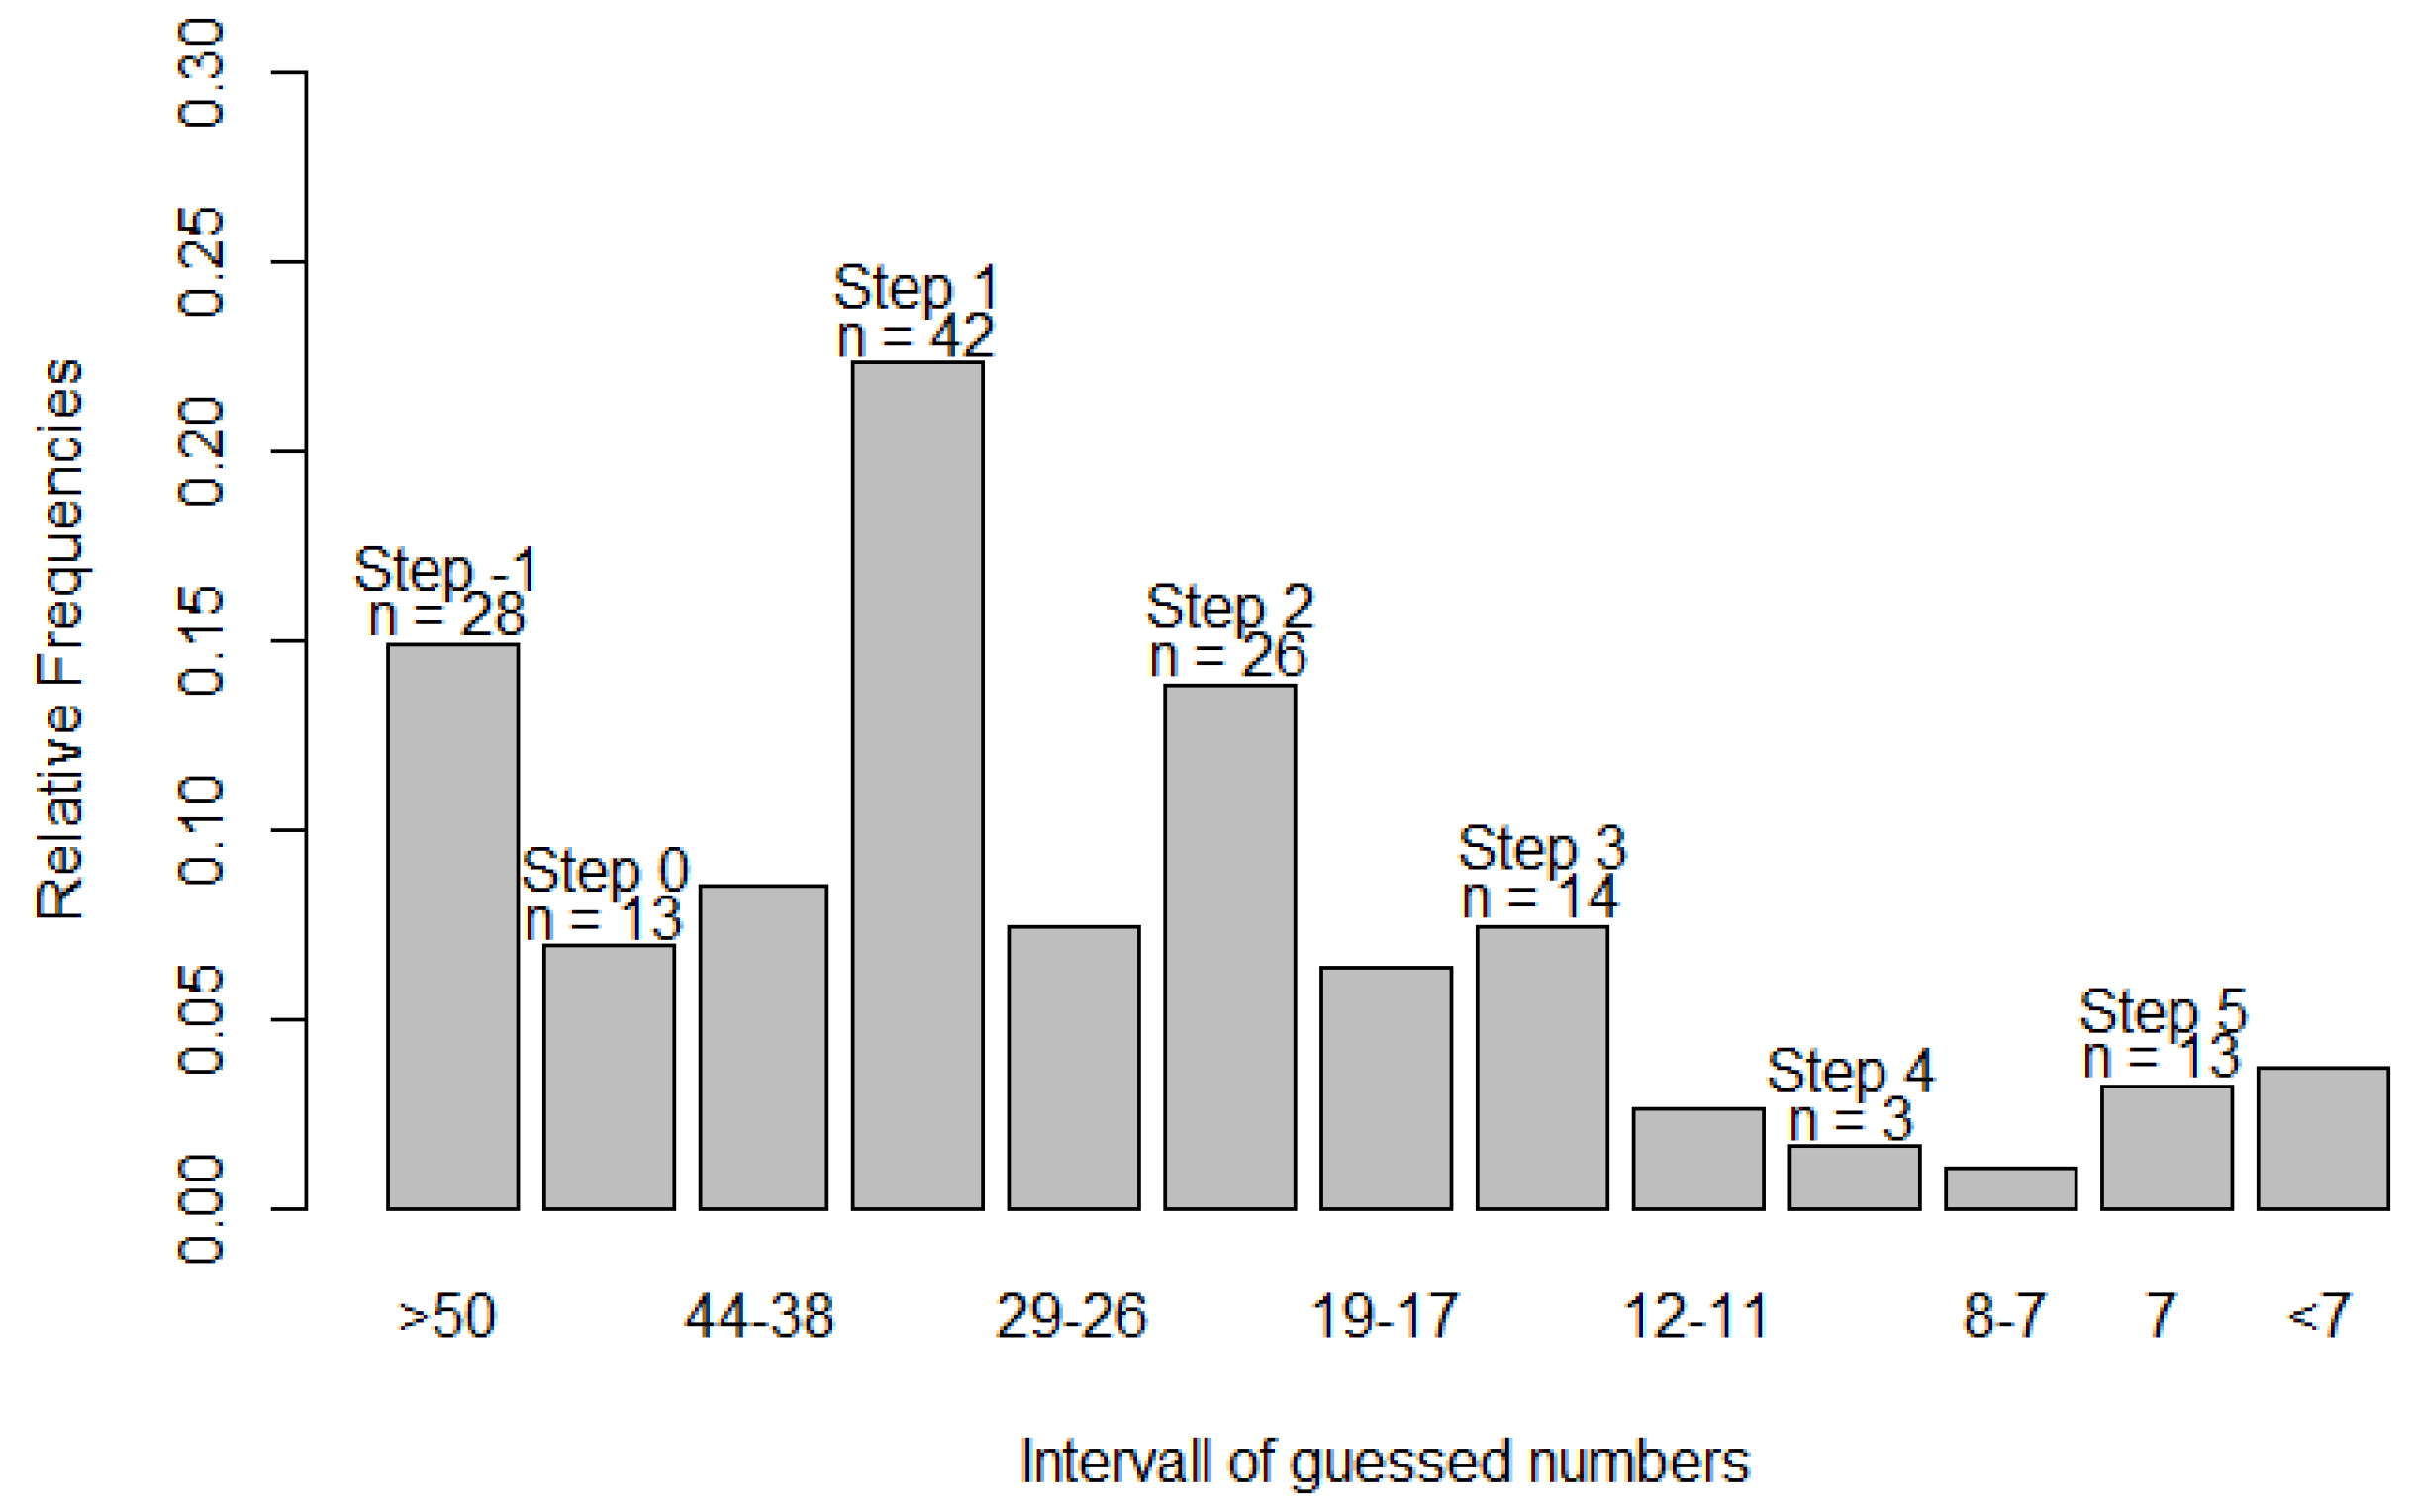
2.1. Analysis of Level-K Reasoning and AQ Measures
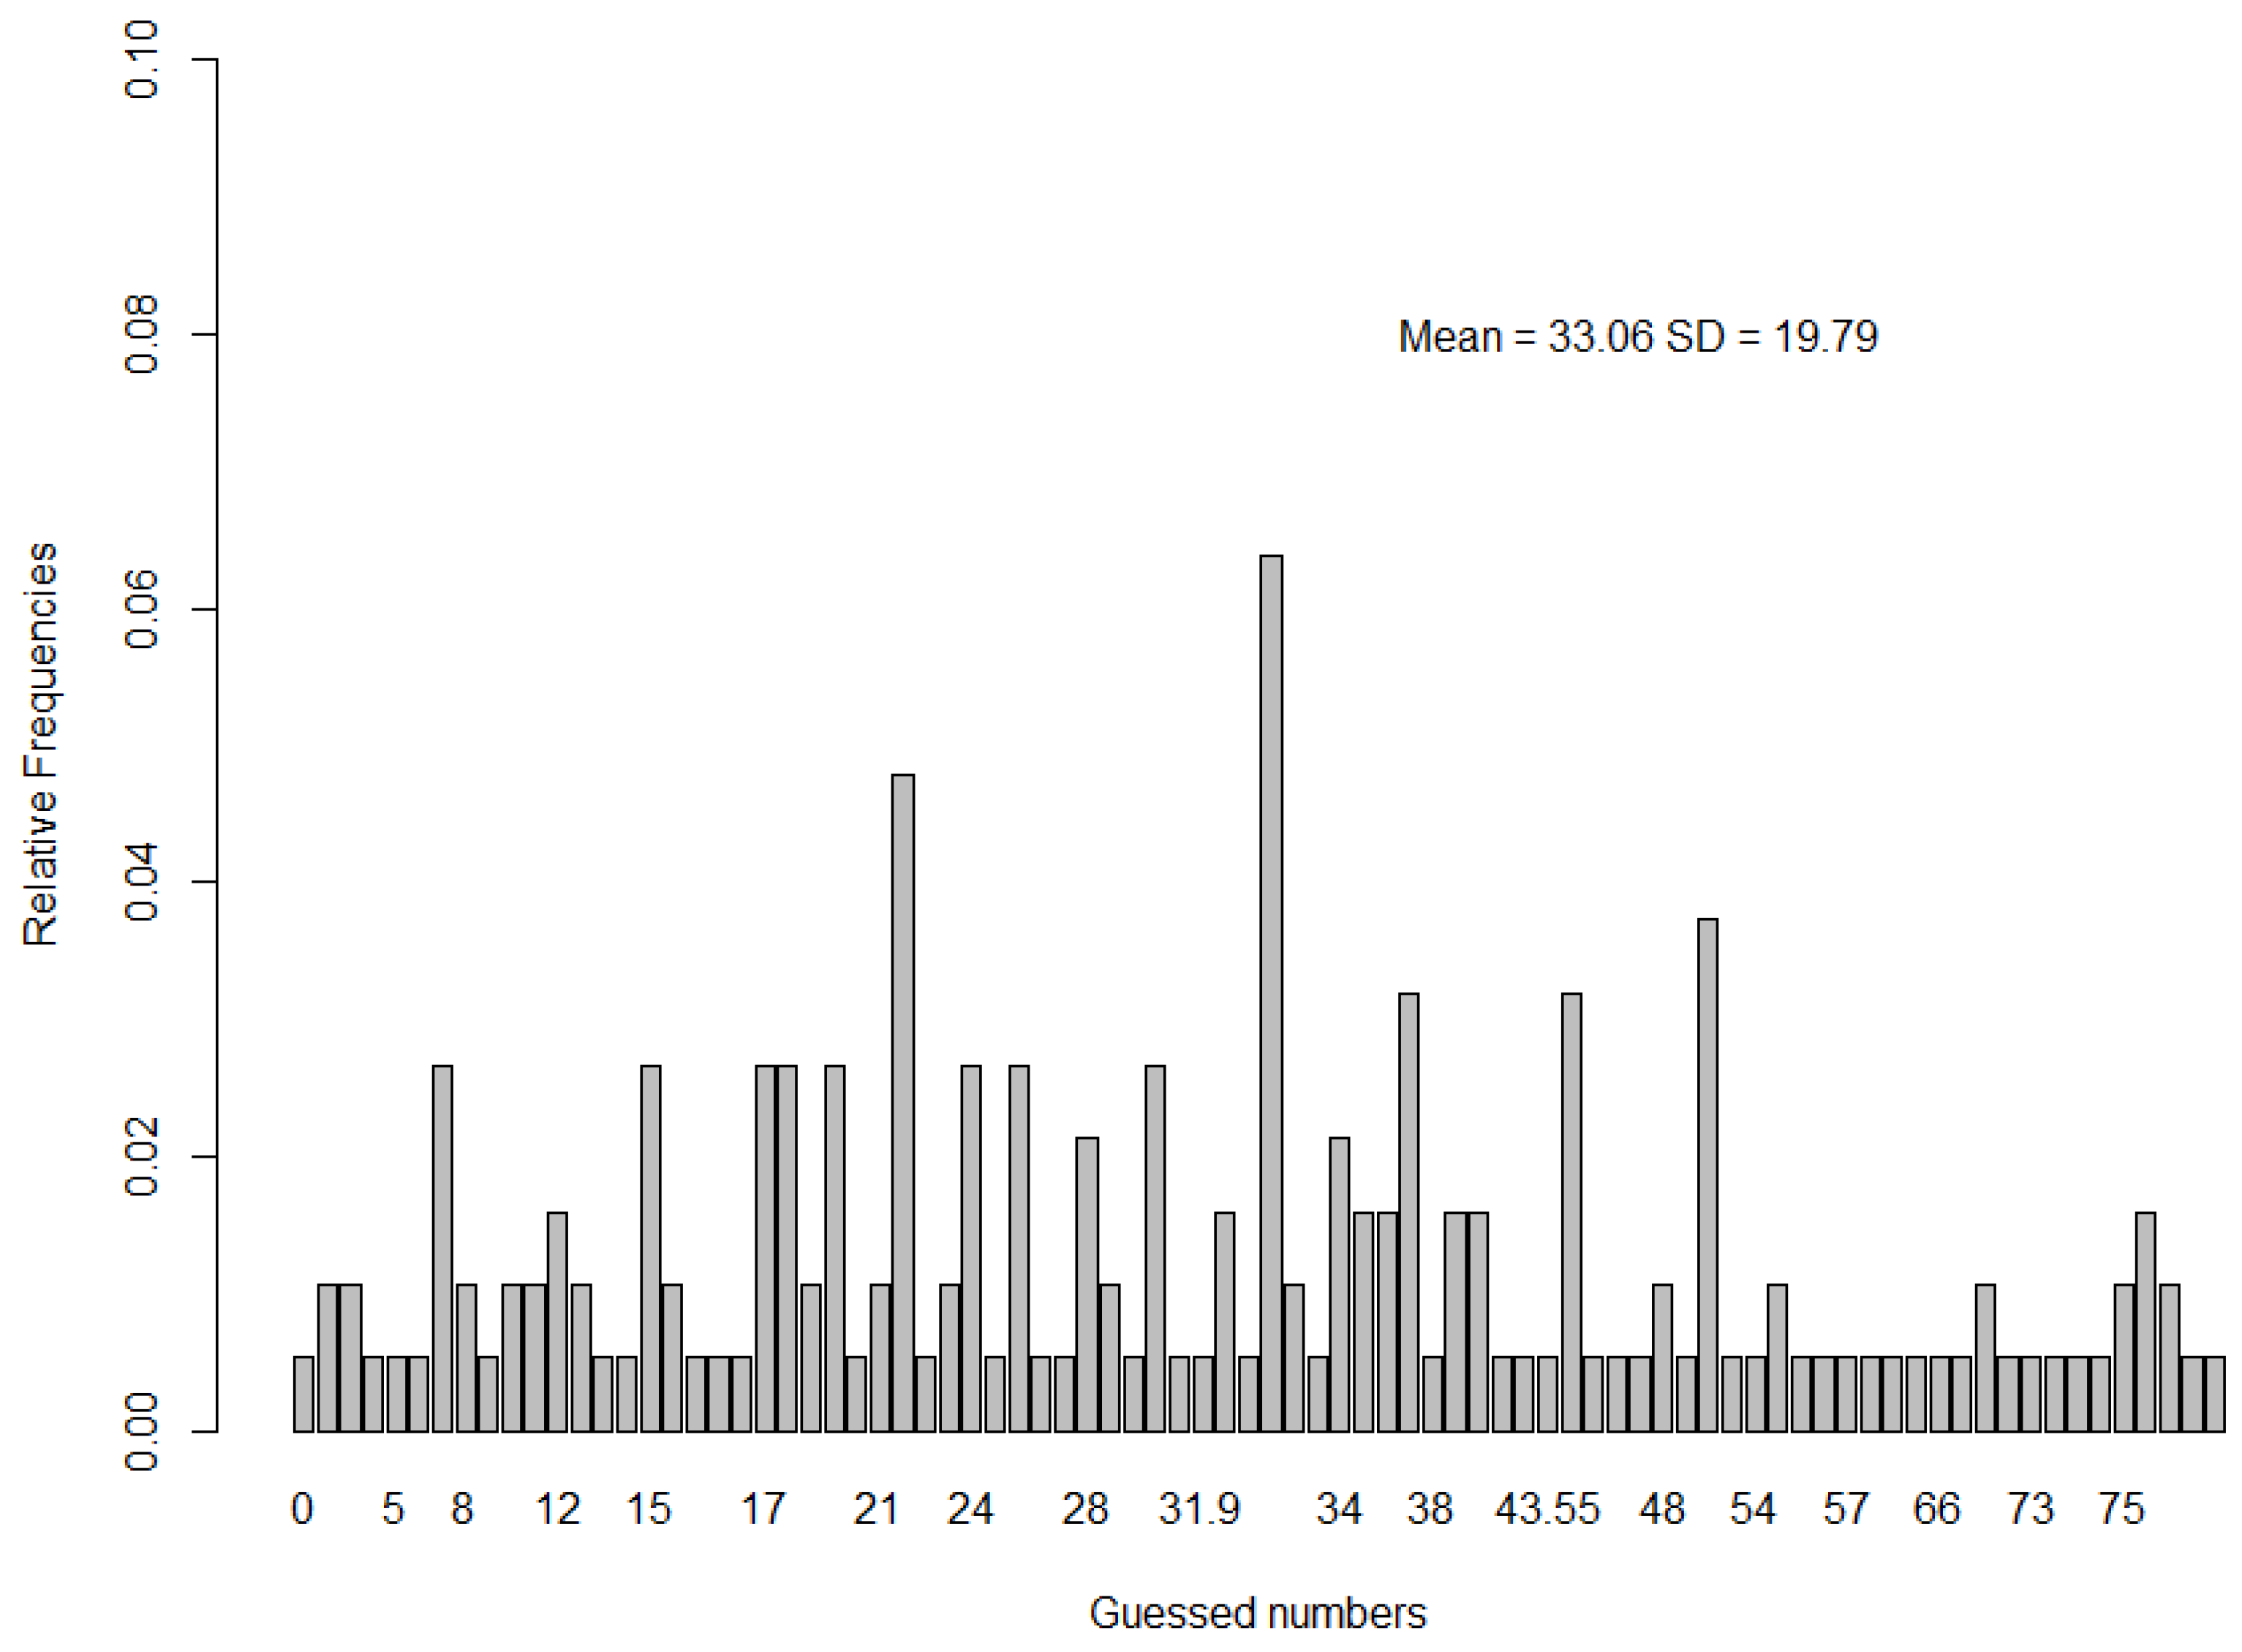
2.2. Distance to the Target Number and AQ Scores
2.3. Checking Results for Sophisticated Players with L ≥ 1
3. Discussion
4. Materials and Methods
5. Conclusions
Acknowledgments
Author Contributions
Conflicts of Interest
References
- J. Von Neumann, and O. Morgenstern. Theory of Games and Economic Behavior. Princeton, NJ, USA: Princeton University Press, 1947. [Google Scholar]
- A. Bosch-Doménech, J.G. Montalvo, R. Nagel, and A. Satorra. “A finite mixture analysis of beauty-contest data using generalized beta distributions.” Exp. Econ. 13 (2010): 461–475. [Google Scholar] [CrossRef]
- M.A. Costa-Gomes, and G. Weizsäcker. “Stated Beliefs and Play in Normal-Form Games.” Rev. Econ. Stud. 75 (2008): 729–762. [Google Scholar] [CrossRef]
- L. Rose-Krasnor. “The Nature of Social Competence: A Theoretical Review.” Soc. Dev. 6 (1997): 111–135. [Google Scholar] [CrossRef]
- S. Baron-Cohen, S. Wheelwright, R. Skinner, J. Martin, and E. Clubley. “The Autism Spectrum Quotient: Evidence from Asperger syndrome/high functioning autism, males and females, scientists and mathematicians.” J. Autism Dev. Disord. 31 (2001): 5–17. [Google Scholar] [CrossRef] [PubMed]
- R. Nagel. “Unraveling in guessing games: An experimental study.” Am. Econ. Rev. 85 (1995): 1313–1326. [Google Scholar]
- T.-H. Ho, and C. Camerer. “Iterated Dominance and Iterated Best Response in Experimental “p-Beauty Contests”.” Am. Econ. Rev. 88 (1998): 947–969. [Google Scholar]
- D. Shapiro, X. Shi, and A. Zillante. Robustness of Level-k Reasoning in Generalized Beauty Contest Games. Toronto, ON, Canada: Department of Economics, University of Toronto, 2009. [Google Scholar]
- O. Rydval, A. Ortmann, and M. Ostatnicky. “Three very simple games and what it takes to solve them.” J. Econ. Behav. Organ. 72 (2009): 589–601. [Google Scholar] [CrossRef]
- T.C. Burnham, D. Cesarini, M. Johannesson, P. Lichtenstein, and B. Wallace. “Higher cognitive ability is associated with lower entries in a p-beauty contest.” J. Econ. Behav. Organ. 72 (2009): 171–175. [Google Scholar] [CrossRef]
- J. Carpenter, M. Graham, and J. Wolf. “Cognitive ability and strategic sophistication.” Games Econ. Behav. 80 (2013): 115–130. [Google Scholar] [CrossRef]
- D. Gill, and V.L. Prowse. “Cognitive ability, character skills, and learning to play equilibrium: A level-k analysis.” J. Polit. Econ., 2014. forthcoming. [Google Scholar] [CrossRef] [Green Version]
- P. Brañas-Garza, T. García-Muñoz, and R.H. González. “Cognitive effort in the Beauty Contest Game.” J. Econ. Behav. Organ. 83 (2012): 254–260. [Google Scholar] [CrossRef]
- D. Premack, and G. Woodruff. “Does the chimpanzee have a theory of mind.” Behav. Brain Sci. 4 (1978): 515–526. [Google Scholar] [CrossRef]
- M. Agranov, E. Potamites, A. Schotter, and C. Tergiman. “Beliefs and endogenous cognitive levels: An experimental study.” Games Econ. Behav. 75 (2012): 449–463. [Google Scholar] [CrossRef]
- S. Georganas, P.J. Healy, and R.A. Weber. “On the persistence of strategic sophistication.” J. Econ. Theory 159 (2015): 369–400. [Google Scholar] [CrossRef]
- S. Baron-Cohen, T. Jolliffe, C. Mortimore, and M. Robertson. “Another advanced test of theory of mind: Evidence from very high functioning adults with autism or asperger syndrome.” J. Child. Psychol. Psychiatry 38 (1997): 813–822. [Google Scholar] [CrossRef] [PubMed]
- G. Coricelli, and R. Nagel. “Neural correlates of depth of strategic reasoning in medial prefrontal cortex.” Proc. Natl. Acad. Sci. USA 106 (2009): 9163–9168. [Google Scholar] [CrossRef] [PubMed]
- W. Yoshida, I. Dziobek, D. Kliemann, H.R. Heekeren, K.J. Friston, and R.J. Dolan. “Cooperation and heterogeneity of the autistic mind.” J. Neurosci. 30 (2010): 8815–8818. [Google Scholar] [CrossRef] [PubMed]
- A.J. Bruguier, S.R. Quartz, and P. Bossaerts. “Exploring the nature of “trader intuition”.” J. Finance 65 (2010): 1703–1723. [Google Scholar] [CrossRef]
- M. Sevgi, A.O. Diaconescu, M. Tittgemeyer, and L. Schilbach. “Social Bayes: Using Bayesian Modeling to Study Autistic Trait-Related Differences in Social Cognition.” Biol. Psychiatry 80 (2015): 2015–2016. [Google Scholar] [CrossRef] [PubMed]
- American Psychiatric Association. Diagnostic and Statistical Manual of Mental Disorders, 5th ed. (DSM-5); Washington, DC, USA: American Psychiatirc Association, 2013. [Google Scholar]
- A. Senju, V. Southgate, S. White, and U. Frith. “Mindblind eyes: An absence of spontaneous theory of mind in Asperger syndrome.” Science 325 (2009): 883–885. [Google Scholar] [CrossRef] [PubMed]
- R.L. Slonim. “Competing against experienced and inexperienced players.” Exp. Econ. 8 (2005): 55–75. [Google Scholar] [CrossRef]
- R.L. Buckner, and D.C. Carroll. “Self-projection and the brain.” Trends Cogn. Sci. 11 (2007): 49–57. [Google Scholar] [CrossRef] [PubMed]
- D. Schneider, V.P. Slaughter, A.P. Bayliss, and P.E. Dux. “A temporally sustained implicit theory of mind deficit in autism spectrum disorders.” Cognition 129 (2013): 410–417. [Google Scholar] [CrossRef] [PubMed]
- R.A. Hoekstra, M. Bartels, D.C. Cath, and D.I. Boomsma. “Factor structure, reliability and criterion validity of the autism-spectrum quotient (AQ): A study in Dutch population and patient groups.” J. Autism Dev. Disord. 38 (2008): 1555–1566. [Google Scholar] [CrossRef] [PubMed] [Green Version]
- M.G. Kocher, and M. Sutter. “Time is money—Time pressure, incentives, and the quality of decision-making.” J. Econ. Behav. Organ. 61 (2006): 375–392. [Google Scholar] [CrossRef]
- M.G. Kocher, and M. Sutter. “The decision maker matters: Individual versus group behaviour in experimental beauty-contest games.” Econ. J. 115 (2005): 200–223. [Google Scholar] [CrossRef]
- W.G. Jacoby. “Loess: A nonparametric, graphical tool for depicting relationships between variables.” Elect. Stud. 19 (2000): 577–613. [Google Scholar] [CrossRef]
- W.B.G. Liebrand, and C.G. McClintock. “The ring measure of social values: A computerized procedure for assessing individual differences in information processing and social value orientation.” Eur. J. Personal. 2 (1988): 217–230. [Google Scholar] [CrossRef]
- F. Van Dijk, J. Sonnemans, and F. Van Winden. “Social ties in a public good experiment.” J. Public Econ. 85 (2002): 275–299. [Google Scholar] [CrossRef]
- J. Leder, J.A. Häusser, and A. Mojzisch. “Stress and strategic decision-making in the beauty contest game.” Psychoneuroendocrinology 38 (2013): 1503–1511. [Google Scholar] [CrossRef] [PubMed]
- J. Leder, J.A. Häusser, and A. Mojzisch. “Exploring the underpinnings of impaired strategic decision-making under stress.” J. Econ. Psychol. 49 (2015): 133–140. [Google Scholar] [CrossRef]
- S. Champely. “pwr: Basic Functions for Power Analysis 2015.” Available online: https://cran.r-project.org/web/packages/pwr/ (accessed on 24 August 2016).
- 1Interestingly, the predictor gender was found to be a significant predictor of a lower distance to the target number in general, indicating that female participants, when having at least L = 1, pick numbers that are closer to the winning numbers than male participants. However, since the relationship of gender and strategizing was not the focus of the present paper, we refrain from discussing this finding further.

| Variable | 1 | 2 | 3 | 4 | 5 | 6 | 7 | 8 | 9 |
|---|---|---|---|---|---|---|---|---|---|
| Chosen Number (1) | 1.00 | ||||||||
| Math skill (2) | 0.06 | 1.00 | |||||||
| AQ score (3) | 0.04 | −0.24 *** | 1.00 | ||||||
| Social skill (4) | −0.10 | 0.13 * | −0.72 *** | 1.00 | |||||
| Attention switching (5) | 0.02 | 0.11 | −0.50 *** | 0.39 *** | 1.00 | ||||
| Attention to detail (6) | −0.02 | 0.14 * | −0.44 *** | 0.23 *** | 0.01 | 1.00 | |||
| Communication (7) | −0.07 | 0.11 | −0.61 *** | 0.37 *** | 0.26 *** | 0.04 | 1.00 | ||
| Imagination (8) | −0.11 | 0.17 ** | −0.51 *** | 0.33 *** | 0.10 | −0.07 | 0.42 *** | 1.00 | |
| Gender (1 = female) (9) | 0.09 | 0.20 *** | −0.16 ** | 0.00 | −0.06 | −0.09 | 0.05 | 0.45 *** | 1.00 |
| Predictor | Step | |||
|---|---|---|---|---|
| 1 | 2 | 3 | 4 | |
| AQ | −0.018 (0.026) | −0.022 (0.027) | −0.023 (0.026) | −0.026 (0.027) |
| Math | −0.101 (0.126) | −0.273 (0.315) | ||
| 1 if female | −0.395 (0.305) | −0.083 (0.129) | ||
| Constant | 1.625 *** (0.451) | 2.042 *** (0.674) | 1.933 *** (0.504) | 2.195 *** (0.693) |
| Observations | 137 | 132 | 134 | 129 |
| R2 | 0.003 | 0.008 | 0.016 | 0.015 |
| AQ | −0.241 * (0.138) | −0.241 * (0.138) | −0.25 * (0.138) | −0.25 * (0.14) |
| AQ2 | 0.006 * (0.004) | 0.006 (0.004) | 0.006 * (0.004) | 0.006 * (0.004) |
| Math | −0.106 (0.125) | −0.091 (0.128) | ||
| 1 if female | −0.348 (0.304) | −0.228 (0.314) | ||
| Constant | 3.499 *** (1.195) | 3.872 *** (1.317) | 3.773 *** (1.204) | 4.052 (1.326) |
| Observations | 136 | 131 | 133 | 128 |
| R2 | 0.024 | 0.028 | 0.037 | 0.035 |
| Social Skills | 0.346 (0.343) | 0.357 (0.348) | 0.355 (0.345) | 0.364 (0.351) |
| Math | −0.089 (0.124) | −0.07 (0.127) | ||
| 1 if female | −0.363 (0.303) | −0.244 (0.314) | ||
| Constant | 0.249 (1.084) | 0.527 (1.143) | 0.425 (1.1) | 0.58 (1.155) |
| Observations | 137 | 132 | 134 | 129 |
| R2 | 0.007 | 0.011 | 0.018 | 0.016 |
| Social Skills | −8.23 ** (4.103) | −8.547 ** (4.111) | −8.135 ** (4.121) | −8.584 ** (4.141) |
| Social Skills 2 | 1.416 ** (0.675) | 1.47 ** (0.677) | 1.402 ** (0.678) | 1.478 ** (0.681) |
| Math | −0.078 (0.122) | −0.063 (0.125) | ||
| 1 if female | −0.317 (0.3) | −0.194 (0.311) | ||
| Constant | 12.952 ** (6.151) | 13.679 ** (6.156) | 12.974 ** (6.167) | 13.78 ** (6.193) |
| Observations | 136 | 131 | 133 | 128 |
| R2 | 0.038 * | 0.045 | 0.045 * | 0.051 |
| Imagination | 0.791 ** (0.36) | 0.898 ** (0.366) | 1.081 *** (0.382) | 1.116 *** (0.387) |
| Math | −0.132 (0.127) | −0.1 (0.128) | ||
| 1 if female | −0.679 ** (0.324) | −0.553 * (0.333) | ||
| Constant | −1.168 (1.144) | −1.052 (1.168) | −1.699 (1.159) | −1.535 (1.198) |
| Observations | 134 | 129 | 131 | 126 |
| R2 | 0.035 ** | 0.048 ** | 0.066 *** | 0.069 ** |
| Attention to Detail | −0.227 (0.33) | −0.229 (0.334) | −0.238 (0.334) | −0.229 (0.34) |
| Math | −0.073 (0.124) | −0.051 (0.128) | ||
| 1 if female | −0.389 (0.306) | −0.277 (0.318) | ||
| Constant | 1.914 ** (0.861) | 2.177 ** (0.925) | 2.158 ** (0.907) | 2.257 ** (0.956) |
| Observations | 137 | 132 | 134 | 129 |
| R2 | 0.003 | 0.007 | 0.014 | 0.011 |
| Predictor | Step | |||
|---|---|---|---|---|
| 1 | 2 | 3 | 4 | |
| Autism Spectrum | −0.212 (0.205) | −0.232 (0.206) | −0.233 (0.209) | −0.238 (0.209) |
| Math | −1.291 (0.947) | −1.354 (0.964) | ||
| 1 if female | −0.768 (2.339) | 0.694 (2.323) | ||
| Constant | −13.01 (3.52) | −8.276 (5.16) | −12.218 (3.995) | −8.355 (5.347) |
| Observations | 185 | 178 | 182 | 175 |
| R2 | 0.006 | 0.0014 | 0.007 | 0.016 |
| Social Skills | 5.234 * (2.735) | 4.95 * (2.711) | 5.333 * (2.756) | 5.099 * (2.732) |
| Math | −1.247 (0.922) | −1.345 (0.945) | ||
| 1 if female | −0.313 (2.296) | 1.114 (2.292) | ||
| Constant | −32.873 *** (8.655) | −27.747 *** (8.725) | −32.986 *** (8.827) | −28.496 *** (8.82) |
| Observations | 185 | 178 | 182 | 175 |
| R2 | 0.019 * | 0.025 * | 0.02 | 0.028 |
| Imagination | 4.422 (2.711) | 4.598 * (2.682) | 5.604 * (3.031) | 4.842 (2.976) |
| Math | −1.405 (0.953) | −1.382 (0.967) | ||
| 1 if female | −2.298 (2.6) | −0.491 (2.571) | ||
| Constant | −30.707 *** (8.662) | −26.52 *** (8.606) | −33.149 *** (9.122) | −27.077 *** (9.143) |
| Observations | 181 | 174 | 178 | 171 |
| R2 | 0.014 | 0.025 | 0.019 | 0.025 |
| Attention to Detail | 1.584 (2.337) | 2.211 (2.301) | 1.777 (2.367) | 2.581 (2.334) |
| Math | −1.171 (0.931) | 1.289 (2.32) | ||
| 1 if female | −0.225 (2.325) | −1.296 (0.956) | ||
| Constant | −20.524 *** (6.116) | −18.146 *** (6.322) | −20.886 *** (6.434) | −19.398 *** (6.497) |
| Observations | 185 | 178 | 182 | 175 |
| R2 | 0.002 | 0.012 | 0.003 | 0.015 |
| Level-K | N | Mean Social Skill | SD |
|---|---|---|---|
| 1 | 42 | 3.09 | 0.45 |
| 2 | 26 | 3.20 | 0.39 |
| 3 | 14 | 3.40 | 0.28 |
| 4 | 16 | 3.05 | 0.58 |
| Predictor | Step | |||
|---|---|---|---|---|
| 1 | 2 | 3 | 4 | |
| Autism Spectrum | −0.137 (0.1) | −0.124 (0.104) | −0.14 (0.098) | −0.132 (0.102) |
| Math | 0.327 (0.487) | 0.162 (0.481) | ||
| 1 if female | 2.766 ** (1.154) | 2.863 ** (1.193) | ||
| Constant | −6.72 (1.696) | −7.939 (2.516) | −8.256 (1.777) | −8.94 (2.496) |
| Observations | 96 | 93 | 94 | 91 |
| R2 | 0.019 | 0.024 | 0.076 | 0.083 |
| Social Skills | 2.029 (1.326) | 1.977 (1.345) | 2.375 * (1.302) | 2.365 * (1.321) |
| Math | 0.391 (0.478) | 0.213 (0.471) | ||
| 1 if female | 2.973 ** (1.153) | 3.067 ** (1.191) | ||
| Constant | −15.324 (4.24) | −16.382 (4.469) | −18.117 (4.279) | −18.806 (4.459) |
| Observations | 96 | 93 | 94 | 91 |
| R2 | 0.024 | 0.031 | 0.09 ** | 0.10 ** |
| Imagination | 0.867 (1.539) | 0.697 (1.586) | −0.541 (1.581) | −0.637 (1.613) |
| Math | 0.427 (0.504) | 0.302 (0.49) | ||
| 1 if female | 3.375 *** (1.241) | 3.471 *** (1.269) | ||
| Constant | −11.819 (4.99) | −12.62 (5.099) | −9.241 (4.939) | −9.949 (5.042) |
| Observations | 93 | 90 | 91 | 88 |
| R2 | 0.003 | 0.012 | 0.08 ** | 0.09 ** |
| Attention to Detail | 2.252 * (1.272) | 2.099 (1.301) | 2.563 ** (1.247) | 2.435 * (1.275) |
| Math | 0.342 (0.479) | 0.161 (0.472) | ||
| 1 if female | 2.941 ** (1.145) | 3.015 ** (1.184) | ||
| Constant | −14.672 (3.313) | −15.353 (3.545) | −17.16 (3.365) | −17.386 (3.542) |
| Observations | 96 | 93 | 94 | 91 |
| R2 | 0.03 * | 0.04 | 0.10 ** | 0.10 ** |
| Subscale | Cronbach‘s-Alpha | Mean | SD | Range | Skew | Kurtosis |
|---|---|---|---|---|---|---|
| Social skill | 0.73 | 3.13 | 0.42 | 2.0 | −0.47 | −0.39 |
| Attention switching | 0.50 | 2.52 | 0.35 | 1.8 | 0.14 | −0.27 |
| Attention to detail | 0.69 | 2.57 | 0.49 | 2.5 | −0.15 | −0.32 |
| Communication | 0.44 | 3.06 | 0.34 | 2.1 | −0.62 | 1.03 |
| Imagination | 0.63 | 3.16 | 0.43 | 2.4 | −0.61 | 0.47 |
© 2016 by the authors; licensee MDPI, Basel, Switzerland. This article is an open access article distributed under the terms and conditions of the Creative Commons Attribution (CC-BY) license (http://creativecommons.org/licenses/by/4.0/).
Share and Cite
Leder, J.; Schilbach, L.; Mojzisch, A. Strategic Decision-Making and Social Skills: Integrating Behavioral Economics and Social Cognition Research. Int. J. Financial Stud. 2016, 4, 22. https://doi.org/10.3390/ijfs4040022
Leder J, Schilbach L, Mojzisch A. Strategic Decision-Making and Social Skills: Integrating Behavioral Economics and Social Cognition Research. International Journal of Financial Studies. 2016; 4(4):22. https://doi.org/10.3390/ijfs4040022
Chicago/Turabian StyleLeder, Johannes, Leonhard Schilbach, and Andreas Mojzisch. 2016. "Strategic Decision-Making and Social Skills: Integrating Behavioral Economics and Social Cognition Research" International Journal of Financial Studies 4, no. 4: 22. https://doi.org/10.3390/ijfs4040022
APA StyleLeder, J., Schilbach, L., & Mojzisch, A. (2016). Strategic Decision-Making and Social Skills: Integrating Behavioral Economics and Social Cognition Research. International Journal of Financial Studies, 4(4), 22. https://doi.org/10.3390/ijfs4040022