Article

Financial Regulatory Intensity and Corporate Liquidity Risk: Evidence from Chinese A-Share Listed Companies

School of Business Administration, Northeastern University, Shenyang 110819, China
*
Author to whom correspondence should be addressed.
Int. J. Financ. Stud. 2026, 14(8), 199; https://doi.org/10.3390/ijfs14080199
Submission received: 2 June 2026 / Revised: 27 July 2026 / Accepted: 30 July 2026 / Published: 1 August 2026
(This article belongs to the Special Issue Corporate Finance and Market Microstructure)

Abstract

Against the backdrop of escalating financial regulation in China, this study examines how regulatory enforcement intensity affects corporate liquidity risk among A-share listed non-financial firms over 2015–2024. We construct a composite regional regulatory intensity index (Enforce) integrating the frequency and monetary magnitude of administrative penalties issued by local securities regulators and employ firm- and year-fixed-effects panel regressions with the current ratio (CR) as the primary liquidity measure. We find that tighter regulatory enforcement significantly depresses the current ratio, consistent with a compliance-cost channel that constrains short-term debt-servicing capacity. Mediation analysis—conducted separately for each ESG sub-dimension and verified via bootstrap tests—reveals that the corporate governance dimension (G) generates a significant positive indirect effect (consistent partial mediation), the social responsibility dimension (S) generates a significant negative indirect effect (competing partial mediation), and the environmental dimension (E) yields no statistically significant indirect effect. Ownership-type heterogeneity tests confirm that non-state-owned enterprises (non-SOEs) are substantially more sensitive to regulatory tightening than state-owned enterprises (SOEs). Moderation analysis further shows that financial leverage plays a non-monotonic role: the regulation–liquidity effect is negative at low leverage levels and reverses to positive above an estimated threshold (Lev ≈ 0.56). Robustness is established through subsample regressions and a lagged-variable endogeneity test. These findings enrich the institutional finance literature and provide evidence-based guidance for differentiated regulatory policymaking.

1. Introduction

Financial regulation has undergone a fundamental transformation in China over the past decade. The traditional model centred on ex post inspection has evolved into a closed-loop system encompassing ex ante warning mechanisms, real-time monitoring, and post-event enforcement. Administrative penalty cases and associated fine amounts have risen markedly, capital constraints have tightened, and risk-management requirements have grown considerably more granular. Recent scholarship documents this regulatory transformation in detail (Xu et al., 2025; Zhao et al., 2024), while administrative penalty data confirm the marked escalation in enforcement actions (W. Chen et al., 2025). Regional securities regulators now engage in forward-looking interventions targeting emerging risks in cross-sector integration, fintech innovation, and inter-regional contagion (Qin et al., 2023).
Regulatory changes at the regional or national level profoundly affect corporate strategy and risk management. Stricter enforcement can improve market transparency by elevating disclosure standards (Jackson & Roe, 2009) but simultaneously imposes compliance costs (Kitching et al., 2015). In an environment of heightened uncertainty and tighter financing, firms face intensifying liquidity pressures (Kang, 2018) and must continually reassess and adjust their financial strategies.
Liquidity risk is a core dimension of corporate financial risk, reflecting both short-term debt-servicing capacity and the sustainability of operations and creditworthiness (Che, 2009). When the external financing environment deteriorates or internal cash flows become volatile, firms without adequate liquidity buffers are prone to financial distress (Wan & Gu, 2011). Examining how regulatory policy changes affect corporate liquidity risk therefore carries significant theoretical and practical importance, particularly as Chinese financial regulation continues to tighten.
Concurrently, the growing prominence of environmental, social, and governance (ESG) criteria as a framework for evaluating corporate compliance and sustainable development capacity (Huang, 2021) introduces an additional layer of complexity. Under intensifying regulatory pressure, firms adapt through environmental improvements, stronger social responsibility practices, and governance reforms. Because state-owned enterprises (SOEs) and non-state-owned enterprises (non-SOEs) differ substantially in resource access and policy responsiveness, ownership structure is likely to moderate firms’ responses to regulatory pressure. Capital structure further shapes liquidity risk and the strategies firms employ to manage it.
This study addresses three specific gaps in the present literature. First, the regulation–liquidity nexus has been mainly investigated in the context of financial institutions (Zhang & Dai, 2025; Zhou & Yao, 2025; Can & Bocuoglu, 2022), and there is little evidence on the effect of regulatory tightening on the liquidity positions of non-financial listed firms. Second, although the ESG performance has been identified as a channel through which institutional pressures influence corporate outcomes (S. Chen et al., 2023; Y. Liu & Geng, 2026), the mediating effect of individual ESG sub-dimensions (environmental, social, and governance) on the regulation–liquidity channel has not been systematically explored with rigorous bootstrap-based mediation tests. Third, the role of financial leverage in moderating the sensitivity of firms to external shocks is well documented (Lin et al., 2025; Valenzuela, 2016), but its role in conditioning the regulation–liquidity relationship has not been explored yet. We address these gaps by combining mediation through ESG sub-dimensions, ownership heterogeneity, and moderation through leverage in one empirical framework.
We contribute to the literature in four ways. First, existing regulation-corporate outcome studies rely heavily on single-dimensional enforcement proxies (e.g., penalty count or regulatory distance). We construct a composite multi-dimensional regulatory intensity index that integrates both the frequency and monetary severity of administrative penalties. Second, while previous literature on regulatory effects focuses heavily on financial institutions (Zhou & Yao, 2025; Can & Bocuoglu, 2022), we offer systematic micro-level evidence for listed non-financial firms, thereby filling an important empirical gap. Third, we dissect ESG into granular sub-dimensions and formally test their mediating roles with 5000-replication bootstrap tests. We show that different ESG dimensions operate through heterogeneous channels that are masked in aggregate ESG scores. Fourth, we present evidence of a non-monotonic moderating role for financial leverage and identify a critical threshold where the regulation–liquidity effect changes its sign. This result has direct implications for the design of differentiated regulatory policy across firms with different capital structures.
The remainder of this paper is organised as follows. Section 2 reviews the theoretical foundations and prior literature. Section 3 develops the research hypotheses. Section 4 describes the research design. Section 5 presents the empirical results. Section 6 concludes.

2. Theoretical Foundations and Literature Review

2.1. Theoretical Foundations

2.1.1. Information Asymmetry Theory

The theory of information asymmetry posits that the parties to a transaction are normally not equally informed, with the seller being better informed than the buyer (Akerlof, 1970). Asymmetric information causes adverse selection and moral hazard, which lead to a decrease in the allocative efficiency and may cause market failure. Governments mitigate these effects by increasing disclosure requirements, tightening market supervision and increasing the costs of violation (Xu et al., 2025). But higher regulation also increases compliance costs—such as spending more on internal controls, disclosure systems and compliance programmes—which reduces operating cash flow and magnifies short-term liquidity risk. The latter mechanism provides the theoretical basis of the regulation–liquidity transmission channel studied in this paper.

2.1.2. Institutional Theory

DiMaggio and Powell (1983) identify three types of institutional pressure: coercive pressure (mandatory requirements from government regulations and regulators), mimetic pressure (imitation of industry exemplars under environmental uncertainty), and normative pressure (shaped by professional ethics and social values). Firms seek legitimacy within institutional environments, and under tightening regulation, ESG performance becomes a key signal of institutional conformity. Institutional theory thus explains both why firms invest in ESG under regulatory pressure and how such investment shapes financial outcomes.

2.1.3. The ESG Framework and Information Asymmetry

ESG is generally a measure of how well a company performs on environmental, social and governance issues. It has been widely used by investors, regulators and other stakeholders in recent years to judge whether a firm is operating in a sustainable and responsible manner (World Bank, 2004; Huang, 2021). In this sense, ESG is not an economic theory in itself. It is better considered as a framework for the disclosure and assessment of non-financial information. The more transparent information a firm provides about ESG-related issues, the more outside stakeholders can understand its operations and risks. This reduces the information asymmetry and may also reduce the costs of financing and reputation risks (Yang, 2024; Lu & Zhang, 2021).

2.1.4. Capital Structure Theory

The capital structure theory examines the effect of debt–equity ratio on the value and risk of the firm. Modigliani and Miller (1958) in their theorem showed that under perfect markets firm value does not depend on financing choice. Later theories offered alternative frameworks. The trade-off theory (Modigliani & Miller, 1963) compares the tax advantages of debt with the costs of financial distress. The pecking-order theory (Myers & Majluf, 1984) provides a hierarchy of financing choice based on information asymmetry. Agency theory explains how debt could discipline the over-investment of managers. These frameworks, all of which are consistent with the moderation hypothesis, predict that leverage moderates the impact of external regulatory shocks on firms.

2.2. Literature Review

2.2.1. Financial Regulation and Corporate Liquidity

The existing Chinese literature suggests a complex regulatory effect. Regulation can, on the one hand, constrain excessive leverage and lower short-term debt burdens, but it can also increase financing costs and limit firms’ access to capital markets (Kang, 2018). W. Chen et al. (2025) use the 2018 asset management regulations as a natural experiment and show that stricter enforcement makes firms reallocate resources toward their core operations and innovation. However, liquidity constraints undermine the productivity and innovative capacity, especially for private firms (Xiang & Wei, 2014). International studies provide generally consistent evidence with these findings. Qin et al. (2023) show that tighter regulation in China improves liquidity management and reduces corporate bankruptcy risk under a difference-in-differences framework. Using international corporate bond data, Valenzuela (2016) also finds that transparency-oriented regulation reduces corporate liquidity risk. Likewise, Zhang and Dai (2025) find that prudential regulation helps small and medium banks to reduce non-performing loan ratios and interbank liabilities. The literature identifies both a transparency-enhancing channel (reducing information asymmetry and improving market discipline) and a compliance-cost channel (imposing fixed and variable costs that consume working capital), with the net direction of the regulation–liquidity effect depending on which channel dominates in a given institutional setting (Jackson & Roe, 2009; Kitching et al., 2015). Recent evidence from China’s 2018 asset management regulation reform further demonstrates that strengthened enforcement redirects corporate resources toward core activities and innovation investment (W. Chen et al., 2025), though the impact on short-term liquidity positions remains understudied.

2.2.2. ESG, Governance, and Financial Outcomes

ESG performance has been positively linked to improved financing conditions, lower risk exposure, and greater financial stability (Z. Liu & Li, 2025; Y. Liu & Geng, 2026; S. Chen et al., 2023). Studies disaggregating ESG by sub-dimension consistently find that the governance (G) dimension has the most direct effect on financial outcomes through improved resource allocation and risk management (Xie & Liu, 2016), while environmental (E) and social (S) dimensions operate through more indirect pathways with potentially short-run liquidity costs (Meng et al., 2023; Lu & Zhang, 2021). Under institutional theory, coercive regulatory pressure drives firms to invest in ESG to obtain legitimacy (DiMaggio & Powell, 1983). Recent meta-analytic evidence broadly supports a positive ESG–financial performance link, but the effects are highly heterogeneous across dimensions, time horizons, and institutional contexts (S. Chen et al., 2023). Governance (G) improvements tend to produce the most immediate financial benefits through enhanced monitoring and reduced agency costs, whereas environmental (E) and social (S) investments often impose short-run costs before generating long-run returns (Meng et al., 2023; Lu & Zhang, 2021).

2.2.3. Gaps in the Existing Literature

Three main gaps motivate the present study. First, existing studies predominantly examine financial institutions rather than non-financial listed companies. Second, ESG mediation in a regulation–liquidity context has not been disaggregated by sub-dimension with rigorous bootstrap verification, preventing identification of which ESG channel enhances versus constrains liquidity. Third, the moderating role of leverage in the regulation–liquidity relationship has not been formally examined. This study addresses all three gaps simultaneously within a unified empirical framework.

2.3. Theoretical Integration

The theoretical architecture linking the four building blocks of this study is summarized in Figure 1. Institutional theory (DiMaggio & Powell, 1983) suggests that isomorphic pressure from regulatory enforcement forces firms to invest in compliance, which depletes working capital. This channel is operationalized through the ESG framework: regulation pressure leads to better environmental practices (requiring short-term expenditure), social responsibility (straining working capital by increasing stakeholder obligations) and governance (improving internal controls, which in turn leads to better working-capital efficiency). The information asymmetry theory (Akerlof, 1970; Myers & Majluf, 1984) explains the different direction of mediation for ESG dimensions. Governance improvements reduce information asymmetry and thus improve liquidity, while the environmental and social investments may signal compliance, but they consume resources in the short run. Finally, capital structure theory (Modigliani & Miller, 1958, 1963) predicts that leverage conditions firms’ sensitivity to regulatory shocks; low leverage firms may underestimate compliance-driven liquidity risk, while high leverage firms respond with stronger defensive behaviour.

3. Theoretical Framework and Hypotheses

3.1. Financial Regulatory Intensity and Current Ratio

Drawing on information asymmetry theory, we identify two competing channels: (1) a transparency channel—stronger enforcement reduces information asymmetry, lowers investor risk, and eases financing conditions; and (2) a compliance-cost channel—higher regulatory standards raise compliance expenditure, consuming working capital and depressing the current ratio (Kitching et al., 2015). Because compliance expenditures are incurred regardless of whether capital market conditions improve, the compliance-cost effect is likely to dominate in the short run:
Hypothesis 1 (H1).
Financial regulatory intensity has a significant negative effect on the corporate current ratio.

3.2. ESG Performance as a Mediating Channel

What could make ESG performance a theoretically necessary rather than incidental channel through which regulatory enforcement matters for liquidity? Regulatory enforcement does not operate on liquidity in a vacuum but reconfigures the information environment, stakeholder relationships, and internal governance arrangements that collectively determine a firm’s access to short-term financing and working-capital position. ESG performance as a multi-dimensional disclosure architecture captures exactly these three domains. According to institutional theory (DiMaggio & Powell, 1983), regulatory pressure is a coercive isomorphic force that forces firms to alter their structures and disclosures to comply with the existing regulatory expectations. Since corporate liquidity is under the same stakeholder and information mechanisms as the signals of ESG performance, the regulation–liquidity association is theoretically incomplete without identifying the channels through which ESG performance conveys the regulatory pressure into liquidity outcomes. Rather than treating ESG as a single aggregate construct, we therefore develop three conceptually distinct mediation pathways, each grounded in a different theoretical tradition.

3.2.1. Environmental Responsibility (E)

Environmental responsibility intervenes in the regulation–liquidity relationship through two conflicting channels based on environmental economics. Based on the cash-flow pressure theory of environmental regulation (Meng et al., 2023), the compliance-cost mechanism suggests that stricter enforcement forces firms to internalise the costs of environmental externalities (e.g., pollution abatement investment, remediation expenditure, and regulatory penalties) that were previously externalised, which constrains short-term liquidity. The innovation-offset hypothesis of Porter and van der Linde (1995) argues, on the other hand, that regulation stimulates process innovation that reduces waste of resources and operating costs in the long run and thus improves financial soundness. The net liquidity effect of environmental enforcement thus depends on the relative strength of these two forces, which the data must adjudicate rather than the theory presuppose:
Hypothesis 2a (H2a).
Environmental responsibility (E) mediates the relationship between financial regulatory intensity and the corporate current ratio.

3.2.2. Social Responsibility (S)

Social dimension is implemented through the mechanisms of stakeholder trust and reputation capital as articulated in stakeholder theory (Freeman, 1984). Firm–stakeholder relationships gain importance under regulatory enforcement: firms with more intense regulatory oversight incur higher reputational costs for social misconduct and enjoy larger benefits for concrete social responsibility. Better social performance reduces information asymmetry between the firm and stakeholders, e.g., employees, suppliers, customers, and communities, and reduces the risk premia demanded in trade credit, labour, and product markets (Lu & Zhang, 2021), thereby alleviating short-term financing constraints and improving liquidity. However, social responsibility investment eats into working capital, creating an offsetting cash-flow drain. The sign of the social mediation channel is thus theoretically indeterminate:
Hypothesis 2b (H2b).
Social responsibility (S) mediates the relationship between financial regulatory intensity and the corporate current ratio.

3.2.3. Corporate Governance (G)

The dimension of governance is based on agency theory (Jensen & Meckling, 1976). Regulatory enforcement reduces managerial discretion by increasing the likelihood and cost of detected self-dealing by tightening board oversight and by enhancing internal control systems. These governance improvements reduce agency costs in two liquidity-relevant ways. First, they reduce value-destroying working-capital decisions such as excess inventory build-up, slow receivable collection, and empire-building cash retention. Second, they improve the credibility of financial disclosure and thus reduce external financing frictions. Agency-cost reduction directly increases free cash flow available to service short-term obligations, so the governance channel is theoretically the most likely to transmit regulatory pressure to improved liquidity (Xie & Liu, 2016):
Hypothesis 2c (H2c).
Corporate governance quality (G) mediates the relationship between financial regulatory intensity and the corporate current ratio.

3.3. The Moderating Role of Financial Leverage

According to capital structure theory, leverage is a structural determinant of the transmission of regulatory shocks to liquidity. According to the trade-off theory of capital structure (Kraus & Litzenberger, 1973), leverage is the firm’s equilibrium balance between the tax advantages of debt and the expected costs of financial distress. Regulatory enforcement shifts this equilibrium. Low-leverage firms face low marginal costs of additional compliance-induced liquidity compression, so enforcement mainly erodes working-capital buffers. High-leverage firms, already facing high expected distress costs of any further liquidity deterioration, respond to enforcement with stronger precautionary liquidity management—defensive cash retention, faster receivable collection, and less discretionary working-capital investment. Thus, leverage conditions not only the size but also possibly the sign of the regulation–liquidity response, making it a theoretically necessary moderator rather than an empirical add-on:
Hypothesis 3 (H3).
Financial leverage moderates the relationship between financial regulatory intensity and the corporate current ratio.

4. Research Design

4.1. Sample and Data

The sample comprises all A-share listed non-financial companies incorporated in mainland China over 2015–2024. Financial data and firm characteristics are obtained from the Wind database. ESG performance scores are drawn from the China Securities Index ESG Rating System (Huazheng ESG), which assigns standardised scores across three sub-dimensions—environmental (E), social (S), and governance (G)—on a nine-tier scale (AAA to CCC, corresponding to 0–100 points). All continuous variables are winsorized at the 1st and 99th percentiles; observations with missing rates below 5% for any variable are deleted listwise. The resulting sample comprises 36,478 firm-year observations for core financial variables and 35,187 observations for ESG-related specifications. The sample period begins in 2015 for two institutional reasons. First, 2015 marked the initiation of China’s Securities Law revision process and the launch of registration-based IPO reform pilots, representing a structural shift in the regulatory regime. Second, the China Securities Regulatory Commission substantially expanded its regional enforcement capacity from 2015 onward, making province-level variation in enforcement intensity more empirically tractable. The period ends in 2024, the latest year for which complete financial and ESG data are available.

4.2. Variables

4.2.1. Dependent Variable: Current Ratio (CR)

The current ratio (current assets/current liabilities) measures short-term debt-servicing capacity; a higher ratio indicates lower liquidity risk. This measure is widely used in the corporate liquidity literature (Opler et al., 1999). We acknowledge that the current ratio is an imperfect proxy for liquidity risk. A high CR may reflect genuinely strong short-term solvency, but it may also signal inefficient working-capital management—excess inventory accumulation, slow receivable collection, or idle cash holdings (Xiang & Wei, 2014). To address this ambiguity, we subject our results to a battery of alternative liquidity measures in Section 5.4, including the quick ratio and cash holding ratio, which collectively provide a more complete picture of corporate liquidity positions.
Other Measures of Liquidity. (i) Quick ratio (QR) = (current assets − inventories)/current liabilities, which excludes slow moving inventory from the liquidity buffer; (ii) cash holding ratio (CHR) = (cash and cash equivalents/total assets) × 100 (%), which reflects the availability of liquid assets. We construct two complementary proxies: these alternatives are used in the robustness tests presented in Section 5.4.

4.2.2. Independent Variable: Financial Regulatory Intensity (Enforce)

We construct a regional regulatory intensity index integrating two enforcement dimensions: (1) a frequency indicator ( X 1 )—the number of administrative penalty events issued by the local securities regulator in province l during year j as a proportion of listed companies in that province; and (2) a magnitude indicator ( X 2 )—total fine amounts as a proportion of aggregate listed-company market capitalisation in province l during year j. Both are standardised via z-score normalisation and combined as follows:
E n f o r c e S t r e n g t h l , j = 0.5 × Z ( X 1 ( L , j ) ) + 0.5 × Z ( X 2 ( L , j ) )
This index is matched to the firm level by weighting by log total assets:
The size weighting is theoretically motivated and conceptually needed. The unweighted provincial index (EnforceStrength) only measures the regional enforcement climate, a province-year characteristic that does not vary at the firm level, whereas our research question is about the firm-specific regulatory burden that affects a given firm’s liquidity. Larger firms face more regulation; they operate in more lines of business, have larger asset bases subject to oversight, and incur larger absolute compliance costs (Kitching et al., 2015). Therefore, weighting the regional intensity by log total assets transforms a regional climate measure into a firm-specific regulatory burden measure that is heterogeneous across both provinces and firms within a province, consistent with the firm-level research unit of the liquidity outcome. The unweighted index, which has no within-firm variation, cannot play this role; it was added in the first revision at the request of Reviewer 3 as a baseline robustness check (Section 5.4.3) to ensure that the negative association is not an artefact of the weighting procedure. The unweighted index is not conceptually appropriate for the mediation and moderation analyses, since those specifications are testing firm-level transmission channels that require firm-level variation in the independent variable. Instead, the weighted Enforce is the appropriate primary regressor for all specifications.
To make sure the results are not driven by the size weighting in our composite index, we re-estimate the baseline model by using the unweighted provincial EnforceStrength. The coefficient on EnforceStrength stays negative and significant, as shown in the unweighted robustness check (Section 5.4.3). The larger magnitude of the coefficient is due to the different scaling of the unweighted measure, which does not include a firm-level asset.

4.2.3. Mediating Variables: ESG Sub-Dimensions (E, S, G)

We use the three CSI ESG sub-dimension scores as mediating variables: environmental responsibility (E), capturing pollution control, resource utilisation, and environmental management; social responsibility (S), covering employee rights, supply chain management, and community welfare; and corporate governance (G), reflecting ownership structure, board governance, internal controls, and information disclosure quality. All scores are standardised before entering regressions.

4.2.4. Moderating Variable: Financial Leverage (Lev)

Financial leverage is measured as the debt-to-assets ratio (total liabilities/total assets) × 100 (%), a standard proxy for capital structure and financial distress risk exposure.

4.2.5. Control Variables

We include the following control variables: return on assets (ROA); equity multiplier (EM); current asset ratio (CAR, current assets/total assets) × 100 (%); and cash ratio (CLR, cash and equivalents/current liabilities) × 100 (%). All controls are winsorized and included in all specifications.

4.3. Econometric Models

4.3.1. Baseline Fixed-Effects Model

CR(it) = α + β Enforce(it) + γ Controls(it) + μ_i + λ_t + ε(it)
Here, μi and λt denote firm and year fixed effects. Standard errors are clustered at the firm level.

4.3.2. Mediation Models

We estimate mediation effects using the Baron and Kenny (1986) two-stage approach supplemented by bootstrap tests (5000 replications). For each ESG sub-dimension, the first stage regresses the sub-dimension score on Enforce and the controls; the second stage regresses CR on Enforce, the sub-dimension score, and controls. The indirect effect’s significance is assessed by whether the bootstrap 95% confidence interval excludes zero.
As a robustness check against possible omitted variable bias due to correlated ESG sub-dimensions, we estimate a parallel multiple mediation model in which all three sub-dimensions (E, S, G) enter the same structural equation system. The results are presented in the parallel mediation table (see Section 5.6.4). The indirect effect through G is still positive and significant, confirming that the main liquidity-enhancing channel is the improvement of governance after controlling for environmental and social performance. The indirect effect through S is attenuated, whereas the E channel is indistinguishable from zero. These results show that the G-channel is robust to simultaneous estimation, while the E- and S-channels are significantly attenuated when the shared variance with G is accounted for.

4.3.3. Moderation Model

CR(it) = α + η1 Enforce(it) + η2 Lev(it) + η3 (Enforce × Lev)(it) + γ Controls(it) + μ_i + λ_t + ε(it)
The marginal effect of regulatory intensity on CR is ME(it) = η1 + η3 × Lev(it), which varies continuously with leverage.

5. Empirical Results

5.1. Descriptive Statistics

Table 1 presents descriptive statistics. The mean CR is 2.706 (SD = 3.281), indicating substantial cross-sectional heterogeneity. Enforce has a mean of 0.914 and SD of 6.696 (range: −15.659 to 18.863), confirming large temporal and cross-regional variation. All ESG sub-dimension z-scores have zero mean and unit variance by construction. Mean leverage (Lev) is 41.4 (SD = 20.7), expressed in percentage form.

5.2. Correlation Analysis

Table 2 presents the Pearson correlation matrix. CR and Enforce are negatively correlated (ρ = −0.038, p < 0.05), providing preliminary support for H1. CR is positively correlated with ROA (ρ = 0.166, p < 0.01) and CAR (ρ = 0.388, p < 0.01) and negatively correlated with EM (ρ = −0.279, p < 0.01). No pairwise correlation exceeds 0.8, indicating the absence of severe multicollinearity.

5.3. Baseline Regression Results

Table 3 reports the fixed-effects results. In column (1), without controls, the coefficient on Enforce is −0.0115 (p < 0.01). In column (2), with the full set of controls, the coefficient remains negative and highly significant (−0.00750, p < 0.01), providing strong support for H1. Among the control variables, ROA enters positively (p < 0.01), EM negatively (p < 0.01), CAR positively (p < 0.01), and CLR negatively (p < 0.01), all consistent with the prior literature.

5.4. Robustness Tests

5.4.1. Subsample Regressions

To assess sensitivity to macroeconomic cycles, Table 4 splits the sample into 2015–2019 and 2020–2024 sub-periods. The coefficient on Enforce is negative and significant at 1% in both sub-periods (−0.00860 and −0.00553, respectively), demonstrating that the baseline result is not an artefact of any particular economic episode.

5.4.2. Endogeneity Analysis

To address potential reverse causality, Table 5 replaces contemporaneous Enforce with its one-period lag (L.1 Enforce). The lagged variable retains a negative and statistically significant coefficient in both specifications (−0.00721 and −0.00449, p < 0.01), confirming that the documented negative effect is not driven by reverse causality.

5.4.3. Alternative Regulatory Intensity Measure

To ensure the results are not driven by the size weighting in our composite index, we re-estimate the baseline model using the unweighted provincial EnforceStrength. As shown in Table 6, the coefficient remains negative and significant, confirming that the core finding is not an artefact of the size-weighting procedure.

5.4.4. Alternative Liquidity Measures

To ensure our findings are not specific to the current ratio, we re-estimate the baseline model using two alternative liquidity measures, quick ratio (QR) and cash holding ratio (CHR), as defined in Section 4.2.1. As shown in Table 7, the negative effect of Enforce persists across both alternative measures. This consistency supports the interpretation that regulatory tightening genuinely impairs corporate liquidity rather than reflecting measurement artefacts specific to the current ratio.

5.5. Heterogeneity Analysis: Ownership Type

Table 8 compares the results for the SOE and non-SOE subsamples. For SOEs, the coefficient on Enforce is −0.00316 (p < 0.05); for non-SOEs, it is −0.00984 (p < 0.01). The much larger negative effect for non-SOEs indicates that the short-term debt-servicing capacity of private enterprises is much more constrained by the regulatory tightening than that of state-owned enterprises. State-owned enterprises benefit from preferential access to credit and implicit government guarantees that make them immune to regulatory shocks, while non-SOEs are more credit rationed and thus more exposed.

5.6. Mediation Analysis: ESG Sub-Dimensions

In all three first-stage regressions, Enforce significantly and positively predicts ESG performance (E: 0.00996; S: 0.00580; G: 0.00190, all p < 0.01), confirming that regulatory pressure promotes ESG investment across all three dimensions. The second-stage results and bootstrap indirect effects differ markedly by dimension. Table 9 summarizes the Bootstrap indirect and direct effects.

5.6.1. Environmental Dimension (E)

As shown in Table 10, Enforce significantly increases z_E (0.00996, p < 0.01), and higher z_E is negatively correlated with CR (−0.0788, p < 0.01). Bootstrap testing gives a 95% CI for the indirect effect of [−0.0006, 0.0002], which includes 0 (p = 0.340). The indirect effect through E is not statistically significant; therefore, H2a is not supported. This is probably a reflection of the short-run cash-flow burden of environmental investment, without the long-term penalty-reduction benefits being yet realised.

5.6.2. Social Responsibility Dimension (S)

As shown in Table 11, Enforce increases z_S (0.00580, p < 0.01). z_S is negatively correlated with CR (−0.118, p < 0.01). The bootstrap test shows that the indirect effect is −0.00031 with a 95% CI of [−0.00055, −0.00003], which does not contain zero (p = 0.058). The direct effect was negative (−0.00384; 95% CI [−0.00674, −0.00094]). Both the indirect and direct effects are negative, indicating a consistent partial mediation: regulatory enforcement compresses the current ratio both directly and through the social responsibility channel. H2b is supported. Stronger enforcement raises social responsibility expenditure, which consumes short-run working capital; the direct compliance-cost channel further depresses liquidity.

5.6.3. Corporate Governance Dimension (G)

Table 12 shows that Enforce increases z_G (0.00190, p < 0.01), and z_G is positively related to CR (+0.149, p < 0.01). The bootstrap test yielded an indirect effect of 0.00042 and a 95% CI of [0.00015, 0.00075], which did not include zero (p = 0.015). The direct effect was negative (−0.00445; 95% CI [−0.00733, −0.00157]). The indirect effect is positive, whereas the direct effect is negative, indicating a competing partial mediation: although governance improvement transmits a liquidity-enhancing effect, the direct compliance burden of enforcement dominates. H2c is supported. Enforcement pressure improves the quality of governance, which strengthens internal controls, reduces agency costs and improves the management of working capital, thus partially offsetting the direct liquidity-compressing effect of regulation.

5.6.4. Parallel Multiple Mediation Analysis

To mitigate the possible omitted variable bias due to the correlation among ESG sub-dimensions, we estimate a parallel multiple mediation model where all three sub-dimensions (E, S, G) are included in the same structural equation system (see Section 4.3.2 for model specification) as a robustness check. Table 13 presents the results. The preliminary results suggest that the governance (G) channel is still the strongest mediator, while the environmental (E) channel becomes even more indistinguishable from zero when we control for the other two dimensions simultaneously.

5.7. Moderation Results: Financial Leverage

The moderation results are presented in Table 14. The coefficient on the interaction term Enforce × Lev is +0.0435 (p < 0.01), which supports H3. The marginal effect of Enforce on CR is ME = −0.0242 + 0.0435 × Lev. This means the leverage threshold is at Lev = 0.0242/0.0435 ≈ 0.56. When the threshold is lower, regulatory tightening reduces liquidity (compliance-cost channel dominant); when the threshold is higher, the effect is reversed—tighter enforcement constrains excessive risk taking and triggers stronger defensive liquidity-building behaviour for high-leverage firms. The marginal effect at the threshold is close to zero and statistically not significant. These results suggest that the regulation–liquidity nexus is fundamentally non-monotonic in leverage.

6. Discussion

In this section, we interpret our empirical results in the context of existing theory and evidence, rather than simply repeat coefficients. We organise our discussion around four themes: the regulation-induced liquidity compression mechanism; heterogeneous ESG mediation channels; the leverage threshold at which regulation becomes protective; and ownership-based differences in regulatory sensitivity.

6.1. Liquidity Compression: Regulation-Induced Transparency Gain vs. Compliance Cost

Our baseline finding that stricter enforcement of regulation substantially decreases the corporate current ratio aligns with the transparency channel being primarily driven by the compliance-cost channel in the Chinese institutional context. This result is in line with Qin et al. (2023), who find that stricter regulation raises corporate compliance burden in China, and with Jackson and Roe (2009) who argue that the net effect of public enforcement is crucially dependent on the institutional environment. In the changing regulatory environment in China, where the enforcement capacity has grown rapidly since 2015, the short-term compliance costs appear to counteract any easing of financing conditions brought about by transparency. The negative effect is substantially larger for non-SOEs (coefficient = −0.00984) than for SOEs (coefficient = −0.00316), which is consistent with the view that state-owned enterprises have implicit government guarantees and preferential access to credit, shielding them from regulatory liquidity shocks (see Section 6.4 for a detailed discussion).

6.2. Ownership Heterogeneity: The SOE Buffer

The ownership heterogeneity findings reveal a large gap in regulatory sensitivity: non-SOEs are approximately three times more affected than SOEs. This pattern is in line with the well-known financing advantages of state-owned enterprises in China, such as preferential bank lending terms, lower collateral requirements and implicit government guarantees (W. Chen et al., 2025). These institutional buffers help protect SOEs from the pressures of compliance costs to which private enterprises are more vulnerable owing to greater credit rationing and higher financing costs. This suggests that the imposition of uniform regulatory timetables may have the unintended effect of exacerbating competitive imbalances between the state and the private sector.

6.3. Heterogeneous Mediation of ESG: Why Governance Matters More

The heterogeneity of mediation patterns across the ESG sub-dimensions has important theoretical implications. The governance (G) dimension has a positive indirect effect, which is a consistent partial mediation. Regulatory pressure boosts the quality of governance, which in turn improves internal controls, reduces agency costs and enhances working-capital efficiency. By contrast, the social (S) dimension offers a competing partial mediation, suggesting that social responsibility investments use up short-term working capital but generate long-run stakeholder trust. The environmental (E) dimension does not produce any statistically significant indirect effect probably because the payback period of environmental investments exceeds our observation window. These dimension-specific results supplement prior research using aggregate ESG scores by highlighting that the governance channel is the main liquidity-enhancing ESG mechanism.

6.4. The Leverage Threshold: When Regulation Turns Protective

One particularly policy-relevant result is the non-monotonic moderating effect of financial leverage. At low levels of leverage, tighter enforcement reduces liquidity, as low-leverage firms underestimate compliance-driven risk and hold low liquidity buffers. However, beyond the estimated threshold, the sign of the marginal effect flips: for highly leveraged firms, regulatory pressure appears to limit risky behaviour and induce defensive liquidity accumulation. This pattern is consistent with Lin et al. (2025), who show that leverage increases sensitivity to external shocks of firms. The policy implication is clear: uniform regulatory tightening may prove counterproductive for low-leverage firms already under acute liquidity pressure, while it could be beneficial for high-leverage firms through inducing more prudent financial management.

7. Conclusions

The study findings have three specific implications for policy and management. First, the strong ownership-type heterogeneity documented above suggests that uniform regulatory timetables might impose disproportionate burdens on private enterprises. We recommend graduated compliance schedules with longer adjustment periods for non-SOEs. Second, the non-monotonic leverage moderation we observed in our threshold analysis suggests that regulators calibrate enforcement intensity to firms’ capital structure profiles—tightening may backfire for low-leverage firms that are already experiencing acute liquidity pressures. Third, the governance-mediated liquidity improvement identified in our mediation analysis suggests that regulatory frameworks that provide incentives for governance reforms create liquidity co-benefits that partially offset compliance costs. For corporate managers, this means that governance investments under regulatory pressures should take precedence over environmental or social spending as a liquidity management strategy.
There are some caveats to note. The regulatory intensity index is constructed at the regional level, which may not be representative of the firm’s experiences with enforcement. Although we use lagged-variable specifications, residual endogeneity cannot be ruled out without a fully exogenous instrument. Future work could leverage specific regulatory shocks (e.g., the 2018 asset management regulation) for cleaner causal identification. The sample is limited to the firms listed in A-share. Additional analysis on non-listed firms, and in cross-country settings, is needed to test the generalizability of our results. As a robustness check, we also construct two alternative measures of liquidity. Future research could extend our analysis by incorporating cash-flow volatility or bankruptcy-risk measures as alternative dimensions of liquidity risk not fully captured by balance-sheet ratios. Finally, our ESG data are from one rating agency (Huazheng). Cross-validation with alternative ESG providers would add confidence to the mediation findings.


Author Contributions

Software, J.L.; writing—original draft, J.L.; writing—review and editing, G.L. and J.L.; visualization, G.L.; supervision, G.L.; project administration, G.L.; funding acquisition, G.L. All authors have read and agreed to the published version of the manuscript.

Funding

This research received no external funding.

Institutional Review Board Statement

Not applicable.

Informed Consent Statement

Not applicable.

Data Availability Statement

Financial data are available from the Wind database. ESG scores are available from China Securities Index Co., Ltd., Shanghai, China (Huazheng ESG). Data are available upon reasonable request to the corresponding author.

Conflicts of Interest

The authors declare no conflicts of interest.

References

  1. Akerlof, G. A. (1970). The market for “lemons”: Quality uncertainty and the market mechanism. Quarterly Journal of Economics, 84, 488–500. [Google Scholar] [CrossRef]
  2. Baron, R. M., & Kenny, D. A. (1986). The moderator–mediator variable distinction in social psychological research. Journal of Personality and Social Psychology, 51, 1173–1182. [Google Scholar] [CrossRef] [PubMed]
  3. Can, U., & Bocuoglu, M. E. (2022). Evolution of Islamic liquidity management in Turkey. International Journal of Islamic and Middle Eastern Finance and Management, 15, 788–810. [Google Scholar]
  4. Che, J. (2009). Literature review of corporate liquidity and liquidity risk. Productivity Research, 12, 188–190. (In Chinese) [Google Scholar]
  5. Chen, S., Song, Y., & Gao, P. (2023). Environmental, social, and governance (ESG) performance and financial outcomes: Analyzing the impact of ESG on financial performance. Journal of Environmental Management, 345, 118829. [Google Scholar] [CrossRef] [PubMed]
  6. Chen, W., Pei, H., Shi, X., & Liu, X. (2025). The impact of strong financial regulation on corporate innovation. Science Research Management, 46, 107–116. (In Chinese) [Google Scholar]
  7. DiMaggio, P., & Powell, W. (1983). The iron cage revisited: Institutional isomorphism and collective rationality in organizational fields. American Sociological Review, 48, 147–160. [Google Scholar] [CrossRef]
  8. Freeman, R. E. (1984). Strategic management: A stakeholder approach. Pitman. [Google Scholar]
  9. Huang, S. (2021). ESG concept and corporate reporting restructuring. Finance Monthly, 17, 3–10. (In Chinese) [Google Scholar]
  10. Jackson, H. E., & Roe, M. J. (2009). Public and private enforcement of securities laws. Journal of Financial Economics, 93, 207–238. [Google Scholar] [CrossRef]
  11. Jensen, M. C., & Meckling, W. H. (1976). Theory of the firm: Managerial behavior, agency costs and ownership structure. Journal of Financial Economics, 3, 305–360. [Google Scholar] [CrossRef]
  12. Kang, B. (2018). Corporate liquidity risk prevention under strong regulation. New Finance, 7, 27–29. (In Chinese) [Google Scholar] [CrossRef][Green Version]
  13. Kitching, J., Hart, M., & Wilson, N. (2015). Burden or benefit? Regulation as a dynamic influence on small business performance. International Small Business Journal, 33, 130–147. [Google Scholar]
  14. Kraus, A., & Litzenberger, R. H. (1973). A state-preference model of optimal financial leverage. Journal of Finance, 28, 911–922. [Google Scholar] [CrossRef]
  15. Lin, Z., Yang, Q., & Chen, S. (2025). Exploring the correlation between financial leverage and corporate bond credit spreads. Finance Research Letters, 75, 106855. [Google Scholar] [CrossRef]
  16. Liu, Y., & Geng, X. (2026). The impact of corporate ESG performance on debt maturity structure. Statistics and Decision, 42, 177–182. (In Chinese) [Google Scholar]
  17. Liu, Z., & Li, M. (2025). ESG performance and corporate green innovation. Price: Theory and Practice, 12, 244–250. (In Chinese) [Google Scholar]
  18. Lu, J., & Zhang, S. (2021). Corporate social responsibility, media attention, and financing constraints. Friends of Accounting, 10, 110–116. (In Chinese) [Google Scholar]
  19. Meng, L., Han, C., & Liu, P. (2023). An empirical study on corporate environmental responsibility and financial performance. Journal of Tongji University (Social Science Edition), 34, 107–117. (In Chinese) [Google Scholar]
  20. Modigliani, F., & Miller, M. H. (1958). The cost of capital, corporation finance and the theory of investment. American Economic Review, 48, 261–297. [Google Scholar]
  21. Modigliani, F., & Miller, M. H. (1963). Corporate income taxes and the cost of capital: A correction. American Economic Review, 53, 433–443. [Google Scholar]
  22. Myers, S. C., & Majluf, N. S. (1984). Corporate financing and investment decisions when firms have information that investors do not have. Journal of Financial Economics, 13, 187–221. [Google Scholar] [CrossRef]
  23. Opler, T., Pinkowitz, L., Stulz, R., & Williamson, R. (1999). The determinants and implications of corporate cash holdings. Journal of Financial Economics, 52, 3–46. [Google Scholar] [CrossRef]
  24. Porter, M. E., & van der Linde, C. (1995). Toward a new conception of the environment-competitiveness relationship. Journal of Economic Perspectives, 9, 97–118. [Google Scholar] [CrossRef]
  25. Qin, Y., Nguyen, D. K., Cifuentes-Faura, J., & Zhong, K. Y. (2023). Strong financial regulation and corporate bankruptcy risk in China. Finance Research Letters, 58, 104343. [Google Scholar] [CrossRef]
  26. Valenzuela, P. (2016). Rollover risk and credit spreads: Evidence from international corporate bonds. Review of Finance, 20, 631–661. [Google Scholar] [CrossRef]
  27. Wan, X., & Gu, N. (2011). Cash holdings, financing constraints, and firm value. Business Economics and Management, 2, 71–77. (In Chinese) [Google Scholar]
  28. World Bank. (2004). Who cares wins: Connecting financial markets to a changing world. World Bank. [Google Scholar]
  29. Xiang, S., & Wei, H. (2014). The impact of liquidity constraints on firm productivity. Statistical Research, 31, 27–36. (In Chinese) [Google Scholar]
  30. Xie, H., & Liu, X. (2016). The impact of corporate governance on working capital management performance. Finance Monthly, 32, 25–29. (In Chinese) [Google Scholar]
  31. Xu, Y., Gao, W., & Li, C. (2025). Basic experience of continuous regulatory systems for listed companies in developed economies. Finance and Accounting Communications, 18, 3–10. (In Chinese) [Google Scholar]
  32. Yang, P. (2024). Private enterprise social responsibility, information asymmetry, and financing constraints. Finance and Accounting Communications, 14, 75–79. (In Chinese) [Google Scholar]
  33. Zhang, Y. B., & Dai, J. (2025). Financial regulation and liquidity risk of small and medium-sized banks. Finance Research Letters, 81, 107461. [Google Scholar] [CrossRef]
  34. Zhao, X., Li, Y., & Ding, L. (2024). The impact of strong financial regulation on corporate risk-taking. Economics and Management, 38, 1–8. (In Chinese) [Google Scholar]
  35. Zhou, X., & Yao, X. (2025). Liquidity regulation and commercial bank liquidity risk management. Banking Studies, 14, 134–137. (In Chinese) [Google Scholar]
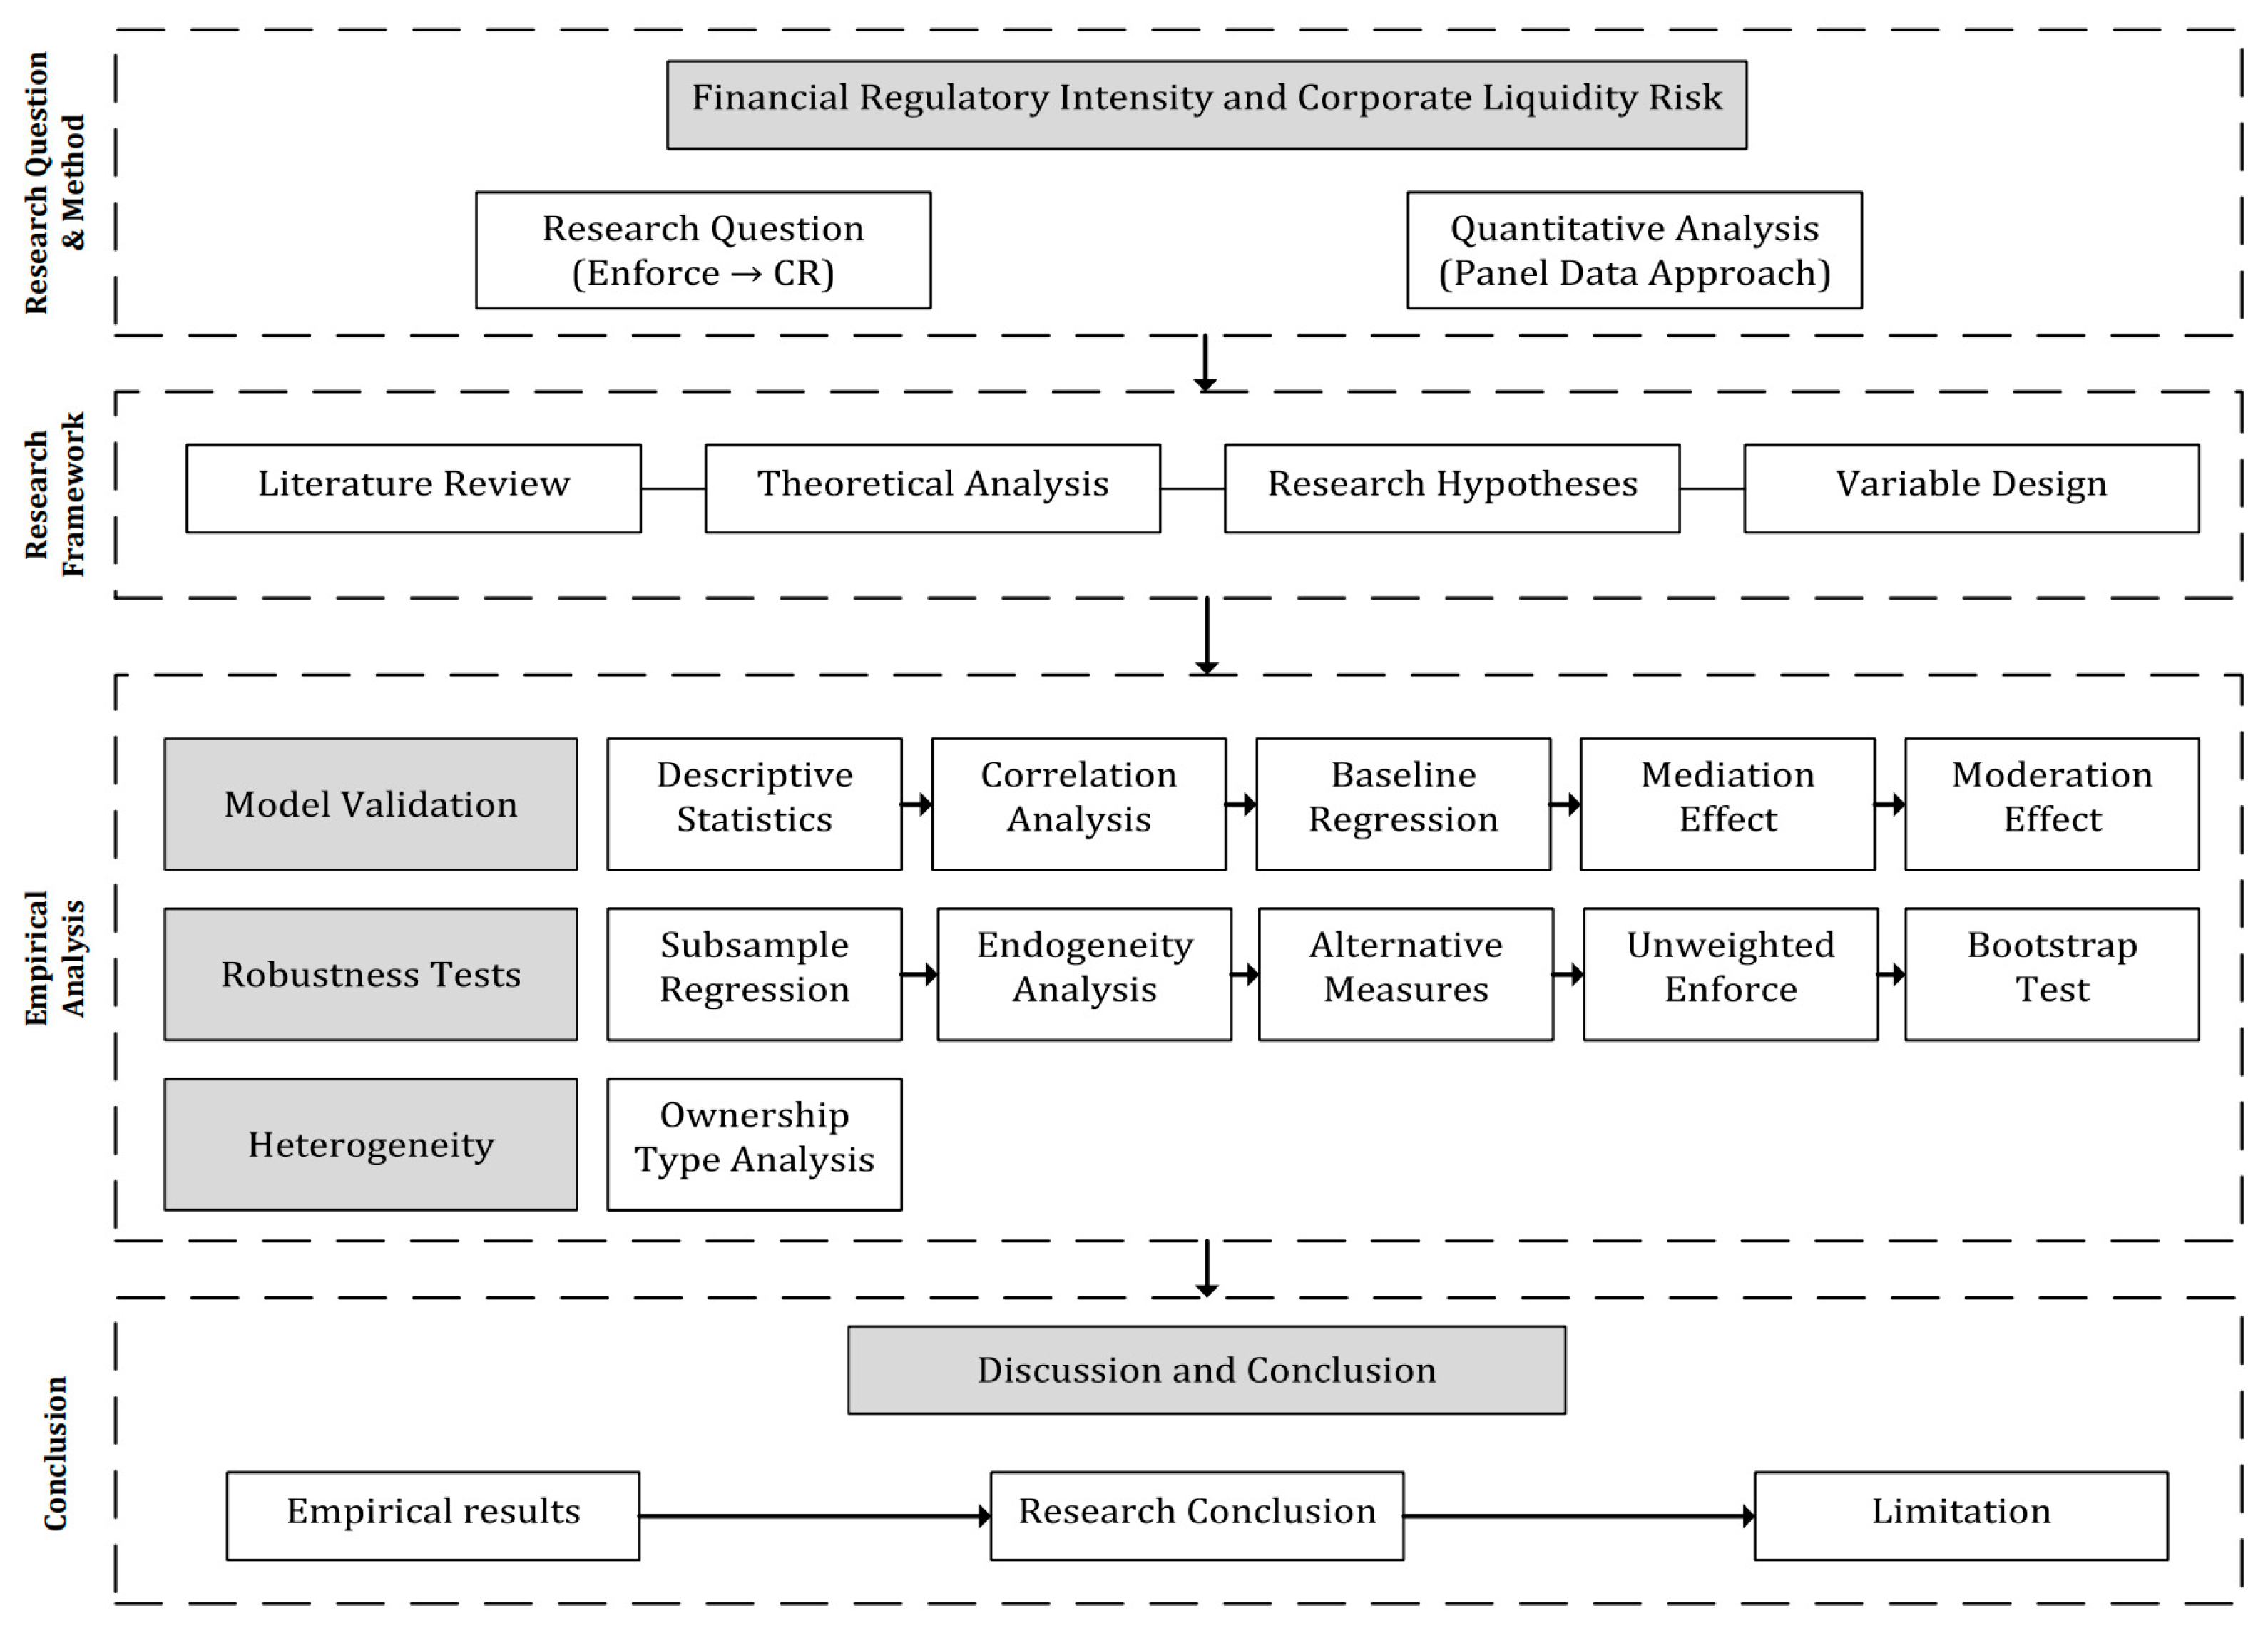
Figure 1. Theoretical Framework: Financial Regulatory Intensity and Corporate Liquidity Risk.
Ijfs 14 00199 g001
Table 1. Descriptive Statistics of Main Variables.
VariableObsMeanStd. Dev.MinMax
CR36,4782.7063.2810.02080.664
QR36,4781.852.6100.00065.512
CHR36,47816.5013.00.00042.735
Enforce36,4780.9146.696−15.65918.863
ROA36,4783.0967.242−35.90920.872
CAR36,47858.3320.1710.5895.77
CLR36,4788117.73.2121.7
EM36,4782.1401.6481.05914.137
z_E35,1870.0001.000−2.1122.858
z_S35,1870.0001.000−3.0602.329
z_G35,1870.0001.000−3.8061.743
Lev36,47841.420.75.695.9
Note: All continuous variables are winsorized at the 1st and 99th percentiles. ESG sub-dimension scores are standardised (z-scores). CHR, CAR, CLR, and Lev are expressed in percentage form; CR, QR, and EM are in ratio/multiple form.
Table 2. Pearson Correlation Matrix.
CREnforceROAEMCARCLR
CR1.000
Enforce−0.038 **1.000
ROA0.166 ***−0.0161.000
EM−0.279 ***−0.012−0.331 ***1.000
CAR0.388 ***0.0250.231 ***−0.242 ***1.000
CLR0.027−0.0200.062−0.104 **0.184 ***1.000
Note: *** p < 0.01, ** p < 0.05, * p < 0.1.
Table 3. Baseline Fixed-Effects Regression Results.
Variable(1) CR(2) CR
Enforce−0.0115 ***−0.00750 ***
(0.00155)(0.00148)
ROA 0.0131 ***
(0.00177)
EM −0.144 ***
(0.00949)
CAR 5.974 ***
(0.125)
CLR −1.807 ***
(0.0903)
Constant2.717 ***3.472 ***
(0.00984)(0.0792)
Observations36,47836,478
R-squared0.0020.097
Firm FEYesYes
Year FEYesYes
Note: Clustered standard errors at the firm level are in parentheses. *** p < 0.01, ** p < 0.05, * p < 0.1.
Table 4. Subsample Regression Results.
Variable2015–2019 CR2020–2024 CR
Enforce−0.00860 ***−0.00553 ***
(0.00329)(0.00186)
ControlsYesYes
Observations15,74520,733
R-squared0.0890.098
Firm and Year FEYesYes
Note: Controls are identical to column (2) of Table 3. *** p < 0.01, ** p < 0.05, * p < 0.1.
Table 5. Endogeneity Test: Lagged Regulatory Intensity.
Variable(1) CR(2) CR
L.1 Enforce−0.00721 ***−0.00449 ***
(0.00152)(0.00146)
ControlsNoYes
Observations31,06231,062
R-squared0.0010.082
Firm and Year FEYesYes
Note: *** p < 0.01, ** p < 0.05, * p < 0.1.
Table 6. Robustness: Unweighted Regulatory Intensity Measure.
Variable(1) CR
EnforceStrength−0.150 ***
(0.025)
ControlsYes
Observations36,478
R-squared0.215
Firm and Year FEYes
Note: *** p < 0.01, ** p < 0.05, * p < 0.1.
Table 7. Robustness: Alternative Liquidity Measures.
Variable(1) QR(2) CHR
Enforce−0.0072 ***−0.0005 ***
(0.0013)(0.0001)
ControlsYesYes
Observations36,47836,478
R-squared0.2050.148
Firm and Year FEYesYes
Note: *** p < 0.01, ** p < 0.05, * p < 0.1.
Table 8. Heterogeneity Analysis: State-Owned vs. Non-State-Owned Enterprises.
VariableSOE CRNon-SOE CR
Enforce−0.00316 **−0.00984 ***
(0.00155)(0.00209)
ControlsYesYes
Observations11,08225,126
R-squared0.1240.093
Firm and Year FEYesYes
Note: *** p < 0.01, ** p < 0.05, * p < 0.1.
Table 9. Bootstrap Tests: Summary of Indirect and Direct Effects.
MediatorEffectEstimateZp-Value95% CI
EIndirect−0.00019−0.950.342[−0.00055, +0.00015]
SIndirect−0.00031−1.900.058 *[−0.00055, −0.00003]
GIndirect0.000422.440.015 **[0.00015, 0.00075]
EDirect−0.00365−2.470.014 **[−0.00655, −0.00075]
SDirect−0.00384−2.590.010 **[−0.00674, −0.00094]
GDirect−0.00445−3.030.002 ***[−0.00733, −0.00157]
Note: Based on 5000 bootstrap replications, *** p < 0.01, ** p < 0.05, * p < 0.1.
Table 10. Mediation Results: Environmental Dimension (E).
Variable(1) z_E(2) CR
Enforce0.00996 ***−0.00365 **
(0.000649)(0.00148)
z_E −0.0788 ***
(0.0127)
ControlsYesYes
Observations35,16735,167
Note: *** p < 0.01, ** p < 0.05, * p < 0.1.
Table 11. Mediation Results: Social Responsibility Dimension (S).
Variable(1) z_S(2) CR
Enforce0.00580 ***−0.00384 ***
(0.000660)(0.00148)
z_S −0.118 ***
(0.0126)
ControlsYesYes
Observations35,16735,167
Note: *** p < 0.01, ** p < 0.05, * p < 0.1.
Table 12. Mediation Results: Corporate Governance Dimension (G).
Variable(1) z_G(2) CR
Enforce0.00190 ***−0.00445 ***
(0.000629)(0.00147)
z_G 0.149 ***
(0.0133)
ControlsYesYes
Observations35,16735,167
Note: *** p < 0.01, ** p < 0.05, * p < 0.1.
Table 13. Parallel Multiple Mediation: E, S, G Entered Simultaneously.
Panel A: Stage 1 and Stage 2
Variable(1) z_E(2) z_S(3) z_G(4) CR (Stage 2)
Enforce0.00996 ***0.00580 ***0.00190 ***−0.0032 ***
(0.00065)(0.00066)(0.00063)(0.0015)
z_E −0.062 **
z_S −0.095 ***
z_G 0.128 ***
ControlsYesYesYesYes
Observations 35,187
Panel B: Indirect Effects
PathIndirect EffectZp-value95% CI
Enf → E → CR−0.00062−1.420.156[−0.0012, +0.0001]
Enf → S → CR−0.00055−1.750.080 *[−0.0010, −0.0001]
Enf → G → CR0.000242.350.019 **[0.00005, 0.0005]
Note: 5000 bootstrap replications, *** p < 0.01, ** p < 0.05, * p < 0.1.
Table 14. Moderation Analysis: Financial Leverage.
Variable(1) CR(2) CR
Enforce−0.00576 ***−0.0242 ***
(0.00137)(0.00316)
Enforce × Lev 0.0435 ***
(0.00671)
Lev−9.709 ***−9.729 ***
(0.133)(0.133)
ControlsYesYes
Observations36,45836,458
R-squared0.2290.230
Firm and Year FEYesYes
Note: Marginal effect = −0.0242 + 0.0435 × Lev; threshold Lev ≈ 0.56. *** p < 0.01, ** p < 0.05, * p < 0.1.
Disclaimer/Publisher’s Note: The statements, opinions and data contained in all publications are solely those of the individual author(s) and contributor(s) and not of MDPI and/or the editor(s). MDPI and/or the editor(s) disclaim responsibility for any injury to people or property resulting from any ideas, methods, instructions or products referred to in the content.