1. Introduction
Innovative markets, mainly assets tied to fast-moving technologies and scalable business models, have attracted increasing interest from investors, policymakers, and academic researchers. Over the last decade, technology-intensive equity segments and innovation-themed portfolios have become prominent vehicles for expressing beliefs about long-run productivity, adoption curves, and technological diffusion (
Huo et al., 2024). Yet these markets also display pronounced boom–bust cycles and sharp shifts in sentiment, which can make traditional valuation anchors less informative. In practice, the pricing of innovation-heavy assets often depends more on expectations about future market diffusion and platform dominance than on immediate profits, leaving them exposed to changing narratives and macro-financial conditions. Well-known examples include the Nasdaq-100 (QQQ) and the ARK Innovation ETF (ARKK), both of which concentrate exposure to advanced technology themes such as clean energy, biotechnology, and digital finance.
The appeal, and thus the hazard, of these assets stems from their reliance on expected growth rather than established performance. Innovation-intensive firms frequently resemble “long-duration” equities: a large share of their value is embedded in distant cash flows and growth options, so changes in discount rates, risk premia, and policy expectations can produce outsized valuation adjustments (e.g.,
Bagh et al., 2025). Prior research has emphasized that innovation-oriented pricing is sensitive to shifts in economic sentiment, interest-rate expectations, and policy news (e.g.,
Pástor & Veronesi, 2009;
Brown et al., 2020). At the same time, these markets sit at an awkward intersection: they can signal changes in the broader growth outlook, yet their high sensitivity can also magnify instability during periods of elevated uncertainty. This combination motivates a deeper look not only at how uncertainty relates to volatility in innovation assets, but also at how uncertainty reshapes interdependence across innovation portfolios.
Several theoretical channels imply that the uncertainty–innovation nexus should be horizon dependent rather than uniform. From an asset-pricing perspective, uncertainty can raise required returns and alter discount rates, which disproportionately affects growth-oriented valuations with cash flows concentrated further into the future. From a real options perspective, uncertainty influences the timing and scale of investment in irreversible, R&D-intensive projects, potentially shifting expectations about innovation pipelines and future profitability (
Trigeorgis & Reuer, 2017;
Ross et al., 2018). Behavioral finance provides complementary intuition: in uncertain environments, investors may exhibit flight-to-safety, attention reallocation, or herding, which can accelerate repricing in narrative-sensitive sectors (
Yazdipour, 2010;
Posen et al., 2018). These channels suggest a natural separation between short-horizon responses dominated by fast-moving risk sentiment and liquidity conditions, and longer-horizon responses shaped by persistent uncertainty, financing constraints, and investment expectations.
In empirical work (e.g.,
Adeosun et al., 2023;
Agyei, 2023), uncertainty is often proxied using market-implied measures of fear such as the VIX and news-based measures capturing geopolitical stress. These proxies are not interchangeable: VIX is closely tied to financial-market risk appetite and forward-looking volatility expectations, whereas geopolitical risk indicators may reflect persistent disruptions that operate through global trade, supply chains, security risk, and policy uncertainty. This distinction is particularly relevant for innovation-linked portfolios, many of which are globally exposed through supply chains, regulatory environments, and international demand. An important question is therefore whether market-based uncertainty and geopolitical uncertainty display distinct “signatures” in innovation markets, and whether these signatures differ across investment horizons.
Contemporary research increasingly relies on time–frequency tools to study such horizon-dependent behavior (
Shah & Dar, 2021;
Sahadudheen & Kumar, 2024;
Mensi et al., 2024). Wavelet-based analysis has become popular because it can represent dependence jointly in time and frequency, allowing researchers to observe whether relationships strengthen, weaken, or shift across market regimes without imposing a single constant-parameter structure. Recent studies combine wavelets with multivariate models (e.g., VAR-based frameworks, quantile methods, or volatility models) to examine how shocks relate to asset co-movement and systemwide dependence over different horizons (e.g.,
Khalfaoui et al., 2022;
Özdemir, 2022;
Cao et al., 2023;
Chen et al., 2025). More broadly, evidence suggests that uncertainty effects vary with market structure, geographic exposure, asset type, and shock characteristics. For instance, high-tech segments may exhibit pronounced long-horizon dependence and spillover patterns (
Zheng & Lu, 2022), while regional studies show that volatility linkages can depend strongly on market integration and exposure to global risk factors (
Tien & Hung, 2022). Related analyses in green and Islamic finance highlight that tail risk and policy uncertainty can reconfigure market dependence during extreme episodes (
Billah et al., 2024;
El Abed & Hamouda, 2024), reinforcing the view that uncertainty–market linkages are context dependent and state dependent (
Husain et al., 2024).
Despite these advances, two gaps remain relevant for innovation-focused equity portfolios. First, much of the existing spillover and time–frequency literature concentrates on commodities, cryptocurrencies, and sustainability-linked assets, while innovation-focused equity portfolios, such as QQQ, ARKK, the MSCI Digital Economy Index, and the S&P Kensho Moonshots Index, have received comparatively less systematic treatment within a unified horizon-resolved connectedness framework. Second, studies frequently rely on a single uncertainty proxy, even though market-based fear and geopolitical risk may convey different information and operate through different channels. As a result, it remains unclear whether uncertainty effects on innovation portfolios are broadly similar across uncertainty types or whether they vary asymmetrically with the nature of the shock and the investor’s holding period.
The four innovation benchmarks considered here are not interchangeable. QQQ represents broad large-cap technology and innovation exposure anchored by mature platform firms with relatively deeper liquidity and more established earnings capacity. ARKK captures a more concentrated disruptive-innovation segment characterized by stronger narrative sensitivity, higher valuation dispersion, and greater exposure to long-duration growth expectations. The MSCI Digital Economy Index emphasizes firms tied to digital infrastructure, software, platforms, and transformation services, while the S&P Kensho Moonshots Index tilts more toward frontier and early-stage innovation themes. Because these portfolios differ in business maturity, thematic concentration, and valuation structure, they provide a useful setting for examining whether uncertainty connectedness is homogeneous across innovation markets or instead varies systematically by innovation segment.
A related empirical challenge is interpretational: it is important to separate broad co-movement from statements about influence. In this study, we treat wavelet coherence as evidence of time–frequency co-movement and lead–lag timing, while net “transmitter/receiver” roles are inferred only from forecast-error-variance-decomposition connectedness within a multivariate system. Accordingly, our results are interpreted as horizon-dependent association and predictive dominance rather than structural causality.
To address these gaps, we examine the aforementioned set of innovation-focused equity indices and quantify how uncertainty relates to their horizon-specific interdependence over the 2015–2025 period, which spans multiple regimes including COVID-19, monetary policy tightening, and heightened geopolitical tensions. Following
Almajali et al. (
2026) and
Alqaralleh (
2024), the adopted empirical framework is layered: volatility modeling summarizes time-varying risk, wavelet decomposition separates dynamics into predefined horizon bands, and connectedness measures quantify model-based dependence within each band. This design is not a mechanical stacking of tools; its purpose is to test whether dependence patterns that appear “average” in the time domain actually differ meaningfully across horizons and uncertainty states.
Building on the mechanisms above, we propose the following hypotheses.
H1. Uncertainty is associated with higher interdependence among innovation-focused equity indices, with the magnitude varying across horizons.
H2. Market-based uncertainty (VIX) is more strongly associated with short- to medium-horizon dependence, while geopolitical uncertainty (GPR) is more strongly associated with medium- to long-horizon dependence.
H3. Net connectedness roles (model-based transmitter/receiver positions within FEVD connectedness) vary across horizons and across high-uncertainty versus calmer episodes, indicating that the dependence structure can reconfigure during stress periods.
By addressing these hypotheses, the study contributes to the literature in four ways. First, it provides a unified horizon-specific comparison of four innovation-focused equity benchmarks that differ in maturity, thematic concentration, and valuation structure. Second, it jointly evaluates two distinct uncertainty proxies, market-implied uncertainty and geopolitical uncertainty, within the same multiscale framework, allowing their horizon signatures to be compared directly rather than in separate studies. Third, it distinguishes descriptive time–frequency co-movement from model-based connectedness, thereby improving interpretive transparency. Fourth, it shows that innovation-market interdependence is not uniform across portfolios or horizons, which is relevant for both asset-pricing interpretation and risk monitoring.
The remainder of the paper is organized as follows.
Section 2 presents the empirical framework.
Section 3 describes the data and preprocessing steps.
Section 4 reports time–frequency dependence evidence.
Section 5 presents horizon-specific connectedness results,
Section 6 reports robustness analyses, and
Section 7 concludes.
2. Empirical Methodology
This study examines how market-based and geopolitical uncertainty relate to the volatility dynamics and interdependence of innovation-focused equity portfolios. Because these relationships can differ across investment horizons, we adopt a three-stage time–frequency framework that integrates: (i) GARCH-based volatility estimation, (ii) wavelet-based horizon decomposition, and (iii) forecast-error-variance-decomposition (FEVD) connectedness analysis.
The motivation for this framework is horizon differentiation rather than universal forecasting superiority (
Almajali et al., 2026;
Alqaralleh et al., 2023). A standard time-domain connectedness model compresses all interactions into one average dependence measure, which is restrictive when the underlying assets are held by investors with heterogeneous horizons and when uncertainty shocks may propagate at different speeds. The layered design is therefore used to separate fast-moving repricing dynamics from slower-moving persistence, while the time-domain benchmark is retained as a reference rather than treated as an inferior specification in all respects.
In the first stage, we model each index’s return volatility using a best-fitting GARCH-family specification to obtain a conditional variance series that summarizes time-varying risk in the return process. This step provides a volatility input that is comparable across assets and suitable for subsequent multiscale analysis. In the second stage, we apply the maximal overlap discrete wavelet transform (MODWT) to decompose the volatility series into predefined horizon components. We map wavelet scales into trading-day frequency bands and classify them as short-, medium-, and long-horizon dynamics (explicit band definitions and the scale-to-period mapping are reported below and displayed on all time–frequency figures). This decomposition is important because market-based uncertainty can be associated with relatively rapid repricing and liquidity conditions, whereas geopolitical risk may operate more persistently through slower-moving channels such as global disruption and policy uncertainty.
In the third stage, we quantify horizon-specific interdependence using a Diebold–Yilmaz connectedness framework estimated separately within each horizon band. The connectedness measures identify the contribution of each series to others’ forecast error variance within a multivariate system and yield net directional connectedness (“transmitter/receiver”) roles in the FEVD sense. We interpret these outputs as model-based variance-share dependencies and predictive dominance, not structural causality.
A key motivation for the layered design is that conventional time-domain approaches summarize dependence using a single scale that is implicitly uniform across holding periods. Innovation-focused assets, however, are shaped by heterogeneous investor horizons and episodic uncertainty regimes. By combining volatility estimation, horizon decomposition, and band-specific connectedness, the framework allows dependence patterns to differ by uncertainty type (VIX versus GPR), by horizon (short/medium/long), and by uncertainty state (stress versus calmer periods). This structure enables us to evaluate whether uncertainty is associated mainly with stronger average co-movement or with a reconfiguration of the connectedness network, i.e., changes in net connectedness roles across horizons and regimes.
Following
Almajali et al. (
2026), the proposed GARCH–MODWT–VAR design is used as a reduced-form horizon-partitioning framework rather than a structural decomposition of the volatility-generating process. The first stage extracts a comparable conditional volatility proxy from each return series; the second stage separates this proxy into investment-horizon bands; and the third stage summarizes band-specific forecast-error-variance sharing within a multivariate system. Accordingly, the estimates are not considered as structural transmission parameters; instead, they are seen as horizon-resolved dependence measures conditional on the chosen filtering design. This distinction is important because sequential filtering can alter the statistical properties of the original series. For that reason, the current paper treats the wavelet-connectedness results as descriptive multiscale evidence and complements them with additional diagnostics and robustness checks rather than presenting them as definitive structural identification.
Finally, to clarify the incremental value of the time–frequency approach, we benchmark our horizon-specific results against standard time-domain connectedness estimates computed without wavelet decomposition. The following subsections detail each stage and the construction of the connectedness measures used in the empirical analysis.
We begin by modeling time-varying volatility in daily returns using ARCH-type specifications, with GARCH as the baseline workhorse for conditional heteroskedasticity. Let
denote the daily return of a given index. The return process is written as:
where
is the conditional mean,
is the mean-corrected innovation, and
is the conditional variance.
In a general
model, the conditional variance is expressed as follows:
Given that
, the conditional variance in a GARCH(1,1) model can be reformulated as:
For covariance stationarity, a sufficient condition is (the boundary case corresponds to IGARCH). We estimate the GARCH model for each index and obtain the fitted conditional variance series , which serves as the volatility input for the subsequent wavelet decomposition stage.
Daily returns are computed as . Estimation assumes Student-t innovations for . For transparency and comparability across indices, we estimate the best-fitting GARCH specification selected by BIC and report standard residual diagnostics (ARCH-LM on standardized residuals and Ljung–Box tests) to confirm that conditional heteroskedasticity is adequately captured. The resulting series is then decomposed into horizon components using MODWT.
In the second stage, we decompose the fitted conditional variance series obtained from the GARCH model,
(Equation (3)), into horizon-specific components using wavelet filtering. Wavelet methods are well suited to financial time series because they represent variation jointly in time and scale, allowing dependence patterns to differ across investment horizons and across market regimes (
Percival & Walden, 2000;
Gençay et al., 2002).
We employ the maximal overlap discrete wavelet transform (MODWT), which is a shift-invariant wavelet filter that avoids the down-sampling step of the standard discrete wavelet transform. As a result, MODWT produces wavelet and scaling coefficients aligned with the original sample length, improving interpretability for time-varying financial applications (
Percival & Walden, 2000). Using MODWT, the conditional variance process can be expressed as the sum of detail components at multiple scales and a final smooth component:
where
captures oscillations at scale
(higher
corresponds to lower-frequency, longer-horizon dynamics) and
captures the remaining low-frequency component (trend).
Because the data are sampled at a daily frequency, MODWT scales can be mapped into approximate period bands in trading days. Specifically, scale corresponds approximately to fluctuations between and trading days. We group these scales into three horizon aggregates, short-, medium-, and long-run components, using explicit trading-day bands that are reported in a scale-mapping table (and displayed on all time–frequency figures). This mapping allows the subsequent connectedness analysis to quantify whether volatility interdependence differs across investment horizons rather than being summarized by a single time-domain dependence measure.
In the baseline specification, we define short-run as 2–8 trading days (levels ), medium-run as 8–32 trading days (levels ), and long-run as >32 trading days (levels ).
In the third stage, we quantify horizon-specific interdependence using a VAR-based connectedness framework (
Wang et al., 2025). For each wavelet horizon band
, we construct an
vector
that stacks the band-limited volatility components of the
innovation indices obtained from MODWT. We then estimate a
model:
where
is an intercept vector,
are
coefficient matrices, and
is the residual covariance matrix. To measure connectedness, this paper relies on the generalized forecast error variance decomposition (GFEVD) of
Pesaran and Shin (
1998), which is invariant to variable ordering.
Let
represent the contribution of shocks to variable
to the H-step-ahead forecast error variance of variable iii in band b. Following
Diebold and Yılmaz (
2014), we row-normalize the variance shares so that they sum to one:
The Total Connectedness Index (TCI) in band b is defined as the average share of forecast error variance coming from cross-variable shocks:
Directional connectedness measures quantify how much variable iii contributes to others (“TO”) and how much it receives from others (“FROM”):
The net directional connectedness is then:
where positive (negative) values indicate that variable iii is a net contributor (net absorber) of forecast-variance shares within the VAR system in that band.
These measures describe model-based variance-share dependence and predictive dominance within a forecasting system; they are not interpreted as structural causality. Estimating the connectedness system separately for each wavelet band yields horizon-specific connectedness profiles and allows us to assess whether the interdependence structure differs across investment horizons and uncertainty regimes.
The VAR lag order p is selected using BIC, and the variance decomposition horizon is set to trading days. Dynamic connectedness is computed using a rolling window of 200 days, and robustness checks are conducted by varying p, H, and the window length. Importantly, our “horizon-specific” results are obtained by applying connectedness to wavelet band-limited series (MODWT), rather than using spectral FEVD connectedness; the approach therefore captures dependence across predefined wavelet scales aligned with trading-day horizons.
3. Data
This study examines how market-based and geopolitical uncertainty relate to volatility dynamics in innovation-focused equity portfolios. The sample comprises daily observations from 1 June 2015 to 9 May 2025, a window that spans multiple market regimes, including the COVID-19 episode, monetary-policy tightening, and periods of heightened geopolitical tension. Working at daily frequency is essential for capturing short-horizon uncertainty dynamics while still allowing multi-horizon inference through wavelet-based decomposition.
Variables and Data Sources
We use two uncertainty proxies capturing distinct dimensions of uncertainty. Market-based uncertainty is measured by the CBOE Volatility Index (VIX), which reflects implied volatility from S&P 500 option prices and is widely used as a forward-looking gauge of market stress (
Whaley, 2000). Geopolitical uncertainty is measured using the geopolitical risk index (GPR) developed by
Caldara and Iacoviello (
2022).
The geopolitical risk variable is aligned with the trading-day calendar after accounting for information timing relative to market closing hours. When a geopolitical risk observation becomes available after the effective market close, its information content is treated as entering the next trading session rather than the same-day return. This timing convention reduces the risk of mechanically overstating contemporaneous responses and is especially relevant because geopolitical shocks may diffuse more gradually than option-implied market uncertainty. To avoid over-reliance on a single short-memory specification, the analysis also evaluates alternative VAR lag lengths as part of the sensitivity checks.
Innovation exposure is represented by four equity portfolios capturing different segments of the innovation ecosystem: (i) Invesco QQQ Trust (QQQ) as a broad innovation-intensive large-cap benchmark tracking the Nasdaq-100; (ii) ARK Innovation ETF (ARKK) as a high-growth, high-volatility innovation strategy concentrated in disruptive technology themes; (iii) the MSCI Digital Economy Index, capturing firms central to digital transformation; and (iv) the S&P Kensho Moonshots Index, representing early-stage and frontier technology themes. For each market series, we clarify whether the data correspond to price indices or total return indices and the currency denomination.
Daily returns are computed as mentioned as , where denotes the daily closing level. All series are synchronized to a common trading-day calendar using the intersection of available dates. Non-trading days are removed, and missing observations are handled by dropping unmatched dates to ensure comparability across series.
It is worth noting that before estimating the band-specific VAR systems, we examine the statistical adequacy of the original and decomposed series. These include stationarity checks for the decomposed volatility components, VAR stability verification, and residual-correlation diagnostics
1. These tests indicate that the band-limited volatility components used in the connectedness exercise are sufficiently well behaved for VAR estimation.
We also recognize that wavelet band-limited volatility series may remain correlated, especially across adjacent scales, so the resulting GFEVD-based connectedness measures are interpreted as reduced-form variance-share relationships rather than as structurally orthogonalized transmission channels.
4. Wavelet Coherence Analysis
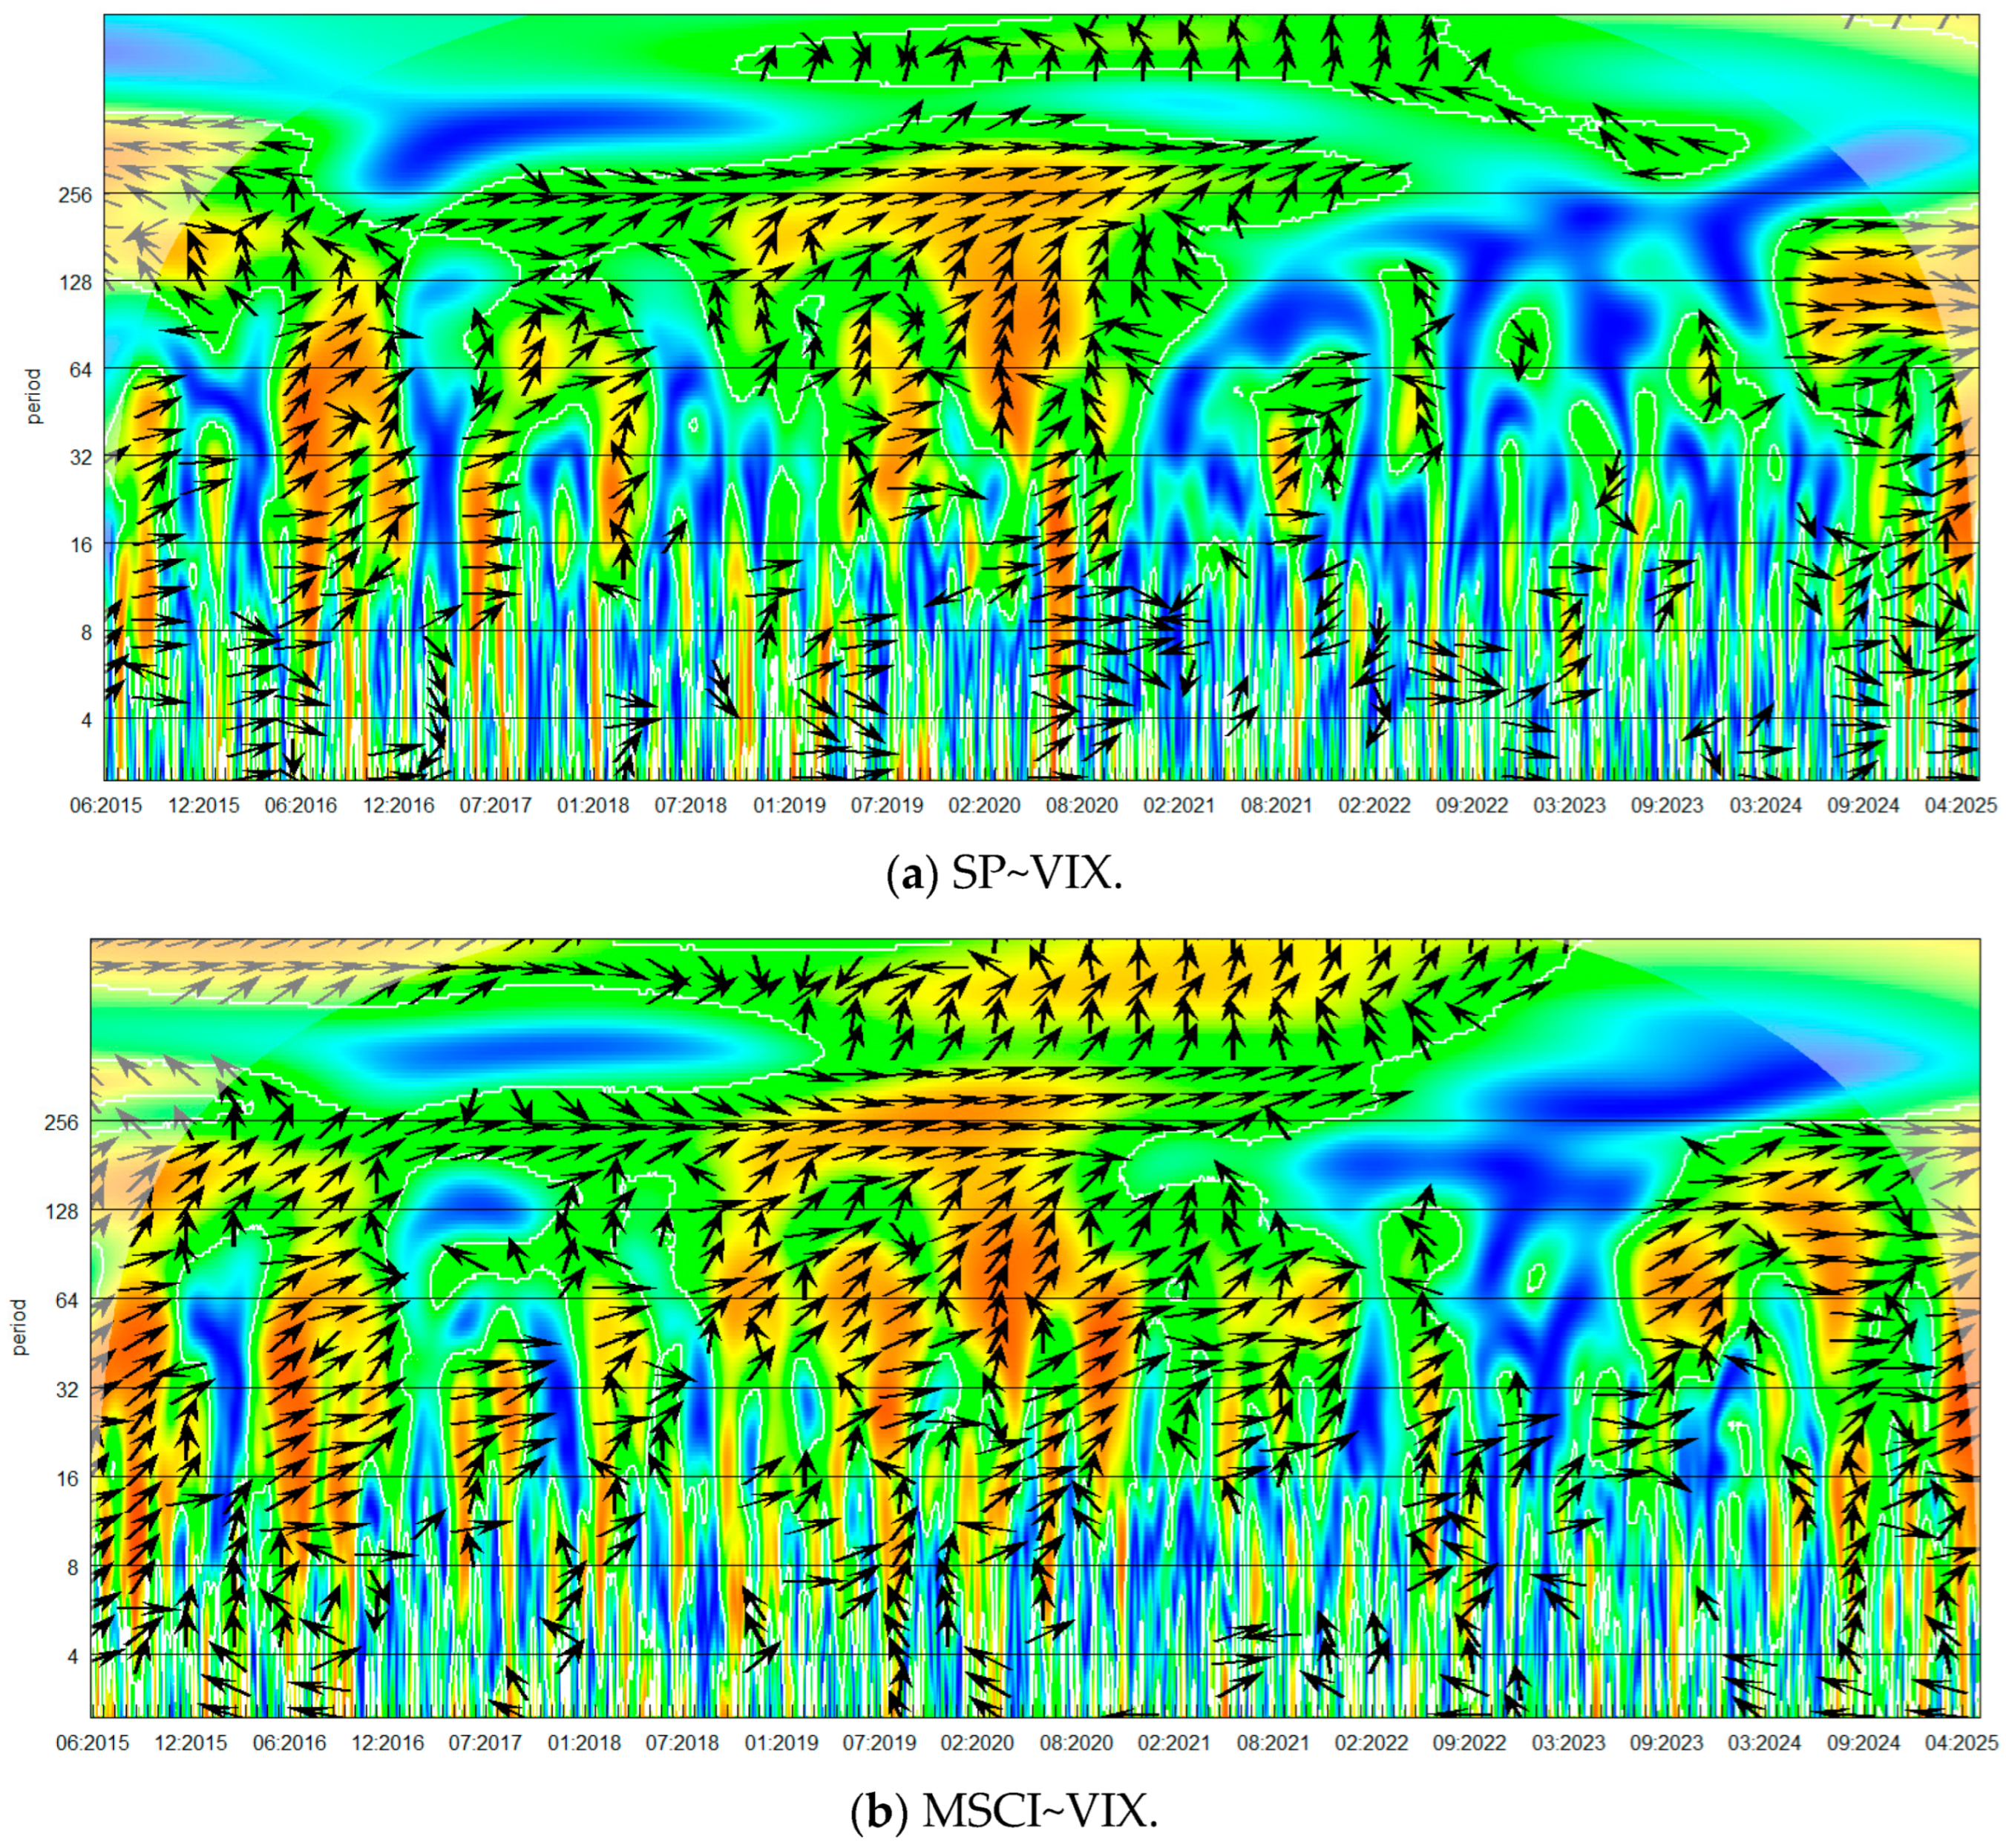
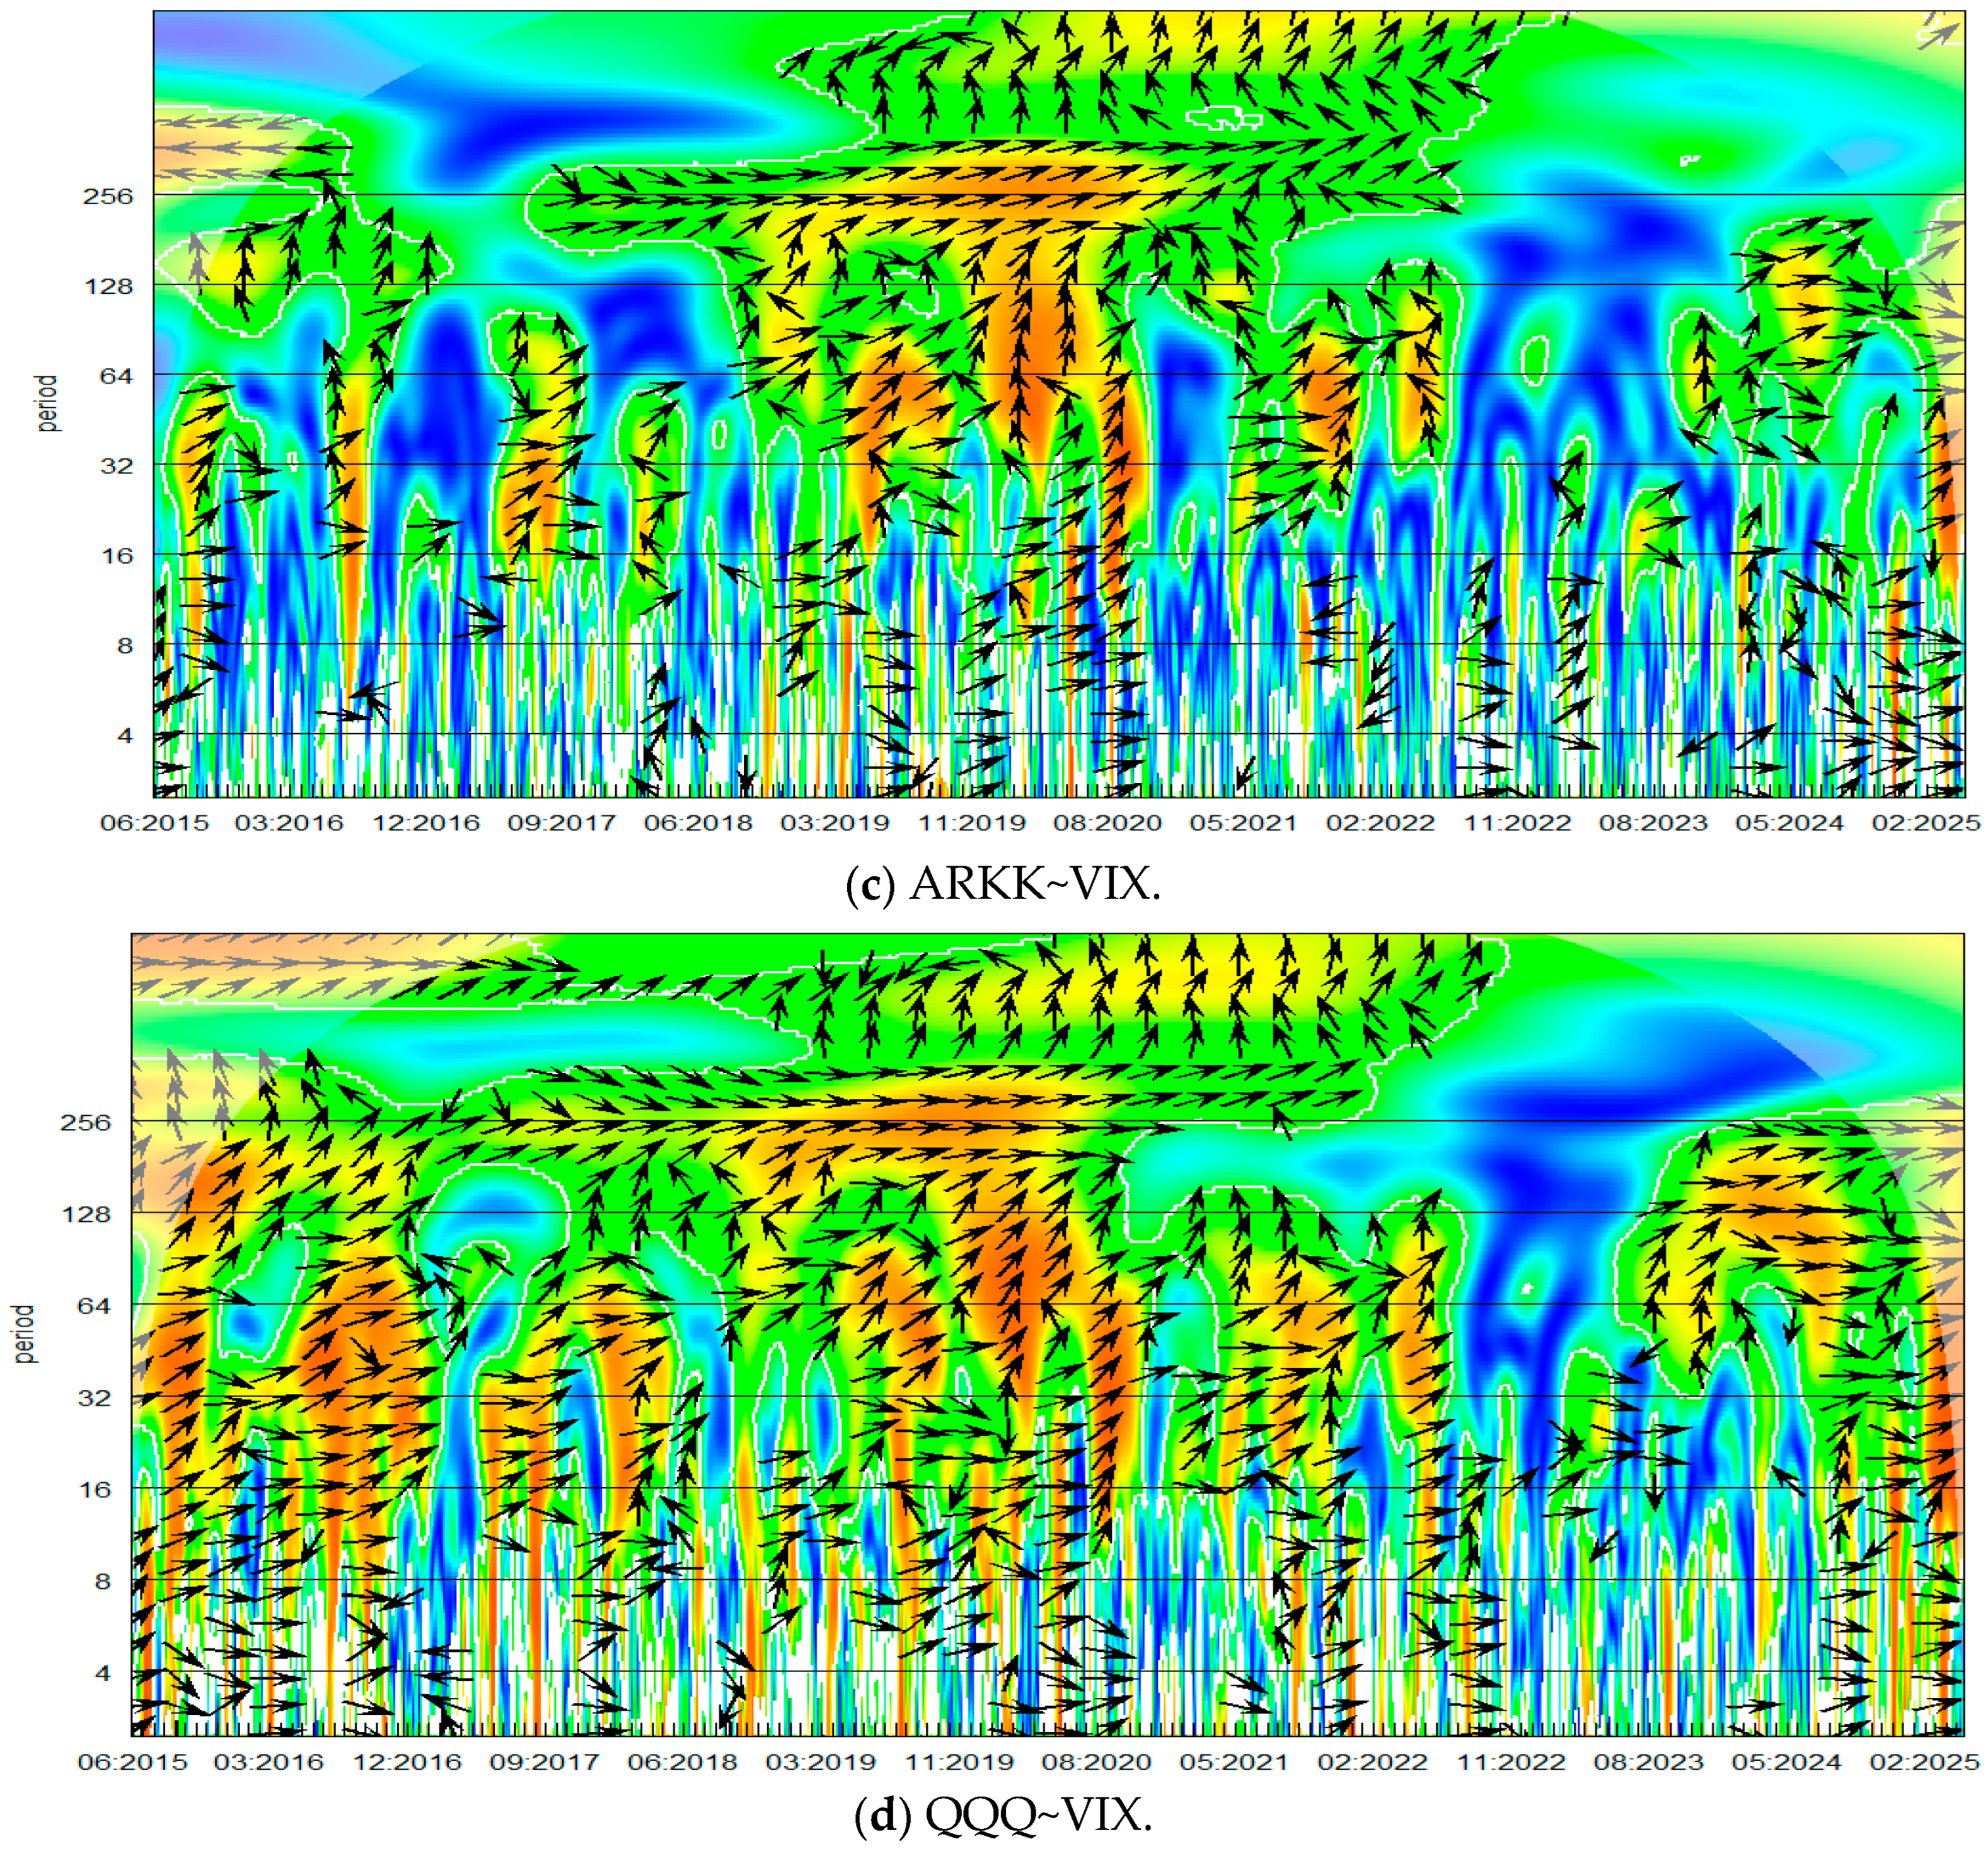
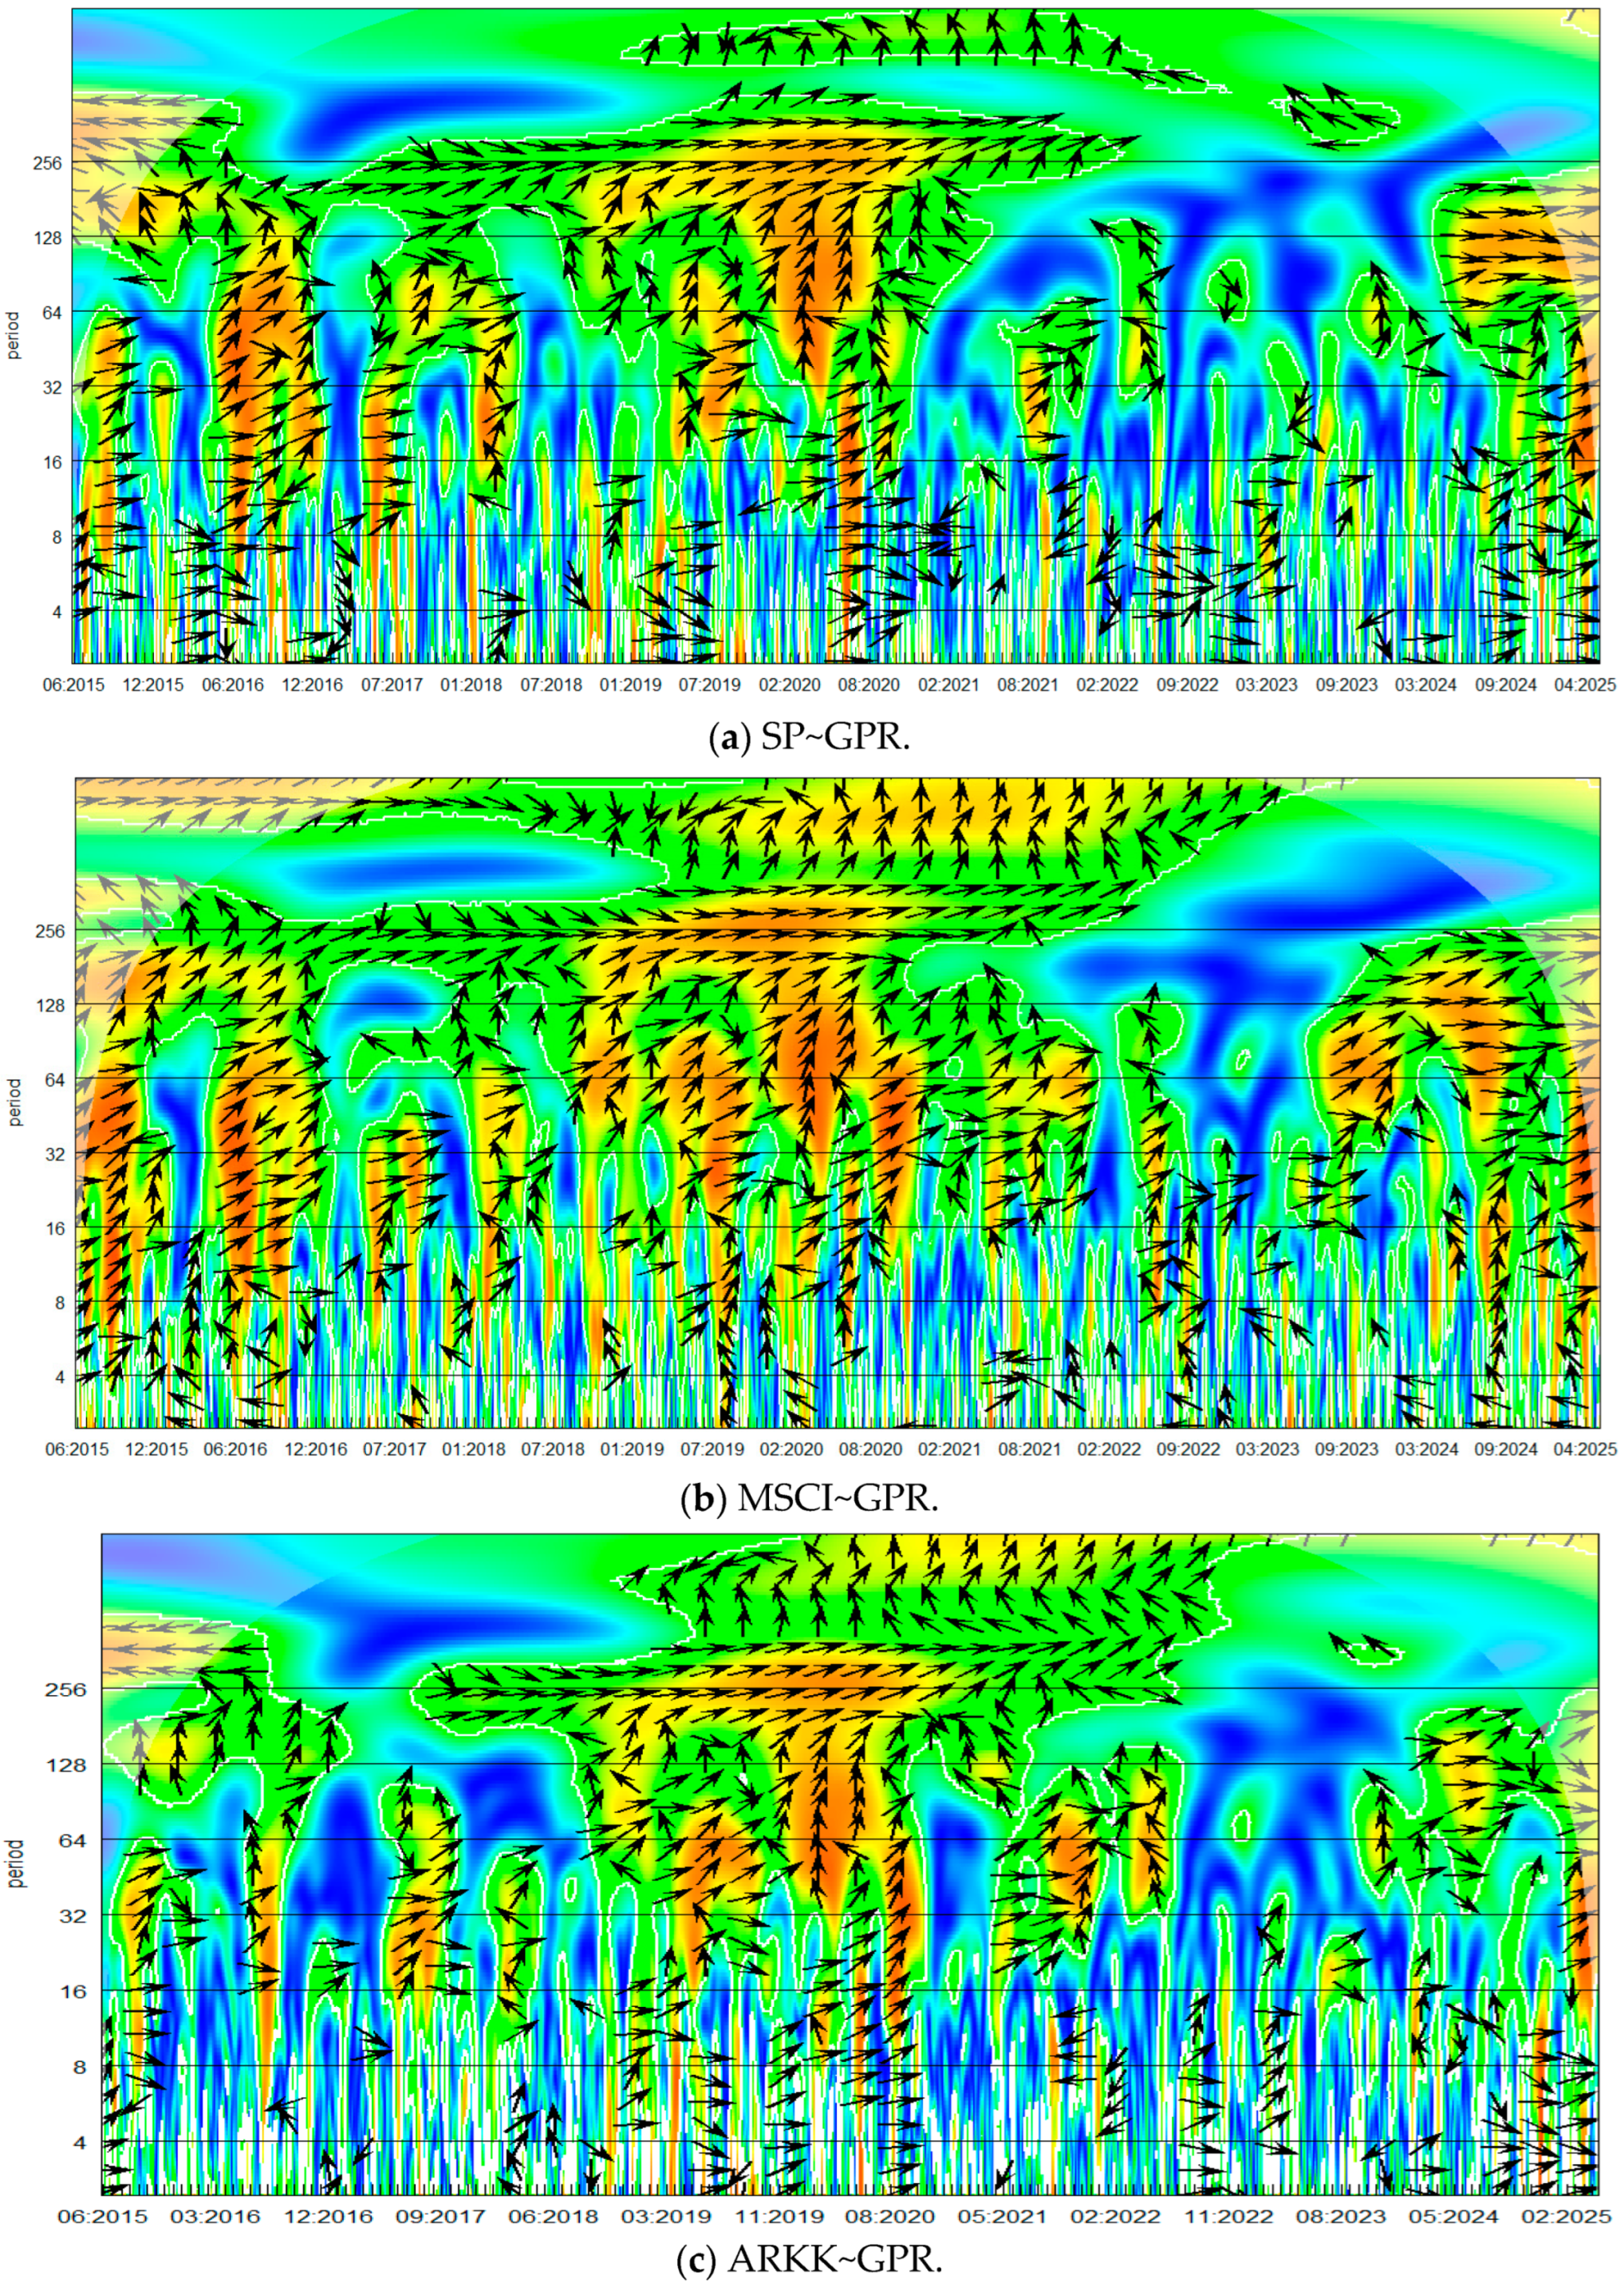
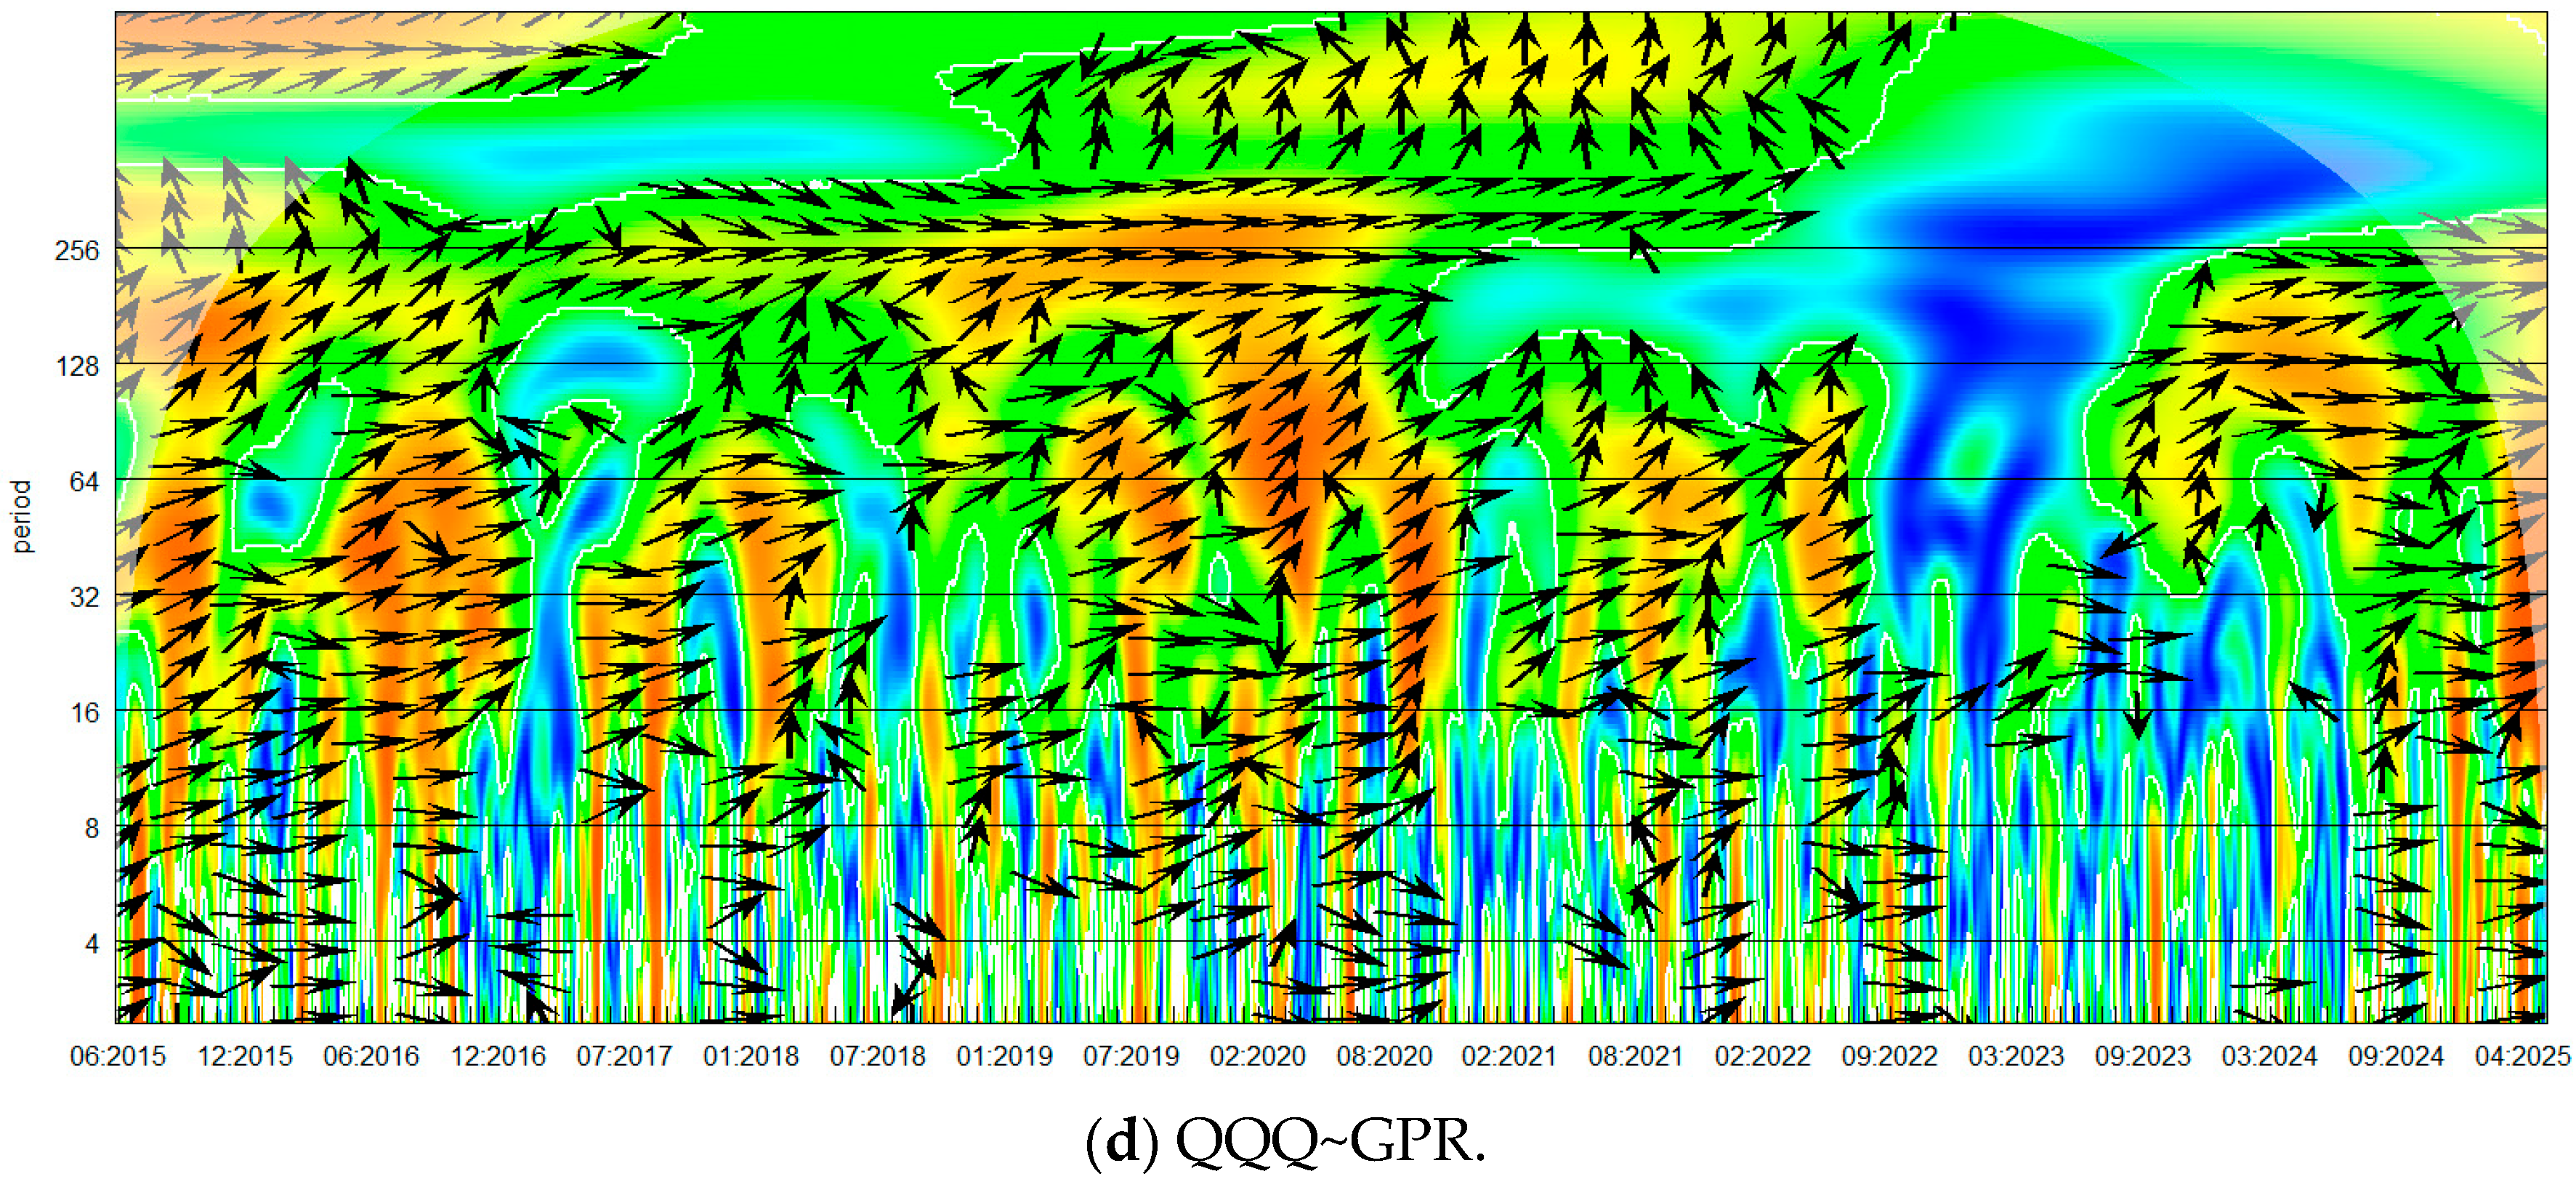
The wavelet coherence plots in
Figure 1 and
Figure 2 describe how uncertainty and innovation-focused equity markets co-move over time and across horizons. The horizontal axis reports time (2015–2025) and the vertical axis reports the period in trading days (approximately 4–256+ days). Warmer colors indicate stronger coherence (0–1). White contours highlight statistically significant regions, while the shaded outer area represents the cone of influence where edge effects may be material. Phase arrows summarize sign and relative timing: right-pointing arrows indicate in-phase (positive) co-movement, left-pointing arrows indicate anti-phase (negative) co-movement, and up/down components reflect which series tends to move first in a descriptive timing sense (not structural causality). Consistent with our multiscale design, we interpret short-run dynamics as periods below ~8 trading days, medium-run dynamics as ~8–32 days, and long-run dynamics as periods above ~32 days (as shown by the period axis ticks).
Because long-period wavelet coefficients are more sensitive to boundary conditions, statistically significant regions located close to the cone of influence are interpreted cautiously. When put in order, these edge-adjacent areas are treated as supportive visual evidence rather than decisive proof of persistent dependence. The substantive conclusions therefore rely more heavily on the connectedness analysis, which is estimated separately on predefined horizon bands and checked through additional sensitivity exercises.
Figure 1 shows that coherence between the VIX and innovation-focused indices is regime dependent and concentrated primarily at medium-to-long horizons. Across panels, the most persistent coherence appears between roughly between 2018 and 2020, where large, statistically significant “islands” emerge at long periods (notably ~64–256 trading days). In these regions, arrows are predominantly right-pointing, indicating that market stress (VIX) and innovation-market dynamics tend to move in phase over longer horizons. This pattern is economically intuitive when uncertainty is viewed through a volatility lens: sustained increases in market stress are associated with sustained changes in risk conditions in innovation-heavy markets, producing persistent dependence rather than short-lived co-movement.
The magnitude and persistence of this dependence vary across indices. The S&P Moonshots and MSCI Digital panels (
Figure 1a,b) display relatively broad long-horizon coherence bands, suggesting that uncertainty and these innovation-exposed portfolios share a stronger common long-run component during major stress episodes. QQQ and ARKK (
Figure 1c,d) show a more episodic pattern at medium horizons (roughly 8–32 days), with pockets of significance that appear and disappear across subperiods. Notably, the post-2021 portion of the sample contains extended blue regions at medium-to-long horizons in several panels, indicating weaker and less stable coherence during that interval compared with the 2018–2020 regime. Toward the end of the sample, coherence re-emerges in selected long-horizon areas (around 2024–2025), again pointing to state dependence rather than a constant relationship.
Regarding timing, phase arrows at long horizons frequently tilt upward or downward across panels, implying shifts in relative timing in different windows. We interpret these as changes in the lead–lag structure of co-movement across regimes, not as evidence that one variable “drives” the other. The key empirical message is that the VIX–innovation relationship is strongest and most persistent at long horizons during high-uncertainty regimes, while it is weaker and more fragmented during calmer periods.
Figure 2 reports wavelet coherence between geopolitical risk (GPR) and the innovation indices. Compared with VIX, the coherence pattern with GPR is more intermittent and is again most visible at medium and long horizons. Across panels, a prominent coherence structure appears around 2018–2021, where statistically significant regions are observed in the ~32–256-day range. In these significant regions, arrows are again mostly right-pointing, indicating in-phase co-movement between geopolitical uncertainty and innovation-market dynamics during those windows. This is consistent with geopolitical risk operating as a slowly evolving macro-uncertainty factor that can be reflected in risk conditions and valuation narratives over longer holding periods.
Differences across innovation portfolios are also evident. The MSCI Digital and QQQ panels (
Figure 2b,c, if ordered as above) show comparatively broad long-run coherence regions, while ARKK tends to display more “patchy” coherence islands, consistent with a portfolio whose dynamics are more sensitive to episodic narrative shifts and risk repricing. After 2022, several panels display a large low-coherence region at medium-to-long horizons, suggesting that the GPR relationship becomes less stable in that interval, with coherence reappearing only in shorter episodes and selected long-horizon pockets toward the end of the sample.
As with the VIX results, phase arrows sometimes change orientation across windows, implying time-varying relative timing in co-movement. However, the wavelet evidence should be interpreted strictly as association and phase dynamics: it documents when and at which horizons geopolitical uncertainty aligns with innovation-market dynamics, while the identification of net “transmitter/receiver” roles is reserved for the VAR-based connectedness results (where those roles have a formal FEVD definition).
Taken together,
Figure 1 and
Figure 2 indicate that uncertainty–innovation dependence is not constant. It strengthens materially during major regimes and is concentrated predominantly at medium and long horizons, with clearer and more persistent coherence clusters around 2018–2021. Market-based uncertainty (VIX) exhibits sharper, more frequent coherence intensification during stress regimes, while geopolitical uncertainty (GPR) produces more intermittent but still economically meaningful long-horizon coherence. These time–frequency patterns should therefore be viewed as descriptive evidence of horizon-varying association, which motivates, but does not by itself identify, the subsequent connectedness analysis.
5. Empirical Analysis
The previous section illustrated that the impact of uncertainty (whether its markets or geopolitical), differs not only across asset classes but also over time. While the S&P 500 or MSCI tend to respond predictably during crises, other innovation-linked assets such as QQQ and ARKK display more irregular, often sentiment-driven behavior. Building on this, we now examine how uncertainty shocks spread throughout the financial system using both static and dynamic connectedness measures.
5.1. Static Connectedness
Using the GARCH–MODWT–VAR connectedness framework,
Table 1 reports static generalized FEVD connectedness among the uncertainty indicators (VIX and GPR) and innovation-focused equity indices (MSCI Digital, S&P Moonshots, QQQ, ARKK) across short-, medium-, and long-horizon bands. The diagonal elements capture “own” variance shares, the FROM column summarizes the share of each variable’s forecast error variance explained by shocks from others, and the TO row summarizes outward connectedness (the sum of variance shares that each variable contributes to others). Net connectedness (NET) is computed as TO − FROM and is interpreted as a variance-share measure of directional interdependence within the VAR system (not structural causality).
At short horizons (Panel A of
Table 1), total connectedness is moderate (TCI = 45.48%), indicating that cross-variable shocks account for roughly 45% of the system’s average forecast error variance. The VIX is a central contributor to system variance shares, with TO = 47.31 and a positive net position (NET = +8.37). This means that, in the short band, VIX contributes more to other variables’ forecast error variance than it receives from them (FROM = 38.94). In contrast, GPR is largely idiosyncratic at short horizons (own share 97.05, FROM = 2.95), and its net position is slightly negative (NET = −1.02), indicating limited short-horizon spillover participation.
Among innovation portfolios, the most striking feature is the vulnerability of MSCI Digital, who’s FROM = 82.72 implies that a large share of its short-horizon variance is associated with shocks from the rest of the system. Consistently, MSCI has the most negative net position (NET = −77.72), making it the strongest net absorber in this band. In comparison, QQQ and ARKK have sizable external exposures (FROM = 50.80 and 48.33, respectively), but both show positive net positions (NET = +33.44 for QQQ; +18.64 for ARKK), implying that they contribute meaningfully to the system even while receiving substantial variance shares. The S&P Moonshots Index is also a net contributor at short horizons (NET = +18.29), with strong outward connectedness (TO = 67.42).
At medium horizons (Panel B of
Table 1), connectedness increases slightly (TCI = 46.70%). The VIX becomes more dominant in directional terms, with TO = 65.18 and NET = +35.06, while its external exposure falls to FROM = 30.12 (own share 69.88). In other words, market-based uncertainty acts as the most important net contributor to variance shares at medium horizons.
Geopolitical risk becomes more system-connected than in the short band: GPR’s FROM rises to 11.65 and its outward connectedness increases (TO = 9.03), though it remains a small net absorber overall (NET = −2.62). On the asset side, MSCI Digital remains the strongest net absorber (FROM = 75.38, NET = −49.65). QQQ continues to show a positive net position (NET = +10.25) with high outward connectedness (TO = 65.06) and substantial external exposure (FROM = 54.81). The S&P Moonshots Index remains a net contributor (NET = +6.15), while ARKK moves close to balance (NET = +0.81) despite a high external exposure (FROM = 55.98), consistent with a more symmetric medium-horizon integration into the variance-share network.
Long horizons (Panel C of
Table 1) exhibit the strongest system-wide interdependence (TCI = 52.52%), indicating that cross-variable variance shares become more important as the horizon lengthens. VIX remains the most prominent contributor: its outward connectedness rises sharply (TO = 105.11) and its net position becomes strongly positive (NET = +78.86) while FROM = 26.25 (own share 73.75). Importantly, TO values can exceed 100 because they are sums of normalized variance shares across multiple receiving variables; this should be interpreted as very strong outward connectedness in the FEVD sense rather than as “more than 100% of its own volatility.” These long-horizon positions indicate that mature-platform innovation exposure (QQQ) remains more system-integrated and relatively balanced, whereas disruptive-growth/frontier exposures (ARKK and Moonshots) become more vulnerable to persistent uncertainty, with MSCI Digital remaining an intermediate but still strongly absorbing profile.
Geopolitical risk becomes materially more relevant at long horizons: GPR’s TO increases to 33.58 and its net position turns positive (NET = +3.47), with a higher external exposure (FROM = 30.12) and a lower own share (69.88) than at shorter horizons. On the receiving side, MSCI Digital remains a net absorber (FROM = 71.13, NET = −28.61). S&P Moonshots becomes a pronounced net absorber (NET = −31.47, FROM = 64.79), and ARKK also remains a net absorber (NET = −24.20, FROM = 62.38). QQQ is close to balanced but slightly positive (NET = +1.95) despite high exposure (FROM = 60.45), indicating that broad large-cap tech is highly interconnected at long horizons, with net contributions roughly offsetting what it receives.
Across horizons, three robust patterns emerge. First, total connectedness rises from the short/medium bands (~45–47%) to the long band (~53%), implying stronger multilateral variance-share interdependence at longer horizons. Second, VIX is consistently the dominant net contributor across all bands, and its outward connectedness increases sharply in the long horizon. Third, GPR is relatively weak at short horizons but becomes more active at long horizons, consistent with geopolitical uncertainty manifesting over longer holding periods. Among innovation portfolios, MSCI Digital is persistently the strongest net absorber, while Moonshots and ARKK become increasingly net absorbing at long horizons, evidence that innovation-intensive portfolios are more exposed to system-level uncertainty dynamics as the horizon lengthens.
5.2. Dynamic Connectedness
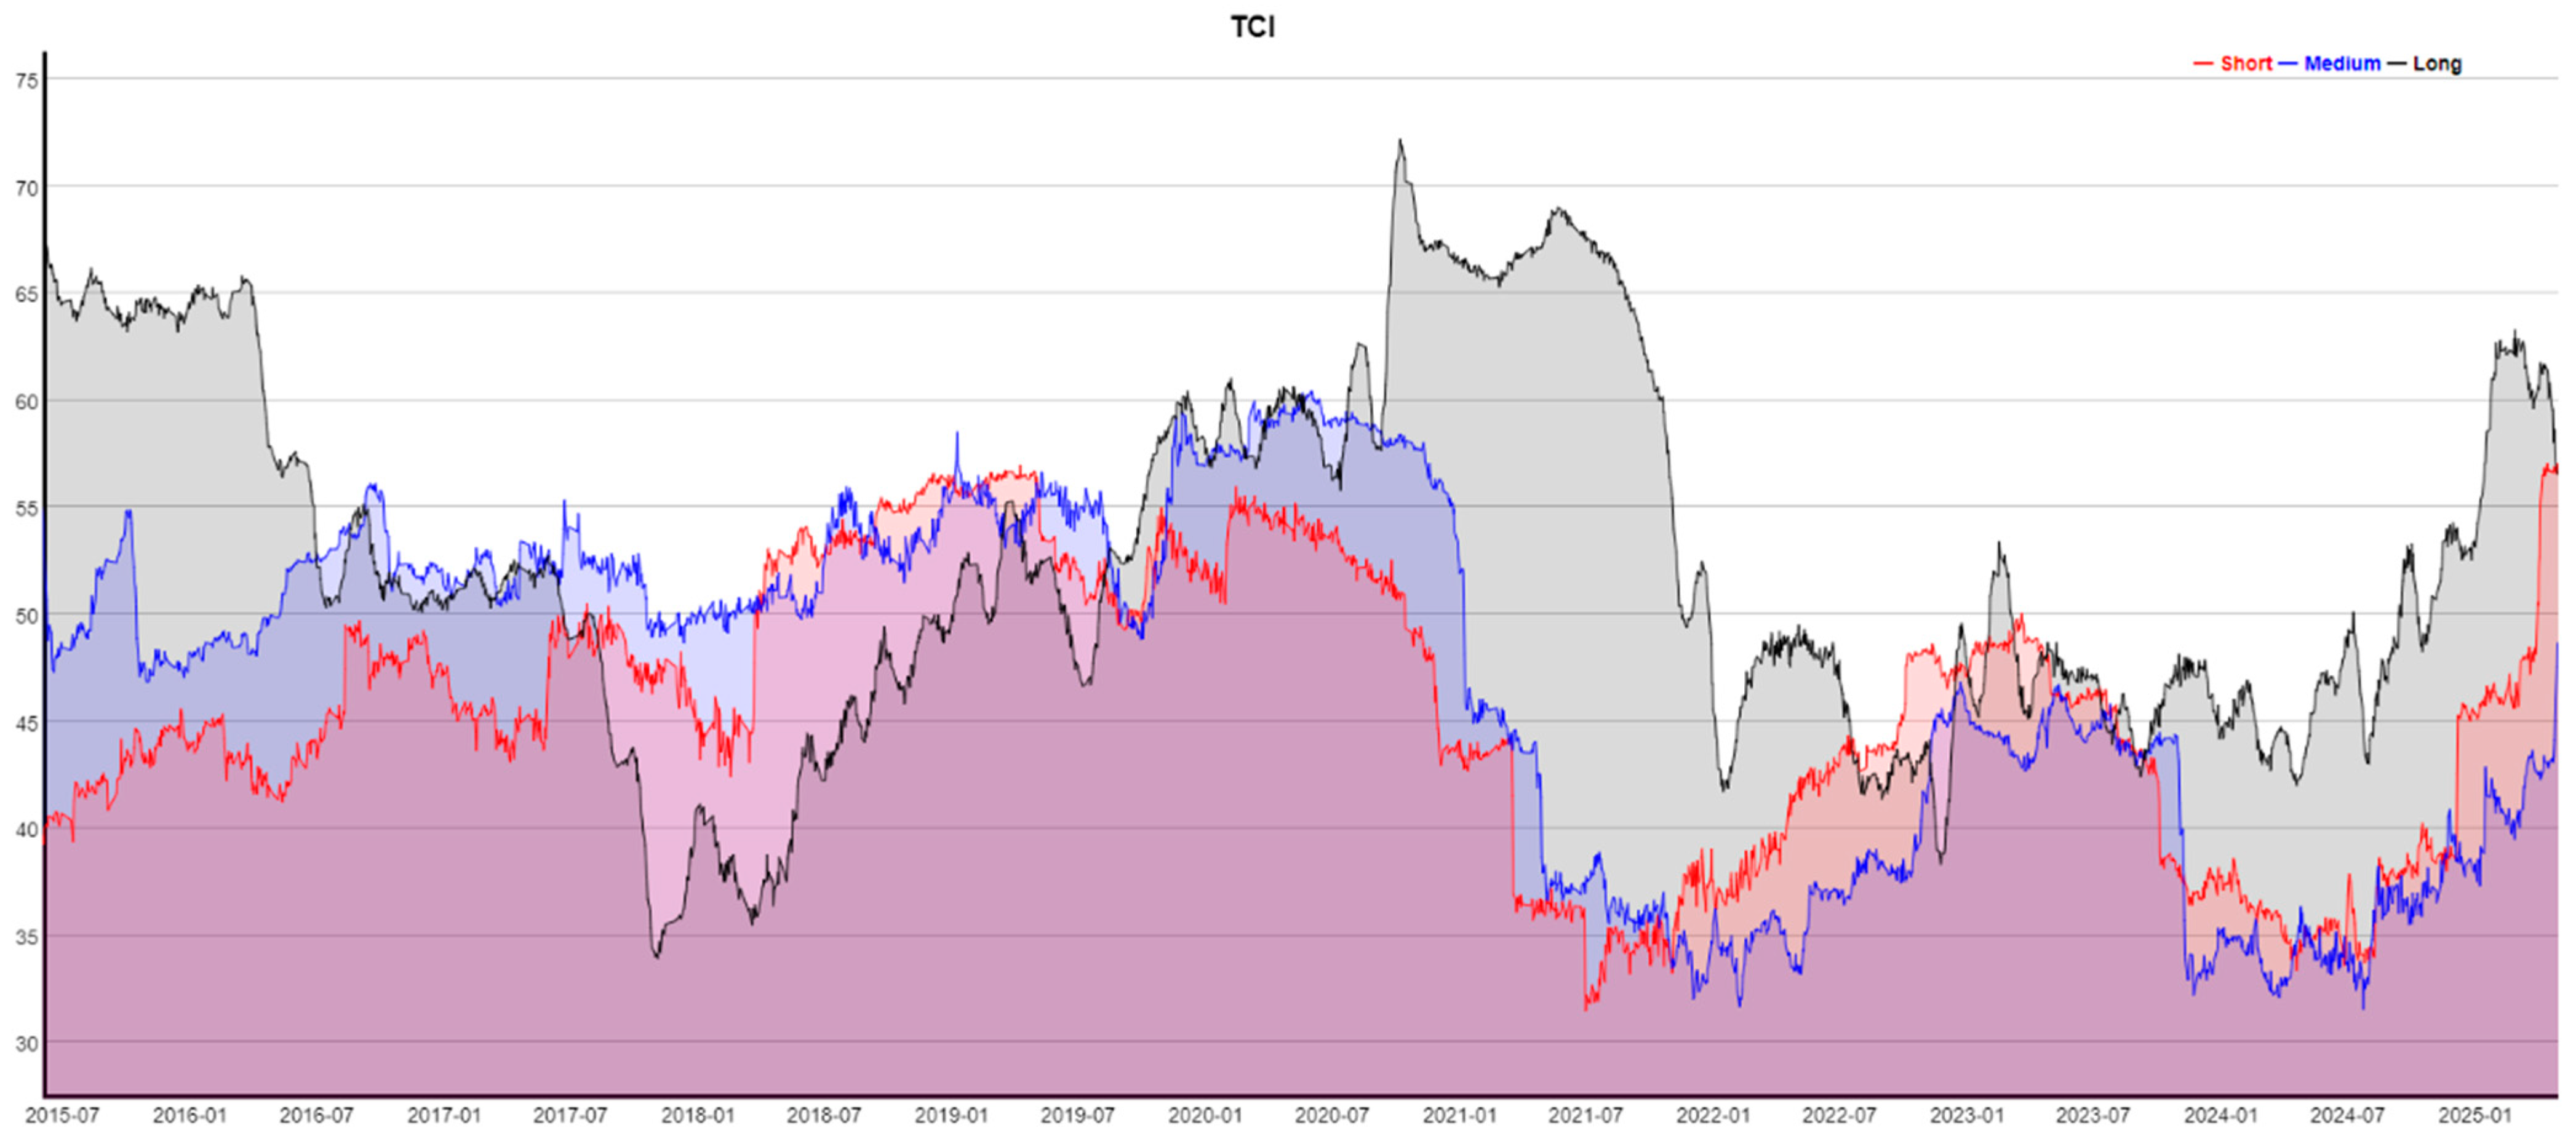
To examine how system-wide interdependence evolves over time, we report the dynamic Total Connectedness Index (TCI) in
Figure 3, computed separately for the short-, medium-, and long-horizon bands (short: <8 trading days; medium: 8–32 days; long: >32 days). The figure tracks how much of the system’s forecast error variance is associated with cross-variable shocks at each horizon, allowing connectedness to vary across regimes.
Three patterns emerge. First, long-horizon connectedness (black line) is persistently higher than short and medium horizons, indicating that system-wide variance-share interdependence is largely driven by slower-moving, persistent components. Long-horizon TCI is elevated during the early part of the sample (2015–2016), declines markedly around 2017–2018, and then rises strongly into 2019–2021, reaching its sample peak around the COVID-19 regime. This behavior is consistent with the idea that large, system-wide stress episodes increase the persistence of cross-market variance sharing, rather than producing only short-lived dependence.
Second, medium-horizon connectedness (blue line) is comparatively stable through 2015–2020 and then experiences a sharp decline around early 2021, after which it remains subdued before gradually recovering into 2023 and beyond. The medium band therefore captures an intermediate layer of connectedness that is sensitive to regime shifts, but does not dominate the system.
Third, short-horizon connectedness (red line) is the most variable across time, with pronounced rises around major stress windows and clear declines during calmer intervals. Short-horizon TCI increases into the late 2019/2020 period and then drops sharply around 2021, followed by a gradual recovery and another notable rise toward the end of the sample (late 2024 to early 2025). Importantly, these movements should be interpreted as time-varying variance-share interdependence (within the connectedness system), not as structural “feedback loops” or causal amplification.
A final feature is the partial convergence across horizons after 2022: the three bands move closer together for extended stretches, reflecting more synchronized connectedness across time scales than in earlier years. By early 2025, connectedness rises again, most visibly in the long-horizon band, suggesting renewed strengthening of persistent cross-market variance sharing.
The regime interpretation becomes sharper when the innovation portfolios are separated by profile rather than grouped together. During the COVID-19 episode, the increase in long-horizon connectedness reflects not only a broad uncertainty shock but also a repricing of business-model durability across innovation segments. QQQ, which is anchored by larger and more liquid platform-oriented firms, appears comparatively more able to re-stabilize as the recovery phase improves earnings visibility and reinforces balance-sheet strength. By contrast, ARKK and S&P Kensho Moonshots represent more disruptive-growth and frontier-innovation exposures, where valuation is more tightly tied to distant cash flows, external financing conditions, and narrative momentum. As these conditions remained fragile even after the initial pandemic shock, their connectedness did not normalize as quickly. MSCI Digital Economy occupies an intermediate position: it benefits from digital-infrastructure and platform demand yet remains strongly exposed to system-wide uncertainty because it sits at the intersection of technology adoption, global business investment, and cross-market risk repricing. This taxonomy-based reading helps explain why the recovery phase did not generate a uniform decline in connectedness across innovation segments.
After 2022, geopolitical uncertainty is better understood as a slower-moving source of valuation pressure rather than a purely contemporaneous trading shock. In innovation-linked markets, its long-horizon relevance is plausibly transmitted through supply-chain fragmentation, export-control and sanctions uncertainty, cross-border semiconductor and digital-infrastructure dependence, delays in strategic capital expenditure, and a more persistent uncertainty premium embedded in long-duration growth valuations.
Overall,
Figure 3 reinforces the static evidence: connectedness is meaningful across all horizons, but it is most pronounced at longer horizons and varies substantially across regimes. The subsequent net directional connectedness results clarify which variables contribute most to these system-level movements at each horizon.
5.3. Economic Interpretation and Policy Implications
The results indicate that innovation-focused portfolios are not homogeneous participants in uncertainty-related variance sharing. Rather, their positions within the connectedness network depend jointly on investment horizon and portfolio type. This distinction is economically meaningful because the four innovation benchmarks considered in this study differ in business maturity, thematic concentration, earnings visibility, and sensitivity to long-run growth expectations. QQQ is relatively closer to a mature platform-oriented innovation allocation, supported by larger firms with deeper liquidity and more established earnings capacity. By contrast, ARKK and the S&P Kensho Moonshots Index are more representative of disruptive-growth and frontier-innovation exposure, where valuations depend more heavily on distant cash flows, narrative momentum, and financing conditions. MSCI Digital Economy occupies an intermediate position, reflecting digital infrastructure, platform, and transformation exposure that is less speculative than frontier innovation, but still highly sensitive to system-wide technology and macro-financial conditions.
This taxonomy helps explain the horizon-specific differences observed in the connectedness results. From a long-duration asset-pricing perspective, uncertainty raises required returns and alters discount-rate expectations, which disproportionately affects assets whose valuations are tied more strongly to distant growth opportunities than to near-term earnings support (
Pástor & Veronesi, 2009;
Coiculescu et al., 2024). This provides a natural explanation for why disruptive-growth portfolios such as ARKK and Moonshots appear increasingly vulnerable at longer horizons, where persistent uncertainty has more time to compress valuation narratives, weaken investor confidence in future adoption paths, and amplify sensitivity to financing conditions. In contrast, QQQ remains more balanced in the long-horizon connectedness network because mature platform-oriented firms retain stronger support from scale, liquidity, and current earnings visibility, even when uncertainty remains elevated. MSCI Digital Economy lies between these two poles: it is less exposed to pure speculative repricing than ARKK or Moonshots yet remains highly integrated with broader uncertainty because digital-investment expectations are closely linked to business confidence, technological diffusion, and system-wide macro-financial conditions.
The stronger long-horizon role of geopolitical risk can also be interpreted more rigorously through real-options and strategic-investment theory. Under heightened uncertainty, firms may delay or scale back irreversible investment, especially in R&D-intensive and strategically exposed sectors, because waiting becomes more valuable when future conditions are less predictable (
Trigeorgis & Reuer, 2017;
Ross et al., 2018). In innovation-linked markets, these effects are unlikely to be transmitted primarily through same-day trading alone. Instead, they accumulate through slower-moving channels such as supply-chain fragmentation, export-control and sanctions uncertainty, cross-border semiconductor dependence, regulatory divergence, and delays in strategic capital expenditure. These mechanisms are particularly relevant after 2022, when geopolitical tensions became more persistent and more closely tied to technology production networks, digital infrastructure, and cross-border investment planning. Within this logic, the relatively weak short-run role of GPR and its stronger long-run connectedness profile are economically consistent: geopolitical shocks may not always dominate immediate repricing, but they can reshape the long-horizon risk environment in which innovation valuations are formed.
Behavioral finance provides a complementary explanation for the stronger and more episodic response of disruptive-growth portfolios. Innovation-themed assets are often partly priced on narratives about future technological dominance, scalable adoption, or breakthrough commercial success. In uncertain environments, investor attention can reallocate quickly, herding can intensify, and flight-to-safety behavior can weaken support for highly narrative-sensitive segments (
Yazdipour, 2010;
Posen et al., 2018). This helps explain why ARKK and Moonshots tend to display more fragile long-horizon positions and why their diversification benefits erode more visibly when uncertainty remains elevated. By comparison, mature platform-oriented exposure is not immune to uncertainty, but it is less dependent on the continuation of highly optimistic thematic narratives.
The COVID-19 episode offers a useful illustration of these mechanisms. The sharp strengthening of long-horizon connectedness around 2019–2021 reflects more than a broad rise in uncertainty; it also captures a repricing of business-model durability across innovation segments. During the recovery phase, mature platform and digital-infrastructure exposures were better positioned to normalize because they benefited from stronger liquidity, greater earnings visibility, and business models that could maintain or expand scale under altered economic conditions. Disruptive-growth portfolios, however, remained more exposed to long-duration repricing, the unwinding of pandemic-era thematic enthusiasm, and the tightening of financing conditions as the policy environment shifted. The result was an uneven post-COVID decoupling process in which some innovation segments re-stabilized more quickly than others.
These results carry practical portfolio implications. For short-horizon risk management, VIX is the more operational benchmark because it remains the dominant contributor to connectedness across bands and is especially relevant for rapid repricing, tactical de-risking, and volatility-sensitive trading overlays. Investors managing short-horizon innovation exposure may therefore rely more heavily on VIX-linked signals, volatility-targeting rules, or tactical hedge adjustments when market-based connectedness intensifies. By contrast, GPR is more informative as a medium- to long-horizon allocation signal than as a same-day hedge indicator. When long-horizon connectedness rises alongside sustained geopolitical stress, investors may need to reassess thematic concentration, cross-border technology exposure, and the appropriate weight assigned to portfolios whose valuations depend strongly on distant growth narratives.
The portfolio differences are equally important for allocation design. QQQ may function as a relatively more resilient core innovation holding because its exposure is anchored by larger, more established firms that remain deeply integrated with the broader market. ARKK and Moonshots, in contrast, should be treated as more uncertainty-sensitive allocations whose risk increases materially when persistent uncertainty compresses long-run growth narratives and raises the discount rate applied to distant cash flows. MSCI Digital Economy remains an intermediate case: it is not purely speculative, but neither is it insulated from broad uncertainty, given its close links to digital transformation, investment cycles, and macro-financial conditions. The key implication is that these portfolios should not be hedged, monitored, or sized as if they represent the same innovation risk.
From a policy perspective, the findings suggest that innovation-linked vehicles should not be monitored as a single technology block. Mature platform, digital-economy, and disruptive-growth segments occupy different positions in the uncertainty network and therefore may absorb or propagate volatility differently across regimes. Macro-financial surveillance may benefit from distinguishing between short-horizon stress amplification, which is more tightly associated with market-implied uncertainty, and long-horizon structural uncertainty, where geopolitical frictions become increasingly relevant through production networks, strategic investment, and regulatory channels. Overall, the evidence suggests that innovation-market fragility depends not only on the amount of uncertainty in the system, but also on which type of uncertainty dominates and over what horizon it persists.
6. Robustness and Sensitivity Checks
To assess the stability of the main findings, the revised analysis conducts several sensitivity exercises. First, we re-estimate the multiscale decomposition using alternative wavelet filters, including Haar and Daubechies specifications, to verify that the ordering of connectedness across horizons is not driven by one basis function. Second, we replace the baseline GARCH volatility filter with an EGARCH specification to allow for asymmetric volatility dynamics. Third, we vary the rolling-window length used in the dynamic connectedness analysis to examine whether the timing of major peaks is sensitive to local sample width. Fourth, we vary the VAR lag order and the forecast-error-variance-decomposition horizon to ensure that the relatively stronger long-horizon role of VIX and the delayed contribution of GPR are not artifacts of one forecasting design. Fifth, we report diagnostic checks for the band-limited VAR systems, including statistical adequacy and stability assessments. Across these exercises, the central qualitative result remains unchanged: connectedness is more pronounced at longer horizons, VIX remains the dominant contributor across bands, and GPR becomes relatively more relevant as the horizon lengthens. At the same time, the revised manuscript treats these results as reduced-form multiscale dependence evidence and not as structural proof of a unique transmission mechanism.
7. Conclusions
This study examined how market-based and geopolitical uncertainty relate to the volatility dynamics of innovation-focused equity portfolios across investment horizons. Using wavelet coherence, we showed that the dependence between uncertainty measures and innovation indices is time-varying, regime dependent, and concentrated more strongly at medium and long horizons than at very short horizons. The coherence evidence indicates that uncertainty–innovation linkages strengthen materially during stress episodes, but it is interpreted here as descriptive time–frequency association and relative timing rather than as structural causality.
We then quantified horizon-specific interdependence using a GARCH–MODWT–VAR connectedness framework. The results show that system-wide connectedness rises with the horizon, with total connectedness increasing from the short and medium bands to the long band. This indicates that cross-market variance-share interdependence is strongest when uncertainty persists rather than when it is confined to short-lived trading turbulence. Across all bands, VIX remains the dominant net contributor, confirming the central role of market-implied uncertainty in shaping the volatility network of innovation-focused assets. By contrast, geopolitical risk is relatively weak at short horizons but becomes more relevant at longer horizons, consistent with the view that its effects accumulate through slower-moving channels rather than through immediate repricing alone.
A key contribution of the revised interpretation is to show that innovation portfolios should not be treated as interchangeable. QQQ, which more closely reflects mature platform-oriented innovation exposure, remains comparatively balanced within the long-horizon connectedness network, suggesting stronger resilience arising from scale, liquidity, and more established earnings support. ARKK and S&P Kensho Moonshots, by contrast, behave more like disruptive-growth and frontier-innovation allocations whose valuations depend more heavily on distant cash flows, thematic confidence, and favorable financing conditions. These characteristics make them more vulnerable when uncertainty persists and long-duration repricing intensifies. MSCI Digital Economy occupies an intermediate position: it is less speculative than frontier-growth exposure, yet still highly sensitive to broad uncertainty because of its close connection to digital transformation, technology investment, and system-wide macro-financial conditions.
The findings also clarify why the distinction between VIX and GPR matters. VIX primarily captures market-based risk appetite and forward-looking volatility expectations, making it especially relevant for short- and medium-horizon repricing. GPR, in contrast, is more plausibly transmitted through long-horizon mechanisms linked to supply-chain fragmentation, export-control uncertainty, sanctions risk, regulatory divergence, cross-border technology dependence, and delayed strategic capital expenditure. In innovation markets, these channels affect expected profitability and financing conditions gradually, which helps explain why geopolitical risk becomes more consequential at longer horizons.
At the same time, market-based uncertainty and geopolitical risk should not be viewed as fully separate long-run forces. Their interaction may be non-linear. Persistent geopolitical shocks can migrate into market-based uncertainty by weakening risk appetite, increasing financing frictions, and raising the discount-rate sensitivity of long-duration assets. Conversely, periods of elevated market stress can amplify the valuation effect of geopolitical news on innovation-focused portfolios by making investors more sensitive to downside scenarios, strategic disruption, and long-run growth uncertainty. Although the present framework does not model this amplification structurally, the evidence is consistent with the view that long-run innovation-market risk is shaped by potentially reinforcing interactions between market fear and geopolitical disruption.
From an applied perspective, the results imply that uncertainty-linked risk in innovation portfolios is not confined to temporary turbulence; it contains a substantial persistent component. For investors and risk managers, this supports the use of multi-horizon monitoring rather than reliance on single-scale dependence measures. VIX is the more relevant benchmark for short-horizon tactical risk control, while sustained increases in GPR and long-horizon connectedness should prompt closer attention to concentration risk, cross-border technology exposure, and the relative weighting of disruptive-growth versus mature-platform innovation allocations. For policymakers, the findings suggest that innovation-linked vehicles deserve closer monitoring as differentiated nodes within broader volatility networks, particularly during regimes of persistent uncertainty.
An important limitation remains that the framework is reduced form and does not explicitly incorporate macro-financial state variables such as policy rates, inflation expectations, liquidity conditions, or funding spreads. Accordingly, the paper documents horizon-dependent connectedness patterns and offers theoretically grounded interpretations, but it does not identify a unique structural transmission mechanism. Future research could extend this analysis by incorporating nonlinear interaction models, firm-level heterogeneity, or additional uncertainty dimensions such as economic policy, regulatory, or climate-related uncertainty. Such extensions would help clarify whether the horizon-dependent patterns documented here generalize across innovation subsectors and whether the interaction between market and geopolitical uncertainty can be modeled more explicitly.