1. Introduction
In recent years, inclusive growth has emerged as a central concept in academic and policy-oriented debates on sustainable development, particularly in emerging and transitional economies. Unlike traditional growth paradigms, which focus primarily on aggregate output expansion, inclusive growth emphasizes the distributional quality of economic progress, equitable access to opportunities, and the integration of social and environmental considerations into growth processes (
Aslam & Ghouse, 2023;
Elsayed et al., 2025;
Xetor & Mensah, 2025). This shift reflects the growing recognition that economic growth detached from social inclusion and environmental sustainability may exacerbate inequality, institutional fragility, and long-term development risks.
Although inclusive growth was initially conceptualized at the macroeconomic level, recent research increasingly highlights the role of firms as key agents of inclusive development. Corporate strategies related to stakeholder engagement, innovation, environmental stewardship, and human capital investment directly influence the creation and distribution of economic benefits within societies (
George et al., 2012;
Kaplan & McMillan, 2020). In this context, firm-level inclusive growth represents a strategic approach to value creation that aligns financial performance with social and environmental responsibilities.
The relevance of firm-level inclusive growth is particularly pronounced in emerging markets, where institutional volatility, uneven regional development, and limited access to finance shape corporate incentives and constraints (
Del Sarto & Ozili, 2025;
Fan et al., 2023;
Hârbu & Hîrbu, 2025). In such environments, inclusive corporate practices can mitigate institutional risks, strengthen stakeholder trust, and enhance long-term resilience (
Annor et al., 2023;
Yeboah et al., 2024). Empirical studies suggest that inclusive growth strategies are closely linked to innovation capacity, strategic foresight, and the development of intangible assets, which collectively support sustainable competitive advantages (
Del Mar Fuentes-Fuentes et al., 2023;
Panya & Petchsawang, 2024;
Xiong et al., 2025). These challenges are further amplified when firms operate under conditions of severe geopolitical and economic disruption.
Importantly, the geopolitical shock of 2022–2023 implies not only quantitative but also qualitative changes in the meaning of inclusive growth at the firm level in the long term. In a sanctioned and increasingly isolated economy, the normative goals of inclusivity may shift from globally oriented ESG benchmarks toward a more sovereignty-driven logic. Under such conditions, inclusive growth is closely associated with maintaining local employment stability, ensuring the continuity of critical industrial capacities, and substituting imported technologies to preserve national industrial sovereignty. This suggests the emergence of a “survival-oriented” or “sovereign” variant of inclusive growth, in which social inclusion and economic resilience take precedence over broader global sustainability aspirations.
In this context, it is important to distinguish between the two conceptual interpretations of inclusive growth. The first, widely represented in the literature, can be referred to as global ESG-oriented inclusive growth, which emphasizes environmental sustainability, stakeholder engagement, and long-term value creation within integrated global markets.
Second, emerging in constrained and geopolitically fragmented environments can be defined as sovereignty-oriented inclusive growth. This perspective prioritizes economic continuity, the preservation of industrial capacity, employment stability, and technological self-sufficiency. Unlike the ESG-oriented model, which assumes openness and integration, sovereignty-oriented inclusive growth reflects adaptation to external constraints and reduced access to global resources.
Despite the growing interest in inclusive growth, significant gaps remain in the literature. First, most existing studies examine inclusive growth at the national or regional level, relying on macroeconomic indicators or composite indices that are not designed for firm-level analysis (
Mkrtchyan et al., 2025;
Saher et al., 2024). Second, firm-level research often relies on ESG ratings as proxies for inclusivity, despite well-documented limitations related to methodological opacity, score divergence, and incomplete coverage of economic and strategic dimensions (
Berg et al., 2022;
Lee & Hess, 2022). Third, empirical evidence on the mechanisms linking inclusive growth practices to firm performance remains fragmented, particularly in emerging markets.
Against these unresolved gaps, Russia provides a particularly informative empirical setting. The Russian economy is characterized by a high industrial concentration, strong dependence on extractive and metallurgical sectors, and significant regional disparities (
Malkina, 2025;
Martyanova & Polbin, 2023). Simultaneously, Russian firms operate under increasing regulatory and institutional pressure to improve ESG performance, enhance transparency, and contribute to social development, especially in the context of sanctions, market reorientation, and state-led industrial policy (
Korechkov et al., 2025;
Shirov et al., 2024;
Vedev et al., 2024). In such an environment, inclusive growth practices may serve as a normative commitment and a strategic mechanism for maintaining legitimacy, resilience, and long-term value creation.
Against this background, this study addresses the need for a systematic and transparent firm-level measurement of inclusive growth. Specifically, this study develops a composite Inclusive Growth Index (IGI) that integrates the financial, environmental, social, organizational, and innovation-related dimensions of corporate performance. By distinguishing between achieved strategic resilience and forward-looking business model potential, the proposed framework captures both the current outcomes and long-term capabilities associated with inclusive growth.
This study has three interrelated objectives. First, it operationalizes inclusive growth at the firm level by constructing a multidimensional and replicable index. Second, it empirically applies the index to major Russian metallurgical and mining companies to examine cross-firm heterogeneity in their inclusive growth performance. Third, it explores the strategic and institutional mechanisms through which inclusive growth practices are associated with firm-level resilience and long-term potential in emerging markets.
This study contributes to the literature in several ways. First, it bridges the gap between macro-level inclusive growth frameworks and micro-level corporate analysis by providing a firm-level measurement tool based on publicly available data. Second, it extends the research on sustainability and corporate performance by moving beyond aggregate ESG scores and explicitly linking inclusive growth to strategic resilience and innovation-driven potential. Third, it enriches the emerging markets literature by offering new empirical evidence from Russia, a context that remains underrepresented in studies on inclusive growth and corporate sustainability.
The remainder of this paper is organized as follows.
Section 2 reviews the theoretical foundations of firm-level inclusive growth and develops research hypotheses.
Section 3 discusses existing approaches to measuring inclusive growth and identifies the methodological gaps.
Section 4 presents the methodology and data used to construct the Inclusive Growth Index.
Section 5 presents the discussion of results, including theoretical implications and limitations.
Section 6 concludes the paper.
2. Literature Review and Hypotheses
2.1. Theoretical Foundations of Firm-Level Inclusive Growth
Inclusive growth has no universally accepted definition in the academic or applied literature. Initially introduced by the World Bank, the term was applied to countries and regions and referred to a growth model capable of reducing poverty and inequality through equitable opportunity structures and the protection of vulnerable groups in the labor market (
Aslam & Ghouse, 2023;
Elsayed et al., 2025;
Ianchovichina & Lundstrom, 2009;
Xetor & Mensah, 2025). While originally macroeconomic in nature, inclusive growth increasingly incorporates the micro-level behavior of firms, particularly in emerging markets, where institutional environments shape corporate incentives. Inclusive growth is closely related to sustainable development; however, scholars distinguish inclusive growth strategies, which seek an equitable distribution of economic benefits, from inclusive sustainable growth strategies, which additionally integrate environmental protection and long-term ecological resilience (
Dörffel & Schuhmann, 2022;
Xian, 2024;
Zeb et al., 2025). Inclusive sustainable growth builds synergies among economic progress, social cohesion, and environmental preservation, emphasizing green innovation, circular economy principles, biodiversity conservation, and climate-change adaptation (
Elhaj et al., 2025;
Han & Gao, 2024;
Razzak et al., 2022;
Zaman et al., 2025). In emerging economies, inclusive growth is viewed as the mechanism enabling a “just transition,” allowing countries and firms to progress toward sustainable development without sacrificing competitiveness (
Abbassi & Benhamed, 2025;
Xetor & Mensah, 2025).
Stakeholder Theory provides a foundational lens for understanding inclusive growth at the firm level.
Mitchell et al. (
2015) argue that effective stakeholder engagement improves value creation by incorporating diverse stakeholder needs into corporate decision-making.
Harrison et al. (
2015) underscore that stakeholder-oriented management promotes social well-being, fairness, and justice, which are core principles of inclusive growth.
Bridoux and Stoelhorst (
2022) state that organizations focusing on stakeholder well-being can simultaneously improve financial and social welfare outcomes. The ethical extensions of Stakeholder Theory further reinforce its relevance.
Valentinov (
2023) highlights that aligning organizational practices with universal human interests helps reduce institutional conflict and strengthens trust, which is an important condition for inclusive development.
Reynolds (
2024) shows that environmental sustainability initiatives based on stakeholder engagement improve both firm outcomes and community welfare.
The relationship between inclusive growth and value creation depends heavily on the institutional framework.
Sabir and Qamar (
2019) demonstrated that sustainable institutions enhance resource allocation and support inclusive development.
Khan et al. (
2022) reinforce this argument by showing that egalitarian institutional structures are essential for reducing social inequality. Innovation plays a critical role in creating shared value at the firm level.
Lichtenthaler (
2022) argues that effective data management stimulates innovation, which simultaneously enhances economic, social, and environmental outcomes.
At the corporate level, inclusive growth is increasingly conceptualized as long-term, sustainable, and less volatile business expansion that generates value for stakeholders.
Kaplan and McMillan (
2020) equate firm-level inclusive growth with the balanced pursuit of profit, social well-being, and environmental responsibility. These theoretical foundations naturally raise the question of how inclusive growth translates into concrete corporate outcomes.
2.2. Mechanisms Linking Inclusive Growth to Corporate Performance
The effectiveness of these mechanisms, however, critically depends on the institutional environment in which firms operate. Several mechanisms explain how inclusive growth can improve firm outcomes.
Inclusive business models expand access to employment, education, and financial services for previously underserved groups, fostering human capital development (
Li & Gao, 2025;
Yang et al., 2024).
Adomako and Tran (
2025) and
Kelvin-Iloafu et al. (
2023) highlight that fostering innovation competencies and intellectual capital contributes to sustained productivity improvement. Firms that uphold human rights and support creativity generate positive spillovers in workforce development, which strengthens long-term performance.
Inclusive practices enhance firms’ abilities to identify new markets and emerging risks.
Del Mar Fuentes-Fuentes et al. (
2023) demonstrate that inclusive business models increase “strategic foresight,” enabling firms to create long-term value by acknowledging technological, social, and environmental dynamics. Thus, innovation-driven inclusive growth forms a pathway to competitive advantage (
Xiong et al., 2025).
Environmental and social practices, such as greenhouse gas reduction, pollution control, and community engagement, reduce operational and regulatory risk.
Naumova and Silkin (
2023) show that such practices improve financial performance and valuation in high-impact sectors. CSR initiatives strengthen corporate reputation and trust, reduce idiosyncratic risk, and improve stakeholder confidence (
Susilo et al., 2019).
Intangible assets, including reputation, human capital, and strategic partnerships, shape the firm’s valuation.
Choi and Lee (
2021) note that future growth uncertainty increases the importance of intangible drivers for firms in the early stages. Thus, inclusive practices constitute a form of intangible capital that enhances the market valuation.
The literature on growth performance reinforces the connection between firm growth and valuation. Sales growth explains a significant share of the variation in firm value (
Eeckhout, 2025;
Liviani & Rachman, 2021), while financial indicators such as EBITDA remain critical determinants of valuation (
Feng, 2023;
Rashwan et al., 2025). However, the capital structure can moderate this relationship:
Cai et al. (
2025) and
Schrijvers and Vogelaar (
2025) find that excessive leverage weakens the positive effect of corporate growth on valuation. Therefore, inclusive growth may strengthen long-term firm value only when it is supported by sound financial management.
2.3. Inclusive Growth in Emerging Markets: Institutional Perspective and the Case of Russia
Russia provides a particularly informative context for this study. The Russian economy is characterized by the following:
High industrial concentration and dependence on extractive sectors (
Malkina, 2025);
Russian corporations face increasing pressure to maintain social legitimacy through environmental compliance, community development, and human capital investment. As in other emerging markets, inclusive corporate practices in Russia help firms mitigate institutional risk, secure access to capital, and maintain operational stability. Accordingly, Russia offers an ideal empirical setting for studying inclusive growth as a strategic value-creating mechanism.
Accordingly, the Russian context highlights an important conceptual tension in the inclusive growth literature. While mainstream frameworks emphasize environmental stewardship, global stakeholder engagement, and climate-related objectives, firms operating under sanctions may prioritize inclusivity through workforce preservation, regional economic stability, and technological self-sufficiency. This divergence suggests that inclusive growth in emerging markets exposed to geopolitical shocks may follow alternative normative trajectories that remain underexplored in existing firm-level studies.
2.4. Measurement Approaches and Conceptual Challenges
The measurement of inclusive growth remains complex because of its multidimensional nature.
Mitra and Das (
2018) proposed the Inclusive Growth Index (IGI), which integrates indicators of expansion, sustainability, equality of access, and efficiency.
Samir Saad (
2024) highlights the conceptual ambiguity of inclusivity and the absence of universally accepted metrics. For firms, inclusive growth assessment often relies on indices that capture inequality, employment structure, environmental practices, innovation, and stakeholder engagement.
These methodological limitations underscore the need for systematic, firm-level measures of inclusive growth, particularly in emerging markets, where data constraints are more binding.
Existing studies predominantly examine inclusive growth at the macroeconomic level, whereas firm-level analyses remain scarce. The mechanisms linking inclusive practices to corporate financial outcomes have not been sufficiently explored, especially in emerging markets. Moreover, despite its evolving sustainability agenda, Russia remains understudied in the literature.
Based on the theoretical foundations and empirical evidence reviewed above, we formulated the following hypotheses:
H1. Firms with stronger inclusive growth practices exhibit higher values in the long term.
H2. The positive relationship between inclusive growth and firm performance is mediated by innovation capacity.
H3. Institutional conditions in emerging markets amplify the impact of inclusive growth on firm performance.
Given institutional volatility and stakeholder expectations, inclusive practices in Russia and similar markets play a greater role in risk mitigation and long-term value formation (
Kafouros et al., 2023;
Mao et al., 2024;
Odei, 2024;
Salloum et al., 2025). These limitations motivate the development of a systematic, transparent, and empirically grounded measurement framework, which is presented in the next section.
While the dominant literature conceptualizes inclusive growth within ESG frameworks, these approaches implicitly assume stable institutional conditions and access to global markets. However, recent developments in emerging economies suggest the need for a more context-sensitive interpretation of the results.
In particular, under conditions of external constraints and geopolitical fragmentation, inclusive growth may take the form of a sovereignty-oriented model, where the emphasis shifts toward resilience, domestic value chains, and strategic autonomy. This distinction highlights a conceptual gap in the literature, which this study aims to address by integrating resilience and long-term potential within a unified measurement framework.
3. Measurement of Inclusive Growth
This section provides a structured review of existing approaches to measuring inclusive growth by synthesizing regional, national, and firm-level methodologies.
Although inclusive growth is widely discussed in academic and practitioner-oriented literature, a unified methodology for constructing an inclusive growth index remains absent. Two factors explain this gap: the limited public availability of firm-specific data, particularly in developing markets, and the substantial heterogeneity of companies across industries, sizes, and institutional contexts (
Dörffel & Schuhmann, 2022). Similar to the measurement issues documented in studies of sentiment and reputation, where definitional ambiguity and data bias generate cumulative errors (see p. 4 in the reference article), inclusive growth measurement faces both conceptual and operational challenges.
Several institutions have constructed macro-level indices that focus on socioeconomic inclusivity. The sustainable human development index proposed by
Blancard and Hoarau (
2013) evaluates life expectancy, knowledge, quality of life, and carbon footprint using DEA methods but remains oriented toward human capital rather than inclusive growth in a broader sense. The World Economic Forum’s index spans education, infrastructure, corruption, financial intermediation, entrepreneurship, employment, and fiscal transfers (
World Economic Forum, 2017). Its advantages are universality and cross-country comparability, although it is not designed for firm-level assessment. UNCTAD’s index, developed with Mastercard (
Thomas & Hedrick-Wong, 2019), integrates indicators of employment, business diversity, minority inclusion, income distribution, and social service coverage but partially relies on proprietary data, which reduces reproducibility.
These macro-level tools clarify the multidimensional nature of inclusivity but provide limited guidance for operationalizing inclusive growth in firms.
Firm-level research has offered fragmented approaches. While many indicators capture elements of inclusive growth, a consistent methodology for constructing an aggregated index remains undeveloped (
Butnariu & Avasilcai, 2015).
ESG ratings, which are often used as proxies, exhibit fundamental limitations. They omit financial and business-model indicators essential for evaluating inclusive growth and cannot measure effectiveness across the economic, social, and environmental dimensions. High divergence in ESG scores arises from differences in measurement (56%), component selection (38%), and weighting (6%), while the “halo effect” inflates the category-level scores (
Berg et al., 2022). Furthermore, reliance on non-public data and methodological opacity restricts their academic applicability (
Berg et al., 2022;
Lee & Hess, 2022).
Consulting firms have proposed several frameworks linking inclusive development with corporate performance. The BCG’s Total Societal Impact (TSI) evaluates economic value, consumer well-being, ethical behavior, environmental sustainability, social empowerment, and governance (
BCG Global, 2020). The approach emphasizes public data and stakeholder orientation but does not sufficiently account for human and intellectual capital. The BCG Vitality Index assesses the potential and capacity for growth using indicators across strategy, technology, human capital, and organizational capital, although reliance on non-public data limits replicability (
The Future 50: Companies Built for Growth in Uncertain Times|Fortune, 2024). McKinsey’s model of forward-looking resilience includes operational, technological, reputational, business model, organizational, and financial dimensions and aligns with the long-term strategic horizon patterns identified by
Barton et al. (
2017). Updated ambidexterity-based approaches capture crisis resilience and innovation potential (
Razzak et al., 2022).
These frameworks offer managerial insights but lack the transparency or methodological rigor required for academic measurement.
Among scholarly contributions, the inclusive growth index by
Butnariu and Avasilcai (
2015) integrates economic, social, and environmental indicators, covering most conceptual domains of inclusive growth. Its limitation is its reliance on expert weighting, which complicates validation. The Sustainable Balanced Scorecard (SBSC), which extends the traditional BSC, incorporates strategic orientation, stakeholder engagement, sustainability considerations, and ambidexterity (
Kaplan & McMillan, 2020). Empirical applications show that the SBSC enhances the alignment between performance metrics and inclusive development goals, supports stakeholder dialogue, and strengthens benchmarking practices (
De Villiers et al., 2016;
Journeault, 2016). CSR- and SDG-based approaches (
Lee & Hess, 2022;
Saulick et al., 2023) assess companies’ progress toward sustainability objectives but insufficiently integrate business and economic indicators that are fundamental for inclusive growth. Alternative sector-specific constructs, such as antifragility-based operational resilience indices (
Bravo & Hernández, 2021), capture long-term adaptability but do not fully map onto the inclusive growth frameworks.
As in composite reputation indices, where normalization and weighting directly shape the resulting measure, inclusive growth indices require methodological consistency. Common normalization techniques include Z-metrics, min–max scaling, benchmark distances, and year-over-year changes. Weighting approaches range from equal weights to DEA, PCA, unobserved component models, and expert-based procedures such as Delphi or BAP (
Zhou et al., 2012). Linear aggregation remains dominant, although geometric aggregation is occasionally used.
No unified approach exists for constructing an inclusive growth index that simultaneously satisfies conceptual completeness, methodological transparency, data reproducibility, and empirical robustness across macro- and firm-level methodologies (
Table 1). Existing frameworks either lack fully developed indicator architectures, rely on expert judgment, or provide incomplete coverage of the inclusive growth domains. Consequently, there remains a clear need for a systematic, empirically grounded measurement framework capable of capturing inclusive growth at the company level.
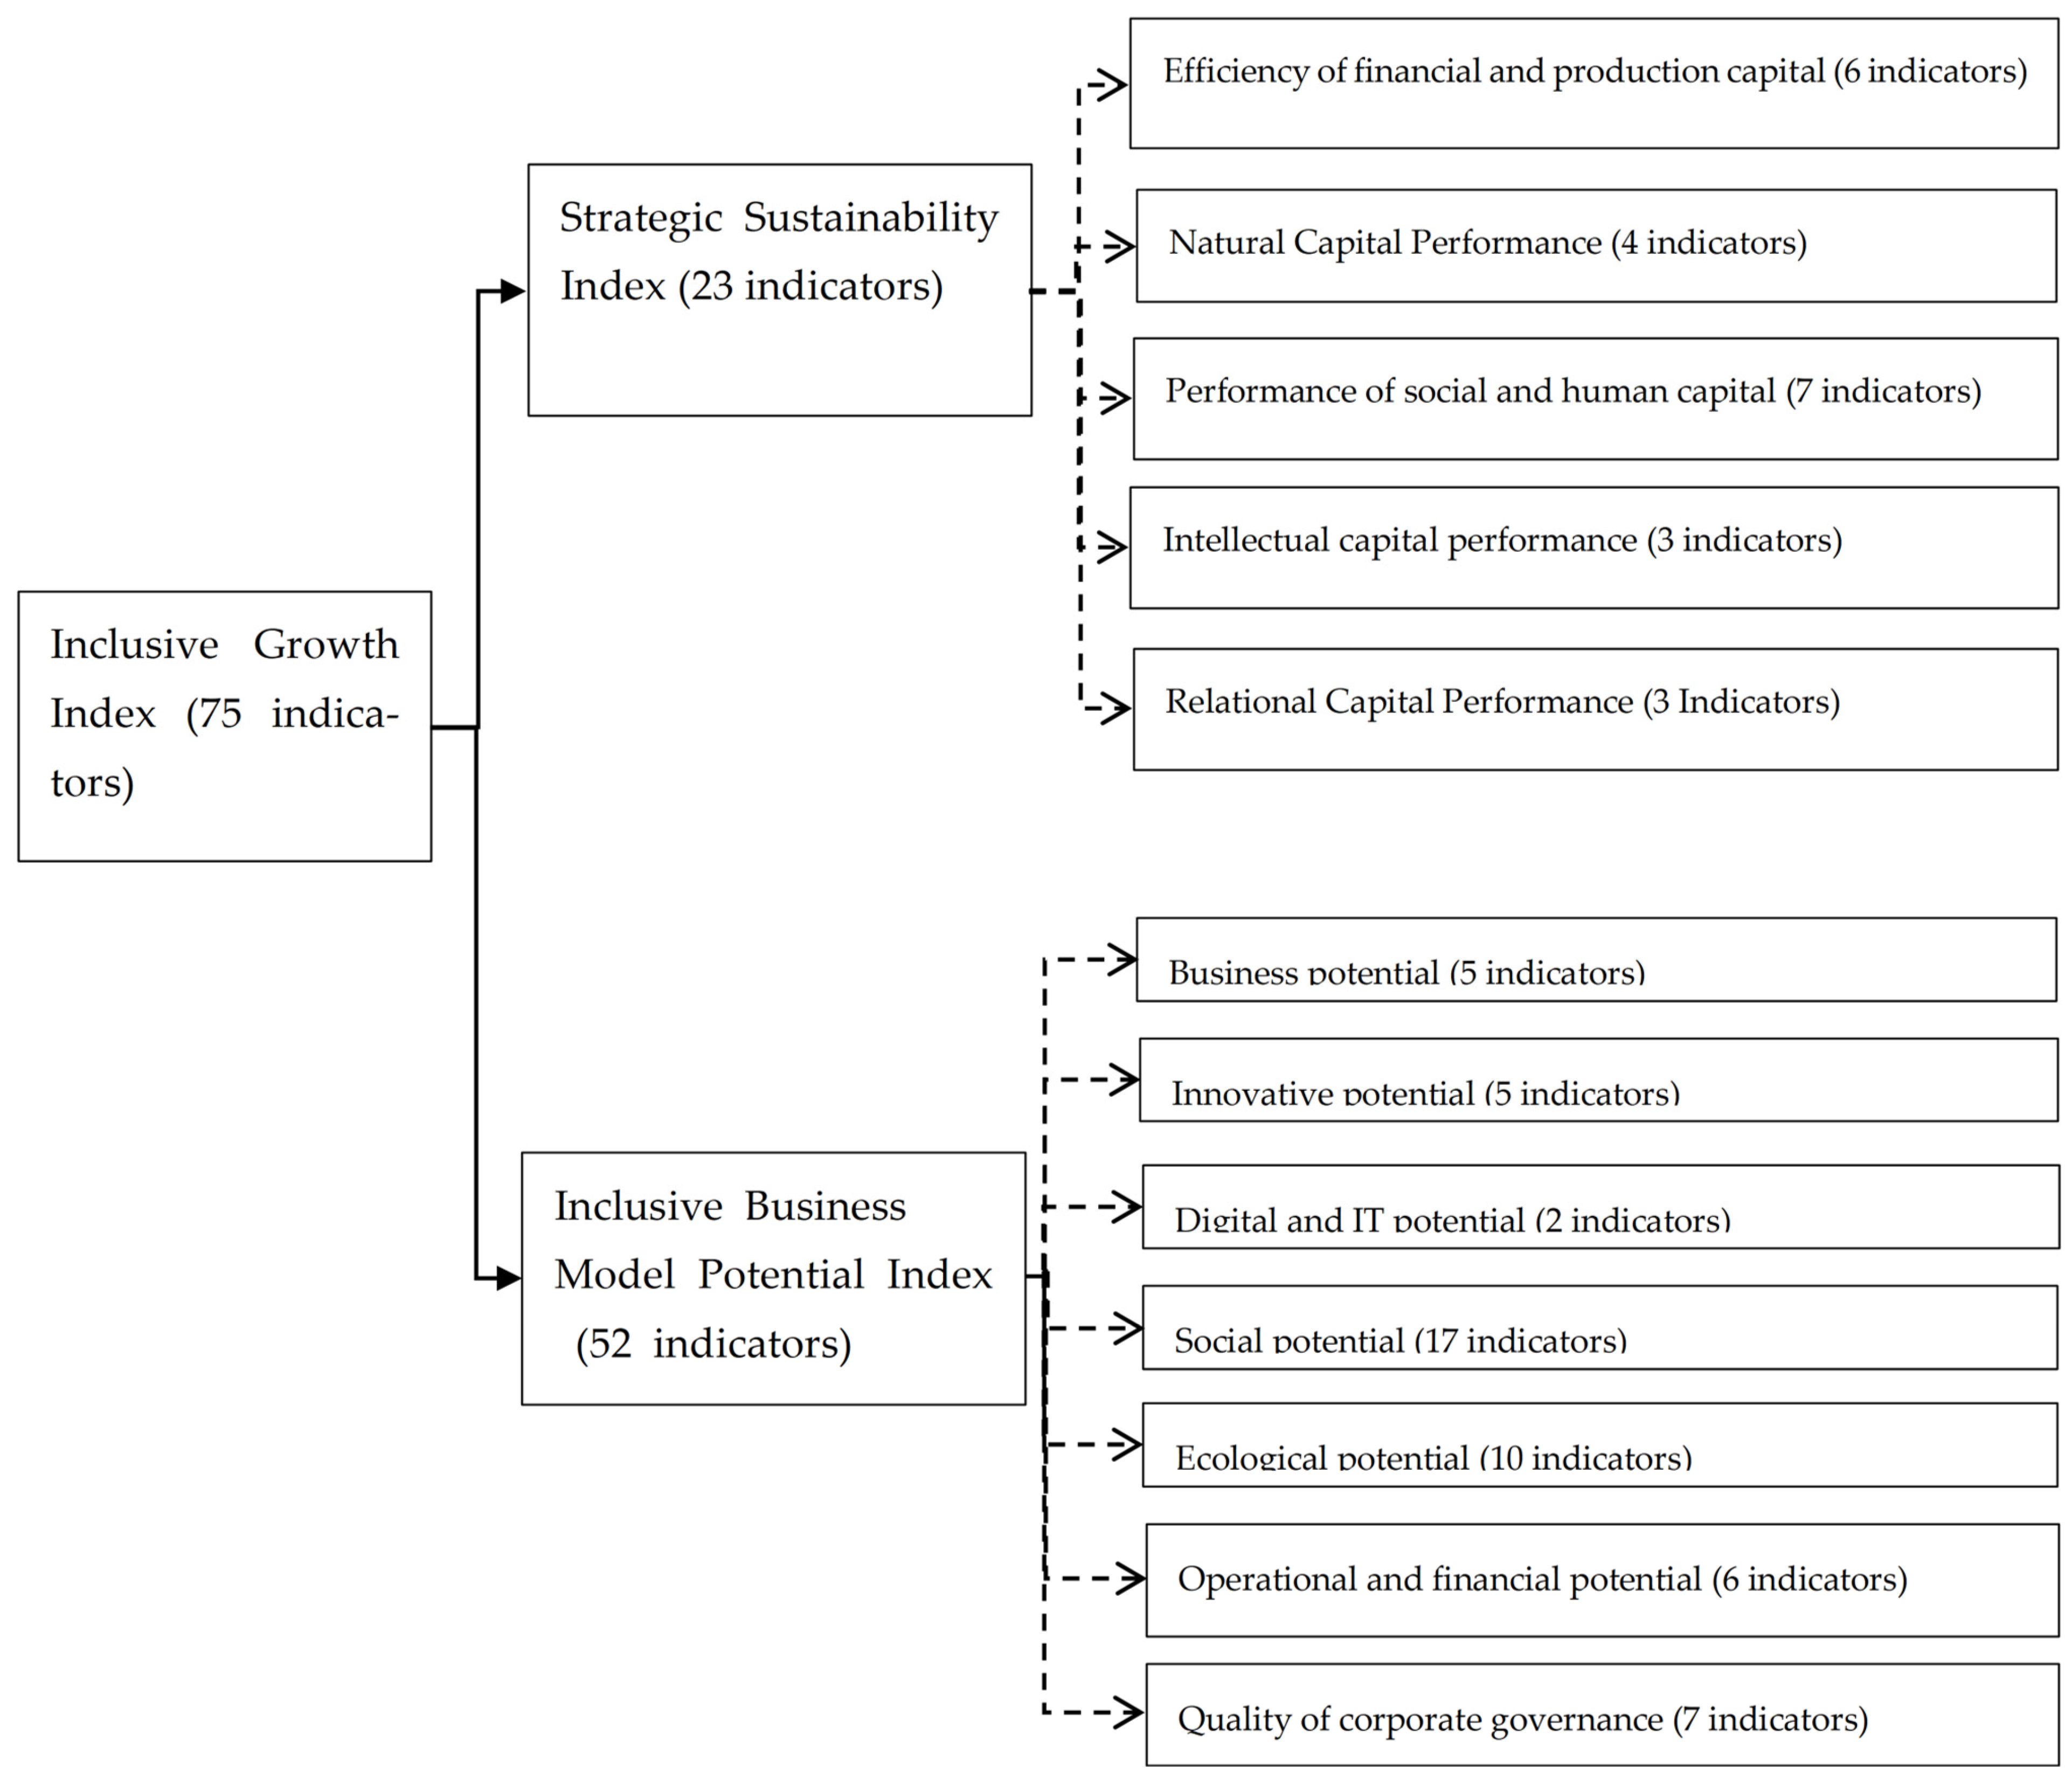
The IGI is designed to capture companies’ adherence to inclusive growth strategies and the long-term potential of their business models. Let (
) denote the Inclusive Growth Index for company (
) (
Figure 1).
By construction, the IGI is composed of two equally weighted sub-indices: the Inclusive Strategic Resilience Index (ISR) and the Inclusive Business Model Potential Index (IRP). Formally,
where geometric aggregation mirrors the logic applied in the measurement (the cumulative representation of component scores).
Each sub-index consists of a set of normalized and weighted indicators representing the financial, social, environmental, organizational, human, intellectual, and relational aspects of inclusive growth. Formally,
where (
) and (
) denote normalized indicator values for company (
), and (
), (
) are weighting coefficients.
The proposed index reflects both dimensions of inclusive growth. The ISR component captures short-term resilience and operational continuity, which are central to sovereignty-oriented inclusive growth, whereas the IRP component reflects long-term capabilities aligned with traditional ESG-oriented approaches.
This structure allows the index to capture the coexistence and potential divergence of these two conceptual models within a single analytical framework.
3.1. Index Structure
Indicator selection is grounded in a comprehensive review of methodological documents and reporting standards, the Six Capitals framework (
IFRS Foundation, 2013), IFRS S1/S2 sustainability disclosure standards, GRI standards, maturity models for organizational and sustainability resilience, and long-term development frameworks (
McKinsey Global Institute, 2024).
3.2. Data Description
The analysis relies on company-level financial and non-financial disclosures from Russian firms in the metallurgical and mining sectors. The source documents included:
- (1)
Integrated reports prepared under IFRS;
- (2)
Non-financial (sustainability) reports prepared in accordance with GRI;
- (3)
Annual financial statements and management reports;
- (4)
Investor and shareholder presentations;
- (5)
Analyst reports issued by investment banks;
- (6)
Open-source disclosures published on corporate websites.
These sources provide quantitative indicators for each of the six forms of capital (financial, manufactured, intellectual, human, social, and organizational) and qualitative assessments of social responsibility, environmental management, climate risk mitigation, stakeholder relations, and strategic foresight.
Following the principle discussed by
Lee and Hess (
2022), missing indicator values are interpreted as a lack of disclosure caused by underperformance or low transparency. Thus, undisclosed indicators were assigned a value of zero.
The resulting dataset comprises a balanced panel of metallurgical and mining companies, allowing the construction of sub-indices ISR and IRP for each firm and subsequent comparative and longitudinal analyses.
3.3. Indicator Standardization, Weighting Scheme, Aggregation Method
As the indicator values are expressed in heterogeneous units, standardization is required to ensure comparability. Following the Z-metric method (
Zhou et al., 2012),
where (
) is the original value of the indicator (
) for company (
), and (
) and (
) are its sample mean and standard deviation.
Outlier values are reassigned to the interval ([−2, 2]), if necessary, to prevent distortion of subindex values.
Additionally, a rescaling procedure is applied following (
Casas i Klett & Cozzi, 2020) to normalize the indicators to the interval ([0, 100]).
Values close to 100 represent strong inclusive growth performance, while values near 0 indicate weak performance.
Consistent with the methodological rigor of the state-space estimation approach, the weighting procedure is formally defined as follows:
Each subindex is calculated using linear aggregation of Equations (2) and (3). The final IGI is aggregated geometrically to preserve multiplicative interactions between strategic resilience and strategic potential in Equation (1).
If a company does not disclose a required indicator, its value is set to zero, following the interpretation that a lack of data implies underperformance or weak transparency (
Lee & Hess, 2022). This approach introduces an explicit transparency adjustment, which is analogous to the correction for measurement noise in state-space estimation (Kalman smoothing) that identifies unreliable signals near zero.
The index is constructed for the metallurgical and mining industry (MMI), which plays a significant role in the Russian economy and is characterized by high capital intensity, environmental and climate risk exposure, and the critical importance of human and relational capital (
MacDiarmid et al., 2018;
Grishunin et al., 2022). Industry specificity affects indicator selection and weighting, consistent with the logic that sector-specific shocks change the noise structure in financial signals, as shown in the IJFS methodological analysis.
The results of the IGI are evaluated using radar charts, which allow for the comparison of companies across integral categories, identification of weaknesses and strengths, and benchmarking relative to the industry’s average.
To ensure statistical validity, panel unit root tests and non-parametric significance tests were applied, as reported in
Section 4.
4. Results
This section presents the empirical results of the Inclusive Growth Index (IGI) calculation for seven Russian metallurgical and mining companies over 2021–2024.
4.1. Sample Description
The sample includes the largest Russian metallurgical producers, all of which maintain relatively high levels of financial and non-financial disclosure (
Table 2). These firms represent a substantial share of the national metallurgical output and provide an appropriate empirical setting for analyzing inclusive growth in a constrained and sanction-affected environment.
The analysis covers the period 2021–2024, allowing for the identification of structural changes associated with the external shock of 2022. Owing to disclosure restrictions in 2022–2024, complete information for all indicators was not available for every firm. In accordance with the data treatment approach described in the Methodology section, missing indicators were assigned a value of zero.
4.2. Descriptive Dynamics of Inclusive Growth
This section presents the dynamics of the Inclusive Growth Index (IGI) and its components, the Strategic Resilience Index (ISR) and the Inclusive Business Model Potential Index (IRP), over the period 2021–2024.
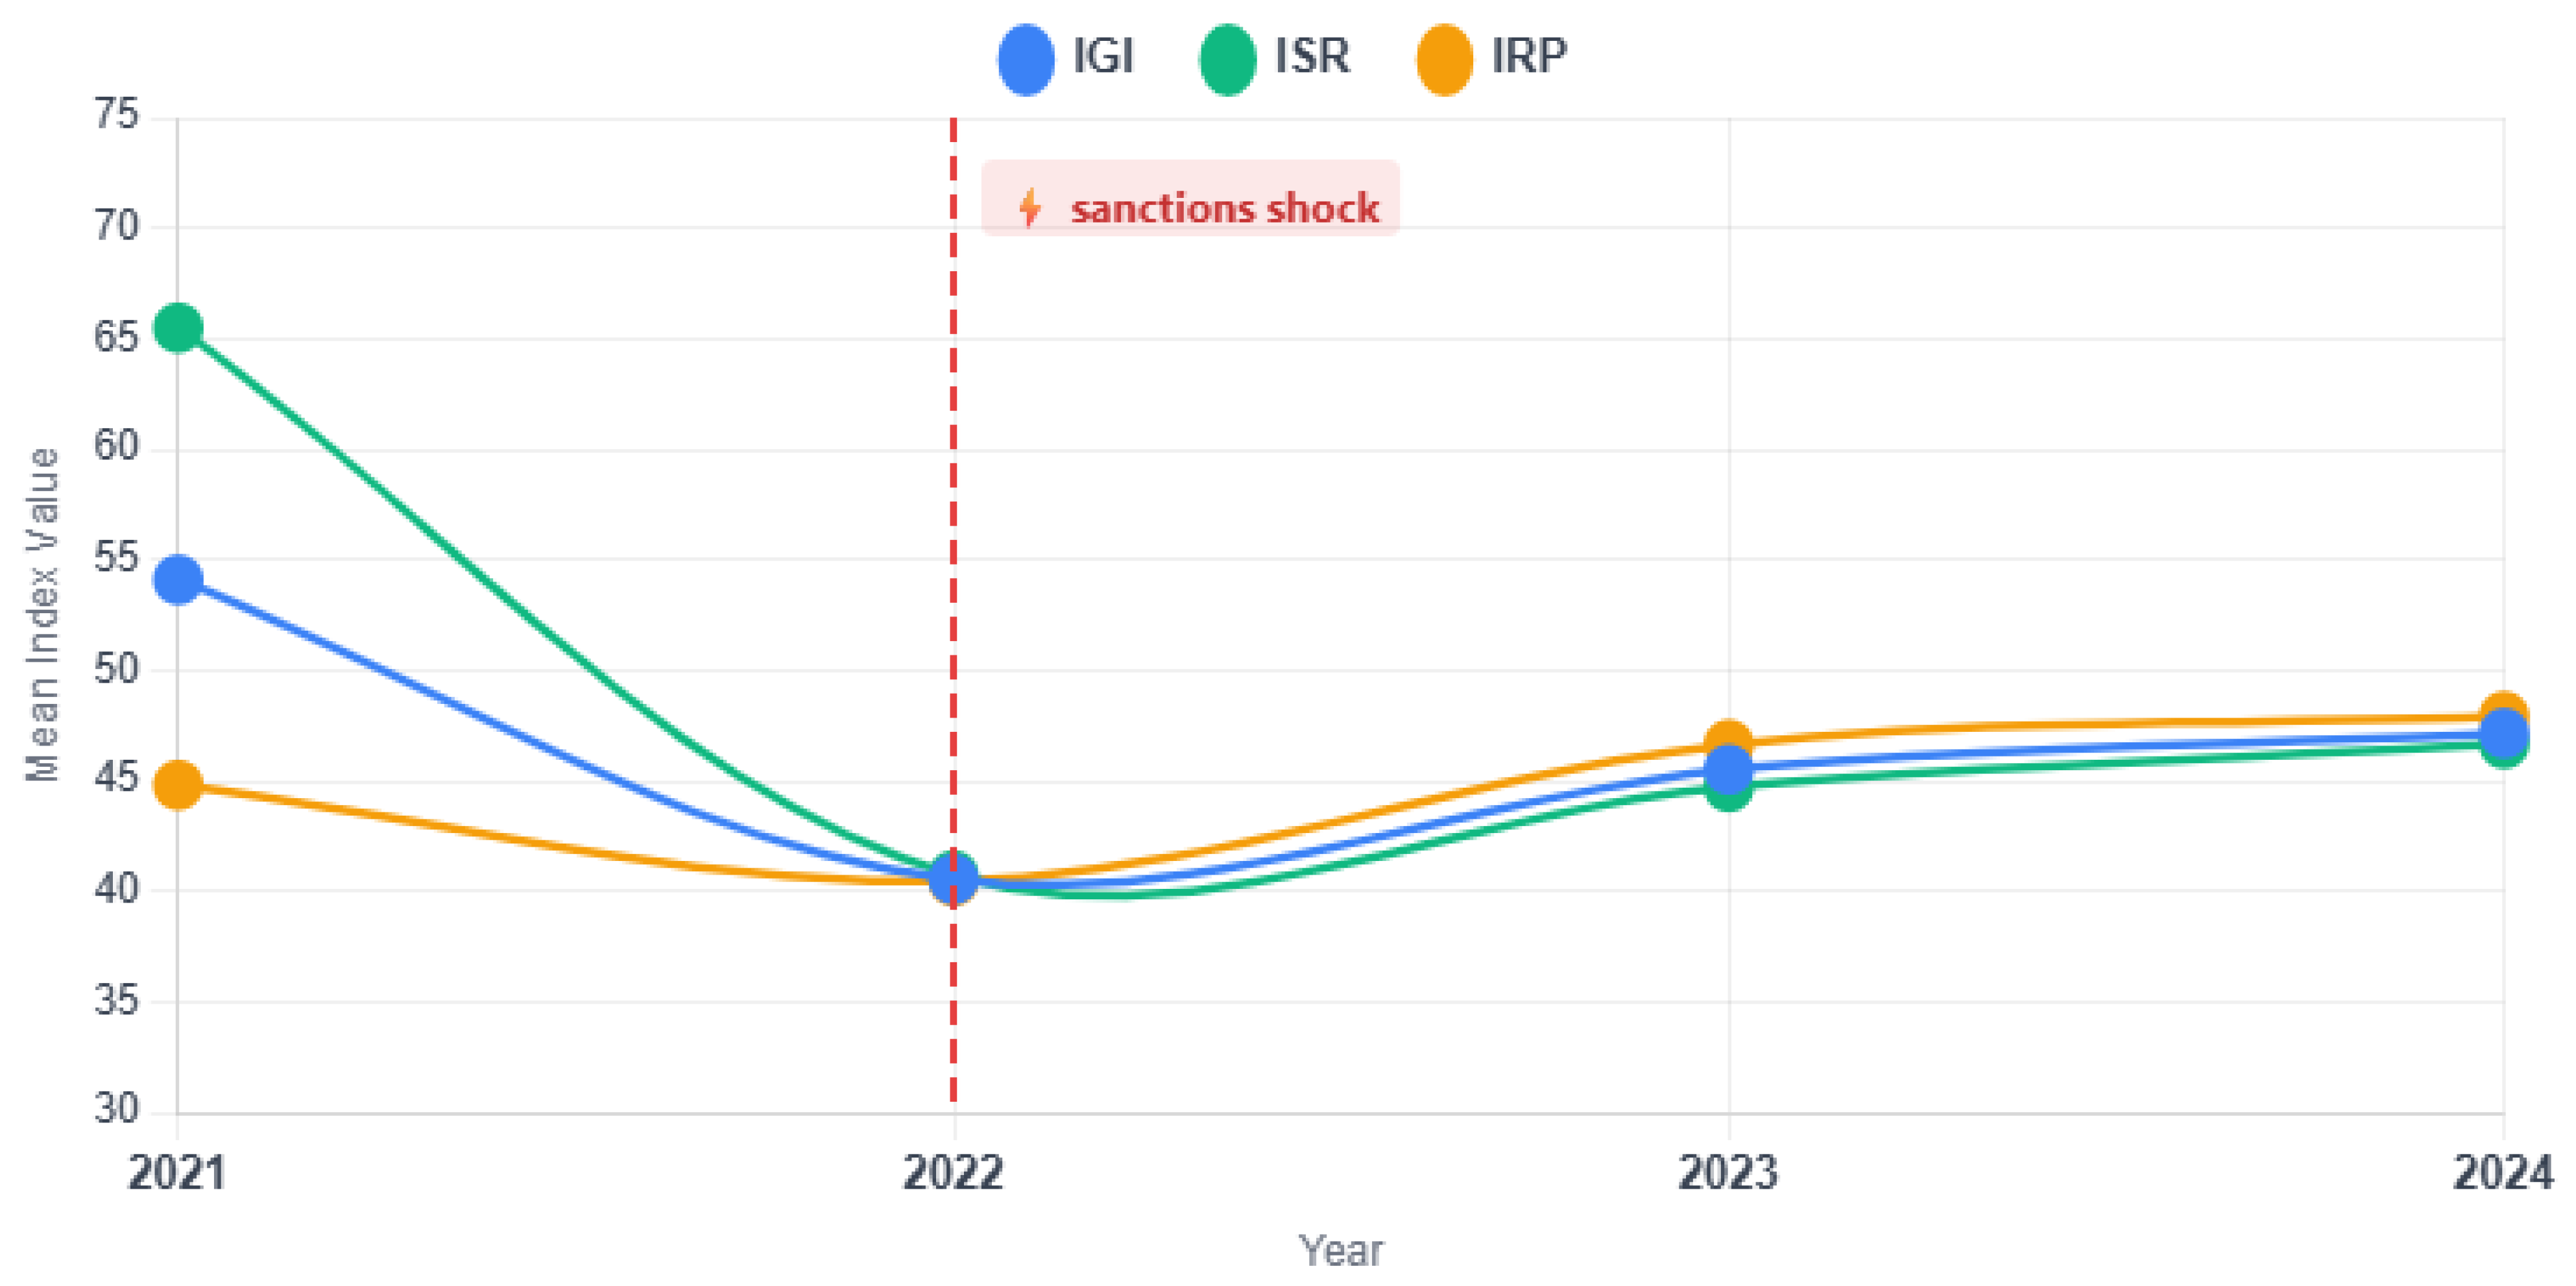
As shown in
Table 3 and
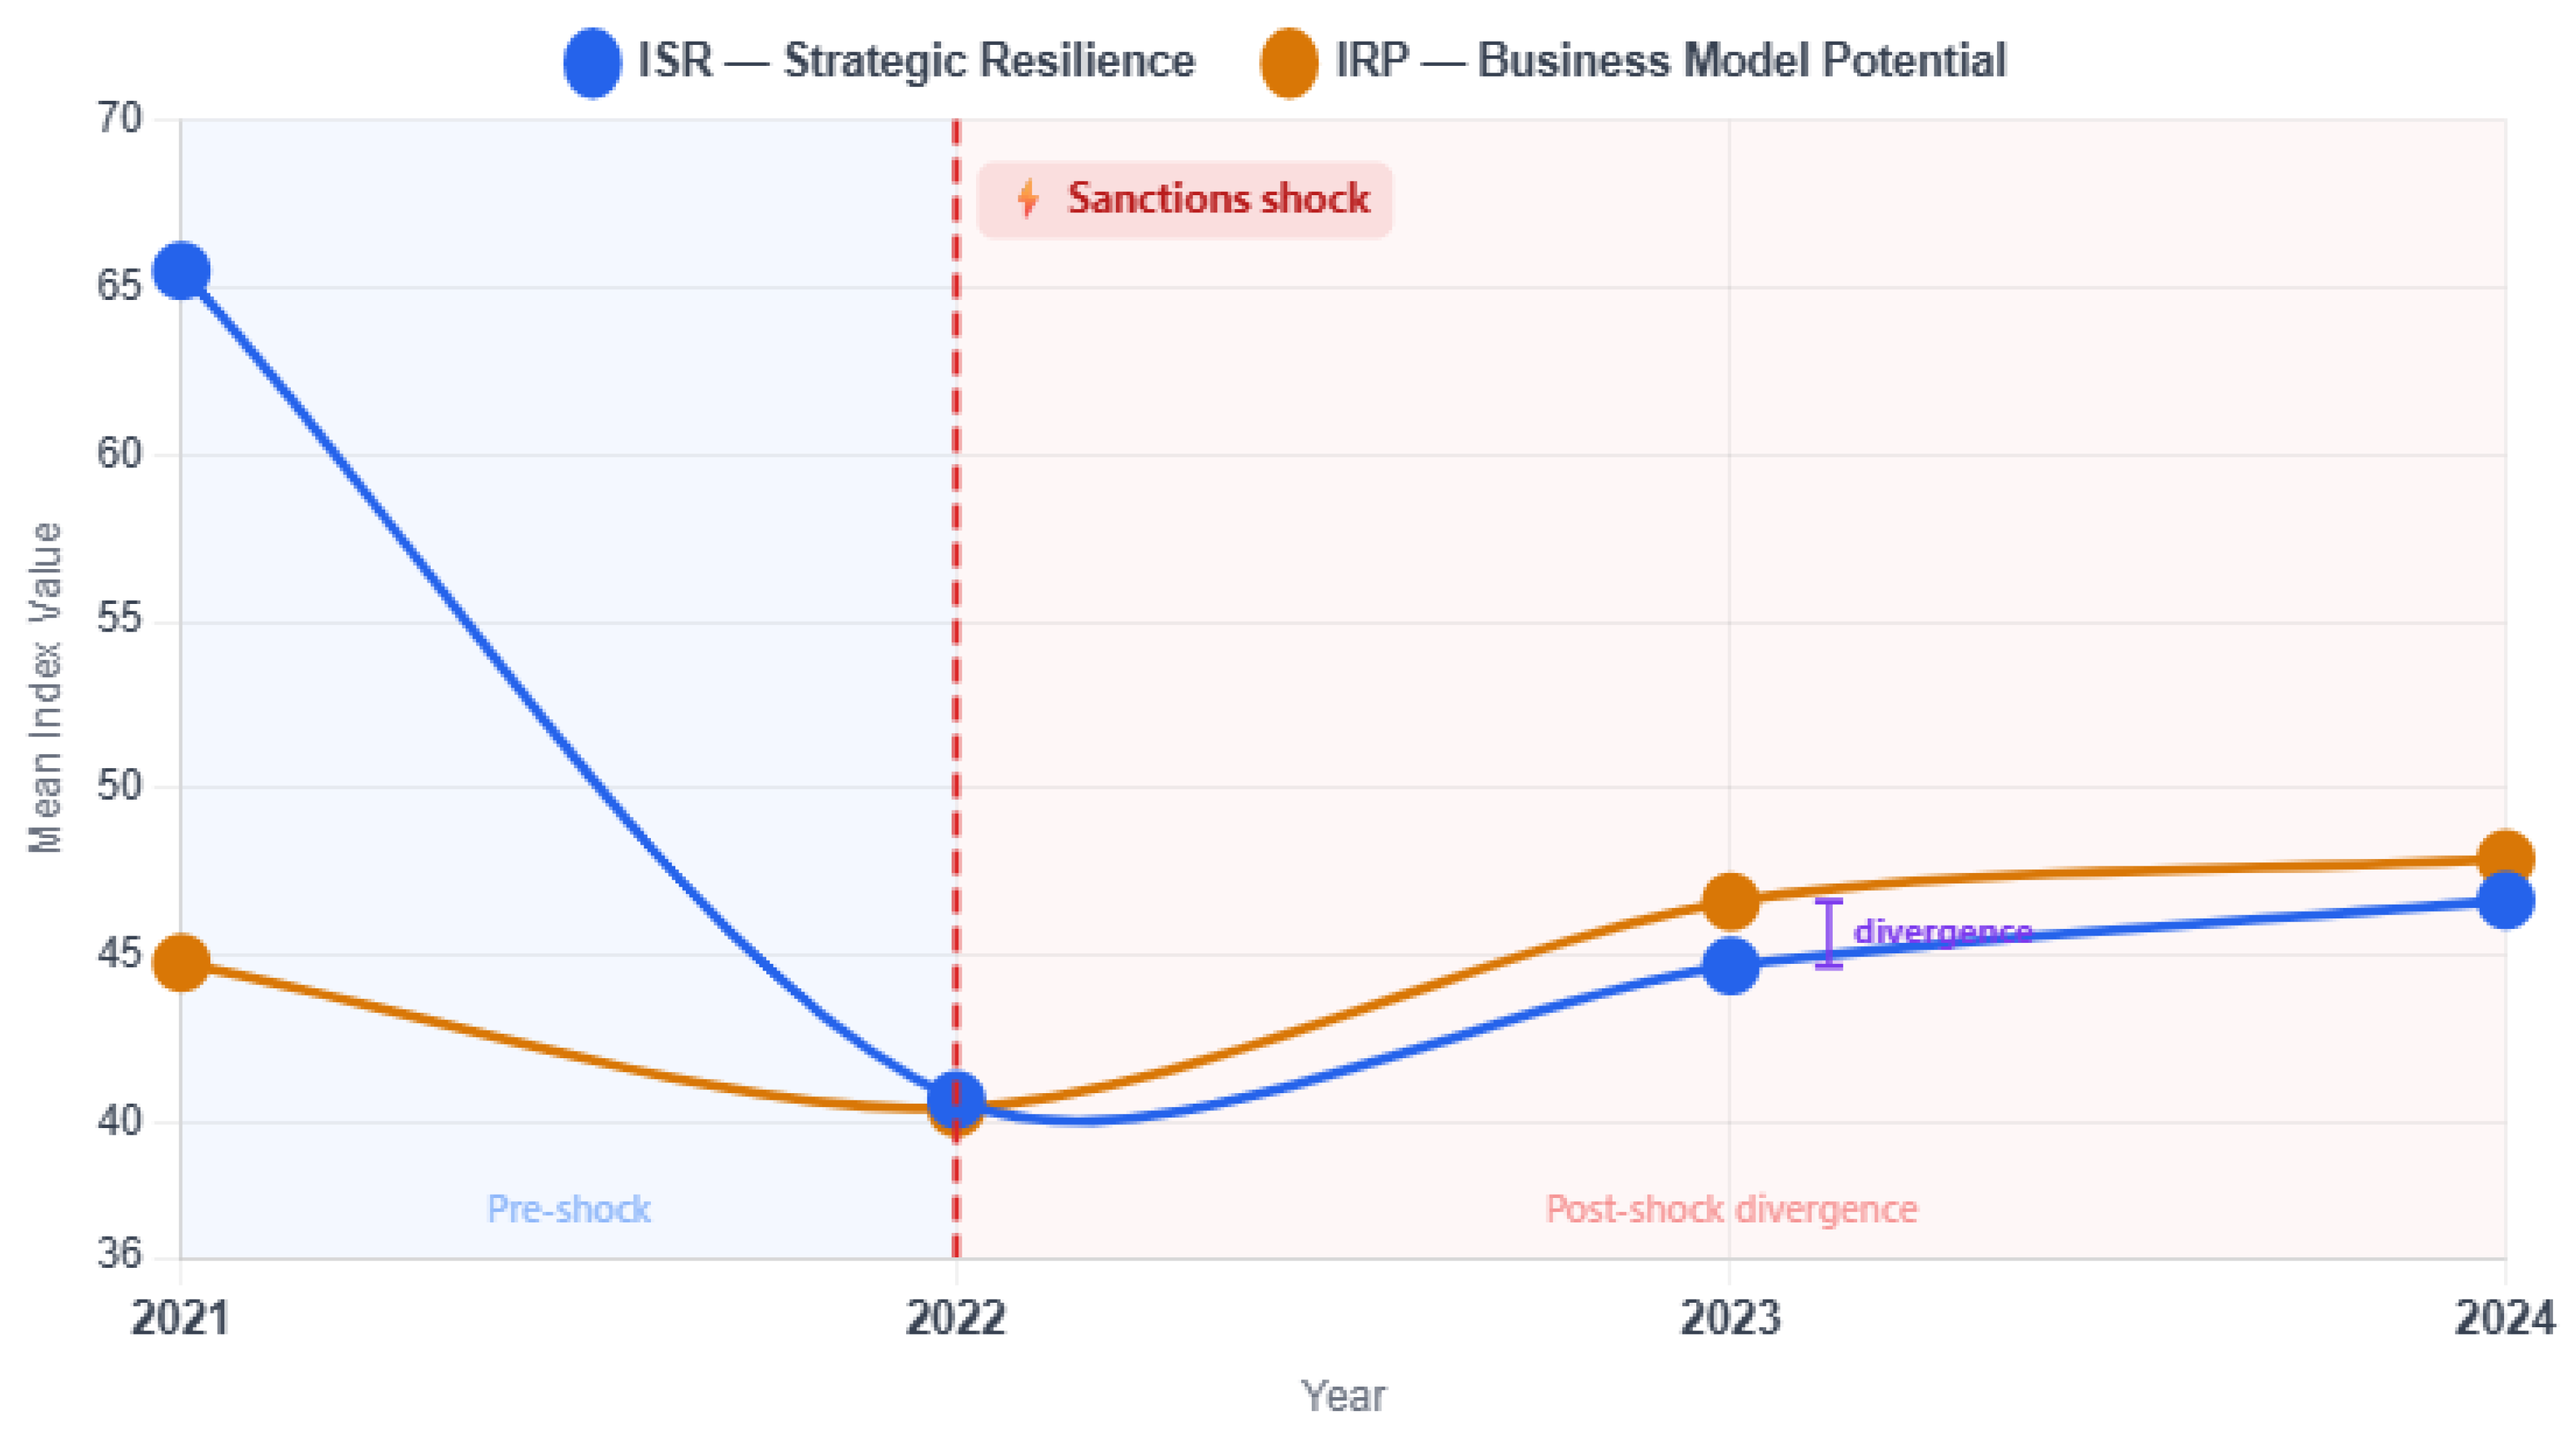
Figure 2, the indices exhibited a noticeable structural change in 2022, followed by a gradual recovery in subsequent years. In 2021, the IGI reached its highest level (54.09), with the ISR at 65.49 and the IRP at 44.80.
In 2022, all indices declined to similar levels (IGI = 40.53; ISR = 40.71; IRP = 40.46), indicating convergence across the components. In the following years, the IGI increases to 45.50 in 2023 and 47.15 in 2024.
The post-2022 dynamics differ across components. ISR increases from 40.71 in 2022 to 44.71 in 2023 and 46.67 in 2024. IRP increases from 40.46 in 2022 to 46.63 in 2023 and 47.91 in 2024. By 2024, the IRP exceeds its 2021 level, whereas the ISR remains below its pre-2022 value.
4.3. Firm-Level Heterogeneity and Adaptation Patterns
To further examine these dynamics at the firm level,
Table 4 presents the IGI, ISR, and IRP values for each company over the period 2021–2024.
In 2021, firms displayed relatively high IGI values, with NLMK (61.66) and Metalloinvest (55.78) having among the highest. ISR values exceed IRP across all firms, indicating differences between the index components.
In 2022, all firms experienced a decline in IGI, ISR, and IRP with varying magnitudes. The ISR and IRP values converge across firms during this period.
In 2023–2024, the firm-level dynamics diverged. Some firms show an increase in ISR, while others exhibit more stable or declining trajectories. IRP values generally increase across firms, although the extent of the growth varies.
4.4. Statistical Significance Tests
To assess whether the observed differences were statistically significant, non-parametric tests were conducted because of the small sample size and potential deviations from normality.
The Kruskal–Wallis test results (
Table 5) indicate statistically significant differences across firms for IGI (
p = 0.0011), ISR (
p = 0.0007), and IRP (
p = 0.0264).
The Mann–Whitney test results (
Table 6) show significant differences between 2021 and 2022 for IGI and ISR (
p = 0.0006), whereas the IRP differences were not statistically significant. Comparisons between 2022 and subsequent years indicated statistically significant changes in IGI (2022–2024,
p = 0.0262) and IRP (2022–2023,
p = 0.0070; 2022–2024,
p = 0.0111), while ISR differences were not statistically significant. No statistically significant differences were observed between 2023 and 2024.
4.5. Panel Stationarity and Correlation Analysis
Before analyzing the relationships between the variables, panel unit root tests were conducted to assess the stationarity properties (
Table 7).
The LLC test does not reject the null hypothesis of a unit root for IGI, ISR, or IRP. In contrast, the IPS test rejects the null hypothesis for IGI and ISR (p = 0.0000), while IRP is marginally significant (p = 0.0521). The Fisher-type test rejected the null hypothesis for all variables (p = 0.0000).
Table 8 presents the correlation matrices. IGI was strongly correlated with ISR (0.925,
p < 0.01) and moderately correlated with IRP (0.545,
p < 0.05). The correlation between ISR and IRP was low (0.199) and not statistically significant.
4.6. Robustness Analysis
To evaluate the stability of the results, additional robustness checks were performed using an alternative index construction.
Table 9 compares the baseline (mean-based) and median-based indices. At the panel level, IGI increases from 47.12 to 49.41, ISR remains stable (49.39 vs. 49.58), and IRP increases from 44.95 to 49.24, respectively. The firm-level rankings remain largely unchanged across specifications.
Table 10 compares the variance-based and equal-weight indices. The panel average IGI remains similar (47.12 vs. 47.20), and firm-level differences are limited.
Additional group-based tests (
Table 11 and
Table 12) show that most differences between the groups are not statistically significant. Only selected components, such as social capital within the ISR, exhibited statistically significant differences.
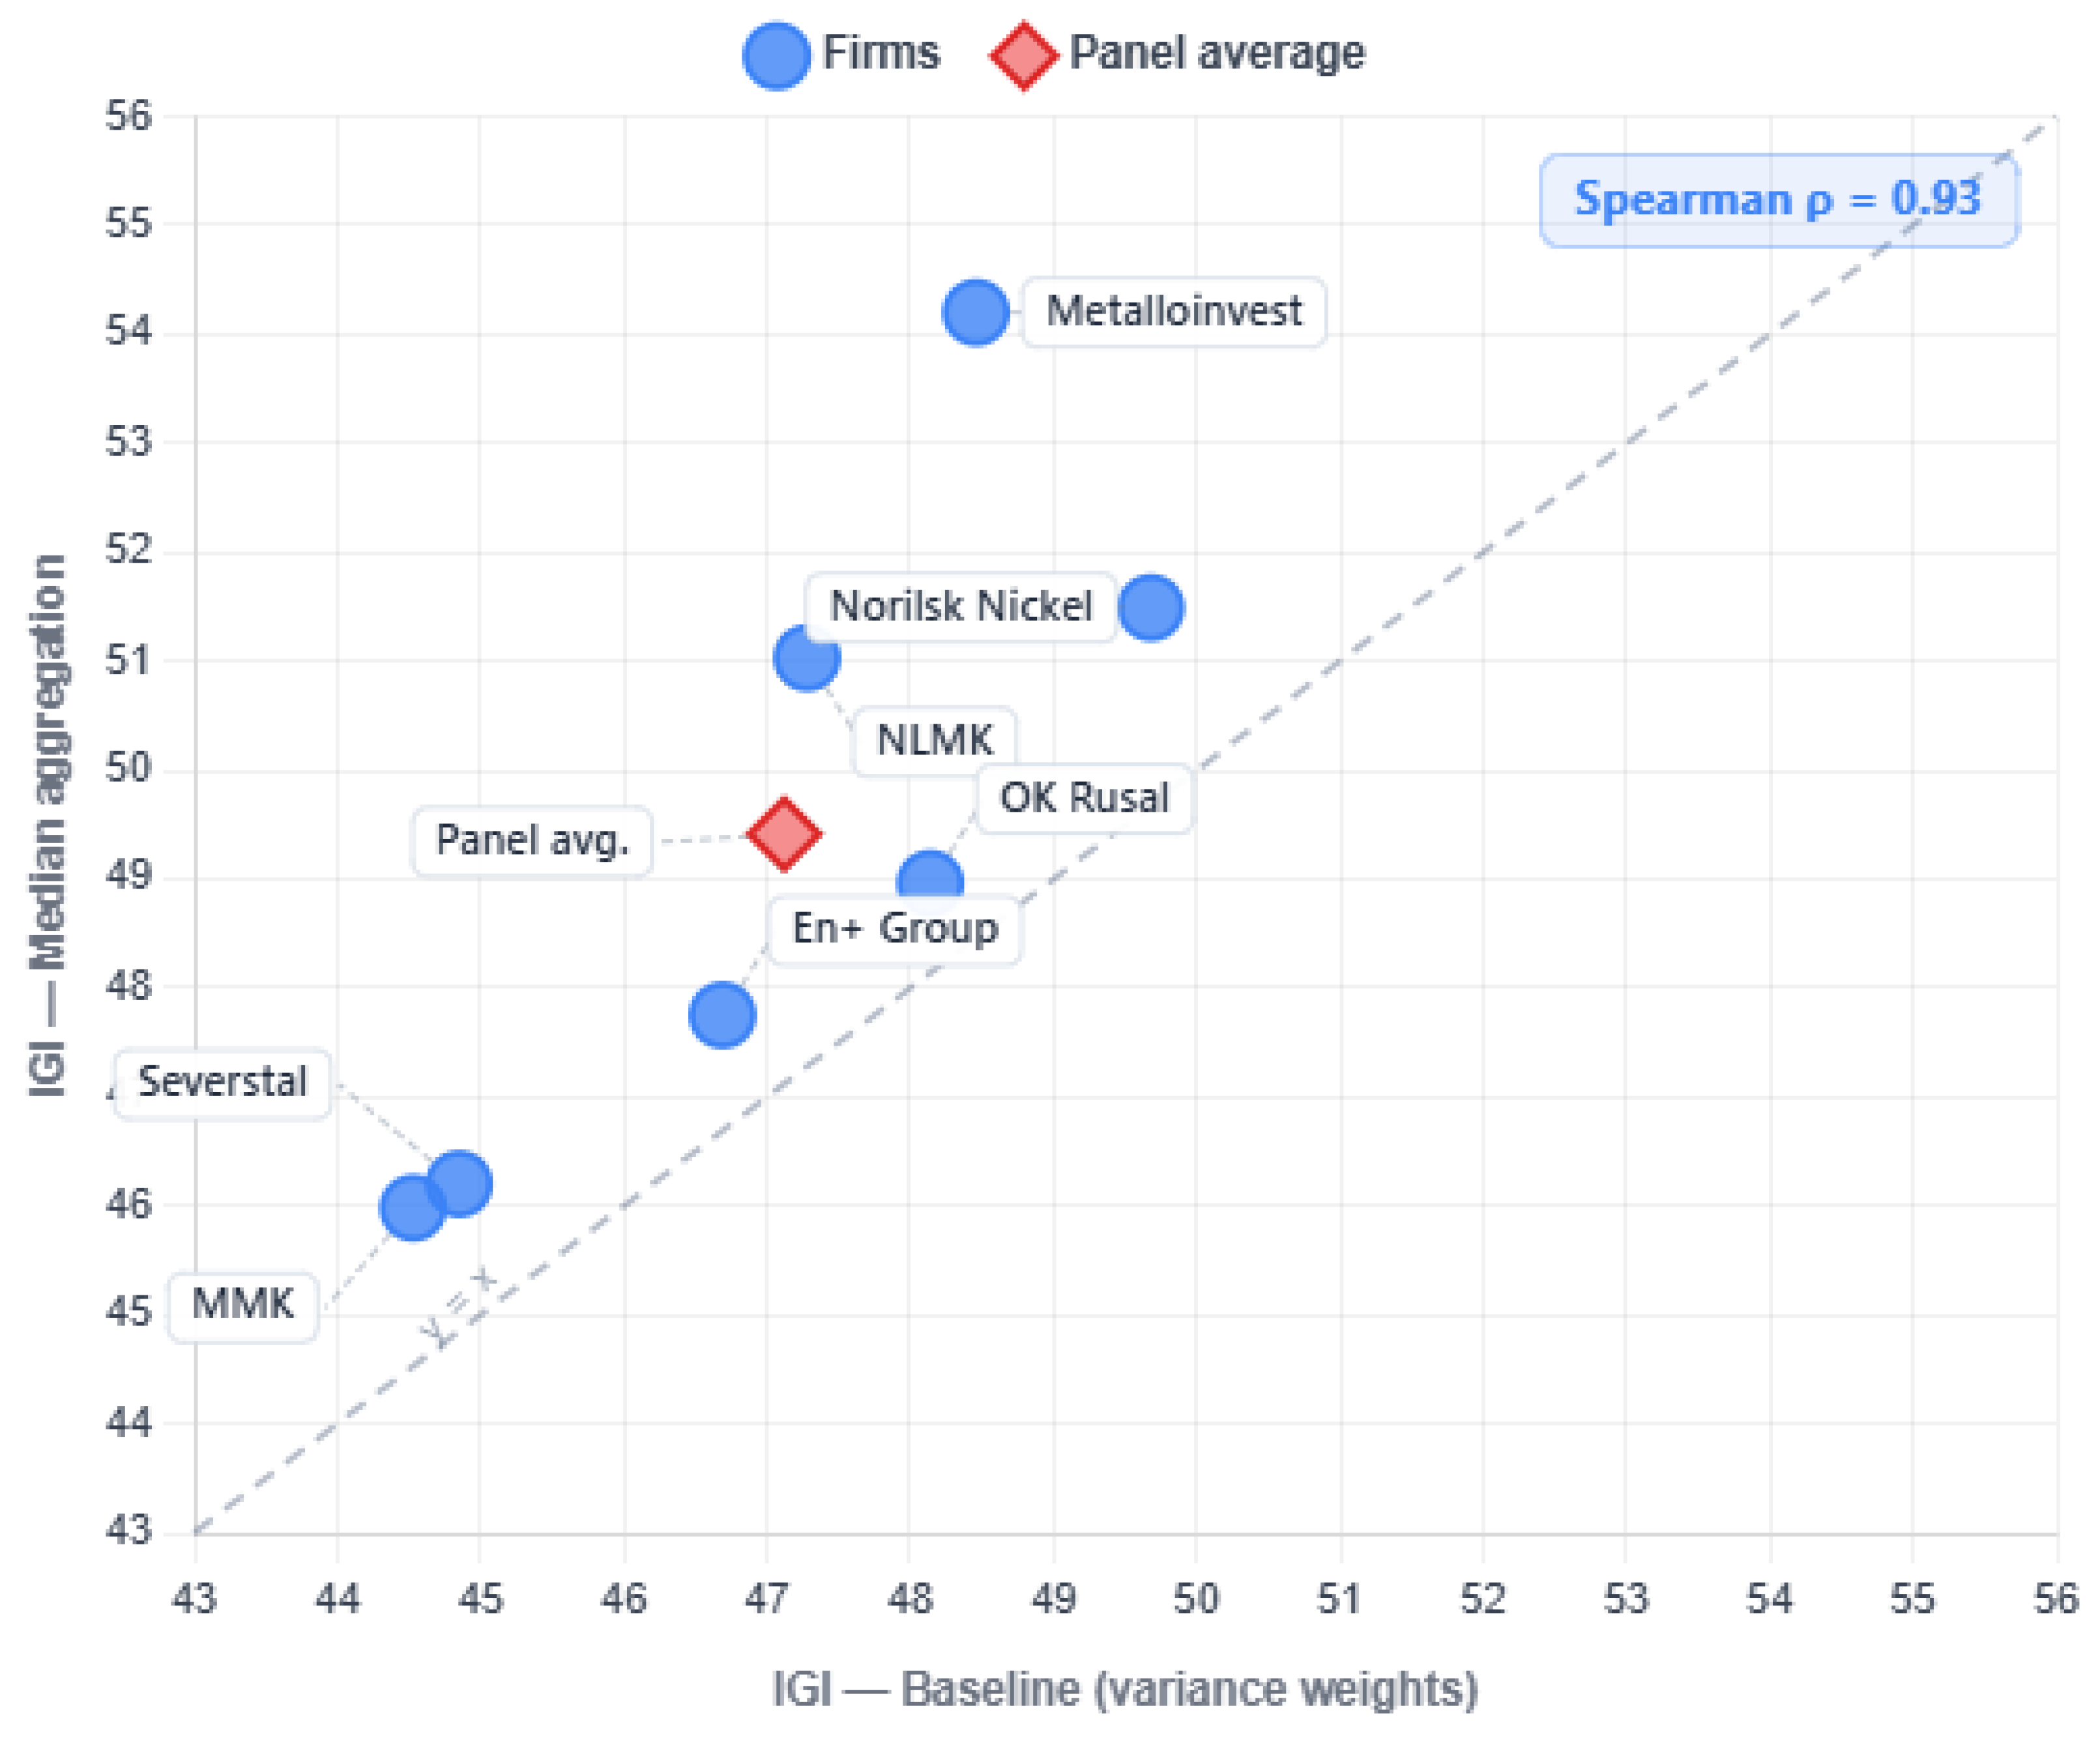
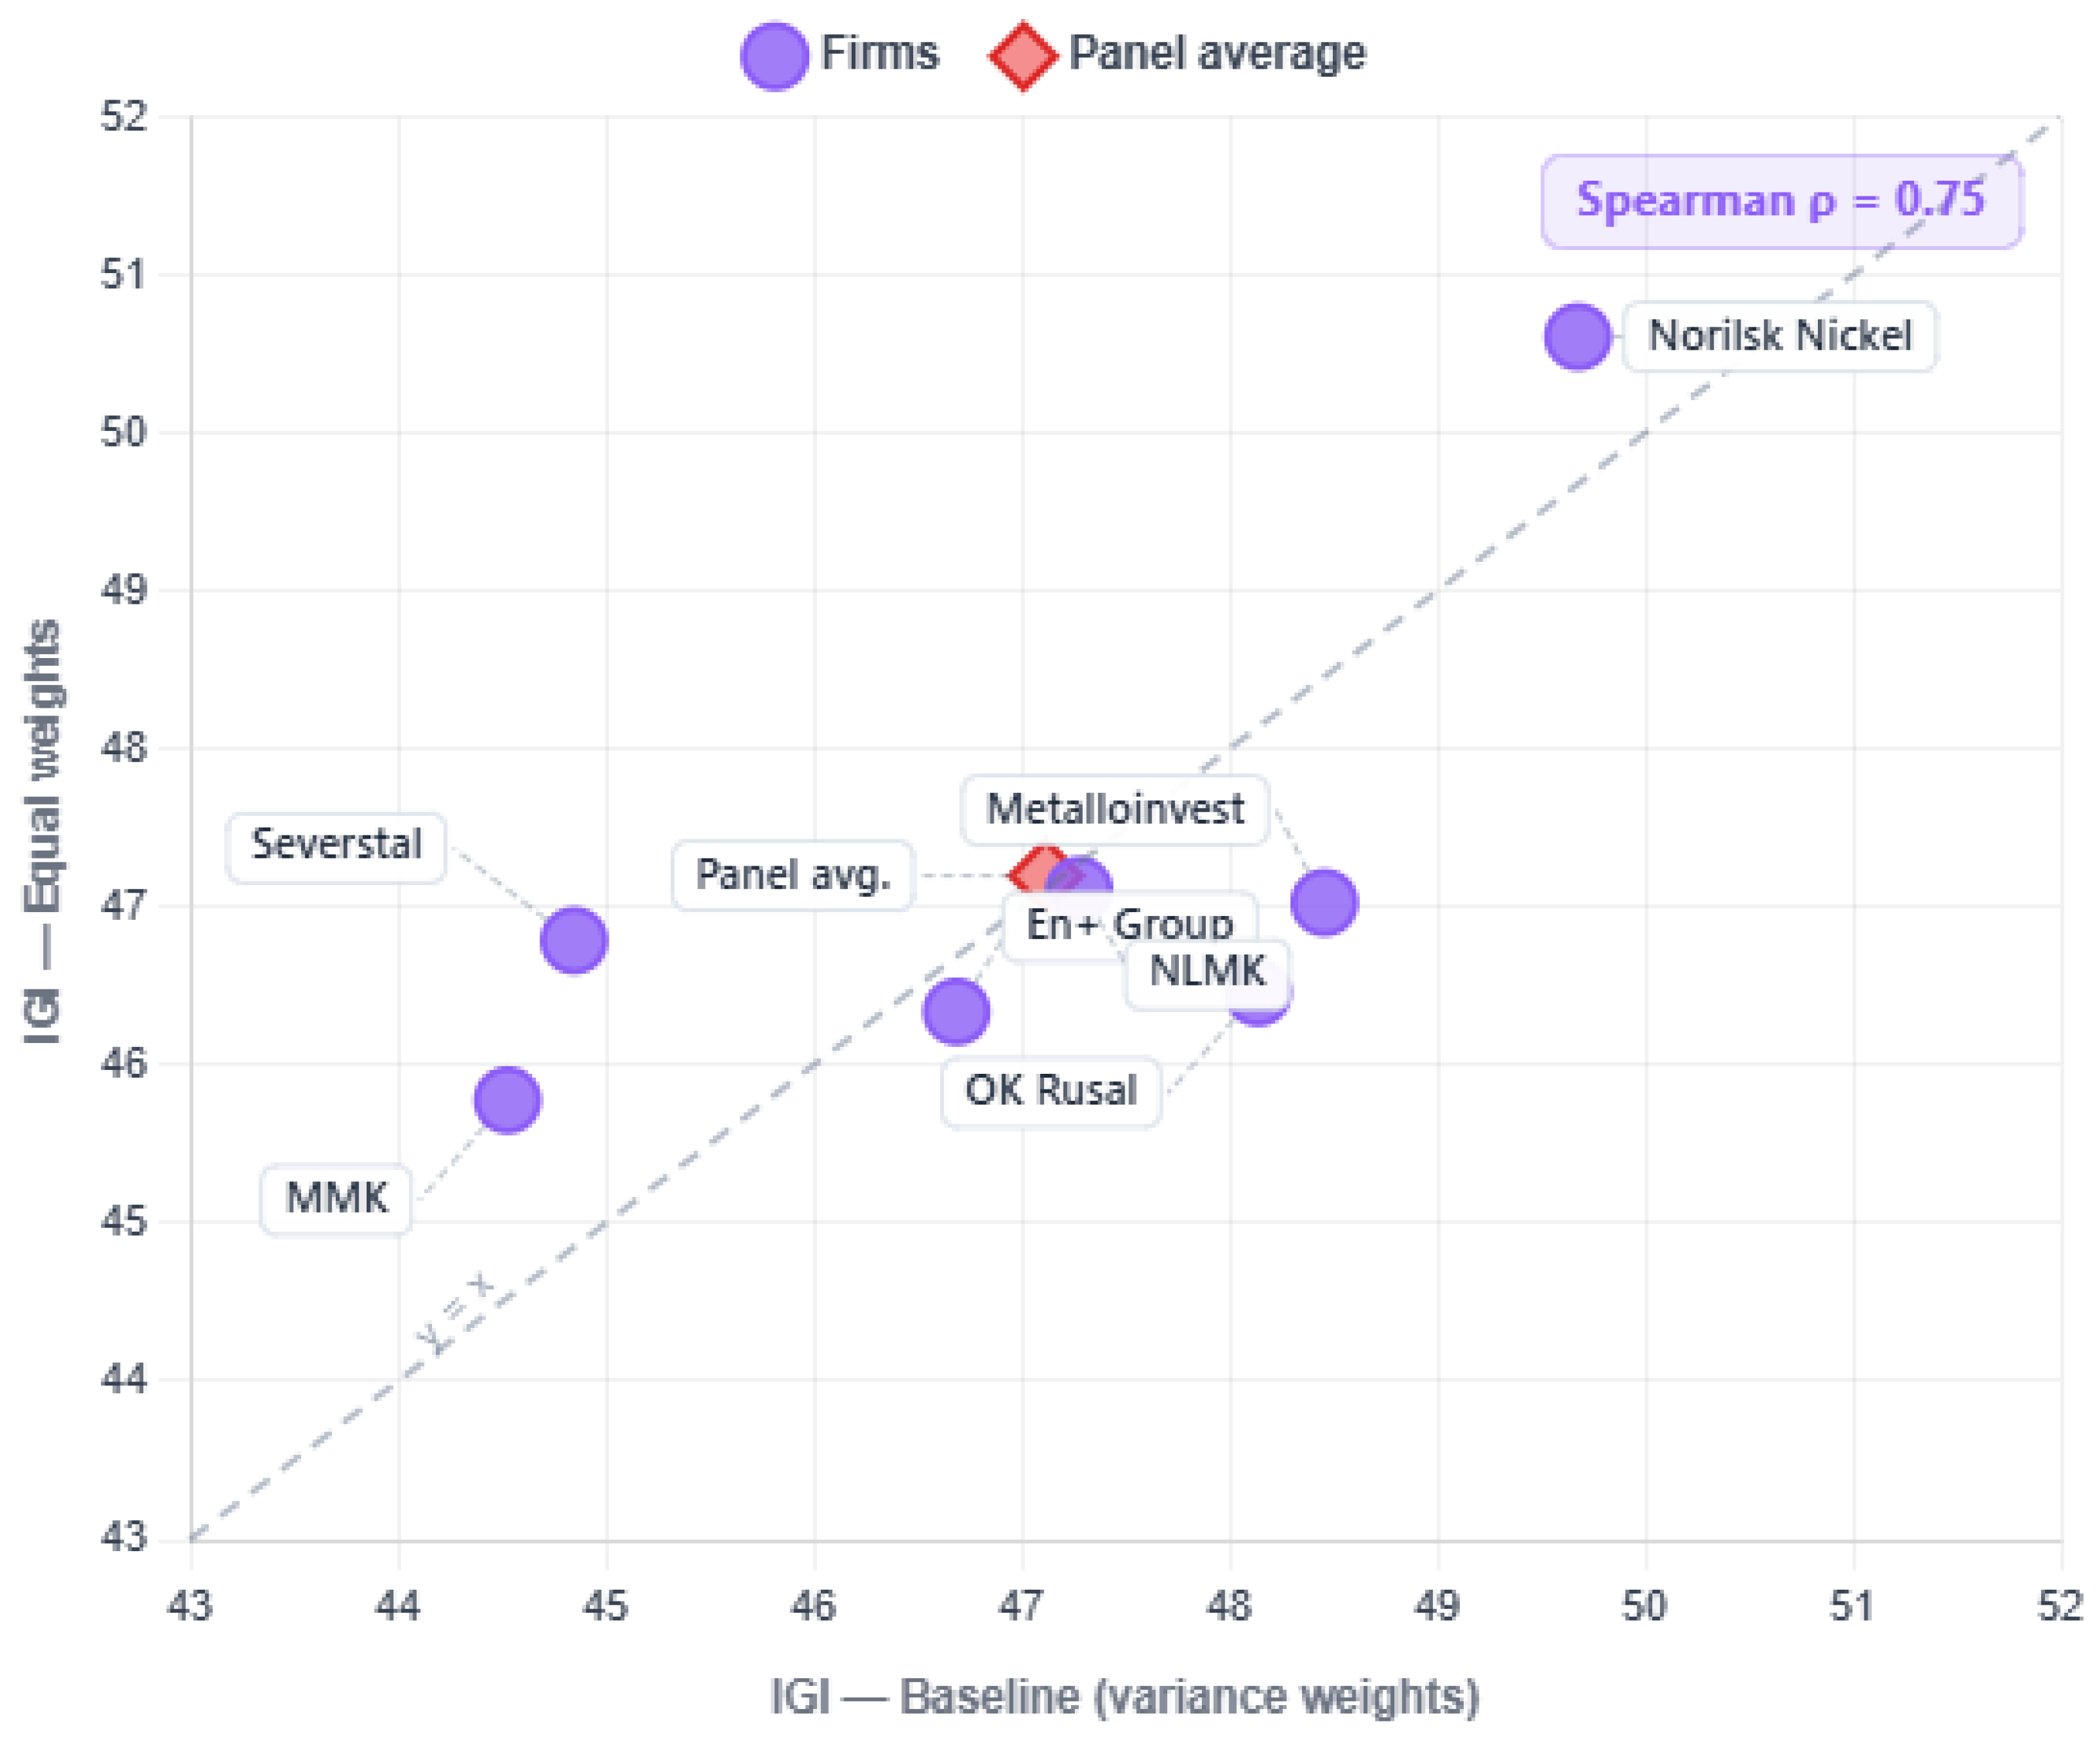
Figure 3 and
Figure 4 provide visual comparisons of the alternative specifications. The observations are generally aligned along the diagonal, and the rank correlations remain high (ρ = 0.93 for median-based and ρ = 0.75 for equal weights), indicating consistency across methods.
The robustness of the results is further illustrated in
Figure 5, which compares the firm-level IGI values obtained under the baseline (variance-weighted) and median-based specifications. The scatter plot reveals a strong alignment of observations along the 45-degree reference line, indicating a high degree of consistency between the two approaches.
A key feature of the figure is the very high Spearman rank correlation (ρ = 0.93), confirming that the relative ordering of firms remains largely unchanged across the specifications. This suggests that the identification of leading and lagging firms is robust to the choice of the central tendency measure.
At the firm level, most observations are closely clustered around the diagonal, implying only minor deviations between the baseline and median-based estimates. For example, firms such as Norilsk Nickel, NLMK, and OK Rusal exhibit similar values under both specifications, reinforcing the stability of their relative positions. Some deviations were observed for Metalloinvest and En+ Group, where median-based values were somewhat higher, particularly reflecting adjustments in IRP components; however, these shifts did not alter the overall ranking structure.
The panel average, represented by a distinct marker, is also located near the diagonal, further confirming that the aggregate results are not sensitive to the choice of specification.
Overall,
Figure 3 provides clear visual evidence that the IGI is robust to alternative aggregation approaches. The strong alignment of observations and high rank correlation support the conclusion that the main empirical findings—particularly firm-level heterogeneity and the relative positioning of companies—are not driven by outliers or methodological artifacts.
Additional evidence of the robustness of the results is provided in
Figure 4, which compares the IGI values calculated using variance-based weights and equal weights. Although the dispersion of observations around the 45-degree line is slightly greater than that in the median-based comparison, the overall pattern remains stable.
The Spearman rank correlation coefficient (ρ = 0.75) indicates a strong, albeit not perfect, consistency in firm rankings across the two weighting schemes. This suggests that the choice of weights has a moderate effect on the relative positioning of firms but does not fundamentally alter the structure of results.
At the firm level, most observations remain close to the diagonal, indicating that the differences between the two specifications are limited. For example, Norilsk Nickel retains a leading position under both weighting schemes, whereas firms such as MMK and Severstal remain in the lower range of the distribution. Some deviations are observed for firms such as OK Rusal and Metalloinvest, where the equal-weight specification slightly adjusts their IGI values, reflecting a more balanced contribution of individual components.
The panel average is also located very close to the diagonal, confirming that the aggregate results are highly stable and not sensitive to the weighting methodology.
Overall,
Figure 4 supports the conclusion that the Inclusive Growth Index is reasonably robust to alternative weighting assumptions. Although the use of equal weights introduces some variation in firm rankings, the general pattern of firm heterogeneity and the identification of relative leaders and laggards remain unchanged. This further reinforces the validity of the proposed index and its applicability to empirical analyses.
4.7. Summary of Empirical Patterns
Across the period 2021–2024, the results indicate (i) a structural change in 2022, (ii) convergence of index components during the shock year, (iii) subsequent divergence in index dynamics, (iv) heterogeneity across firms, and (v) robustness of the results across alternative specifications. The observed divergence between ISR and IRP suggests differences in the dynamics of resilience and long-term potential across the period analyzed.
5. Discussion
5.1. Reinterpreting Inclusive Growth Under Structural Shock
The results indicate that inclusive growth in the Russian metallurgical sector cannot be fully understood within a single framework. Instead, the findings suggest the coexistence of two distinct models: global ESG-oriented inclusive growth and sovereignty-oriented inclusive growth models.
The ESG-oriented model emphasizes long-term sustainability, environmental performance, and stakeholder integration within global markets. In contrast, the sovereignty-oriented model prioritizes economic continuity, operational resilience, employment preservation, and the development of domestic capabilities despite external constraints.
Empirical evidence suggests that the relative importance of these models shifts following the 2022 structural shock. In the immediate post-shock period, firm behavior is more consistent with the sovereignty-oriented model, whereas the recovery of long-term potential reflects a gradual rebalancing toward ESG-oriented dynamics.
This duality highlights that inclusive growth is not a uniform construct but a context-dependent process shaped by institutional and geopolitical conditions.
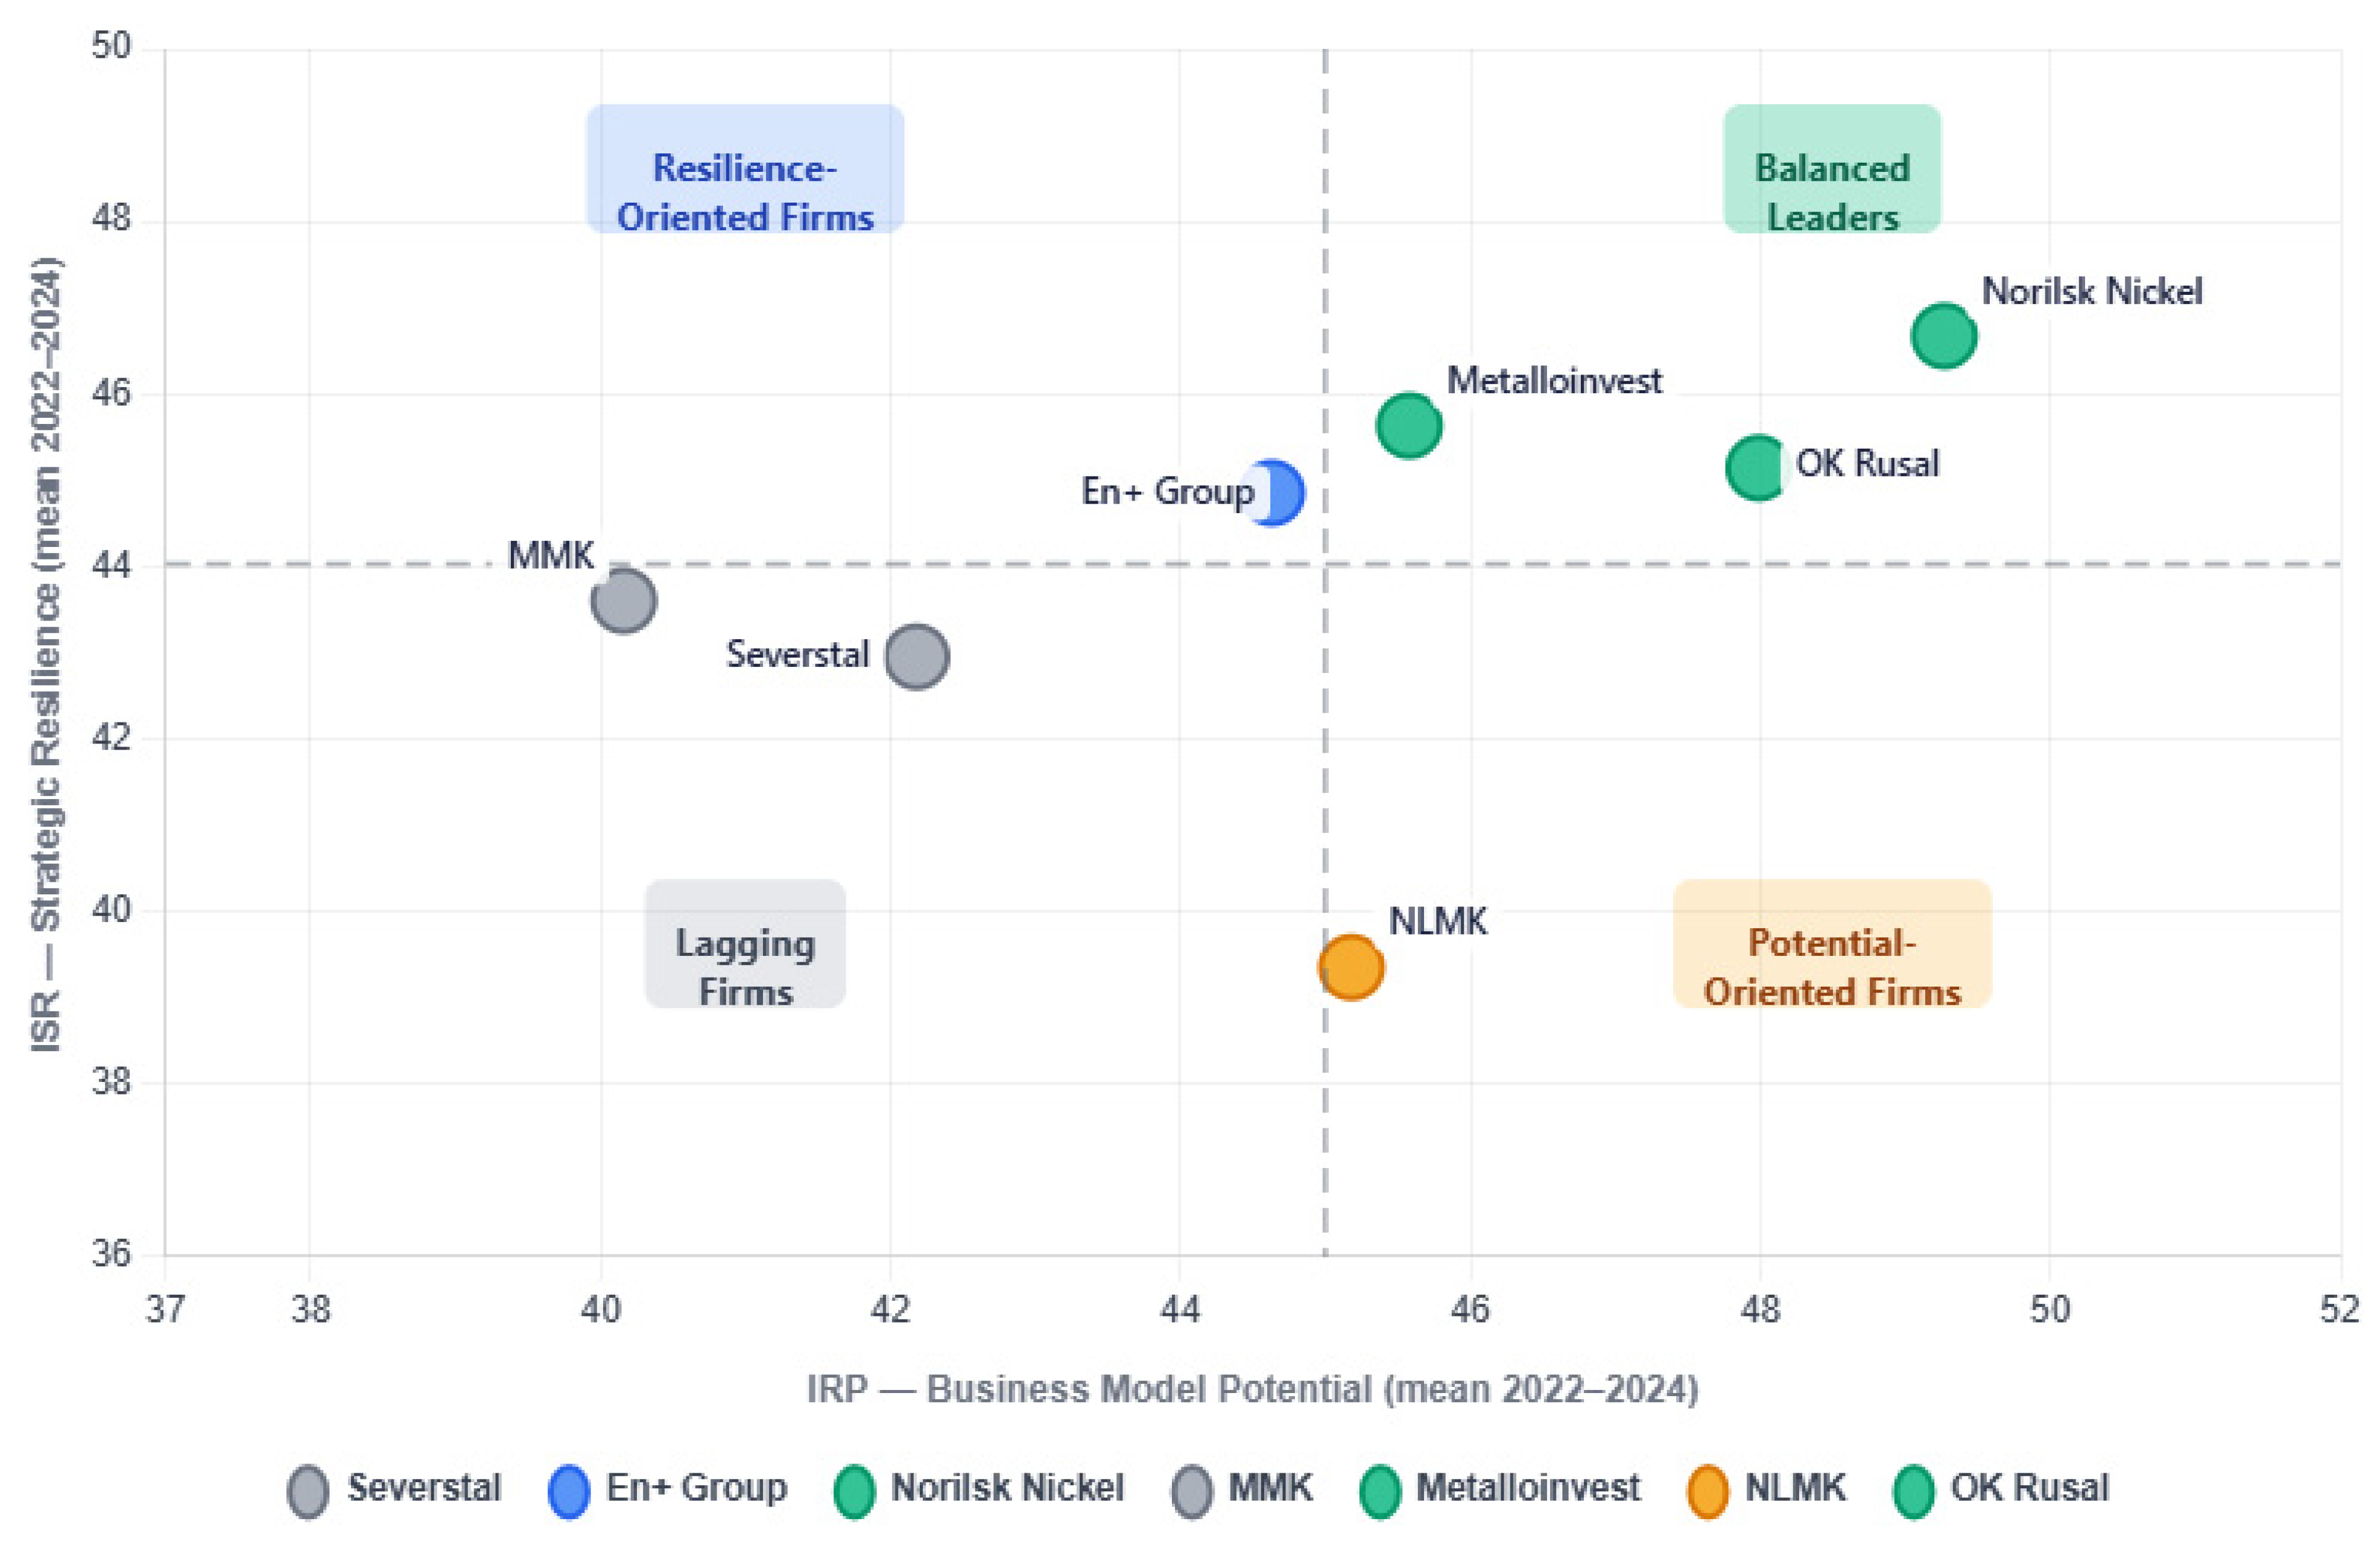
This reinterpretation is supported by firm-level evidence presented in
Figure 5, which illustrates the distribution of firms based on their average ISR and IRP values over the period 2022–2024. The figure reveals substantial dispersion across firms and highlights the absence of a uniform adjustment trajectory for all firms. The use of mean reference lines allows firms to be classified into four quadrants, reflecting different combinations of resilience and long-term potential.
A notable pattern is the concentration of several firms in the upper-left quadrant, characterized by relatively high resilience but below the average business model potential. This positioning indicates a resilience-oriented adjustment path in which firms prioritize short-term stabilization over long-term capability development. In contrast, firms located in the upper-right quadrant, such as Norilsk Nickel and Metalloinvest, demonstrate a more balanced trajectory, maintaining both resilience and long-term potential. Simultaneously, firms positioned in the lower-right quadrant, such as NLMK, exhibit relatively stronger potential but weaker resilience, suggesting constraints in short-term adaptation. The lower-left quadrant, although less populated, captures firms with below-average performance on both dimensions.
Taken together, these patterns indicate that inclusive growth under structural shocks is not characterized by convergence toward a single equilibrium. Instead, it reflects a set of differentiated firm-level strategies in which resilience and long-term potential are combined in varying proportions. This heterogeneity underscores the need to reinterpret inclusive growth as a context-sensitive and multidimensional process rather than a uniformly balanced outcome.
5.2. The Resilience–Potential Trade-Off
Building on these findings, a key pattern that emerges is the divergence between strategic resilience (ISR) and business model potential (IRP), which is particularly evident in the post-2022 period.
This relationship is illustrated in
Figure 6, which shows that while both indices declined sharply in 2022, their subsequent trajectories differed. The ISR recovers gradually, whereas the IRP increases more strongly and eventually exceeds the ISR by 2023–2024.
This divergence provides empirical evidence of a resilience–potential trade-off. In the immediate aftermath of the shock, firms appear to prioritize stabilization, as reflected in the recovery of ISR. Over time, attention shifts toward restoring long-term capabilities, leading to a stronger increase in the IRP.
Importantly, this suggests that the two dimensions of inclusive growth do not necessarily evolve in parallel. Instead, they may follow different adjustment paths that reflect shifts in strategic priorities under external constraints.
This finding extends the inclusive growth literature by demonstrating that its core dimensions may not be complementary under structural constraints.
5.3. Firm-Level Adaptation
At the firm level, these dynamics translate into heterogeneous adaptation rather than uniform adaptation. The dispersion observed across firms suggests that companies follow distinct adjustment paths.
Rather than forming clearly defined groups, firms exhibit varying combinations of resilience and potential, reflecting differences in their internal capabilities and external exposure. This heterogeneity is consistent with the absence of strong group-level differentiation in several robustness tests and highlights the firm-specific nature of the adjustment processes.
5.4. Implications for ESG in Emerging Markets
These findings contribute to the ESG literature by emphasizing the importance of context. In environments characterized by geopolitical shocks and institutional constraints, the interpretation of inclusive growth differs from that in stable and developed markets.
In particular, resilience becomes a central dimension of performance, whereas long-term components such as innovation and governance may evolve with a lag. This suggests that standard ESG metrics may not fully capture firm behavior in such contexts and may require adaptation to do so.
5.5. Contributions
This study contributes to the literature by introducing a conceptual distinction between ESG-oriented and sovereignty-oriented inclusive growth, demonstrating that the content and priorities of inclusive growth may shift under structural constraints. This study contributes to the literature in three main ways. First, it introduces a composite index that distinguishes between resilience and long-term potential for inclusive growth. Second, it provides empirical evidence from the context of a constrained emerging market. Third, it identifies a resilience–potential trade-off, showing that the key dimensions of inclusive growth may diverge under structural stress.
5.6. Limitations and Future Research
The analysis is subject to several limitations, including a relatively small sample size and a short time horizon. In addition, the structural break in 2022 complicates the interpretation of the time-series properties.
Future research may extend this approach to other sectors and countries and explore the long-term implications of the observed divergence between resilience and potential.
6. Conclusions
This study analyzed the inclusive growth dynamics in the Russian metallurgical sector over the period 2021–2024, incorporating the structural break associated with the 2022 sanctions shock. The results provide partial support for the proposed hypotheses and highlight the role of external constraints in shaping firm-level results.
Hypothesis H1 is supported, as higher levels of inclusive growth are associated with stronger resilience, reflected in the close relationship between IGI and ISR.
Hypothesis H2 receives partial support, as long-term potential (IRP) contributes to inclusive growth but evolves differently from that of resilience.
Hypothesis H3 is confirmed, as the 2022 shock significantly affects index dynamics and defines a clear structural breakpoint.
The results highlight a divergence between resilience and long-term potential, indicating that these dimensions may follow different adjustment paths under different external constraints. This suggests that inclusive growth should be understood as a dynamic and multidimensional process rather than a uniformly balanced outcome.
Overall, the findings highlight the need to account for structural conditions when evaluating ESG-related performance and suggest that inclusive growth metrics may require contextual adaptation to be effective.