Article

Digital Reputation Risk Disclosure and Firm Value: Novel Evidence Using Textual Analysis of Saudi Non-Financial Listed Companies

by
Khaled Muhammad Hosni Sobehy
1,2,
Lassaad Ben Mahjoub
1,* and
Ahmed Gomaa Ahmed Radwan
1,3
1
Department of Accounting, College of Business, Imam Mohammad Ibn Saud Islamic University (IMSIU), Riyadh 11564, Saudi Arabia
2
Department of Accounting, Faculty of Commerce, Damietta University, Damietta 34517, Egypt
3
Department of Accounting, Faculty of Commerce and Business Administration, Capital University (Formerly Helwan University), Cairo 11795, Egypt
*
Author to whom correspondence should be addressed.
Int. J. Financial Stud. 2026, 14(4), 88; https://doi.org/10.3390/ijfs14040088
Submission received: 10 February 2026 / Revised: 17 March 2026 / Accepted: 23 March 2026 / Published: 2 April 2026

Abstract

Current accounting standards do not allow recognition of intangible assets for indigenously created properties, resulting in a discrepancy between the book value and market value of firms operating within digital economies, where investments like cybersecurity and data governance are grossed up immediately on the statement of financial position as they are considered to be expensed under IFRS. This paper investigates whether voluntary Digital Reputation Risk Disclosure (DRRD) rectifies this valuation gap for the non-financial firms listed on the Saudi Exchange. Based on an automated bilingual dictionary-based textual analysis of 891 corporate documents and a two-step System GMM estimator run on an unbalanced panel of 619 firm-year observations from a sample of 132 firms for the period 2020–2024, we show that DRRD is statistically significantly negatively related to firm value at conventional levels, implying that investors perceive such disclosures as indications of higher risk exposure rather than stronger governance capabilities. While statistically insignificant, the moderating effect of firm size shows that negative valuation effects are concentrated on large firms according to sub-sample analysis. These findings are confirmed across several alternative specifications in the robustness checks. The findings demonstrate that voluntary digital risk disclosure, in the absence of standards-based frameworks, is not effective at bridging this valuation gap, and may instead activate functional fixation among investors. These findings highlight the importance of IASB’s standardization agenda regarding intangible assets and present relevant empirical data for developing capital markets.

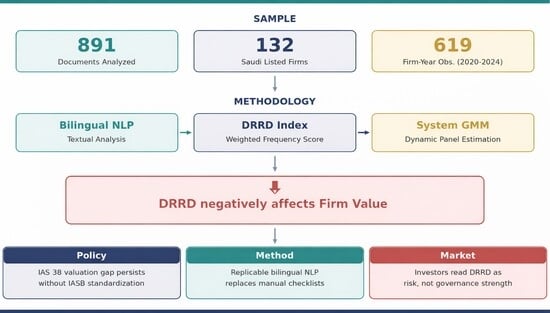
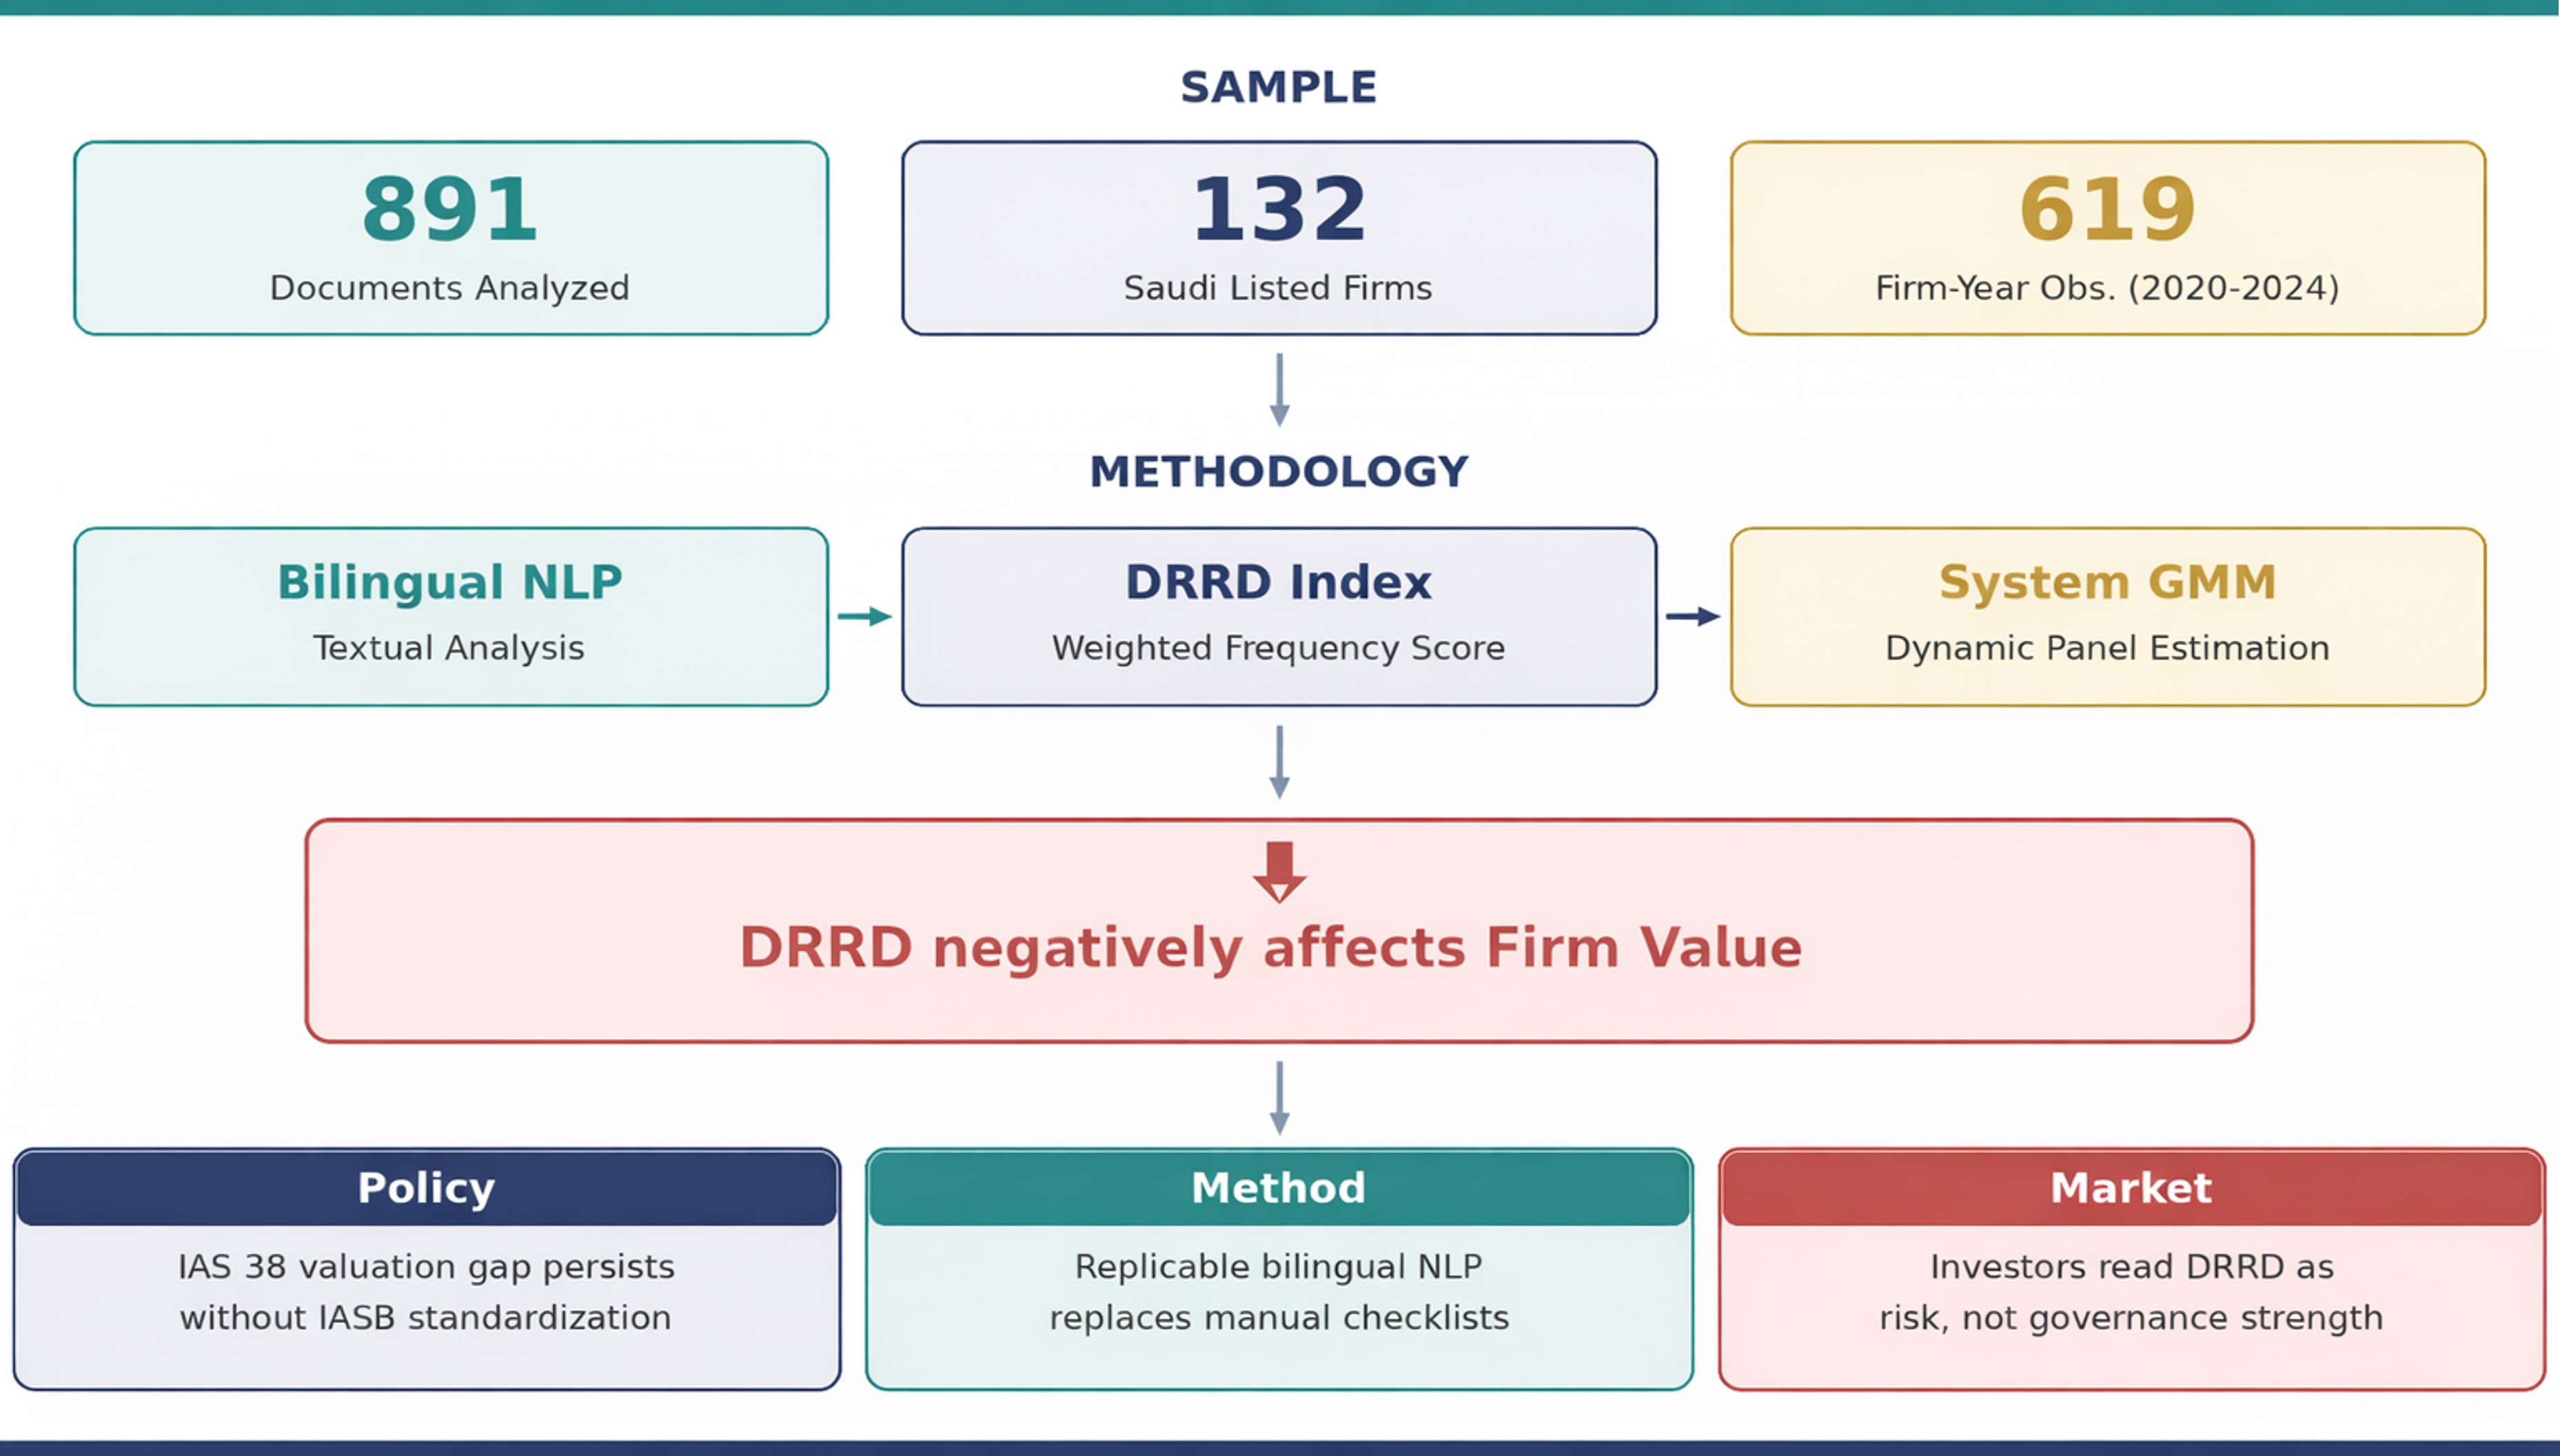
Graphical Abstract

1. Introduction

In the modern digital economy, corporate value drivers have shifted from tangible resources to intangible assets like data ecosystems and digital reputation. Digital Reputation Risk Disclosure (DRRD), defined as the voluntary corporate reporting of risks related to cybersecurity resilience, data governance, and digital trust, has emerged as a primary channel through which firms communicate the quality of these hidden assets to capital markets. Consequently, investors increasingly scrutinize a firm’s digital resilience rather than just historical profitability. Fu et al. (2025) demonstrate that data assets enhance organizational resilience, while Hamidil et al. (2023) argue that digital reputation serves as a proxy for technological reliability. In an environment where cyber threats can instantaneously erode shareholder value, the capacity to govern and disclose digital reputation safeguards has become a critical determinant of the cost of capital (Nobanee et al., 2023). Digital transformation capabilities are now fundamental drivers of corporate performance (Wang et al., 2025).
Despite these market imperatives, financial reporting remains constrained. IAS 38 Intangible Assets prohibits capitalizing internally generated brands and customer lists, proxies for digital reputation, due to measurement uncertainty (IFRS Foundation, 2024a). Barker et al. (2022) note that this restrictive approach widens the gap between financial statements and economic reality. As firms expense cybersecurity investments immediately, a disconnect emerges between book and market value (Muir et al., 2024; Odonkor et al., 2023).
Although the IASB has officially moved the Intangible Assets project to its active research work plan, acknowledging that current standards fail to capture new digital asset classes (IFRS Foundation, 2024b), and explicitly identified data resources and AI as priority test cases for modernization (IFRS Foundation, 2025), significant information asymmetry persists. Consequently, until these regulatory efforts materialize, voluntary disclosure remains the primary mechanism to bridge this valuation gap (Steffen, 2022).
Saudi Arabia offers a unique setting to examine this dynamic. Under Vision 2030, the Kingdom is aggressively pursuing a digital-first economy through massive infrastructure investments, significantly increasing non-financial firms’ exposure to digital reputational risks (Saudi Vision 2030, 2024). While recent regional literature links intangible assets to performance (Alomair et al., 2022) and cybersecurity disclosure to reduce return volatility (Alsadoun & Albaz, 2025), research linking the quality of DRRD to firm value remains scarce. Prior studies predominantly rely on manual, binary checklists that fail to capture disclosure intensity or specificity (Alzead & Hussainey, 2017; Krippendorff, 2018). This study bridges this gap by introducing an automated, bilingual computational algorithm to objectively measure disclosure density (Zhai et al., 2022).
This study makes three contributions. First, it responds to the IASB’s call for evidence on intangibles by providing empirical evidence that voluntary DRRD, as currently practiced without standardized frameworks, does not produce measurable valuation effects, an outcome that itself underscores the urgency of the IASB’s ongoing standardization agenda. Second, it departs from manual scoring by employing a novel automated bilingual textual analysis approach, offering a replicable and objective alternative to checklist-based disclosure measurement. Third, it employs the two-step System GMM estimator to help alleviate dynamic panel bias and endogeneity concerns, providing more credible evidence than static estimators on the valuation relevance of narrative disclosures (Chen et al., 2026; Hunjra et al., 2024). Theoretically, the study draws on the Resource-Based View, which positions digital reputation as a strategic asset whose off-balance-sheet nature creates information asymmetry, with Signaling Theory, which explains firms’ rational response through voluntary disclosure. The null findings suggest that this signaling mechanism, while theoretically coherent, fails in practice without the standardized benchmarks that would allow investors to reliably interpret and compare DRRD across firms.
The rest of the paper is structured as follows: Section 2 reviews the literature; Section 3 details the methodology; Section 4 presents the results; and Section 5 concludes.

2. Literature Review and Theoretical Framework

The theoretical framework of this study integrates the Resource-Based View (RBV) and Signaling Theory, providing a comprehensive lens to interpret how digital reputation, as an intangible, internally generated asset, translates into firm value amidst a restrictive financial reporting environment. According to the Resource-Based View, sustainable competitive advantage is derived from resources that are valuable, rare, inimitable, and non-substitutable (VRIN) (Barney, 1991). In the digital economy, digital reputation, comprising cybersecurity resilience, data governance integrity, digital trust signaling, and reputational risk management, has evolved into a critical strategic resource of this kind. Unlike physical assets, digital reputation is socially complex and path-dependent, accumulated through consistent data stewardship and cybersecurity resilience. This theoretical stance is empirically supported by Zhu et al. (2022), who used advanced text mining to categorize security and fraud risks as primary determinants of corporate reputation. Ahmed et al. (2025) further argue that reputational capital is built through specific community-building tactics rather than mere disclosure, positioning it as a dynamic asset requiring active management. Bessen (2020) provides evidence that proprietary information technology systems function as key drivers of industry concentration, suggesting that firms capable of leveraging advanced digital capabilities gain a distinct productivity advantage.
However, a fundamental disconnect exists between the economic reality of this digital capital and its accounting treatment under current IFRS. Specifically, IAS 38 Intangible Assets prohibit the recognition of internally generated brands and customer lists, items that serve as close proxies for digital reputation (IFRS Foundation, 2024a). Barker et al. (2022) critically note that this restrictive approach, grounded in conservatism, leads to a widening value gap where financial statements cannot reflect the true economic position of modern firms. As companies invest heavily in digital infrastructure, these expenditures are expensed immediately, creating a significant information asymmetry where book value becomes decoupled from market value (Muir et al., 2024; Odonkor et al., 2023). In this context, the Edelman Trust Barometer (2025) reveals a global fragility in institutional trust, amplifying the need for businesses to act as competent guardians of information.
In response to this accounting silence, voluntary disclosure emerges as the primary mechanism to bridge the information gap. Drawing on Signaling Theory, Spence (1973) posits that in the presence of information asymmetry, high-quality firms are incentivized to send credible, costly-to-fake signals to the market.
Within the digital context, the disclosure of specific details regarding digital risk management serves as such a signal. This is not because disclosure reveals vulnerability, but because firms with robust governance capabilities can afford to be specific and transparent about their risk exposures, whereas firms with weak controls cannot credibly do so without incurring reputational costs. This distinction between boilerplate risk acknowledgment and substantive governance-intensive DRRD is central to the signaling argument. This focus on risk reporting is strongly supported by recent standard-setter research. According to the IASB’s academic review (IFRS Foundation, 2024a), while views on recognition remain mixed, there is a clear consensus on the need for better disclosures. Notably, investors ranked ‘intangibles-related risks and opportunities’ as a top priority, assigning it a relevance score of 7.7 out of 10, second only to R&D. Unlike generic boilerplate statements, high-quality DRRD implies underlying governance capabilities. Huan et al. (2024) provide evidence that proactive disclosure during crises can moderate negative market reactions, though the effect is complex. Therefore, when accounting standards fail to recognize an asset, voluntary disclosure becomes the proxy through which investors value the firm’s unrecorded intangible capital.
Empirical literature examining the value relevance of risk disclosure has yielded mixed results, largely because of methodological limitations. Early studies in emerging markets, such as Alzead and Hussainey (2017), found a positive association between general risk disclosure and firm value. As the focus shifted to cybersecurity, Alsadoun and Albaz (2025) provided evidence from Saudi Arabia that cybersecurity governance disclosure positively influences firm value. However, the evidence is far from uniform. Linsley and Shrives (2006) find that generic risk disclosures carry limited information content, while more recent work suggests that valuation effects are highly context-dependent and sensitive to the quality and comparability of the disclosure framework.
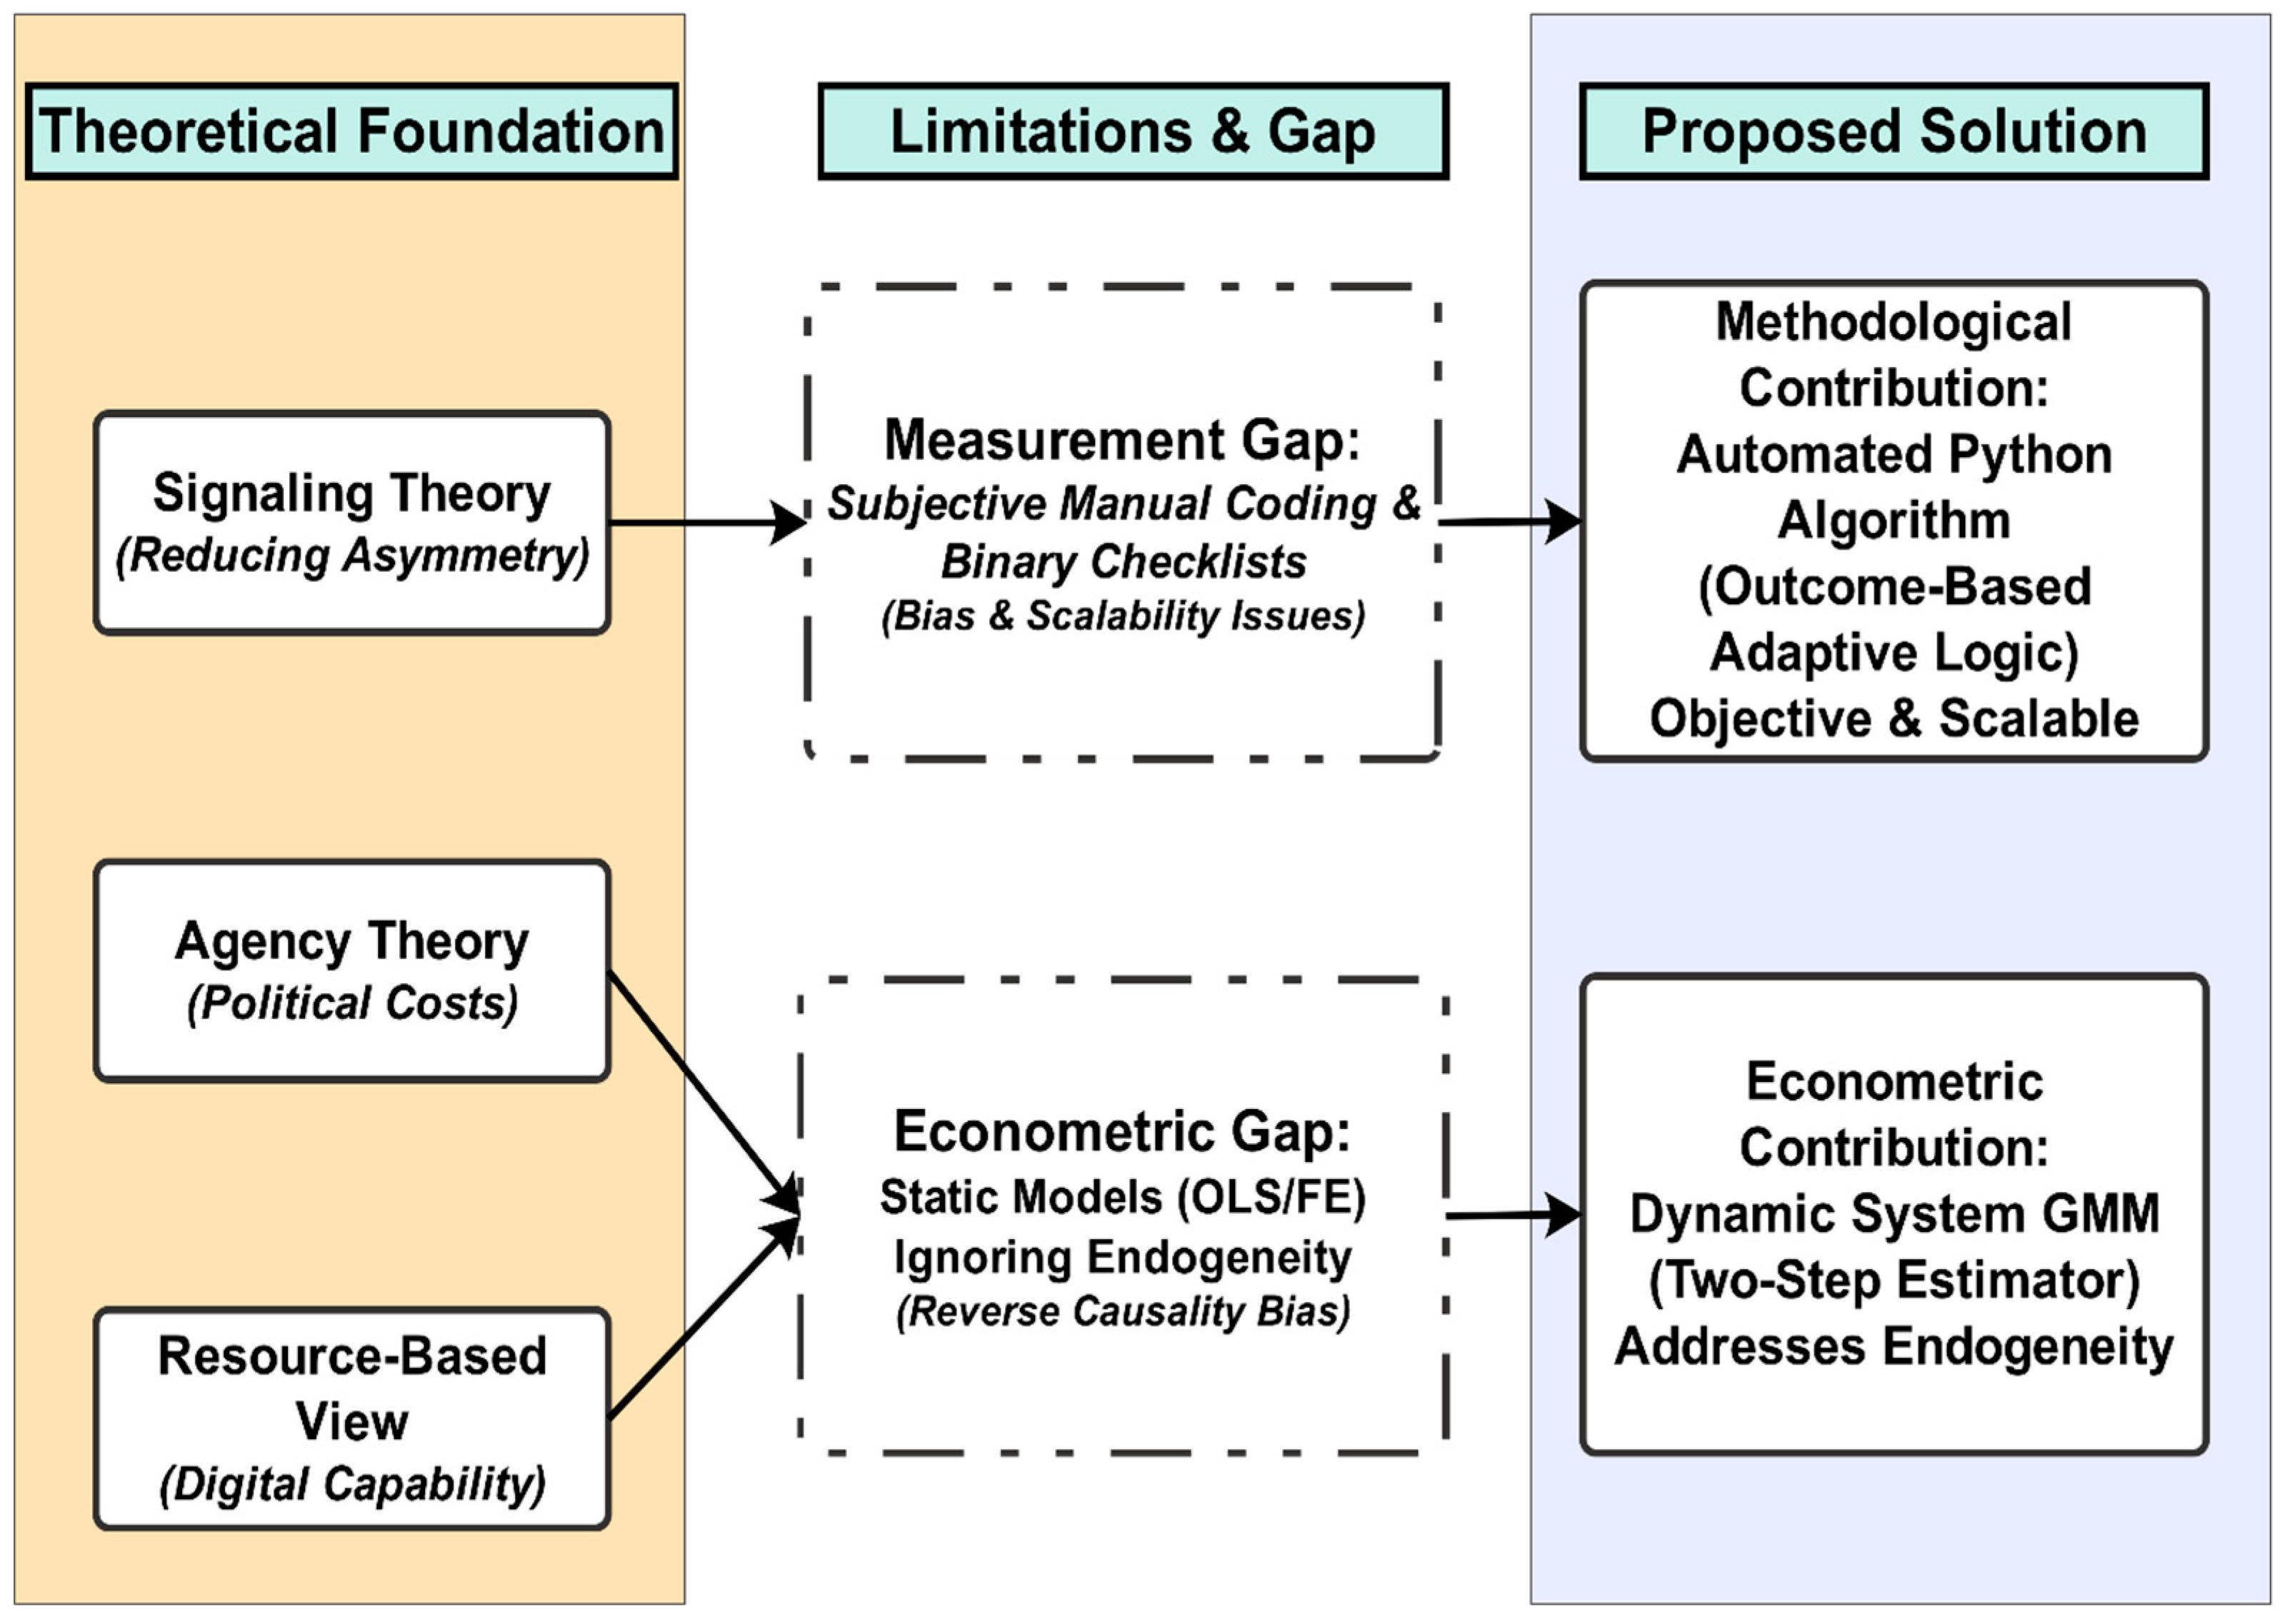
These studies predominantly use manual content analysis or binary checklists. Loughran and McDonald (2016) argue that traditional measures are ill-suited for financial documents, while Krippendorff (2018) highlights that manual coding is susceptible to subjectivity and restricts scalability. Static estimation models (OLS and Fixed Effects) often ignore dynamic endogeneity and reverse causality (Wintoki et al., 2012). Recent literature emphasizes the necessity of dynamic estimators like System GMM to help alleviate these concerns, rather than fully resolve them (Chen et al., 2026; Hunjra et al., 2024). Figure 1 synthesizes the conceptual framework and the research gaps identified in the literature.
In the Saudi market, the Capital Market Authority and Saudi Tadawul Group actively promote digital transformation under Vision 2030 (CMA, 2017; SDAIA, 2023; Saudi Tadawul Group, 2024). We propose that the intensity of DRRD acts as a critical value driver. By voluntarily disclosing detailed information about digital risk oversight, firms reveal their hidden reputational capital, theoretically lowering estimation risk. Schena et al. (2022) found a robust positive relationship between digital reputation and performance, suggesting that digital reputation acts as a strategic resource. Whether the Saudi market has developed sufficient informational efficiency to price the quality of digital risk disclosures, however, remains an open empirical question that this study seeks to address.
Hypothesis 1: 
Digital Reputation Risk Disclosure has a significant influence on firm value.
However, the strength of this signaling mechanism is likely conditional on firm size. The political cost hypothesis suggests that larger firms are under greater scrutiny (Jensen, 1986). Since large firms invest disproportionately in proprietary IT systems for competitive advantage (Bessen, 2020), the marginal benefit of credible disclosure is higher for them to legitimize their dominant position. Conversely, smaller firms may lack the visibility for their signals to be fully priced. Recent empirical work supports this view, suggesting that the value-relevance of digital transformation is contingent upon scale (Wang et al., 2025).
Hypothesis 2: 
Firm Size moderates the relationship between digital reputation risk disclosure and firm value.

3. Research Design and Methodology

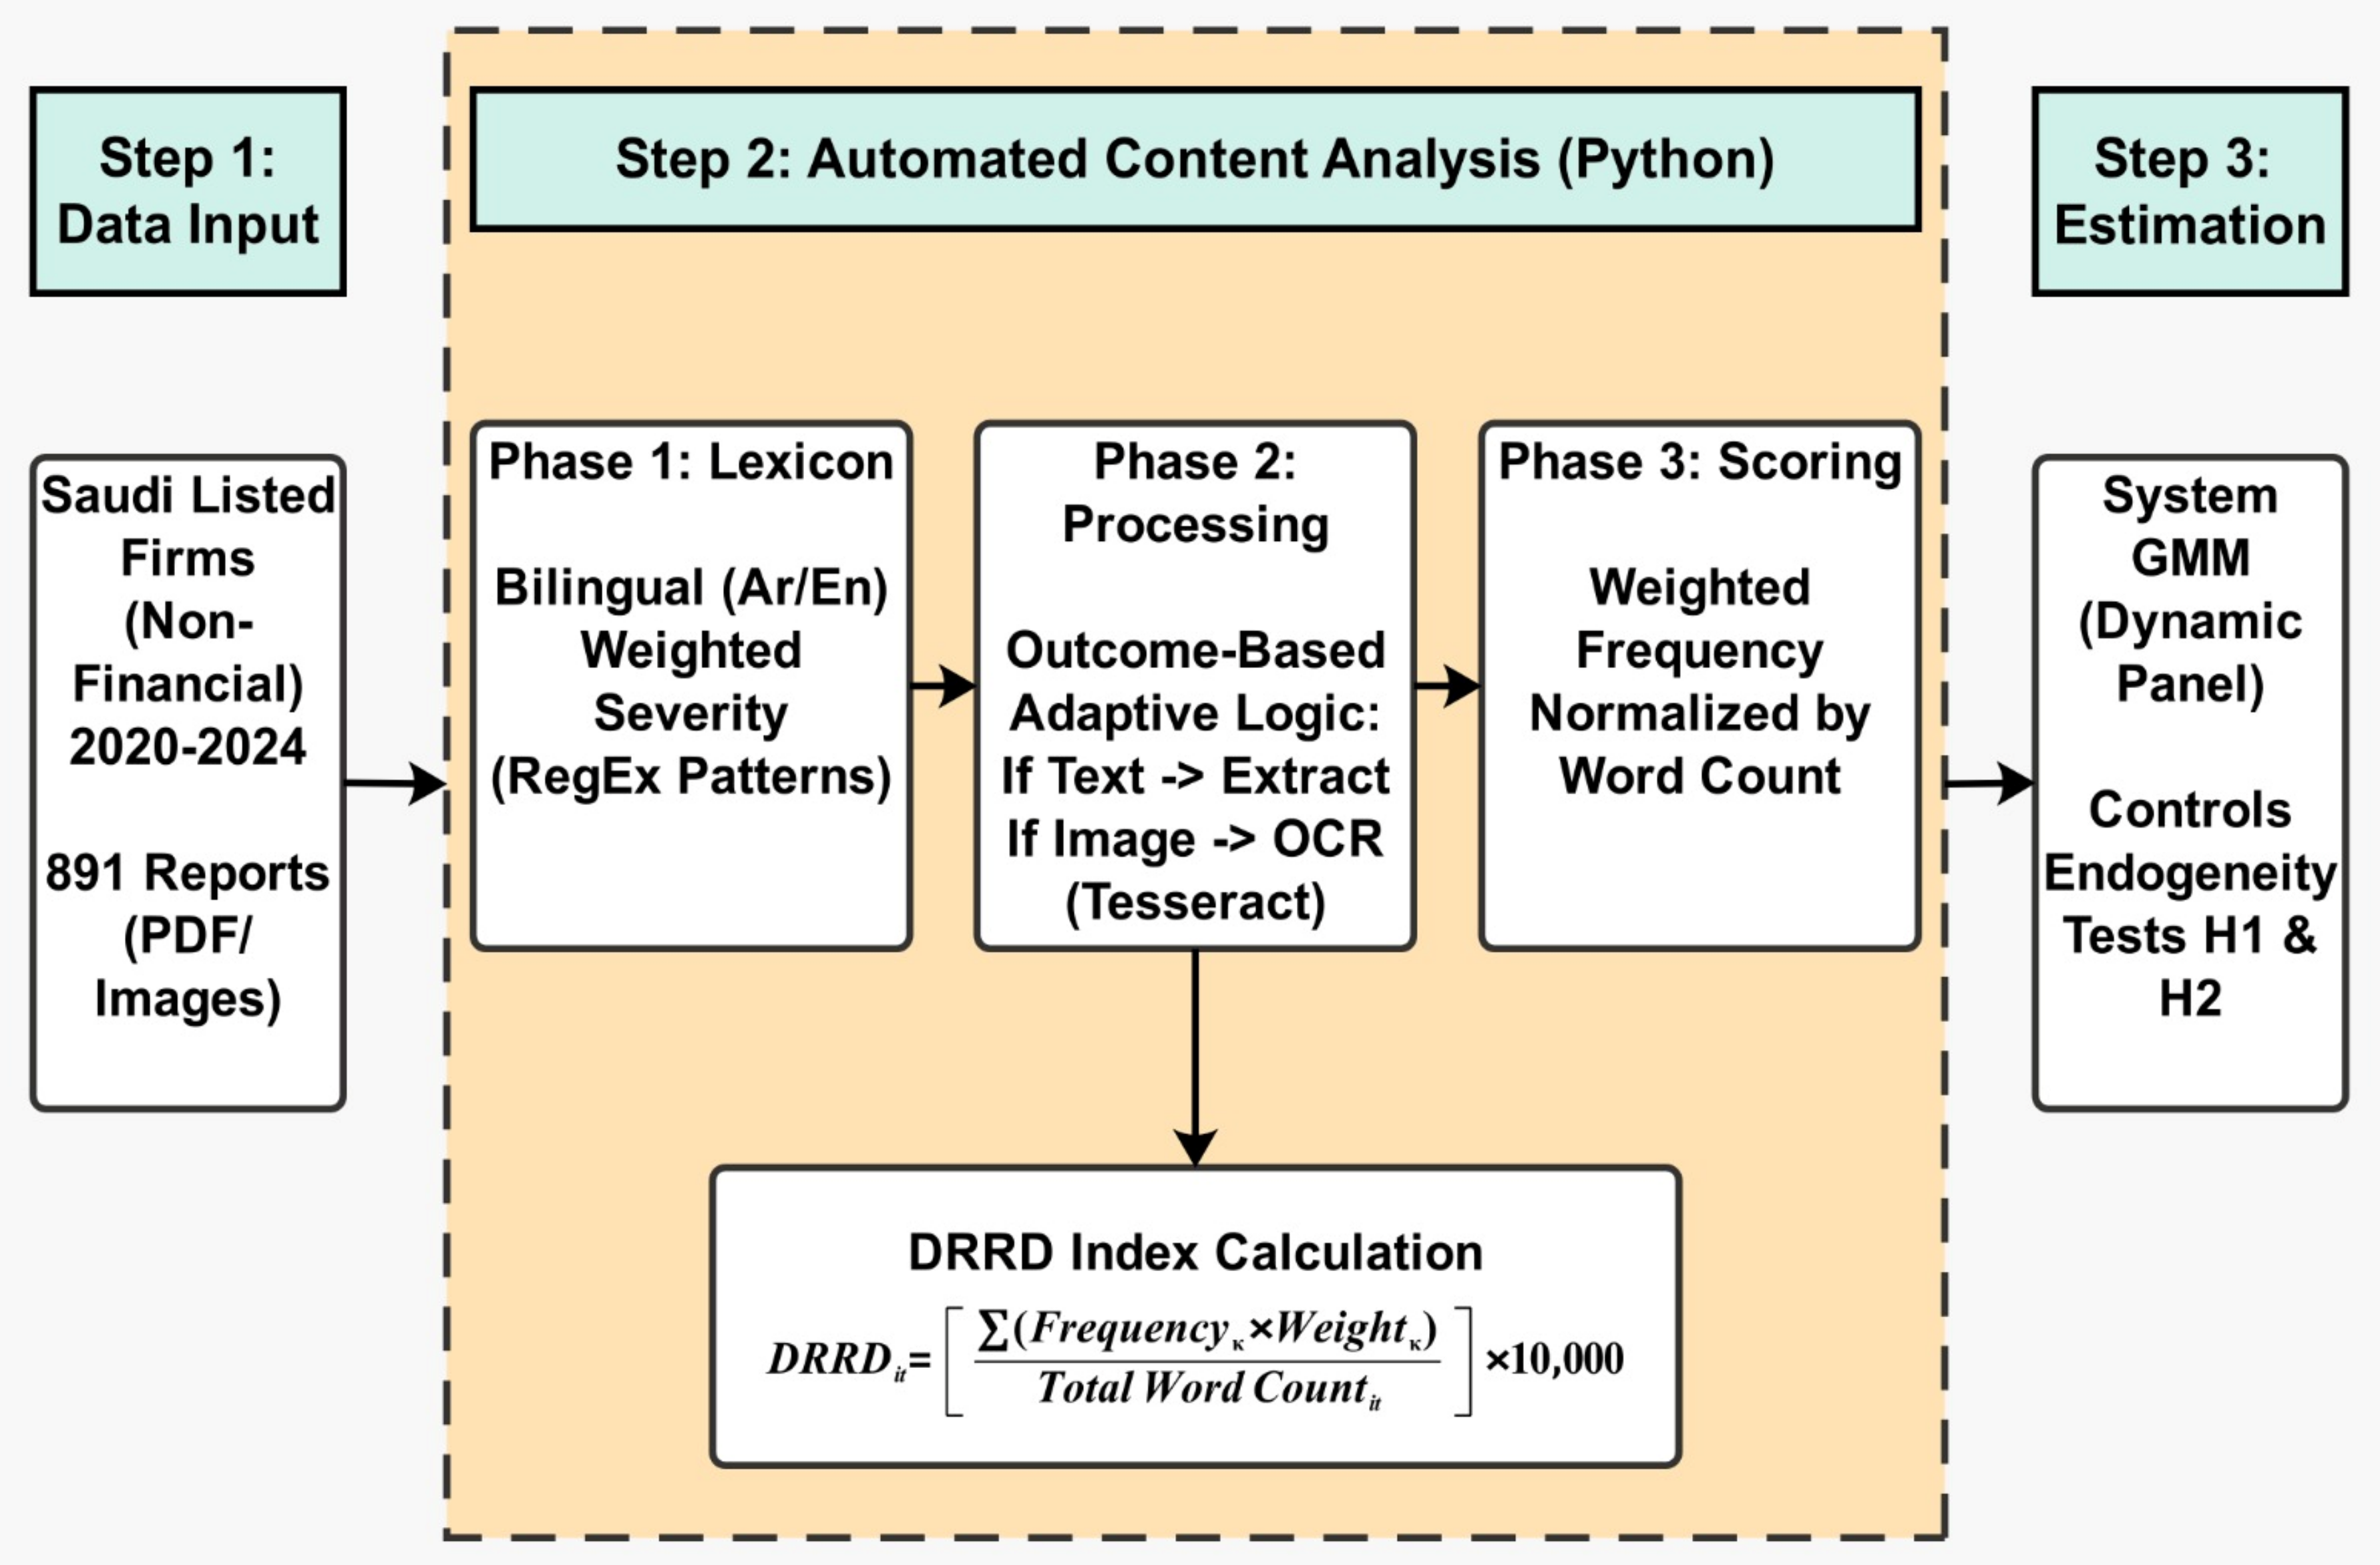
This section details the empirical research design employed to rigorously examine the causal relationship between DRRD and firm value. Addressing the measurement gaps and methodological limitations identified in the literature, this study departs from traditional manual coding by adopting a novel, two-stage quantitative framework. First, it uses an automated, bilingual Python (Version 3.11) algorithm to construct an objective disclosure index, ensuring scalability and eliminating human cognitive bias. Second, it applies the dynamic Two-Step System Generalized Method of Moments estimator to help alleviate dynamic panel bias and endogeneity concerns arising from reverse causality and unobserved heterogeneity. Figure 2 provides an overview of this two-stage process.

3.1. Overview and Research Philosophy

The positivist paradigm facilitates the testing of hypotheses derived from existing theories, namely the Resource-Based View, Signaling Theory, and Agency Theory, the latter providing the theoretical grounding for the agency cost-based control variables included in the econometric models, through the empirical analysis of observable quantitative data (Saunders et al., 2019).
Given the longitudinal nature of corporate reporting and market valuation, the study uses a quantitative approach based on dynamic panel data analysis. This approach is particularly suitable for determining causal relationships and controlling for unobserved heterogeneity among firms over time (Wooldridge, 2010). The methodology is designed to address the complexities of the Industry 4.0 era, where digital resilience has emerged as a critical intangible asset. By integrating advanced computational content analysis with robust econometric estimation (System GMM), this research provides a roadmap for ensuring the validity, reliability, and replicability of the findings.

3.2. Data and Sample Selection

3.2.1. Research Population and Context

The population for this study comprises all companies listed on the Saudi Exchange (Tadawul) for the period spanning from 2020 to 2024. This specific timeframe was strategically selected to capture the pivotal shifts in the Saudi digital landscape, characterized by the acceleration of digital transformation following the COVID-19 pandemic and the enforcement of stringent cybersecurity regulations, such as the Personal Data Protection Law (PDPL) (SDAIA, 2023) and the Essential Cybersecurity Controls (ECC) (NCA, 2024).
Saudi Arabia provides an informative empirical setting for this study, given the strategic emphasis of Vision 2030 on digital transformation and cybersecurity. These policy priorities have accelerated firms’ reliance on digital infrastructures, potentially heightening their exposure to digitally driven reputational risks. Within this context, the Saudi capital market (Tadawul) offers a relevant environment in which to examine whether disclosures related to digital reputation risk are reflected in firm valuation.

3.2.2. Sample Filtration and Exclusion Criteria

To ensure that the sample is internally consistent and that financial measures are comparable across firms, the analysis applies a clear and transparent data-screening process. Firms operating in the banking, insurance, and diversified financial sectors are excluded, as their balance sheet structures, regulatory requirements, and reporting practices differ materially from those of non-financial firms. As a result, commonly used valuation measures, including Tobin’s Q, are not directly comparable across these groups, a concern widely acknowledged in the corporate finance literature (Fama & French, 1992).
The sample is further refined by excluding firms with insufficient data coverage. Companies with missing annual reports, irregular trading histories, or gaps in key financial information extending beyond two consecutive years are removed to preserve the reliability of the panel structure. In addition, firms with fiscal year-ends other than December 31 are excluded to avoid timing inconsistencies that could affect cross-sectional comparisons.
After applying these screening criteria, the final dataset consists of an unbalanced panel of 619 firm-year observations from 132 non-financial firms listed on the Saudi Exchange, covering the period 2020–2024. The panel is unbalanced due to variation in listing dates and data availability, with a minimum of 2 and a maximum of 5 observations per firm (T-bar = 4.69). Financial and market data are obtained from Tadawul and firms’ audited financial statements, while disclosure-related information is collected through an automated content analysis of Board of Directors’ reports, annual reports, and ESG disclosures.

3.3. Measurement of Variables

3.3.1. The Dependent Variable: Firm Value (Tobin’s Q)

To measure firm value, this study utilizes Tobin’s Q, a forward-looking market measure widely accepted in disclosure and corporate governance literature (Gompers et al., 2003; Yermack, 1996). Unlike accounting-based measures such as Return on Assets (ROA), which reflect historical performance and are subject to earnings management, Tobin’s Q captures investors’ expectations of future growth and the market’s valuation of intangible assets, including digital reputation.
A Tobin’s Q ratio greater than 1.0 indicates that the market values the firm’s assets higher than their replacement cost, implying that the firm possesses valuable intangible assets (e.g., strong digital resilience or reputation). The variable is calculated as follows (Chung & Pruitt, 1994):
T o b i n Q i t = T o t a l   A s s e t s i t T o t a l   E q u i t y i t + M a r k e t   V a l u e   o f   E q u i t y i t T o t a l   A s s e t s i t
where:
  • Market Value of Equity is the closing stock price at year-end multiplied by the number of outstanding shares.
  • Total Assets is the book value of total assets.
  • Total Equity is the book value of shareholders’ equity.
On Tadawul, listed firms are required to publish their annual reports within a regulated window following the fiscal year-end. Since all sampled firms have a 31 December fiscal year-end, annual reports for year t are systematically published between January and April of year t + 1. The market value of equity used to compute Tobin’s Q is measured at 31 December of year t, reflecting all information available to investors during that fiscal year through interim disclosures, regulatory filings, and public announcements. The DRRD index is constructed from the same fiscal year’s corporate documents and matched to the contemporaneous year-end market valuation, consistent with standard practice in the voluntary disclosure literature. Nevertheless, it should be acknowledged that capital markets may incorporate narrative disclosures with a temporal lag. While the present study focuses on contemporaneous matching between disclosure and market valuation, delayed market responses cannot be fully ruled out and warrant further research.

3.3.2. The Independent Variable: Digital Reputation Risk Disclosure (DRRD)

Measuring the extent of DRRD poses substantive methodological challenges, largely due to the unstructured nature of narrative corporate reporting and the volume of textual data involved. In the present study, the team analyzed 891 valid PDFs (some firms have two documents: an annual report or board of directors report and an ESG report), which made traditional manual content analysis impractical and vulnerable to subjectivity and coding inconsistencies (Krippendorff, 2018). To address these limitations and ensure a consistent and replicable measurement approach, this study develops a proprietary Python-based automated content analysis procedure.
The construction of the DRRD measure follows a structured, multi-stage process designed to accommodate heterogeneous reporting formats and the bilingual disclosure environment of the Saudi capital market.
  • Phase 1: Bilingual Lexicon Development
A central component of this process is the development of a bilingual weighted lexicon, reflecting the fact that firms listed on Tadawul disclose information in both Arabic and English. The lexicon classifies disclosure terms into severity-based categories, drawing on foundational cybersecurity research (Gordon et al., 2010) and recent methodological advances in the measurement of digital and textual constructs (Wang et al., 2025; Zhai et al., 2022).
To ensure construct validity, keyword selection was guided by the conceptual distinction proposed by (Eckert, 2017) between general corporate reputation and reputation risk. Accordingly, the lexicon focuses on observable risk events, regulatory exposure, and concrete mitigation mechanisms, such as data breaches, unauthorized access, or encryption practices, rather than on generic or promotional language. The selection of terms was further informed by the Saudi regulatory context, including the frameworks issued by the NCA and the PDPL, ensuring institutional relevance.
Consistent with the recommendations of, the lexicon was developed through a systematic category-building process grounded in qualitatively derived risk dimensions. To preserve semantic validity (Krippendorff, 2018), the lexicon was tailored to the linguistic and regulatory characteristics of the Saudi market rather than relying on generic dictionaries.
The Selected Sample of the Bilingual DRRD Lexicon is reported in Appendix A. Disclosure items are assigned weights ranging from 1 to 3 to reflect differences in severity and materiality, allowing the DRRD index to distinguish between routine governance statements and disclosures related to realized incidents or high-impact risks. In implementation, the automated extraction procedure uses pattern-based matching techniques (RegEx) to identify relevant morphological variants of each term across Arabic and English texts. This approach ensures consistent identification of disclosures across heterogeneous narrative formats and reduces measurement noise arising from linguistic variation. Additional details on the processing steps, normalization procedures, and scoring rules are documented in Appendix B, while the fully executable replication code is provided as Supplementary Material to support transparency and reproducibility.
  • Phase 2: Algorithmic robustness and adaptive extraction logic
A key methodological challenge in data collection stems from the heterogeneity of corporate reporting formats. Many reports published on Tadawul are image-based or non-machine-readable, causing standard text-mining tools to fail. Importantly, file size does not reliably indicate processing complexity, as image-based documents can be more demanding to process than larger text-based files.
To overcome the limitations of standard text mining and avoid sample selection bias (where firms with scanned reports are systematically excluded), this study implemented an adaptive extraction method:
  • Step A (Primary Scan): The algorithm first attempts a standard high-speed text extraction.
  • Step B (Conditional Zero-Score Trigger): The system validates the output. If the primary scan yields a score of zero (indicating an empty text layer or a scanned document), the algorithm automatically flags the file as Complex/Image-based, regardless of its file size.
  • Step C (Page-by-Page Iteration & OCR): Upon flagging, the algorithm switches to a memory-efficient, iterative processing mode. It processes the document page-by-page, utilizing the Tesseract Optical Character Recognition (OCR) engine to convert visual content into text. This ensures that even the most technically challenging files are accurately measured rather than discarded. This automated approach aligns with (Krippendorff, 2018) assertion that computational content analysis serves as an objective measurement tool, eliminating the intra-coder inconsistencies inherent in human coding and ensuring the stability and replicability of the data generation process.
  • Phase 3: Scoring and Normalization
The final DRRD index is calculated by aggregating the weighted frequency of keywords from the bilingual lexicon and normalizing it by the automated total word count of each document. This normalization creates a comparable ‘disclosure density metric’ (Krippendorff, 2018), ensuring that the metric reflects the density of risk disclosure independent of the document’s length (Loughran & McDonald, 2011). The formula is:
D R R D i t = F r e q u e n c y κ × W e i g h t κ T o t a l   W o r d   C o u n t i t × 10,000
The multiplication by 10,000 is applied as a scaling factor. Following standard econometric practice (Wooldridge, 2010), scaling the independent variable ensures that the regression coefficients are reported in manageable units without affecting the statistical significance or the t-statistics of the estimates, thereby enhancing the interpretability of the results, given the low frequency of technical terms.
With respect to document aggregation, on average, approximately 2.4 documents per firm-year were collected across the sample, comprising the annual report, the Board of Directors’ report published separately on Tadawul, and, where available, an ESG or sustainability report. For each firm i in year t, all available documents are concatenated into a single composite textual corpus before the keyword extraction and scoring procedure is applied. This ensures that the DRRD score reflects the totality of digital risk disclosure made by the firm in a given year, regardless of which document the disclosure appears in. Double-counting is prevented by the normalization step in Equation (2), as the total word count in the denominator encompasses the entire composite corpus, ensuring that the score reflects disclosure density rather than raw keyword frequency.

3.3.3. The Control Variables

To isolate the marginal effect of DRRD on firm value, the econometric models include a comprehensive set of control variables identified in standard corporate finance literature as determinants of Tobin’s Q:
  • Firm Size (SIZE): Measured as the natural logarithm of total assets. Larger firms typically possess superior resources for digital defense, but simultaneously face higher visibility and political costs, which may pressure them into greater disclosures (Jensen, 1986; Wang et al., 2025).
  • Financial Leverage (LEV): Measured as the ratio of total liabilities to total assets. This variable controls for financial risk and agency costs of debt, which can constrain a firm’s financial flexibility and negatively impact valuation (Hunjra et al., 2024; Myers, 1977).
  • Sales Growth (GROWTH): Measured as the percentage change in sales revenue from year t − 1 to year t. This serves as a proxy for the firm’s investment opportunities and future growth potential, which are critical determinants of Tobin’s Q (Chen et al., 2026).
  • Profitability Status (LOSS): A dummy variable equal to 1 if the firm reported a net loss in the current year, and 0 otherwise. This controls for the non-linear valuation properties of loss-making firms and their distinct disclosure incentives (Hayn, 1995; X. Ren et al., 2023).
  • Firm Age (AGE): The number of years since the firm’s listing on the Saudi Exchange (Tadawul). Listing date is used as the reference point rather than incorporation date, as it marks the firm’s entry into the public equity market and its subjection to CMA disclosure requirements, making it the more theoretically relevant benchmark for a study focused on market valuation and public disclosure behavior.
  • Audit Quality (BIG4): A dummy variable equal to 1 if the firm is audited by one of the Big 4 audit firms (EY, PwC, KPMG, Deloitte), and 0 otherwise. This controls for the credibility and assurance quality of the reported non-financial information (DeAngelo, 1981; S. Ren et al., 2020).
  • Digital Transformation Intensity (DTI): Measured as a pre-computed text-based index of digital transformation keywords, normalized by total word count and scaled by 10,000. Firms with higher digitalization levels tend to simultaneously invest more in digital risk governance and report higher market valuations, creating a potential confound that this variable is designed to absorb. Its inclusion follows the methodological rationale that omitting a firm-level digitalization proxy may introduce a bias in the coefficient on DRRD, since both variables reflect the same underlying digital capability dimension (Wang et al., 2025; Zhai et al., 2022).
  • SG&A Intensity (SGA_INT): Measured as the ratio of selling, general, and administrative expenses to total assets. This variable proxies for investment in organizational capabilities, human capital, marketing infrastructure, and data systems, expenditures that are immediately expensed under IAS 38 yet are widely recognized as a primary vehicle for intangible value creation. Peters and Taylor (2017) demonstrate that SG&A spending constitutes the largest component of firms’ intangible capital stock, substantially exceeding R&D in magnitude, while Enache and Srivastava (2017) show that the investment portion of SG&A is positively and significantly associated with future earnings and Tobin’s Q. Controlling for SG&A intensity therefore ensures that the estimated effect of DRRD on firm value is not confounded by cross-sectional differences in capability-intensive spending that independently drive both disclosure behavior and market valuation.

3.4. Econometric Models and Estimation Strategy

3.4.1. The Endogeneity Problem and Model Selection

Investigating the relationship between disclosure and firm value is methodologically fraught with endogeneity issues, particularly simultaneity (reverse causality) and unobserved heterogeneity. Standard estimators like OLS and Fixed Effects often yield inconsistent results in dynamic settings where current performance is influenced by past realizations (Wintoki et al., 2012). Recent high-impact literature highlights these methodological challenges, necessitating advanced identification strategies (S. Ren et al., 2020; X. Ren et al., 2023; Wang et al., 2025; Zhai et al., 2022). To help alleviate these concerns, we employ the Two-Step System Generalized Method of Moments (System GMM) estimator developed by Arellano and Bover (1995) and Blundell and Bond (1998), as advocated by recent finance studies (Chen et al., 2026; Hunjra et al., 2024).
This estimator is superior in our context for three reasons. First, it explicitly models the dynamic nature of corporate value, correcting for the bias inherent in static models (Flannery & Hankins, 2013). Second, it utilizes lagged levels and differences as internal instruments to help mitigate endogeneity concerns without requiring external instruments, under the assumption that these instruments are valid (Ullah et al., 2018). Third, it significantly improves efficiency compared to the Difference GMM estimator, particularly when the dependent variable exhibits persistence (Baltagi, 2021).
To ensure robust inference, we apply the Windmeijer (2005) finite-sample correction to mitigate the downward bias in standard errors associated with two-step estimation (Arellano & Bond, 1991). Furthermore, to address ‘instrument proliferation’, which can weaken the Hansen J-test (Roodman, 2009), we restrict the instrument set to lags 3–5 and engage the ‘collapse’ option. This strategy aligns with Heid et al. (2012) and Roodman (2009) to preserve the validity of over-identification tests. All statistical computations, including the dynamic System GMM estimation, were performed using STATA software (Version 19).

3.4.2. Regression Models

The empirical analysis follows a hierarchical regression approach to rigorously disentangle the direct effects from the conditional effects of disclosure (Baron & Kenny, 1986). First, the Baseline Model is estimated to capture the unconditional marginal impact of DRRD on firm value H 1 . Subsequently, the Interaction Model is introduced to examine the moderating role of firm size, testing whether the value-relevance of disclosure is contingent upon firm visibility H 2 . This step-wise specification allows for assessing the incremental explanatory power of the interaction term while mitigating potential multicollinearity issues often associated with complex models (Dawson, 2014).
To account for systematic cross-sectoral differences in digital intensity, disclosure norms, and Tobin’s Q levels, all models include year fixed effects, and industry fixed effects (16 sector dummies based on the Tadawul sector classification) are incorporated as standard instruments in the IV set of the System GMM estimator. The inclusion of industry dummies controls for the omitted variable bias that may arise from unobserved sector-level heterogeneity, for example, systematic differences between technology and energy sectors in both DRRD levels and market valuations (Fama & French, 1992). This specification is consistent with standard practice in corporate finance panel studies and ensures that the estimated DRRD coefficient captures firm-level disclosure behavior rather than industry-wide patterns.
Model 1 (The baseline model): To test the first hypothesis (H1), which examines the relationship between digital reputation disclosure and firm value, we estimate the following dynamic regression equation:
T o b i n Q i t = β 0 + β 1 T o b i n Q i t 1 + β 2 D R R D i t + β 3 S I Z E i t + β 4 L E V i t + β 5 G R O W T H i t + β 6 L O S S i t + β 7 A G E i t + β 8 B i g 4 i t + Y e a r t + η i + ε i t
where:
  • β 0 : The intercept (constant term).
  • β 1 : The coefficient of the lagged dependent variable, capturing the dynamic persistence of firm value.
  • β 2 : The primary coefficient of interest, measuring the direct impact of DRRD on firm value (Testing H 1 ).
  • β 3 β 8 : The coefficients for the firm-specific control variables ( S I Z E , L E V , G R O W T H , L O S S , A G E , B i g 4 ) , accounting for other determinants of firm value.
  • Y e a r t : Year dummy variables to control for time-specific macroeconomic shocks.
  • η i : Unobserved firm-specific fixed effects.
  • ε i t : The idiosyncratic error term.
Model 2 (The interaction model): To test the second hypothesis (H2), which examines whether the relationship between digital reputation disclosure and firm value varies with firm size, we introduce the interaction term I n t e r i t . Consistent with the definitions in Table 1, the interaction term is calculated using mean-centered variables to mitigate potential multicollinearity (Ahn et al., 2024; Aiken & West, 1991):
I N T E R i t = D R R D i t D R R D _ × S I Z E i t S I Z E _
Accordingly, the augmented regression model incorporating this term is specified as follows:
T o b i n Q i t = β 0   + β 1 T o b i n Q i t 1 + β 2 D R R D i t + β 3 S I Z E i t + β 4 I N T E R i t + β 5 L E V i t +   β 6 G R O W T H i t + β 7 L O S S i t + β 8 A G E i t + β 9 B i g 4 i t + Y e a r t +   η i + ε i t
where:
  • β 2 : Measures the main effect of disclosure on firm value conditional on average firm size.
  • β 4 : The interaction coefficient measures the moderating effect of firm size. A positive and significant β 4 confirms that the benefits of DRRD are amplified for larger firms (Testing H 2 ).
  • β 3 , β 5 β 9 : The coefficients for the control variables and the main effect of size.
To ensure that the baseline findings are not confounded by firm-level digitalization or capability-intensive spending, two additional control variables are incorporated into the robustness specifications. First, Digital Transformation Intensity (DTI) controls for the possibility that more digitalized firms simultaneously disclose more about digital risks and command higher market valuations, thereby introducing an upward bias in the DRRD coefficient if omitted (Wang et al., 2025; Zhai et al., 2022). Second, SG&A Intensity (SGA_INT) proxies for investment in organizational capabilities, human capital, and marketing infrastructure, expenditures that are immediately expensed under IAS 38 but are widely recognized as a primary source of intangible value creation (Enache & Srivastava, 2017; Peters & Taylor, 2017). Both variables are included as exogenous controls in the robustness specifications reported in Section 4.5.
Table 1 outlines the variables used in the estimation models and clarifies their relevance to the study’s hypotheses.

3.5. Model Validity and Diagnostic Tests

To assess the reliability of the system GMM estimates, the study follows standard post-estimation diagnostic procedures commonly adopted in the dynamic panel literature (Arellano & Bond, 1991; Roodman, 2009). These tests are designed to evaluate instrument validity, serial correlation in the error structure, and potential multicollinearity among regressors. Specifically, instrument validity is examined using the Hansen J-test, while the Arellano–Bond test for second-order serial correlation is employed to assess the consistency of the moment conditions. Additionally, variance inflation factors (VIFs) are calculated to assess the presence of multicollinearity among the explanatory variables. The outcomes of these diagnostic tests are reported alongside the main regression results.

4. Results and Discussion

This section presents the empirical results of the study. It begins with a description of the sample selection process, followed by the descriptive statistics of the study variables. Subsequently, a visual analysis of data distribution is provided, along with a correlation analysis to examine the bivariate relationships and test for multicollinearity.

4.1. Sample Selection and Distribution

The initial population consisted of all non-financial companies listed on the Saudi Exchange (Tadawul) for the period from 2020 to 2024. To ensure the reliability of the financial metrics, particularly Tobin’s Q, observations with missing stock price data attributed to recent listings (IPOs) or trading suspensions were excluded, as were firms with incomplete financial data extending beyond two consecutive years and those with non-December fiscal year-ends. Table 2 summarizes the filtration process, which resulted in a final unbalanced panel of 619 firm-year observations from 132 non-financial firms.

4.2. Descriptive Statistics

Table 3 presents the descriptive statistics for the dependent, independent, and control variables. Continuous variables were winsorized at the 1st and 99th percentiles to mitigate the influence of extreme observations, with the statistics reported therefore reflecting the post-winsorization distribution. The maximum Tobin’s Q of 201.198 represents the 99th percentile ceiling of this distribution, reflecting genuine cross-sectional dispersion in market-to-book ratios rather than a residual outlier.
Table 3 shows a high degree of dispersion in firm valuation. The mean Tobin’s Q is 5.264, indicating that, on average, the market value of Saudi-listed firms exceeds their book value of assets. This average, however, masks substantial cross-sectional heterogeneity, as reflected in the large standard deviation (23.702) and the pronounced right skewness (7.759). The average level of DRRD is 2.054, which remains relatively low compared to the observed maximum (21.605), indicating that digital reputation risk disclosure is not yet a standardized practice across firms. The distribution exhibits strong positive skewness (2.997), suggesting that higher disclosure levels are concentrated among a smaller subset of firms.
Firm size averages 14.604 in log-asset terms, and the average leverage ratio is 0.444, consistent with moderate reliance on debt financing. Average profitability, measured by ROA, is modest (2.6%), while 28.3% of firm-year observations report negative earnings. The mean Digital Transformation Intensity (DTI) is 39.376, reflecting wide heterogeneity in digital infrastructure investment across sectors. SG&A intensity averages 0.130, capturing administrative and marketing expenditure relative to assets. The descriptive statistics portray a mature but heterogeneous corporate environment characterized by wide variation in market valuation and uneven adoption of digital risk disclosure practices.

4.3. Correlation Analysis

Table 4 presents the Pearson correlation matrix for the study variables. The matrix serves two purposes: it provides a preliminary mapping of bivariate associations among the regressors, and it allows for an initial assessment of potential multicollinearity concerns prior to multivariate estimation.
Table 4 reports generally low to moderate pairwise correlations among the variables. The highest correlation is observed between firm size and DRRD (0.362), which remains well below conventional thresholds of concern for multicollinearity. This suggests that the explanatory variables capture distinct firm characteristics and can be jointly included in the regression models.
DRRD is positively correlated with firm size and ROA, indicating that larger and more profitable firms tend to disclose more information related to digital risks. This pattern is consistent with greater visibility and resource availability among larger firms. By contrast, the correlation between DRRD and sales growth is weak and statistically insignificant, suggesting that disclosure intensity is not closely related to short-term revenue dynamics.
Tobin’s Q exhibits generally weak bivariate associations with most explanatory variables. Its positive and statistically significant correlation with ROA, although modest, indicates that more profitable firms tend to have higher market valuation. Other correlations with Tobin’s Q are small and statistically insignificant, reinforcing the need for multivariate estimation.
The correlation matrix does not indicate serious multicollinearity concerns among the core regressors. ROA is reported for descriptive purposes only and is not included in the GMM estimation, as its informational content is partially captured by the LOSS indicator and the dynamic specification.
A notably high correlation is observed between SGA_INT and Tobin’s Q (0.927). This reflects the strong association between SG&A-intensive firms and market valuation in the sample and raises potential multicollinearity concerns if included in the baseline specification. For this reason, SGA_INT is introduced only in robustness tests rather than in the main regression models, as discussed in Section 4.5.

4.4. Empirical Results: System GMM Estimation

To examine the study hypotheses while addressing potential endogeneity concerns, most notably simultaneity bias and unobserved firm-specific heterogeneity, this study employs the two-step System Generalized Method of Moments (System GMM) estimator developed by Blundell and Bond (1998). This estimator is particularly appropriate in dynamic panel settings where firm value exhibits persistence and where conventional estimators may produce biased and inconsistent results.
The structure of the revised dataset, characterized by a short time dimension (T-bar ≈ 3.7) and a larger cross-sectional dimension (N = 132 firms, 481 firm-year observations used in GMM estimation), raises legitimate concerns regarding instrument proliferation, which can weaken overidentification tests and compromise statistical inference. To mitigate this risk, the instrument matrix was deliberately restricted in line with the methodological guidance of Roodman (2009) and Heid et al. (2012). Specifically, only lagged values dated t − 3 and t − 5 were employed as instruments, and the instrument set was collapsed to ensure that the number of instruments (15–18) remained well below the number of cross-sectional units (132 firms). This conservative lag structure improves instrument exogeneity, as reflected in Hansen J-test p-values that remain comfortably above conventional significance thresholds across all specifications. As noted by Bond (2002) and Roodman (2009), the Arellano–Bond AR(1) test has limited power in short panels where T-bar is below five. In this setting, failing to reject AR(1) in first differences is expected and does not threaten the validity of the model. What matters for consistency is the absence of second-order serial correlation, and this condition is satisfied across all specifications, as the AR(2) tests are consistently insignificant.
In addition, all models were estimated using robust standard errors adjusted with the Windmeijer (2005) finite-sample correction, which corrects for the downward bias in standard errors commonly associated with two-step GMM estimation. This combination of instrument restriction and finite-sample correction provides a conservative and methodologically rigorous basis for hypothesis testing.
Table 5 reports the two-step System GMM estimation results for Model 1, examining the direct effect of DRRD on firm value (H1).
The model includes the lagged dependent variable to capture the dynamic nature of firm value, DRRD, and the full set of control variables. The coefficient on the lagged firm value is positive and highly significant, confirming strong valuation persistence and validating the dynamic specification of the model.
To assess whether firm size moderates the relationship between digital risk disclosure and firm value, an extended specification incorporating the interaction term between DRRD and firm size is estimated. The results for this moderation model (Hypothesis 2) are presented in Table 6.
Table 6 augments the baseline specification by introducing the interaction term (DRRD × Size) while retaining all control variables. This specification allows for a direct evaluation of whether the market response to digital risk disclosure varies systematically with firm size.

4.5. Robustness Tests

To assess the sensitivity of the baseline findings, four robustness tests are conducted, the results of which are presented in Table 7.
First (R1), industry fixed effects (16 sector dummies based on the Tadawul sector classification) are added to the baseline GMM specification. The DRRD coefficient remains negative (−0.097) and directionally consistent with the main results. The Hansen test p-value of 0.301 and AR(2) p-value of 0.409 confirm instrument validity. This specification addresses the concern regarding omitted industry-level heterogeneity documented in the corporate finance literature (Fama & French, 1992).
Second (R2), to further probe the moderating role of firm size examined in H2, the sample is split at the median of SIZE into large firms (N = 247, 73 firms) and small firms (N = 234, 70 firms), and a within-group Fixed Effects estimator is applied to each sub-sample. The DRRD coefficient is negative and statistically significant for large firms (−0.031, p = 0.014), but statistically indistinguishable from zero for small firms (−0.398, p = 0.459). This differential pattern suggests that the adverse valuation effect of digital risk disclosure is concentrated among larger, more visible firms, consistent with the political cost hypothesis or public scrutiny effect (Jensen, 1986) and the visibility argument advanced by Wang et al. (2025). While the interaction term in Table 6 was statistically insignificant at the full-sample level, the sub-sample analysis provides supplementary evidence that firm size shapes the market’s interpretation of DRRD at the sub-group level.
Third (R3), the dependent variable is replaced by the ratio of intangible assets (excluding goodwill) to total assets. The coefficient on DRRD is negligible (0.0009, p = 0.787), which is theoretically coherent: DRRD relates to reputational and cybersecurity risk management that are expensed under IAS 38 and therefore leave no trace in recognized intangible assets. The Hansen test p-value of 0.298 and AR(2) p-value of 0.715 confirm the validity of the instrument set.
Fourth (R4), a static within-group Fixed Effects estimator is reported as a full-sample benchmark. The DRRD coefficient is −0.041 and statistically insignificant (p = 0.660), while firm age is negative and marginally significant (−0.333, p = 0.098). Across all robustness specifications, the sign of the DRRD coefficient is consistently negative or negligible, never positive and significant, supporting the reliability of the baseline finding and ruling out a pro-disclosure valuation effect in the Saudi capital market.

4.6. Discussion of Results

The empirical findings provide consistent evidence regarding how digital risk disclosure is currently interpreted by investors in the Saudi capital market. While the diagnostic tests confirm the internal validity of the System GMM specifications, the estimated coefficients reveal a clear disconnect between voluntary digital risk reporting and firm valuation.
Before interpreting the substantive implications of the results, it is important to establish the reliability of the estimated models. Collectively, these diagnostics support the robustness of the reported coefficients. As reported in Table 5 and Table 6, the Hansen J-tests yield p-values that exceed conventional significance thresholds, indicating that the null hypothesis of instrument validity cannot be rejected. This outcome confirms that the restricted and collapsed instrument strategy effectively mitigates the instrument proliferation problem highlighted by Roodman (2009). Moreover, the Arellano–Bond AR(2) tests do not indicate the presence of second-order serial correlation, satisfying a key condition for consistent GMM estimation.
Turning to Hypothesis 1, the results reported in Table 5 indicate that digital reputation risk disclosure is negatively and statistically significantly associated with firm value at the 10% level. The estimated coefficient on DRRD is −0.0876 (p = 0.057), suggesting that higher levels of disclosure correspond to lower market valuation. Since Hypothesis 1 is stated as a non-directional test of significant influence, and the estimated coefficient is statistically significant, the evidence supports the acceptance of the alternative hypothesis: DRRD exerts a significant influence on firm value. The direction of this effect, however, is negative rather than positive, running counter to the signaling prediction. One possible explanation is that investors interpret extensive digital risk disclosure as a signal of higher exposure to digital threats rather than as evidence of stronger governance capacity.
It is important to note that the DRRD index is scaled by a factor of 10,000 to improve numerical interpretability. Consequently, the magnitude of the estimated coefficients should be interpreted relative to this scaling and does not imply economically large valuation effects.
A plausible interpretation of this result is provided by the functional fixation hypothesis (Ijiri et al., 1966), which suggests that investors tend to anchor their judgments on salient and easily interpretable accounting numbers while discounting complex or non-standardized narrative disclosures. At the same time, the negative coefficient on DRRD may indicate that investors interpret extensive digital risk disclosure as a signal of heightened exposure to cyber threats or operational vulnerabilities rather than as a positive signal of transparency. Consistent with this interpretation, firm value exhibits strong persistence over time, as evidenced by the highly significant lagged dependent variable, suggesting that investors place greater weight on historical valuation benchmarks than on narrative disclosures related to digital risk.
Hypothesis 2 examined whether firm size moderates the relationship between digital reputation risk disclosure and firm value. As reported in Table 6, the interaction term between DRRD and firm size (INTER) has a coefficient of 0.0031 (p = 0.903), which is statistically indistinguishable from zero. This result indicates that the relationship between digital risk disclosure and firm valuation does not vary significantly with firm size. Consequently, Hypothesis 2 is not supported: firm size does not exert a statistically significant moderating role. One possible interpretation is that in the Saudi capital market, where DRRD is not yet standardized, the market’s negative interpretation of disclosure applies uniformly regardless of firm scale, suggesting that investors have not yet developed size-differentiated frameworks for evaluating digital risk narratives.
Taken together, these findings suggest that the market response to digital risk disclosure is systematically negative rather than neutral. The empirical results indicate that higher levels of disclosure are associated with lower firm valuation at the 10% significance level, suggesting that investors may interpret extensive digital risk reporting as a signal of heightened exposure to technological or cybersecurity risks rather than as evidence of governance strength. Importantly, this negative pattern does not vary significantly across firms of different sizes: the interaction between DRRD and firm size is statistically insignificant, indicating that the adverse valuation effect of disclosure is not moderated by firm scale.
This interpretation is consistent with prior research documenting limited investor attention to complex qualitative disclosures and the potential for risk-related narratives to be interpreted as negative signals (Bloomfield, 2002; Hirshleifer & Teoh, 2003). Evidence from textual analysis research further shows that narrative disclosures often vary substantially in informativeness and comparability, which may constrain their usefulness for valuation unless supported by clear reporting standards and benchmarks (Loughran & McDonald, 2011). In line with the functional fixation perspective (John, 1990), investors may continue to rely primarily on conventional accounting figures when forming valuation judgments. As emphasized by Healy and Palepu (2001), disclosure becomes value-relevant primarily when embedded within credible and comparable reporting frameworks. In the absence of such structure, voluntary digital risk disclosure may influence investor perceptions of risk without necessarily generating positive valuation effects.

5. Conclusions

This study investigates the value relevance of Digital Reputation Risk Disclosure (DRRD) in the Saudi capital market over the period 2020–2024, using a final sample of 619 firm-year observations from 132 non-financial firms. Employing a two-step System GMM estimator with year fixed effects, the analysis examines whether voluntary digital risk disclosures are reflected in firm valuation and whether firm size shapes this relationship. The empirical results indicate that DRRD is negatively associated with firm value at the 10% significance level (H1 accepted), consistent with the functional fixation hypothesis: investors appear to interpret extensive digital risk disclosure as a signal of heightened exposure to technological or cybersecurity risks rather than as evidence of stronger governance. The interaction between DRRD and firm size is statistically insignificant (H2 not supported), indicating that firm scale does not moderate the market’s interpretation of digital risk narratives. Robustness tests confirm these findings are stable across alternative specifications, including industry fixed effects, firm-size sub-sample analysis, and an alternative dependent variable based on the intangible asset ratio.
These findings suggest a structural disconnect between narrative digital risk disclosures and market valuation outcomes. While the Saudi market appears effective at incorporating historical financial information, it remains unresponsive to qualitative, non-standardized disclosures on digital risk. This lack of valuation relevance is particularly striking, given that investors explicitly rank risk-related intangibles as a top priority, assigning them a relevance score of 7.7 out of 10 (IFRS Foundation, 2024b). The stark contrast between this high demand and the negative market response documented in our study suggests that, in the absence of clear benchmarks, even highly desired information may be misinterpreted by investors rather than incorporated into valuation decisions in the expected direction. In this regard, our study provides suggestive empirical evidence that may inform the IASB’s current “User Information Needs” work stream (IFRS Foundation, 2025). Specifically, our results suggest that without the standardized frameworks currently being explored by the Board, voluntary disclosures, even when focused on high-priority areas like digital risk, fail to bridge the valuation gap.
Methodologically, a key strength of this study lies in the development of a replicable, text-based disclosure index and the application of a dynamic econometric framework that addresses endogeneity and persistence concerns. In addition, the focus on an emerging market undergoing structural transformation provides contextually rich evidence that complements the predominantly developed-market literature.
At the same time, the study is subject to limitations. The disclosure measure captures the intensity of reporting rather than its qualitative depth or strategic substance, and the sample period coincides with heightened global uncertainty that may have influenced investor behavior. Moreover, firm value is assessed using a single market-based metric, which may not fully capture alternative valuation channels.
These limitations open several avenues for future research. Subsequent studies could incorporate more refined measures of disclosure quality, tone, and specificity using advanced natural language processing techniques. Extending the analysis to longer time horizons or alternative valuation outcomes, such as the cost of capital or risk premia, may also yield additional insights. As digital risk governance and reporting practices mature, revisiting this relationship in different regulatory settings will be essential to understanding when and how digital risk disclosures become decision-useful for capital markets.

Supplementary Materials

The following supporting information can be downloaded at: https://www.mdpi.com/article/10.3390/ijfs14040088/s1.

Author Contributions

Conceptualization, K.M.H.S.; methodology, K.M.H.S. (textual analysis) and L.B.M. (statistical analysis); software, K.M.H.S. (Python algorithm) and L.B.M. (STATA); validation, K.M.H.S., L.B.M. and A.G.A.R.; formal analysis, K.M.H.S. (textual data) and L.B.M. (econometric models); investigation, K.M.H.S.; resources, K.M.H.S.; data curation, K.M.H.S., L.B.M. and A.G.A.R.; writing, original draft preparation, K.M.H.S. (manuscript body) and L.B.M. (Section 4); writing, review and editing, K.M.H.S., L.B.M. and A.G.A.R.; visualization, K.M.H.S.; supervision, K.M.H.S.; project administration, K.M.H.S. All authors have read and agreed to the published version of the manuscript.

Funding

This research received no external funding.

Institutional Review Board Statement

Not applicable.

Informed Consent Statement

Not applicable.

Data Availability Statement

Data is contained within the article or Supplementary Material.

Conflicts of Interest

The authors declare no conflicts of interest.

Abbreviations

The following abbreviations are used in this manuscript:
AIArtificial Intelligence
ATAAutomated Textual Analysis
CMACapital Market Authority (Saudi Arabia)
DRRDDigital Reputation Risk Disclosure
ECCEssential Cybersecurity Controls
FEFixed Effects
GMMGeneralized Method of Moments
IASInternational Accounting Standard
IASBInternational Accounting Standards Board
IFRSInternational Financial Reporting Standards
NCANational Cybersecurity Authority (Saudi Arabia)
OCROptical Character Recognition
OLSOrdinary Least Squares
PDPLPersonal Data Protection Law
R&DResearch and Development
RBVResource-Based View
RegExRegular Expressions
SDAIASaudi Data & Artificial Intelligence Authority
VIFVariance Inflation Factor
VRINValuable, Rare, Inimitable, and Non-substitutable

Appendix A. Selected Sample of the Bilingual DRRD Lexicon

Dimension & WeightDescriptionSample English KeywordsSample Arabic Keywords
1. Confirmed Incidents
Weight = 3
High Severity
Focuses on realized risks, financial losses, fraud, and direct reputational damage.Digital Fraud, Financial Fraud, Data Breach, Hacking, Leak, Data Exfiltration, Unauthorized Access, Ransomware, Extortion, Identity Theft, Reputation Damage, Litigation, Fines.احتيال مالي، احتيال رقمي، اختراق، تهكير، تسريب بيانات، إفشاء، سرقة بيانات، فقدان بيانات، دخول غير مصرح، برمجيات الفدية (Ransomware) ، ابتزاز، انتحال صفة، تضرر السمعة، دعاوى قضائية.
2. Threats & Compliance
Weight = 2
Medium Severity
Focuses on specific technical threats, vulnerabilities, and sovereign Saudi regulations.PDPL (Personal Data Protection Law), NCA, ECC, Cyber Attack, Malware, Virus, Phishing, Spear Phishing, Vulnerability, Exploit, Zero-day, DDoS, Botnet, Insider Threat.نظام حماية البيانات الشخصية (PDPL) ، الهيئة الوطنية للأمن السيبراني (NCA) ، الضوابط الأساسية (ECC) ، هجوم سيبراني، برمجيات خبيثة، فيروسات، تصيد إلكتروني، ثغرات أمنية، استغلال ثغرة، هجمات حجب الخدمة (DDoS) ، تهديد داخلي.
3. Prevention & Governance
Weight = 1
Standard Disclosure
Focuses on routine defensive measures, governance structures, and general awareness.Cybersecurity, Information Security, Data Privacy, Business Continuity, Disaster Recovery, Compliance, Governance, Encryption, Firewall, SOC, Penetration Testing, 2FA/MFA, Cloud Security, ISO 27001 (ISO/IEC, 2022).أمن سيبراني، أمن المعلومات، خصوصية البيانات، استمرارية الأعمال، تعافي من الكوارث، امتثال، حوكمة تقنية، تشفير، جدار حماية (Firewall) ، مركز عمليات الأمن، اختبار الاختراق، المصادقة الثنائية، الحوسبة السحابية، معيار آيزو 27001.

Appendix B. Algorithmic Processing Logic (Pseudo-Code)

This Appendix reports the core Python functions used to preprocess text and compute the DRRD score. The complete executable pipeline (including file ingestion, PDF/OCR handling, and batch processing) is provided as Supplementary Material.
# 1. Libraries Import
import fitz      # PyMuPDF for fast PDF Text Extraction
import pdf2image    # Convert PDF pages to images (for OCR fallback)
import pytesseract   # Tesseract-OCR Engine (Arabic/English)
import pandas     # Data manipulation and Excel export
import re       # Regular Expressions for pattern matching

# 2. Preprocessing Function (Advanced Normalization & Prefixing)
def normalize_arabic(text):
text = re.sub(r’[\u064B-\u065F\u0670]’, ‘’, text) # Remove diacritics (Tashkeel)
text = re.sub(r’[أإآا]’, ‘ا’, text)           # Unify Alef
text = re.sub(r’ة’, ‘ه’, text)            # Unify Taa Marbuta
text = re.sub(r’ى’, ‘ي’, text)            # Unify Yaa
text = re.sub(r’\s+’, ‘ ‘, text)         # Remove extra whitespace
return text.lower()

def ar_bound(word):
# Advanced Prefix Engine: safely captures single and compound Arabic
# prefixes (e.g., وال، بال، فال، لل، و، ب، ك) without false positives
return pattern_with_prefixes

# 3. Weighted Scoring Function (Dual-Index DRRD & DTI)
def calculate_dual_scores(norm_text, total_words):
scores = {‘DRRD_Weighted’: 0, ‘DTI_Weighted’: 0}

for category, data in COMPILED_LEXICON.items():
# RegEx Search for Arabic/English Patterns
hits = count_matches(data[‘Patterns’], norm_text)
index_type = data[‘Index’]

# Accumulate weighted score (hits * weight)
scores[f’{index_type}_Weighted’] += (hits * data[‘Weight’])

# Final Indices Calculation (Scaled by Basis Points)
SCALE_FACTOR = 10000
drrd_final = (scores[‘DRRD_Weighted’] / total_words) * SCALE_FACTOR
dti_final = (scores[‘DTI_Weighted’] / total_words) * SCALE_FACTOR

return drrd_final, dti_final

# 4. Execution Pipeline (Auto-Concatenation & Hybrid Extraction)
# Step A: Scan directory and Group valid PDF files by Firm-Year (Company_Code + Year).
# Step B: Hybrid Extraction -> Try text extraction via PyMuPDF.
# Step C: Fallback Check -> If extracted valid words < 50, convert page to Image and apply OCR.
# Step D: Auto-Concatenate text from all combined files for the same Firm-Year.
# Step E: Count total valid words. If >= 100 -> Apply Dual Scoring Function.
# Step F: Dynamically save results to Excel every 5 records.

References

  1. Ahmed, T., Maharaj, G., Saxton, G. D., & Zhang, S. (2025). ESG communication tactics and reputational capital on social media. Information, 16(12), 1063. [Google Scholar] [CrossRef]
  2. Ahn, B. H., Patatoukas, P. N., & Skiadopoulos, G. S. (2024). Material ESG Alpha: A fundamentals-based perspective. The Accounting Review, 99(4), 1–27. [Google Scholar] [CrossRef]
  3. Aiken, L. S., & West, S. G. (1991). Multiple regression: Testing and interpreting interactions (1st ed.). Sage Publications, Inc. [Google Scholar]
  4. Alomair, A., Farley, A., & Yang, H. H. (2022). The impact of IFRS adoption on the value relevance of accounting information in Saudi Arabia. Accounting & Finance, 62(2), 2839–2878. [Google Scholar] [CrossRef]
  5. Alsadoun, A. A., & Albaz, M. M. (2025). The impact of cybersecurity risk disclosure and governance on firm value and stock return volatility. Journal of Governance & Regulation, 14(1), 194–205. [Google Scholar] [CrossRef]
  6. Alzead, R., & Hussainey, K. (2017). Risk disclosure practice in Saudi non-financial listed companies. Corporate Ownership and Control, 14(4-1), 262–275. [Google Scholar] [CrossRef]
  7. Arellano, M., & Bond, S. (1991). Some tests of specification for panel data: Monte Carlo evidence and an application to employment equations. The Review of Economic Studies, 58(2), 277–297. [Google Scholar] [CrossRef]
  8. Arellano, M., & Bover, O. (1995). Another look at the instrumental variable estimation of error-components models. Journal of Econometrics, 68(1), 29–51. [Google Scholar] [CrossRef]
  9. Baltagi, B. H. (2021). Econometric analysis of panel data (6th ed.). Springer. [Google Scholar] [CrossRef]
  10. Barker, R., Lennard, A., Penman, S., & Teixeira, A. (2022). Accounting for intangible assets: Suggested solutions. Accounting and Business Research, 52(6), 601–630. [Google Scholar] [CrossRef]
  11. Barney, J. (1991). Firm resources and sustained competitive advantage. Journal of Management, 17(1), 99–120. [Google Scholar] [CrossRef]
  12. Baron, R. M., & Kenny, D. A. (1986). The moderator–mediator variable distinction in social psychological research: Conceptual, strategic, and statistical considerations. Journal of Personality and Social Psychology, 51(6), 1173. [Google Scholar] [CrossRef]
  13. Bessen, J. (2020). Industry concentration and information technology. The Journal of Law and Economics, 63(3), 531–555. [Google Scholar] [CrossRef]
  14. Bloomfield, R. J. (2002). The “incomplete revelation hypothesis” and financial reporting. Accounting Horizons, 16(3), 233–243. [Google Scholar] [CrossRef]
  15. Blundell, R., & Bond, S. (1998). Initial conditions and moment restrictions in dynamic panel data models. Journal of Econometrics, 87(1), 115–143. [Google Scholar] [CrossRef]
  16. Bond, S. R. (2002). Dynamic panel data models: A guide to micro data methods and practice. Portuguese Economic Journal, 1(2), 141–162. [Google Scholar] [CrossRef]
  17. Chen, S., Farooq, U., Tabash, M. I., Alam, M. M., & Khudoykulov, K. (2026). How does green innovation determine corporate physical investment? New empirical evidence. Technological and Economic Development of Economy, 32(1), 233–259. [Google Scholar] [CrossRef]
  18. Chung, K. H., & Pruitt, S. W. (1994). A simple approximation of Tobin’s q. Financial Management, 23(3), 70–74. [Google Scholar] [CrossRef]
  19. CMA. (2017). Corporate governance regulations in the kingdom of Saudi Arabia. Available online: https://gccbdi.org/sites/default/files/content-files/WEBSITE/Corporate%20Governance%20Regulations%20updated%2018%20January%202023.pdf (accessed on 17 January 2026).
  20. Dawson, J. F. (2014). Moderation in management research: What, why, when, and how. Journal of Business and Psychology, 29(1), 1–19. [Google Scholar] [CrossRef]
  21. DeAngelo, L. E. (1981). Auditor size and audit quality. Journal of Accounting and Economics, 3(3), 183–199. [Google Scholar] [CrossRef]
  22. Eckert, C. (2017). Corporate reputation and reputation risk: Definition and measurement from a (risk) management perspective. The Journal of Risk Finance, 18(2), 145–158. [Google Scholar] [CrossRef]
  23. Edelman Trust Barometer. (2025). 2025 edelman trust barometer_Canada report. Available online: https://www.edelman.com/ca/trust/2025/trust-barometer (accessed on 17 January 2026).
  24. Enache, L., & Srivastava, A. (2017). Should intangible investments be reported separately or commingled with operating expenses? New evidence. Management Science, 64(7), 3446–3468. [Google Scholar]
  25. Fama, E. F., & French, K. R. (1992). The cross-section of expected stock returns. The Journal of Finance, 47(2), 427–465. [Google Scholar] [CrossRef]
  26. Flannery, M. J., & Hankins, K. W. (2013). Estimating dynamic panel models in corporate finance. Journal of Corporate Finance, 19, 1–19. [Google Scholar] [CrossRef]
  27. Fu, W., Lyu, Y., & Wan, K. (2025). Data assets and enterprise organizational resilience—Evidence from China. Applied Economics, 1–16. [Google Scholar] [CrossRef]
  28. Gompers, P., Ishii, J., & Metrick, A. (2003). Corporate governance and equity prices. The Quarterly Journal of Economics, 118(1), 107–156. [Google Scholar] [CrossRef]
  29. Gordon, L. A., Loeb, M. P., & Sohail, T. (2010). Market value of voluntary disclosures concerning information security. Management Information Systems Quarterly, 34(3), 567–594. [Google Scholar] [CrossRef]
  30. Hamidil, S. R., Ismail, M. A., Mohamed Shuhidan, S., & Abd Kadir, S. (2023). Corporate reputation in Industry 4.0: A systematic literature review and bibliometric analysis. Sage Open, 13(4), 21582440231200951. [Google Scholar] [CrossRef]
  31. Hayn, C. (1995). The information content of losses. Journal of Accounting and Economics, 20(2), 125–153. [Google Scholar] [CrossRef]
  32. Healy, P. M., & Palepu, K. G. (2001). Information asymmetry, corporate disclosure, and the capital markets: A review of the empirical disclosure literature. Journal of Accounting and Economics, 31(1), 405–440. [Google Scholar] [CrossRef]
  33. Heid, B., Langer, J., & Larch, M. (2012). Income and democracy: Evidence from system GMM estimates. Economics Letters, 116(2), 166–169. [Google Scholar] [CrossRef]
  34. Hirshleifer, D., & Teoh, S. H. (2003). Limited attention, information disclosure, and financial reporting. Journal of Accounting and Economics, 36(1), 337–386. [Google Scholar] [CrossRef]
  35. Huan, X., Parbonetti, A., Redigolo, G., & Zhang, Z. (2024). Social media disclosure and reputational damage. Review of Quantitative Finance and Accounting, 62(4), 1355–1396. [Google Scholar] [CrossRef]
  36. Hunjra, A. I., Bagh, T., Palma, A., & Goodell, J. W. (2024). Is enterprise risk-taking less sensitive to financial flexibility post COVID-19? Evidence from non-linear patterns. International Review of Financial Analysis, 95, 103432. [Google Scholar] [CrossRef]
  37. IFRS Foundation. (2024a). Intangible assets: Academic literature review (agenda reference AP17B). [IASB staff paper]. IFRS Foundation. Available online: https://www.ifrs.org/content/dam/ifrs/resources-for/academics/research-citations/intangible-assets-literature-review-april-2024.pdf (accessed on 17 January 2026).
  38. IFRS Foundation. (2024b). Intangible assets: Cover paper (agenda reference AP17). [IASB staff paper]. IFRS Foundation. Available online: https://www.ifrs.org/content/dam/ifrs/meetings/2024/april/iasb/ap17-cover-paper.pdf (accessed on 17 January 2026).
  39. IFRS Foundation. (2025). Intangible assets: Initial streams of work—Project plan (agenda reference 17). [IASB staff paper]. IFRS Foundation. Available online: https://www.ifrs.org/content/dam/ifrs/meetings/2025/june/iasb/ap17-project-plan.pdf (accessed on 17 January 2026).
  40. Ijiri, Y., Jaedicke, R. K., & Knight, K. E. (1966). The effects of accounting alternatives on management decisions. In R. K. Jaedicke, Y. Ijiri, & O. Nielsen (Eds.), Research in accounting measurement (pp. 186–199). American Accounting Association. [Google Scholar]
  41. ISO/IEC. (2022). Information security, cybersecurity and privacy protection—Information security management systems—Requirements (ISO/IEC 27001:2022). International Organization for Standardization (ISO). Available online: https://www.iso.org/standard/27001 (accessed on 17 January 2026).
  42. Jensen, M. C. (1986). Agency costs of free cash flow, corporate finance, and takeovers. The American Economic Review, 76(2), 323–329. [Google Scholar]
  43. John, R. M. H. (1990). A test of the extended functional fixation hypothesis. The Accounting Review, 65(4), 740–763. [Google Scholar]
  44. Krippendorff, K. (2018). Content analysis: An introduction to its methodology (4th ed.). SAGE Publications. [Google Scholar] [CrossRef]
  45. Linsley, P. M., & Shrives, P. J. (2006). Risk reporting: A study of risk disclosures in the annual reports of UK companies. The British Accounting Review, 38(4), 387–404. [Google Scholar] [CrossRef]
  46. Loughran, T. I. M., & McDonald, B. (2011). When is a liability not a liability? Textual analysis, dictionaries, and 10-Ks. The Journal of Finance, 66(1), 35–65. [Google Scholar] [CrossRef]
  47. Loughran, T. I. M., & McDonald, B. (2016). Textual analysis in accounting and finance: A survey. Journal of Accounting Research, 54(4), 1187–1230. [Google Scholar] [CrossRef]
  48. Muir, S., Tricarichi, N., & Ahuja, K. (2024). Digital assets under IFRS accounting standards vs. US GAAP: The basics. KPMG. [Google Scholar]
  49. Myers, S. C. (1977). Determinants of corporate borrowing. Journal of Financial Economics, 5(2), 147–175. [Google Scholar] [CrossRef]
  50. NCA. (2024). Essential cybersecurity controls (ECC-2: 2024). National Cybersecurity Authority (NCA). Available online: https://nca.gov.sa (accessed on 22 December 2025).
  51. Nobanee, H., Elsaied, F. A., Alhajjar, M., Abushairah, G., & Al Harbi, S. (2023). Reputational risk: A bibliometric review of relevant literature. Emerging Science Journal, 7(2), 654–675. [Google Scholar] [CrossRef]
  52. Odonkor, T., Adewale, T., & Olorunyomi, T. (2023). Valuing intangible assets in the digital economy: A conceptual advancement in financial analysis models. International Journal of Frontline Research in Multidisciplinary Studies, 2(1), 027–046. [Google Scholar] [CrossRef]
  53. Peters, R. H., & Taylor, L. A. (2017). Intangible capital and the investment-q relation. Journal of Financial Economics, 123(2), 251–272. [Google Scholar] [CrossRef]
  54. Ren, S., Wei, W., Sun, H., Xu, Q., Hu, Y., & Chen, X. (2020). Can mandatory environmental information disclosure achieve a win-win for a firm’s environmental and economic performance? Journal of Cleaner Production, 250, 119530. [Google Scholar] [CrossRef]
  55. Ren, X., Zeng, G., & Zhao, Y. (2023). Digital finance and corporate ESG performance: Empirical evidence from listed companies in China. Pacific-Basin Finance Journal, 79, 102019. [Google Scholar] [CrossRef]
  56. Roodman, D. (2009). How to do Xtabond2: An introduction to difference and system GMM in stata. The Stata Journal, 9(1), 86–136. [Google Scholar] [CrossRef]
  57. Saudi Tadawul Group. (2024). Annula report 2023. Available online: https://www.tadawulgroup.sa/wps/wcm/connect/8ed8d93a-3520-4ebb-9e8c-3c1aa0078003/2583_0_2024-03-30_19-10-09_En.pdf?MOD=AJPERES&CVID=povi7yS (accessed on 12 November 2025).
  58. Saudi Vision 2030. (2024). Annual report 2024. Available online: https://www.vision2030.gov.sa/en/annual-reports (accessed on 13 November 2025).
  59. Saunders, M. N. K., Lewis, P., & Thornhill, A. (2019). Research methods for business students (8th ed.). Pearson. [Google Scholar]
  60. Schena, R., Giustina, S., Domenico, D. F., Pasquale, D. V., & Angeloantonio, R. (2022). Digital reputation and firm performance: The moderating role of firm orientation towards sustainable development goals (SDGs). Journal of Business Research, 152, 315–325. [Google Scholar] [CrossRef]
  61. SDAIA. (2023). Personal data protection law. Kingdom of Saudi Arabia. Available online: https://www.dlapiperdataprotection.com/?c=SA (accessed on 12 November 2025).
  62. Spence, M. (1973). Job market signaling. The Quarterly Journal of Economics, 87(3), 355–374. [Google Scholar] [CrossRef]
  63. Steffen, T. D. (2022). The information asymmetry effects of expanded disclosures about derivative and hedging activities. Management Science, 68(8), 6298–6325. [Google Scholar] [CrossRef]
  64. Ullah, S., Akhtar, P., & Zaefarian, G. (2018). Dealing with endogeneity bias: The generalized method of moments (GMM) for panel data. Industrial Marketing Management, 71, 69–78. [Google Scholar] [CrossRef]
  65. Wang, W., Cao, Q., Li, Z., & Zhu, J. (2025). Digital transformation and corporate environmental performance. Finance Research Letters, 76, 106936. [Google Scholar] [CrossRef]
  66. Windmeijer, F. (2005). A finite sample correction for the variance of linear efficient two-step GMM estimators. Journal of Econometrics, 126(1), 25–51. [Google Scholar] [CrossRef]
  67. Wintoki, M. B., Linck, J. S., & Netter, J. M. (2012). Endogeneity and the dynamics of internal corporate governance. Journal of Financial Economics, 105(3), 581–606. [Google Scholar] [CrossRef]
  68. Wooldridge, J. M. (2010). Econometric analysis of cross section and panel data (2nd ed.). MIT Press. [Google Scholar]
  69. Yermack, D. (1996). Higher market valuation of companies with a small board of directors. Journal of Financial Economics, 40(2), 185–211. [Google Scholar] [CrossRef]
  70. Zhai, H., Yang, M., & Chan, K. C. (2022). Does digital transformation enhance a firm’s performance? Evidence from China. Technology in Society, 68, 101841. [Google Scholar] [CrossRef]
  71. Zhu, X., Wang, Y., & Li, J. (2022). What drives reputational risk? Evidence from textual risk disclosures in financial statements. Humanities & Social Sciences Communications, 9(1), 318. [Google Scholar] [CrossRef]
Figure 1. Conceptual framework and research gaps.
Ijfs 14 00088 g001
Figure 2. Overview of the automated DRRD measurement and estimation process.
Ijfs 14 00088 g002
Table 1. Summary of variables, measurements, and hypotheses mapping.
Variable NameSymbolTypeMeasurement/FormulaDescription
Firm valueTobin_QDependent T o t a l   A s s e t s i t T o t a l   E q u i t y i t + M a r k e t   V a l u e   o f   E q u i t y i t T o t a l   A s s e t s i t Target variable representing Firm Value.
Lagged firm valueTobin_Qt − 1Dynamic
Independent
Value of Tobin’s Q in year t 1 .Assumption Check: Controls for dynamic persistence (GMM requirement).
Digital Reputation Risk DisclosureDRRDIndependent F r e q u e n c y κ × W e i g h t κ T o t a l   W o r d   C o u n t i t × 10,000 Tests H 1 : Signaling Effect.
Expectation: β 2 > 0 (Positive).
Interaction TermINTERInteraction D R R D i t D R R D _ × S i z e i t S i z e _ Tests H 2 : Moderating Role.
Expectation: β 4 > 0 (Positive).
Firm SizeSIZEControlNatural logarithm of Total Assets ( L n ( A s s e t s ) ) .Controls for visibility and economies of scale.
LeverageLEVControl T o t a l   L i a b i l i t i e s T o t a l   A s s e t s Controls for financial risk and agency costs.
Sales GrowthGROWTHControl S a l e s t S a l e s t 1 S a l e s t 1 Controls for growth opportunities.
Loss StatusLOSSControlDummy: 1 if Net Income < 0, else 0.Controls for poor performance valuation.
Firm AgeAGEControlNumber of years since establishment.Controls for lifecycle and reputation maturity.
Audit QualityBIG4ControlDummy: 1 if auditor is Big 4, else 0.Controls for reporting credibility.
Digital Transformation IntensityDTIControlPre-computed text-based index, normalized by word count × 10,000Controls for firm-level digitalization; addresses omitted variable bias
SG&A IntensitySGA_INTControlSG&A Expenses/Total AssetsProxy for R&D-type and intangible investment expenditure
Table 2. Sample selection procedure.
DescriptionObservationsFirms (Non-Financial)
Initial firm-year observations (2020–2024)811173
Less: Excluded (missing price/suspended)(192)(41)
Final Sample for Analysis619132
Note: The final dataset comprises 619 firm-year observations from 132 non-financial firms after applying the exclusion criteria. Continuous variables were winsorized at the 1st and 99th percentiles. The GROWTH variable is available for 481 observations, as its year-on-year construction requires a valid lagged observation. System GMM models are estimated on 481 observations across all specifications to ensure comparability.
Table 3. Descriptive statistics of the variables.
VariablesNMeanSd.Min.Max.SkewnessKurtosis
Tobin_Q6195.26423.7020.740201.1987.75962.186
DRRD6192.0543.9930.00021.6052.99712.558
SIZE61914.6041.56611.26118.8890.3283.095
LEV6190.4440.2320.0340.9250.0872.053
GROWTH4810.1560.480−0.8002.6802.73013.700
ROA6190.0260.091−0.3360.242−0.9885.843
AGE61930.55114.2130.00069.0000.4882.608
BIG46190.5070.50001
LOSS6190.2830.45101
DTI61939.37629.9430.000321.9443.34222.378
SGA_INT6190.1300.4070.0063.3577.20555.108
Note: All continuous variables are winsorized at the 1st and 99th percentiles, except DTI. BIG4 and LOSS are binary variables; skewness and kurtosis are not reported. GROWTH is based on 481 observations due to its year-on-year construction.
Table 4. Pearson correlation matrix.
Tobin_QDRRDSIZELEVAgeGrowthROADTIDTI
Tobin_Q1
DRRD0.00371
SIZE−0.0852 *0.3623 ***1
LEV−0.01210.0738 *0.1563 ***1
AGE−0.0175−0.06480.0186−0.0762 *1
GROWTH−0.0061−0.03980.1036 *−0.0648−0.04881
ROA0.0996 *0.1650 ***0.2825 ***−0.2569 ***0.04220.2342 ***1
DTI0.05700.7467 ***0.2046 ***0.0862 *−0.0581−0.07120.0691 *1
SGA_INT0.9266 ***−0.0002−0.1246 ***0.0629−0.0107−0.05140.03220.0682 *1
Note: Pearson correlation coefficients. p-values in parentheses. *, *** denote significance at the 10% and 1% levels, respectively. GROWTH based on 481 observations; all other variables based on 619 observations.
Table 5. Two-Step System GMM Regression Results: Direct Effect of Digital Risk Disclosure.
Firm Value (Tobin’s Q, Dep. Var.)Coef.Std. Err.tp > |t|[95% Conf. Interval]
Tobin_Qt − 10.80540.016947.750.000 ***0.77210.8388
DRRD−0.08760.0456−1.920.057 *−0.17780.0025
SIZE−0.23710.1565−1.510.132−0.54670.0725
LEV0.54971.02760.530.594−1.48322.5827
GROWTH0.21040.32930.640.524−0.44100.8619
LOSS−0.60680.3084−1.970.051 *−1.21690.0034
AGE0.00730.00760.950.343−0.00780.0223
BIG41.24700.77561.610.110−0.28742.7814
Constant2.63322.45121.070.285−2.21627.4825
Model Diagnostics
Observations481
Firms132
Instruments15
Year Fixed EffectsYes
AR(1) z-stat (p-value)−0.31 (0.760)
AR(2) z-stat (p-value)−1.20 (0.230)
Hansen J χ2(3) (p-value)5.36 (0.147)
Note: *** p < 0.01, * p < 0.10. Two-step System GMM with Windmeijer (2005) finite-sample correction. GMM instruments: L(3/5).(L.Tobin_Q, DRRD) collapsed. Standard instruments: SIZE, LEV, GROWTH, LOSS, AGE, BIG4, year dummies. Instruments = 15 < N = 132. Hansen J [χ2(3)] p-value reported.
Table 6. Two-step System GMM regression results: moderating role of firm size.
Firm Value (Tobin’s Q, Dep. Var.)Coef.Std. Err.tp > |t|[95% Conf. Interval]
Tobin_Qt − 10.80050.013360.410.000 ***0.77430.8267
DRRD−0.08990.0712−1.260.209−0.23070.0510
SIZE−0.18500.1722−1.070.285−0.52570.1556
INTER0.00310.02510.120.903−0.04650.0527
LEV−0.47230.8291−0.570.570−2.11251.1680
GROWTH−0.23700.2830−0.840.404−0.79680.3228
LOSS−0.43170.3065−1.410.161−1.03810.1747
AGE0.00230.00790.290.770−0.01330.0179
BIG41.16190.78561.480.142−0.39232.7160
Constant2.80232.57871.090.279−2.29947.9040
Model Diagnostics
Observations481
Firms132
Instruments18
Year Fixed EffectsYes
AR(1) z-stat (p-value)−0.34 (0.735)
AR(2) z-stat (p-value)−1.21 (0.227)
Hansen J χ2(5) (p-value)9.31 (0.097)
Note: Two-step System GMM with Windmeijer (2005) finite-sample correction. GMM instruments: L(3/5). (L.Tobin_Q, DRRD, INTER) collapsed. INTER = (DRRD − D R R D ¯ ) × (SIZE − S I Z E ¯ ). Instruments = 18 < N = 132. Significance levels: *** p < 0.01.
Table 7. Robustness Tests: Alternative Specifications.
VariableR1: +Ind FER2a: Large FirmsR2b: Small FirmsR3: Alt DV (Intang.)R4: Full FE
L.Tobin_Q/L.Intang0.6597 *** (0.0354)0.1823 (1.6244)
DRRD−0.0970 (0.1790)−0.0309 (0.0123)−0.3977 (0.5339)0.0009 (0.0035)−0.0406 (0.0921)
0.014 **0.4590.7870.660
SIZE−0.7485 (0.6959)−0.0020 (0.0051)−1.2897 (1.1678)
LEV2.1533 (1.8765)−1.8799 (0.6007)2.6830 (8.9497)0.0346 (0.0538)1.1354 (5.7990)
GROWTH0.0095 (0.3228)0.0057 (0.0896)−1.0614 (0.6775)0.0004 (0.0039)−0.5918 (0.3790)
LOSS−0.9657 (0.6295)−0.1511 (0.0790)−0.6611 (0.6144)−0.0042 (0.0095)−0.4891 (0.3769)
AGE−0.0380 (0.0568)0.0255 (0.0418)−0.7033 (0.3748)−0.0000 (0.0003)−0.3333 * (0.2001)
BIG41.4299 (0.8918)0.0541 (0.1377)0.2729 (0.5173)0.0285 (0.0480)0.4322 (0.2916)
Industry FEYes (16 sectors)Yes (within)Yes (within)NoYes (within)
Observations481247234481481
Firms1327370132132
Instruments3015
AR(2) p-value0.4090.715
Hansen p-value0.3010.298
Note: *** p < 0.01, ** p < 0.05, * p < 0.10. R1 and R3: Two-step System GMM with Windmeijer (2005) finite-sample correction, GMM instruments L(3/5) collapsed, year fixed effects included. R1 adds 16-sector industry dummies. R3 replaces Tobin’s Q with the intangible asset ratio (excluding goodwill). R2a and R2b: within-group Fixed Effects estimator on sub-samples split at the median of SIZE (median = 14.549); SIZE is absorbed by the within-group transformation and therefore not reported separately. R4: within-group Fixed Effects on the full sample. p-values for DRRD reported separately in R2a and R2b for clarity. Robust clustered standard errors in parentheses.
Disclaimer/Publisher’s Note: The statements, opinions and data contained in all publications are solely those of the individual author(s) and contributor(s) and not of MDPI and/or the editor(s). MDPI and/or the editor(s) disclaim responsibility for any injury to people or property resulting from any ideas, methods, instructions or products referred to in the content.