Abstract
We propose a new puzzle piece for the Halloween effect (“Sell in May and Go Away”) by identifying a seasonal pattern in SEC regulatory disclosures that aligns with the effect’s summer and winter periods. From 2004 to 2023, SEC filing volumes were 17% higher in winter (November–April) than in summer (May–October). Winter also sees a 22% rise in insider trading, 13% more private securities offerings, 12% more activist investor activity, a 96% increase in shareholder meetings, and 473% more annual reports. February consistently shows the highest number of disclosures, while September shows the lowest. Similar patterns across European markets suggest global consistency. As regulatory filings contain material price-relevant information, this seasonal disclosure pattern offers a new contributing factor to the Halloween effect puzzle.
JEL Classification:
G12; G14; G18
1. Introduction
The Halloween effect, also known as “Sell in May, and Go Away”, describes an anomaly in which stock markets tend to outperform from November to April (winter) compared to May to October (summer). While numerous studies have explored potential explanations for this phenomenon, a conclusive cause remains outstanding. In this paper, we identify a previously unknown pattern that aligns closely with the Halloween effect: a recurring seasonality in regulatory information disclosures filed with the U.S. Securities and Exchange Commission (SEC). This pattern repeats consistently year after year across our two-decade analysis period (2004–2023) and exhibits a similar structure in European markets.
The phrase “Sell in May and go away” first appeared in U.S. news coverage in a Financial Times article from 1964, and a trading strategy based on this effect was shown to outperform a buy-and-hold strategy with lower risk (Bouman & Jacobsen, 2002). The phenomenon is observable in equity markets of 36 countries, from at least 1970 to the present (Bouman & Jacobsen, 2002; Zhang & Jacobsen, 2021), and the existence of the effect was further validated by Jacobsen and Visaltanachoti (2009), who found that the Halloween effect is significant in more than two-thirds of U.S. sectors and industries when examining returns for 17 sectors from July 1926 to December 2006. Haggard and Witte (2010) confirm that the Halloween effect in U.S. returns is significant in the period from 1954 to 2008, but not 1926 to 1953. Andrade et al. (2013), using both Bouman and Jacobsen’s (2002) original sample period (May 1970 to October 1998) and an extended out-of-sample period (November 1998 to April 2012), confirmed that the sell-in-May effect persists out-of-sample, and is observable across various strategies, including size, value, equity volatility risk, and credit risk premiums.
The investigated reasons behind the effect include data mining inconsistencies, shifts in risk profiles, financial news sentiment and patterns, interest rates, trading volume, sector effects, vacations (Bouman & Jacobsen, 2002), weather (Jacobsen & Marquering, 2008), the January effect (Lucey & Zhao, 2008), political climate (Powell et al., 2009), and more, while a full explanation for the anomaly is still outstanding.
We introduce a new piece to the Halloween effect puzzle: a robust, recurring seasonal pattern in the volume of regulatory disclosures filed with the SEC by market participants. Analyzing publication dates of all regulatory filings submitted by public companies, corporate insiders, funds, brokers, and other regulated entities from 2004 to 2023, we identify a consistent 17% increase in information volume during the winter months compared to the summer. This pattern recurs every year across our two-decade sample. Specifically, the winter period exhibits a 22% rise in insider trading activity, 13% more private securities offerings, 12% more activist investor activity, a 96% increase in shareholder meetings, and a 473% surge in annual reports and audited financial statements. September consistently shows the lowest disclosure volume–mirroring its historical distinction as the only month with a negative average market return over the past century.
Most of the information disclosed in SEC filings is legally mandated under U.S. securities regulations—companies, funds, and insiders are required by law to submit these disclosures rather than do so voluntarily. The content of these filings includes financial results, executive changes, insider trading activities, fund holdings, and other material corporate events. Because of their legal and informational significance, SEC filings represent a primary source of information for investors, analysts, and the media. Prior research has consistently demonstrated that various types of SEC filings have a significant impact on stock prices (Brav et al., 2008; Brown & Tucker, 2011; Cline et al., 2017; L. Cohen et al., 2020, 2012; Dimitrov & Jain, 2011; Hirshleifer et al., 2009; Kim et al., 2019; Li, 2010; Loughran & McDonald, 2014; Mayew et al., 2014; Merkley, 2013; Muslu et al., 2015; You & Zhang, 2008).
Extending our analysis to European markets, we find similar seasonal disclosure patterns among companies listed on the London Stock Exchange and EuroNext. A related, but less pronounced, temporal asymmetry appears in the press releases of U.S.-listed firms.
To our knowledge, this is the first study to analyze all regulatory disclosures published through the SEC’s EDGAR system and identify the recurring, year-over-year temporal disclosure patterns presented here. Our study requires aggregating and analyzing over 10 million regulatory filings, 3.5 million press releases, over 3 million IBES analyst announcements, and 160,000 institutional investment manager portfolios. Analyzing such large volumes of data and the technical and resource-intensive nature of this research has likely deterred prior investigations. Furthermore, analyzing the entire EDGAR filing stack, including more than 800 different form types, requires extensive knowledge of the various filing types, their purposes, governing regulations, and relationships among them.
We document a previously unreported, robust seasonal pattern in regulatory disclosures that aligns with the winter and summer cycles of the Halloween effect. We do not attempt to establish a causal relationship between disclosure volume and the Halloween effect, nor do we claim a direct cause-and-effect link. Our findings provide a new empirical foundation and motivation for future research to explore how this recurring information cycle may contribute to seasonal market anomalies.
While we do not test the mechanism directly, it is reasonable to connect Bouman and Jacobsen’s (2002) finding of winter outperformance with the seasonal surge in regulatory disclosures identified here. Given the well-documented material impact of SEC filings on stock prices, our results offer a compelling new empirical perspective that adds to the broader understanding of the Halloween effect.
2. Data and Methods
Since 1933, all public companies and a wide range of financial entities operating in U.S. financial markets—such as mutual funds, hedge funds, investment advisers, insiders, broker-dealers, and more—have been legally required to disclose information to the Securities and Exchange Commission (SEC). Since 1994, these filings have been submitted electronically through the EDGAR system, which is managed by the SEC and holds over 10 million disclosures and 100 million attachments from more than 800,000 filing entities. EDGAR provides public access to this information universe, covering everything from financial statements and insider trades to material events and corporate actions. While companies may also issue press releases, only SEC filings, across more than 800 specialized form types, fulfill regulatory requirements and serve as the authoritative source of regulatory disclosures.
The terms “filing” and “regulatory disclosure” are used interchangeably throughout this paper. References to “markets” refer exclusively to equity markets; other markets—such as currencies, bonds, or commodities—are beyond the scope of this study.
We used the commercially available SEC filings database provided by SEC-API.io, and downloaded, with its Query API1, all historical, survivorship bias-free filing metadata of the last 30 years from 1994 to 2023, including the EDGAR form type, and the date and time each filing was submitted to the EDGAR system. The dataset includes every SEC filing ever digitally published, encompassing disclosures from all entities required to file with the SEC. This includes private and public companies, both domestic (e.g., Microsoft) and foreign (e.g., Alibaba), listed on U.S. exchanges, corporate executives and insiders, various types of funds (such as mutual funds and hedge funds), institutional investors, business development companies, asset-backed securities issuers, and more. The dataset captures filings from both currently operating and defunct entities, providing a comprehensive historical record of SEC disclosures. The filings were filtered by unique accession numbers rather than unique URLs to prevent double-counting.
Regulatory disclosures submitted to the London Stock Exchange’s (LSE) RNS information system, pertaining to UK entities regulated by the Financial Conduct Authority (FCA), were obtained via the National Storage Mechanism for the period 2013 to 2023. Disclosures for other European entities listed on the EuroNext stock exchanges were sourced directly from EuroNext and cover the period 2017 to 2023. Data from 2021 was excluded due to a mid-year regulatory change that led to a tenfold increase in disclosure volume, rendering 2021 an outlier. Unlike LSE RNS disclosures, EuroNext data did not include disclosure type information in its metadata, limiting the granularity of the analysis.
To obtain all survivorship bias-free company press releases of NASDAQ and NYSE listed companies, we used LexisNexis, covering 15 years of data from 2009 to 2023. We excluded all alerts from law firms, research reports, book announcements on Amazon, and any other press releases not published by the companies themselves. This ensured that only press releases issued by the listed companies were included in our analysis.
To further test our findings, we utilized Refinitiv Eikon to obtain IBES analyst ratings for any company ever listed on the NASDAQ or NYSE stock exchange from 2009 to 2023 and the SEC-API.io 13F Institutional Ownership API to analyze quarterly fluctuations in the gross market values of institutional investment managers, such as hedge funds, between 2013 and 2023. Additionally, we used the SEC-API.io Extractor API to access all item sections in 8-K filings, allowing us to extract and determine the timing of specific material events over the past decades.
We used the data aggregation and transformation strategies as described in Schroeder 2023. Python 3.10 tutorials to assist in replicating our results are available online2.
To validate the robustness and statistical significance of the seasonal pattern in disclosure volumes and other information types, we applied two complementary statistical approaches. First, a cross-sectional analysis was performed by grouping monthly filing volumes from 2004 to 2023 into two seasonal categories: summer (May–October) and winter (November–April). After testing for normality using the Shapiro–Wilk test and for homogeneity of variance using Levene’s test, we applied a two-sided Mann–Whitney U test due to the non-normal distribution of the data. If results showed a statistically significant difference between the two periods (), we concluded that disclosure volumes are systematically higher in winter months. Second, we performed a year-by-year comparison by summing the number of filings disclosed during the summer and winter periods for each year from 2004 to 2023. Using these paired seasonal totals, we applied a Wilcoxon signed-rank test to assess whether winter volumes consistently exceeded summer volumes across years. If the test produced a T-statistic of 0 and a p-value smaller than 0.1%, we concluded that there is clear evidence that the observed seasonal difference is robust and unlikely to be due to chance. We applied these approaches for the periods May–October and November–April, and for various time-lagged variations. These tests were performed on all SEC filings, including the two most common EDGAR form types—insider trading and material event disclosures, which represent approximately 45% of the annual filing volume—and other SEC filings with pronounced temporal patterns and press releases.
As we primarily compare filing volumes across different periods within a given year and across various years, where the periods may have different time scales (e.g., monthly vs. 6-month), the sample groups are dependent rather than independent. This comparison resembles a matched-pairs analysis, where we compare the number of filings disclosed under a specific form type, such as Form 4 (insider trading activity), in the summer months (May to October) to the number of filings disclosed in the winter months (November to April) of the same form type. Since we are measuring the same form type across different times, it is reasonable to assume that the groups are not independent.
To ensure the validity of our findings, we selected methods based on the data’s underlying characteristics. We tested for normality using the Shapiro–Wilk test and Q–Q plots, and for equal variance using Levene’s test. For normally distributed data with equal variance, we applied paired t-tests. When the data has equal variance but is not normally distributed, we use the Wilcoxon Signed-Rank Test. For data that is neither normally distributed nor has equal variance, we also use the Wilcoxon Signed-Rank Test. When data are normally distributed but heteroscedastic, we use a generalized least squares model to account for unequal variance, which is suitable for paired data.
Our SEC filings data series begins in 1994, meaning we cannot validate our explanation for the period from 1954 to 1994. Before the introduction of the EDGAR system and electronic filings in 1994, the SEC regulated the market following the 1929 stock market crash with the introduction of the Securities Exchange Act of 1934, with information being disclosed on paper. As demonstrated by Schroeder (2023), the Sarbanes–Oxley Act (SOX) of 2002 significantly transformed the filing landscape, increasing the annual volume of Form 4 (insider trading disclosures) and Form 8-K (material event disclosures) filings by more than tenfold, with both filing types representing approximately 45% of all disclosures filed annually. Insider trading regulations were first introduced in 1934 through Sections 10(b) and 16 of the Securities Exchange Act, requiring insiders to report changes in their ownership of company securities by the 10th day of the month following the transaction. SOX amended this requirement, mandating that filings be made within two business days after the transaction. Given the substantial increase in information volume following the completion of the SOX rollout in 2004, our analysis focuses on filings from 2004 to 2023. Although the volume of Form 4 and Form 8-K filings was significantly lower pre-SOX, it can be assumed that the same information disclosed in these forms post-2004 was still reaching the market and investors through other means prior to the regulatory changes. This assumption supports the validity of our explanation. For example, 8-K filings provide a structured vehicle for material event disclosures such as mergers, bankruptcies, or shareholder matters. While SOX introduced various new triggering events for 8-K filings, it did not change the frequency of such events occurring. Companies entered into and terminated material agreements before SOX, but the act now required companies to disclose these events in SEC filings. The same applies to the departure of directors, creation of financial obligations, and other new trigger events introduced by SOX.
3. Results
Our research reveals a significant temporal pattern in disclosure volume by entities regulated by the SEC, robust across two decades from 2004 to 2023, with a 17% increase in average monthly SEC filing volume during the November–April winter period compared to May–October summer period (Table 3 and Table 4). Monthly filing volume peaks in February and reaches its lowest point in September, aligning with the Halloween effect periods from winter (November–April) to summer (May–October). We observe that private securities offerings, insider trading, material event disclosures, activist investor announcements, and annual mutual fund performance and operating reports, among others, all have their highest volume months during the winter period, with all disclosures consistently seeing their lowest monthly filing volume in summer. Additionally, 84% of all annual reports and audited financial statements and 64% of all annual shareholder voting material are disclosed during the winter period.
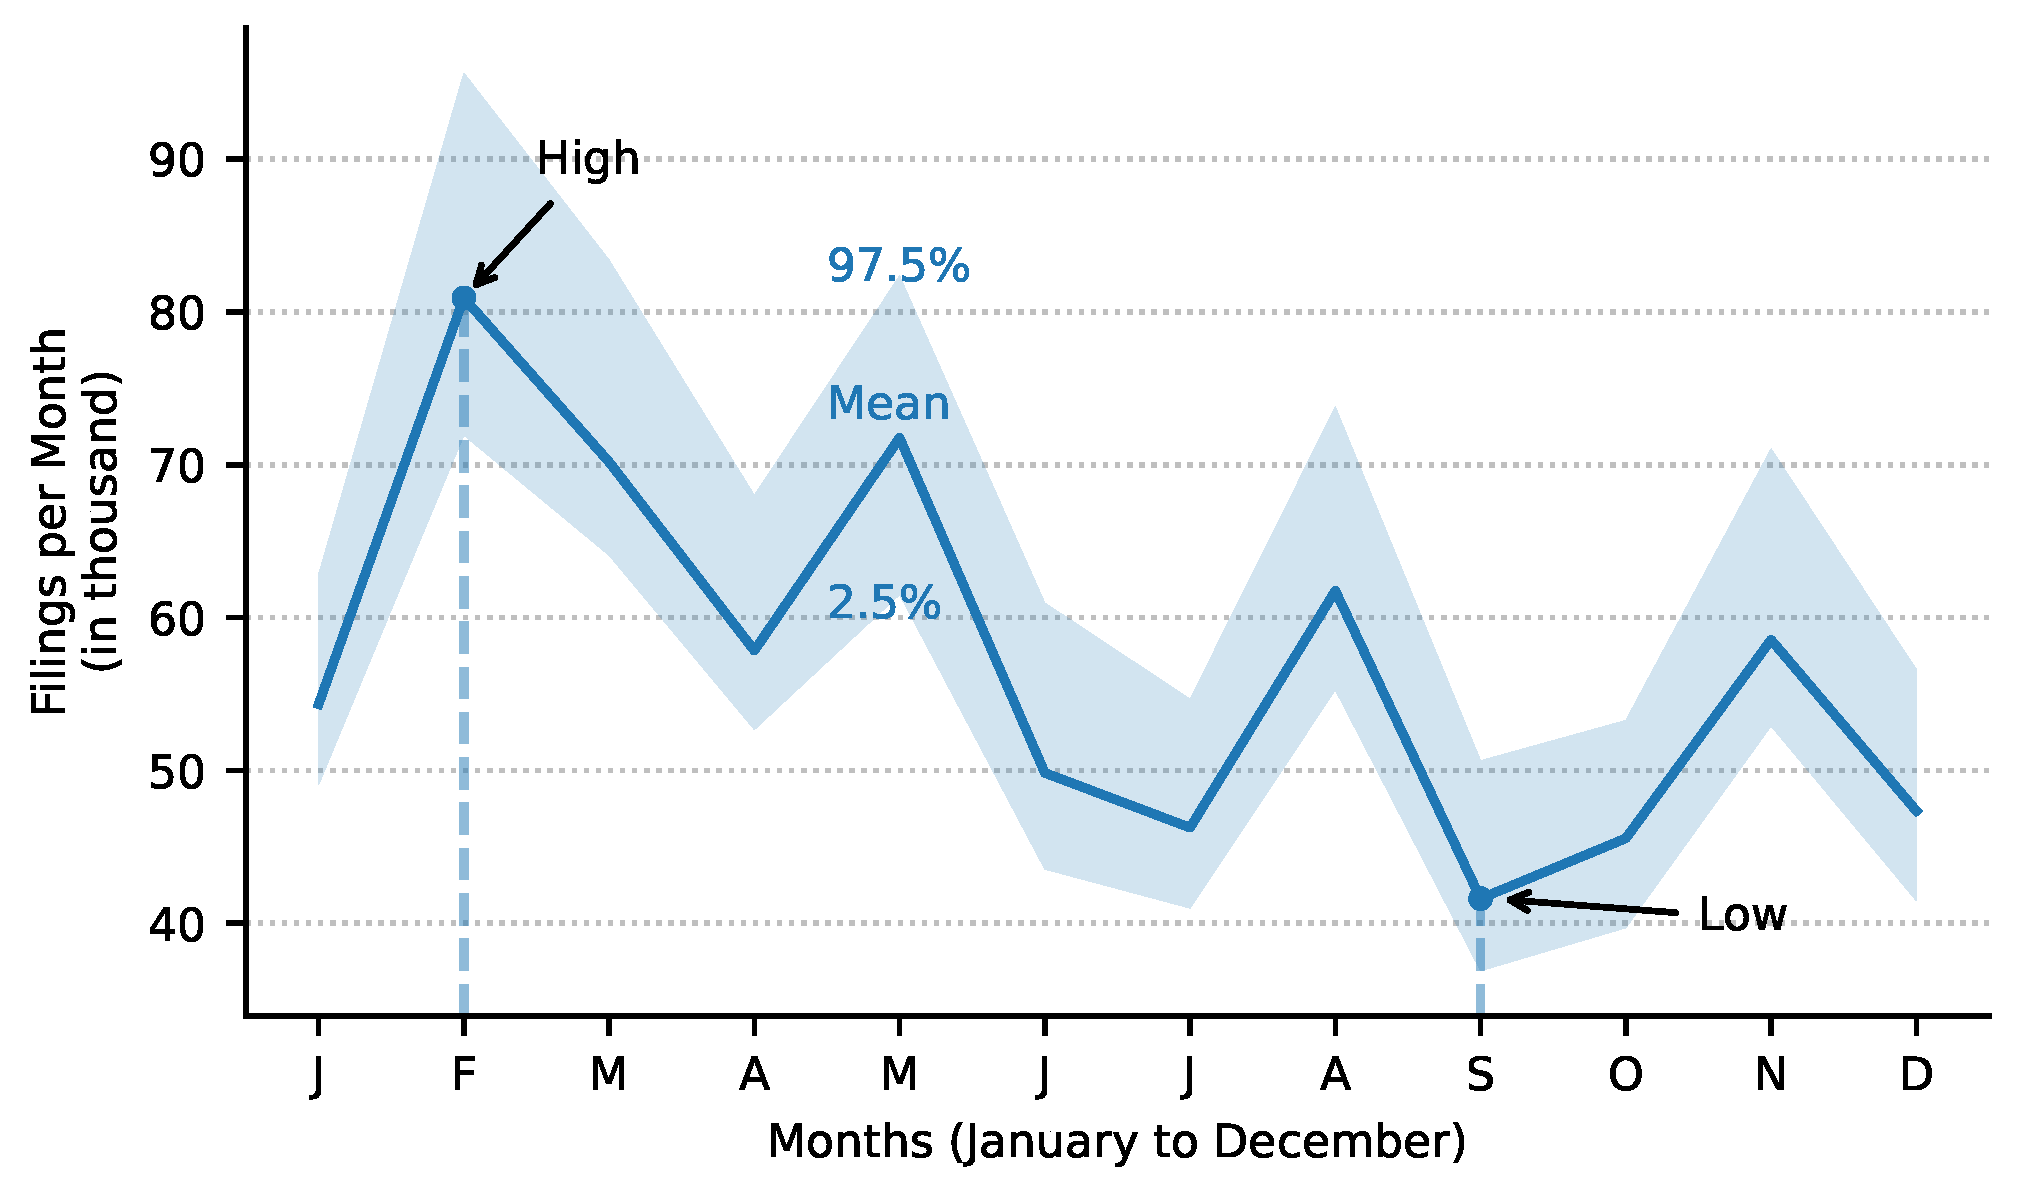
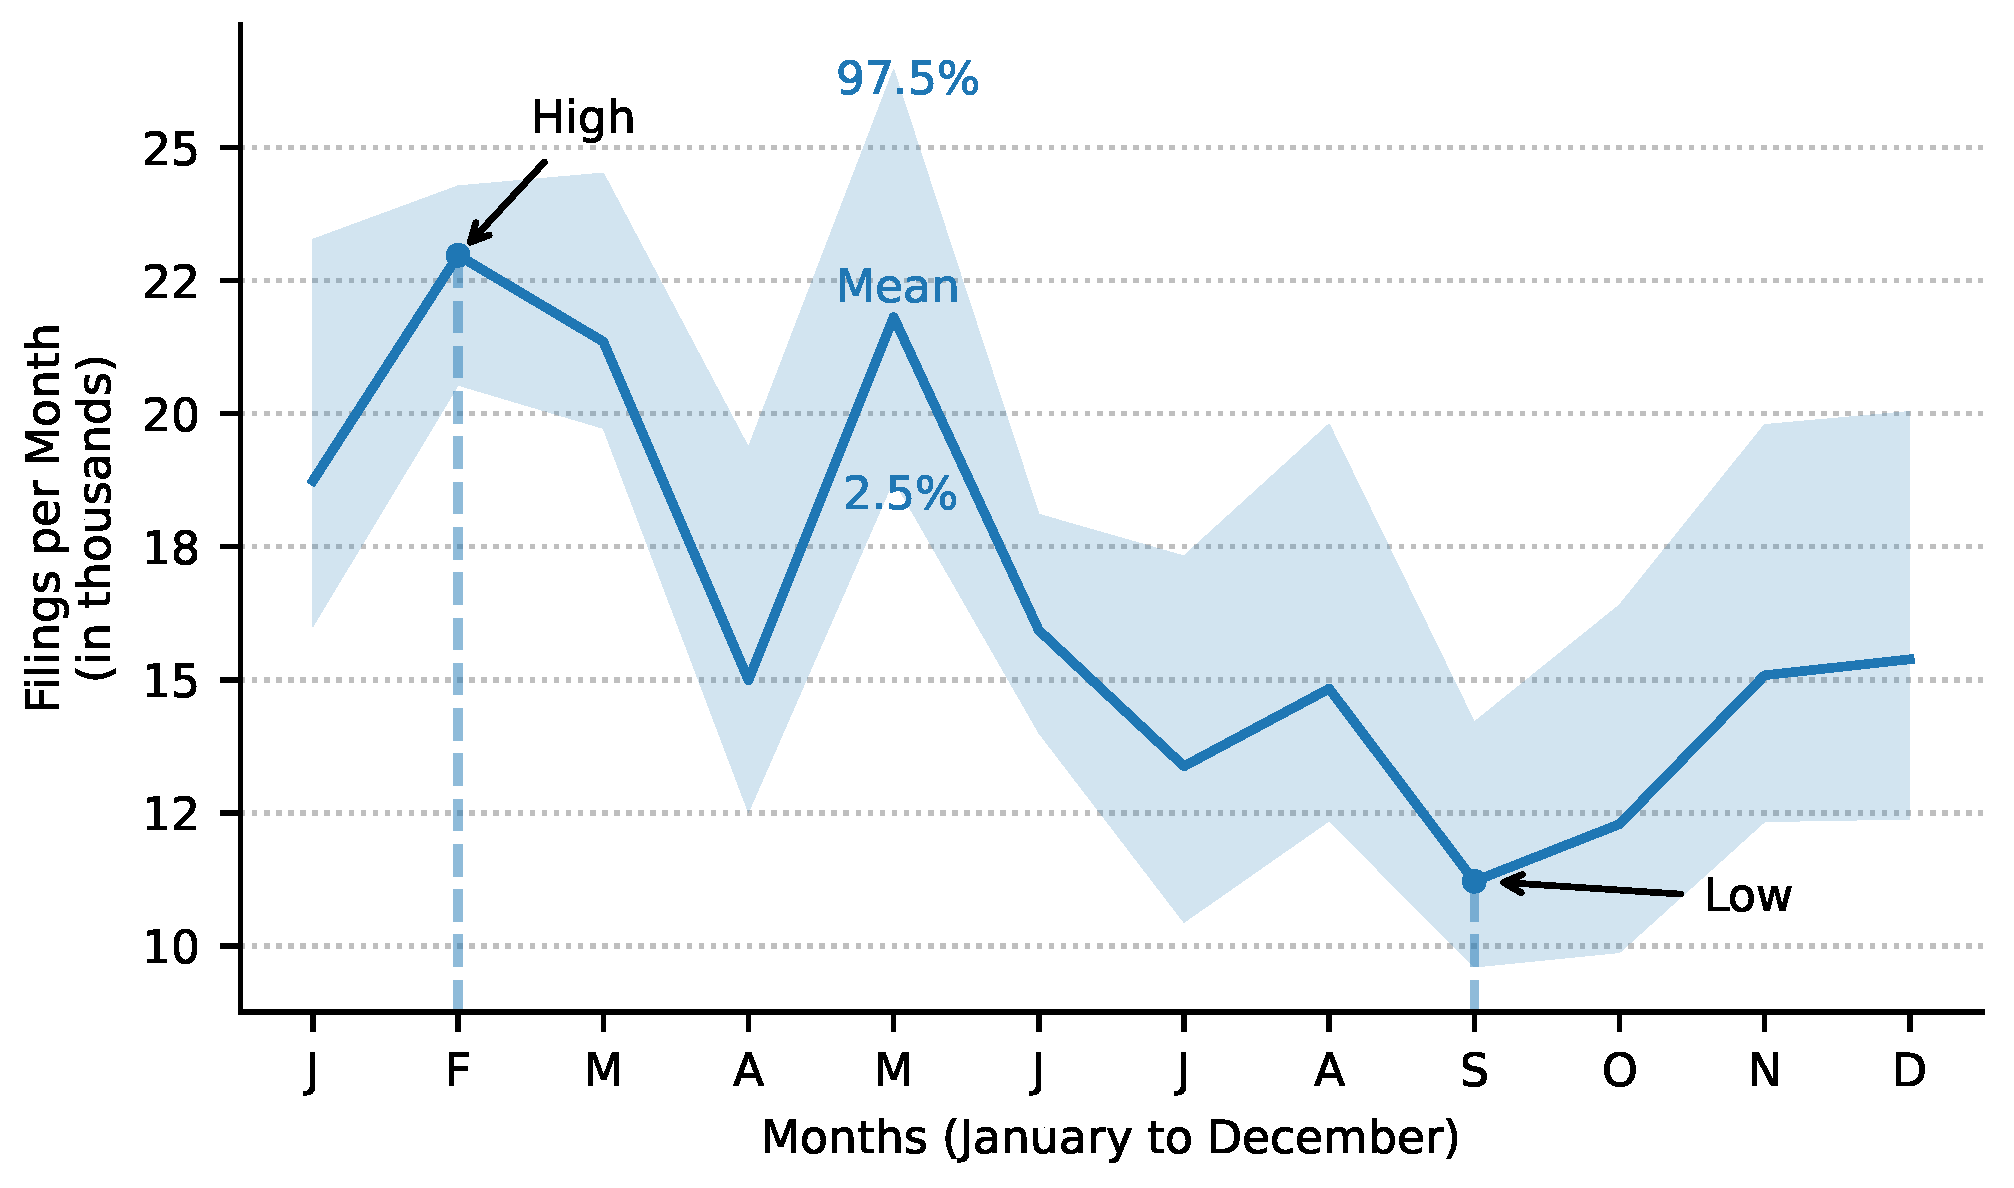
Figure 1 shows the mean number of SEC filings published per month from 2004 to 2023, with the 2.5% and 97.5% percentiles highlighted and the high and low months marked accordingly. We find that most SEC filings are consistently published in February each year, while also observing that September is the month with the least information disclosed, followed by October (Table 1).
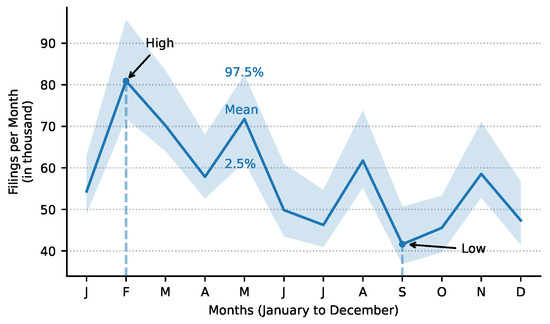
Figure 1.
Average monthly disclosure volume of all SEC EDGAR filings (in thousands, 2004–2023). The solid blue line represents the mean filing volume for each month, while the shaded area indicates the range between the 2.5th and 97.5th percentiles. February consistently exhibits the highest average filing volume (“High”), while September records the lowest volume (“Low”).
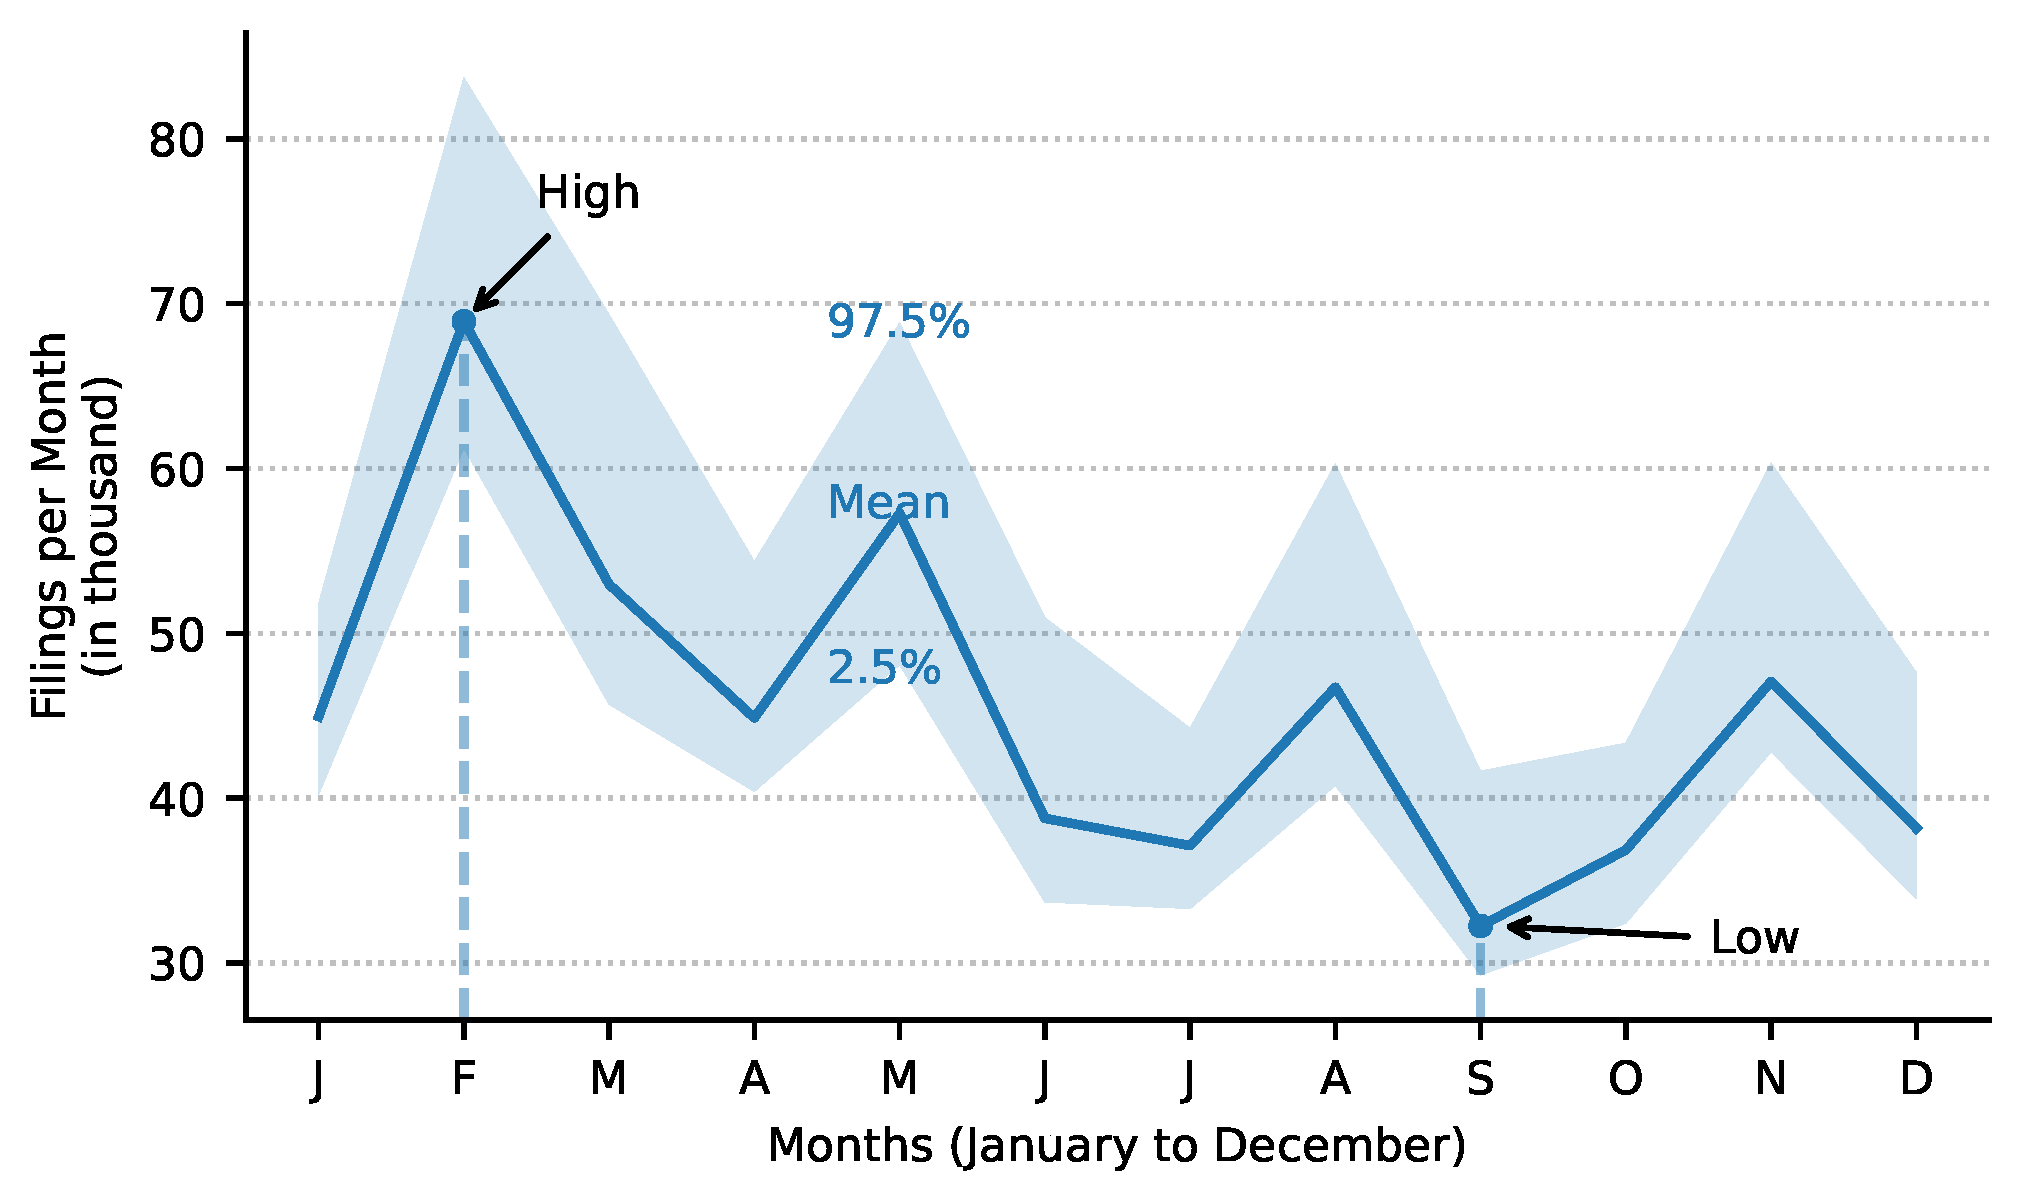
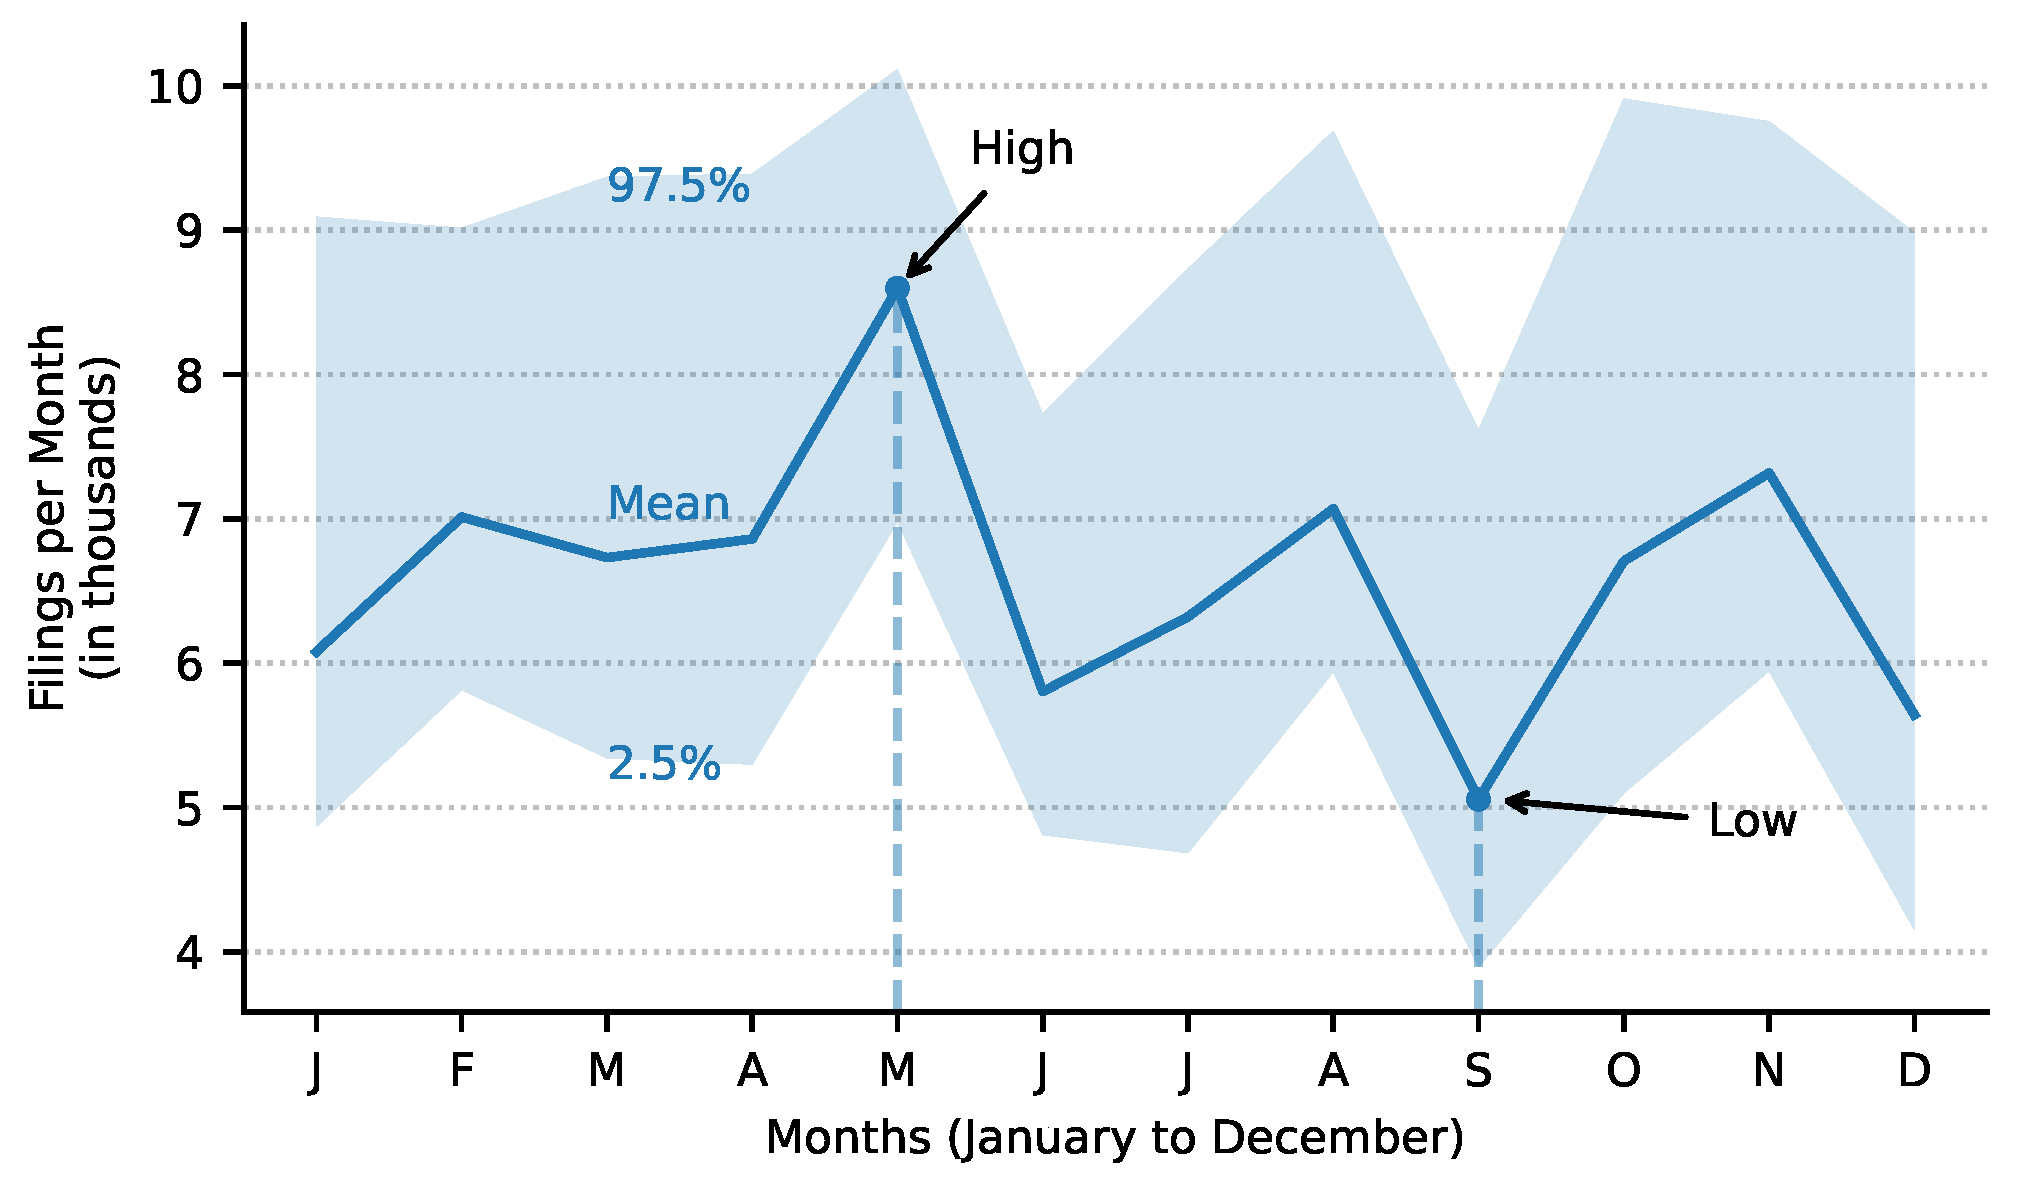
In Figure 2, when filtering for the top 2% most commonly disclosed form types, we find that only 20 out of more than 700 different types represent 86% of the total annual information volume (Table 4). Examining the monthly filing volume, February consistently has the highest volume, while June and July show a sharp decline (Table 2). September is the least active month, with August being an exception due to SEC-mandated quarterly reports by companies (Form 10-Q) and quarterly disclosures by mutual funds and hedge funds (Form NPORT-P, Form 13F-HR), which peak in August.
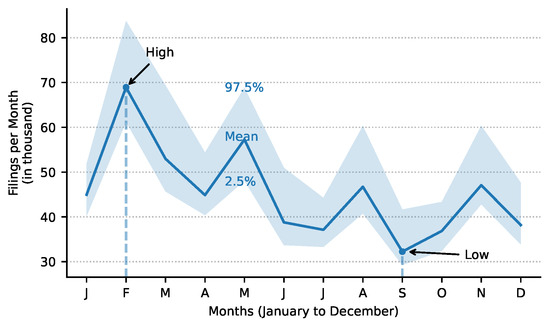
Figure 2.
Average monthly filing volume (January–December, 2004–2023) for the top 20 most frequently used SEC form types. The solid blue line represents the mean filing volume for each month, while the shaded area indicates the range between the 2.5th and 97.5th percentiles. February consistently exhibits the highest average filing volume (“High”), while September records the lowest volume (“Low”).
By calculating the average monthly volume of all SEC filings for the periods May to October and November to April from 2004 to 2023, we find an average of 52,797 filings per month for the May–October period, compared to 61,526 filings per month for the November–April period—representing a statistically significant increase of 16.5% (Table 4).
The average cumulative filing volume between November and April is 371,828, reflecting a 16.3% increase compared to the summer period, which averages 320,169 filings from 2004 to 2023 (Table 5). When focusing on the top 2% of the most commonly disclosed form types, we find that just 20 out of more than 700 distinct types account for 86% of the total annual information volume. Within this group, the mean monthly filing volume rises by 19% during the winter months compared to the summer months (Table 4).

Table 1.
Monthly disclosure statistics of all SEC EDGAR filings (2004–2023).
Table 1.
Monthly disclosure statistics of all SEC EDGAR filings (2004–2023).
| Monthly Filing Volume | Jan | Feb | Mar | Apr | May | Jun | Jul | Aug | Sep | Oct | Nov | Dec |
|---|---|---|---|---|---|---|---|---|---|---|---|---|
| Mean | 54,564 | 81,516 | 70,721 | 58,213 | 72,678 | 50,532 | 46,518 | 62,524 | 41,982 | 45,935 | 59,048 | 47,766 |
| Std. Dev. | 4493 | 6986 | 5892 | 4517 | 7062 | 6098 | 4123 | 7102 | 4246 | 4371 | 6436 | 4823 |
| Min | 48,386 | 70,381 | 64,057 | 52,171 | 61,034 | 43,366 | 40,476 | 54,532 | 36,481 | 39,148 | 52,819 | 40,879 |
| Median | 53,136 | 80,142 | 70,398 | 57,073 | 71,809 | 48,222 | 46,738 | 58,587 | 40,778 | 46,070 | 55,606 | 46,544 |
| Max | 63,782 | 95,947 | 84,426 | 68,447 | 90,076 | 63,727 | 56,111 | 77,149 | 51,773 | 53,537 | 74,150 | 57,816 |
February consistently exhibits the highest mean and median monthly filing volume (81,516 filings), while September shows the lowest (41,982 filings).

Table 2.
Monthly disclosure statistics of the top 20 most frequently used SEC form types (2004–2023).
Table 2.
Monthly disclosure statistics of the top 20 most frequently used SEC form types (2004–2023).
| Monthly Filing Volume | Jan | Feb | Mar | Apr | May | Jun | Jul | Aug | Sep | Oct | Nov | Dec |
|---|---|---|---|---|---|---|---|---|---|---|---|---|
| Mean | 45,258 | 69,553 | 53,662 | 45,114 | 58,008 | 39,378 | 37,361 | 47,373 | 32,550 | 37,175 | 47,498 | 38,481 |
| Std. Dev. | 3606 | 6796 | 7336 | 4071 | 6107 | 5788 | 3429 | 6214 | 3955 | 3549 | 5702 | 4226 |
| Min | 39,379 | 61,061 | 45,309 | 39,711 | 46,346 | 33,601 | 32,836 | 40,049 | 29,161 | 31,955 | 42,742 | 33,788 |
| Median | 44,355 | 68,449 | 50,505 | 43,978 | 57,314 | 37,582 | 37,337 | 44,516 | 30,676 | 36,130 | 45,202 | 37,820 |
| Max | 53,598 | 84,116 | 69,489 | 55,016 | 71,811 | 52,484 | 46,636 | 61,127 | 42,453 | 44,677 | 63,129 | 48,904 |
Average number of filings disclosed per month (January to December, 2004–2023) for the top 20 most commonly used form types, which represent just 2% of all form types but account for 86% of the total information volume disclosed on the SEC EDGAR system.

Table 3.
Monthly SEC filing volumes (in thousands) per year from 2004 to 2023.
Table 3.
Monthly SEC filing volumes (in thousands) per year from 2004 to 2023.
| Jan | Feb | Mar | Apr | May | Jun | Jul | Aug | Sep | Oct | Nov | Dec | May–Oct | Nov–Apr | Diff (%) | |
|---|---|---|---|---|---|---|---|---|---|---|---|---|---|---|---|
| 2004 | 51.9 | 73.8 | 66.5 | 56.1 | 61.0 | 47.4 | 44.5 | 58.2 | 41.0 | 45.1 | 61.4 | 51.1 | 297.3 | 360.8 | +21.4 |
| 2005 | 55.7 | 75.6 | 72.2 | 58.0 | 72.1 | 52.4 | 49.0 | 68.7 | 45.9 | 46.0 | 61.8 | 51.9 | 334.2 | 375.3 | +12.3 |
| 2006 | 60.5 | 78.6 | 71.9 | 56.1 | 78.1 | 54.7 | 47.4 | 69.3 | 43.7 | 50.7 | 65.5 | 50.6 | 343.9 | 383.2 | +11.4 |
| 2007 | 63.8 | 82.2 | 70.6 | 62.1 | 79.9 | 53.5 | 52.9 | 71.8 | 41.6 | 52.9 | 67.2 | 48.1 | 352.5 | 394.0 | +11.8 |
| 2008 | 59.7 | 84.4 | 66.6 | 58.5 | 72.7 | 47.9 | 48.9 | 60.5 | 40.6 | 46.7 | 53.8 | 45.6 | 317.1 | 368.6 | +16.2 |
| 2009 | 48.4 | 74.0 | 69.8 | 52.2 | 62.1 | 43.9 | 42.7 | 54.5 | 38.4 | 41.4 | 52.8 | 44.0 | 283.0 | 341.2 | +20.5 |
| 2010 | 49.9 | 70.4 | 71.9 | 55.7 | 65.0 | 47.4 | 42.6 | 56.7 | 38.7 | 40.8 | 56.4 | 47.1 | 291.3 | 351.4 | +20.6 |
| 2011 | 52.0 | 76.7 | 70.3 | 55.2 | 71.1 | 46.4 | 42.6 | 59.9 | 38.8 | 39.1 | 53.8 | 42.5 | 298.0 | 350.4 | +17.6 |
| 2012 | 50.1 | 80.6 | 64.1 | 55.9 | 70.0 | 43.4 | 42.6 | 58.8 | 37.4 | 42.3 | 54.1 | 45.1 | 294.4 | 349.8 | +18.8 |
| 2013 | 52.7 | 77.3 | 66.0 | 58.1 | 71.5 | 43.8 | 46.5 | 57.1 | 40.0 | 46.1 | 54.4 | 43.7 | 305.1 | 352.2 | +15.5 |
| 2014 | 54.6 | 79.9 | 66.3 | 57.9 | 69.8 | 47.9 | 46.9 | 57.5 | 41.2 | 46.1 | 53.9 | 49.0 | 309.6 | 361.6 | +16.8 |
| 2015 | 52.5 | 82.5 | 70.5 | 56.9 | 68.1 | 50.5 | 47.5 | 57.0 | 39.4 | 42.8 | 53.6 | 45.1 | 305.2 | 361.1 | +18.3 |
| 2016 | 50.1 | 83.0 | 65.9 | 53.3 | 67.7 | 46.6 | 41.6 | 58.4 | 41.2 | 40.4 | 54.4 | 43.2 | 295.9 | 350.0 | +18.3 |
| 2017 | 52.6 | 78.6 | 70.7 | 53.3 | 72.3 | 49.2 | 40.5 | 58.4 | 39.6 | 43.5 | 54.8 | 42.2 | 303.4 | 352.3 | +16.1 |
| 2018 | 54.1 | 80.4 | 65.3 | 55.5 | 71.0 | 48.5 | 42.8 | 58.2 | 36.5 | 46.3 | 53.0 | 40.9 | 303.3 | 349.1 | +15.1 |
| 2019 | 49.9 | 79.7 | 64.1 | 57.3 | 74.1 | 45.2 | 45.8 | 56.2 | 39.7 | 43.4 | 58.7 | 46.0 | 304.4 | 355.8 | +16.9 |
| 2020 | 53.6 | 88.5 | 74.1 | 61.0 | 72.7 | 56.9 | 49.5 | 64.7 | 46.0 | 49.4 | 61.6 | 55.1 | 339.1 | 393.9 | +16.1 |
| 2021 | 58.5 | 95.9 | 84.4 | 68.4 | 80.6 | 63.5 | 56.1 | 72.7 | 51.8 | 53.5 | 74.2 | 57.8 | 378.2 | 439.3 | +16.2 |
| 2022 | 61.7 | 95.2 | 82.1 | 67.4 | 83.8 | 57.9 | 48.4 | 74.6 | 49.3 | 48.9 | 66.8 | 50.6 | 362.8 | 423.9 | +16.8 |
| 2023 | 59.1 | 92.9 | 81.0 | 65.3 | 90.1 | 63.7 | 51.5 | 77.1 | 49.0 | 53.1 | 68.6 | 55.6 | 384.6 | 422.5 | +9.9 |
The table reports the number of filings published each month per year, along with total filing volumes for the summer period (May–October) and winter period (November–April) for each year. The final column shows the percentage difference between the two periods, indicating that every year exhibits higher filing activity during the winter months.

Table 4.
Comparison of mean monthly filing volumes between summer (May–October) and winter (November–April) periods from 2004 to 2023.
Table 4.
Comparison of mean monthly filing volumes between summer (May–October) and winter (November–April) periods from 2004 to 2023.
| Share of Total Filing Volume | Period | Mean Monthly Filing Volume | Years | Difference (%) | Highest Volume Month | Lowest Volume Month | Peak Monthly Volume in Winter | Lowest Monthly Volume in Summer | |
|---|---|---|---|---|---|---|---|---|---|
| All SEC Filings | 100% | May–Oct | 52,797 | 20 | +16.53% *** | February | September | Yes | Yes |
| Nov–Apr | 61,526 | ||||||||
| 2% (20) of all EDGAR Form Types | 85.6% | May–Oct | 40,554 | 20 | +19.11% *** | February | September | Yes | Yes |
| Nov–Apr | 48,303 |
The table displays the mean monthly filing volumes, the percentage differences, and the highest and lowest volume months for all SEC filings and the top 2% of EDGAR form types, which represent 85.6% of the total filing volume. The table also indicates whether the peak monthly volume occurred in the winter and whether the lowest monthly volume occurred in the summer period of the Halloween effect. Significance levels are denoted as follows: * , ** , *** .

Table 5.
Comparison of mean filing volumes for various SEC filing types between winter (November–April) and summer (May–October) periods From 2004 to 2023.
Table 5.
Comparison of mean filing volumes for various SEC filing types between winter (November–April) and summer (May–October) periods From 2004 to 2023.
| May–Oct | Nov–Apr | ||||||
|---|---|---|---|---|---|---|---|
| Type | Share of Total Filing Volume | Years | Mean Period Filing Volume | Standard Deviation | Mean Period Filing Volume | Standard Deviation | Difference (%) |
| All SEC Filings | 100% | 20 | 371,828 | 28,680 | 320,169 | 30,243 | +16.33% *** |
| Top 2% of all EDGAR Form Types | 85.6% | 20 | 299,567 | 29,050 | 251,845 | 27,127 | +19.1% *** |
| Unscheduled Filings Triggered by Specific Events Rather Than a Pre-Defined Regulatory Timeline | |||||||
| Insider Trading (Form 4) | 37.1% | 20 | 108,109 | 9394 | 89,058 | 10,587 | +21.85% *** |
| Activist Investor Ownership (Form SC 13D+/A) | 1.1% | 20 | 3283 | 588 | 2948 | 523 | +11.49 *** |
| Material Events (Form 8-K) | 14.9% | 20 | 39,377 | 6916 | 39,393 | 5900 | −0.35% |
| Material Events by Foreign Issuers (Form 6-K) | 4.2% | 20 | 11,410 | 1098 | 11,276 | 1182 | +1.28% * |
| Private Securities Offerings(Form D+/A, adopted in 2009) | 5.6% | 15 | 20,491 | 7834 | 18,214 | 7376 | +13.37% *** |
| Mutual Fund Summary Prospectus and Pros. Materials (Form 497, 497K adopted in 2009) | 5.2% | 20 | 17,763 | 3567 | 14,712 | 2687 | +20.58% *** |
| Filings with Annual Seasonal Volume Spikes | |||||||
| Annual Reports and Audited Financial Statements by Companies (Form 10-K) | 1.5% | 20 | 6609 | 645 | 1194 | 268 | +473.47% *** |
| Shareholder Voting Information, Proxy Statements (Form DEF 14A, DEFA14A) | 1.9% | 20 | 6930 | 715 | 3578 | 510 | +96.17% *** |
| Ownership Report by Passive Investors (Form SC 13G+/A) | 4.2% | 20 | 20,139 | 1838 | 3120 | 568 | +558.38% *** |
| Annual Report of Changes in Insiders’ Ownership (Form 5) | 0.8% | 20 | 4015 | 1842 | 619 | 452 | +673.50% *** |
| Annual Report by Mutual Funds (Form N-CEN since 2019, N-SAR prior) | 0.1% | 5 | 2101 | 812 | 816 | 250 | +145.14% * |
| Filings Without a Temporal Pattern | |||||||
| Complex Financial Product Prospectuses (Form 424B2) | 3.6% | 20 | 10,762 | 10,262 | 11,100 | 10,658 | −2.01% |
| Information for Investors during Securities Offerings (Form FWP) | 1.9% | 18 | 6139 | 2990 | 6315 | 2925 | −3.57% |
| SEC Correspondence with Filers (CORRESP, LETTER) | 3.5% | 19 | 9524 | 2682 | 10,350 | 2538 | −7.78% ** |
The table presents the share of total filing volume, mean filing volumes per period (November–April vs May–October), standard deviations, and percentage differences between the means of the two periods, for all SEC filings, the top 2% of all EDGAR form types, unscheduled filings triggered by specific events, filings with annual seasonal volume spikes, and filings with consistent information flow without a temporal pattern. The data demonstrates significant increases in filing volumes during the winter period, with notable spikes in annual reports, shareholder voting information, and ownership reports by passive investors and insiders. Significance levels are denoted as follows: * , ** , *** .
In order to understand the origins of the temporal pattern found in the volume of monthly SEC filings, we decompose the pattern into its constituent parts by grouping form types into the following categories:
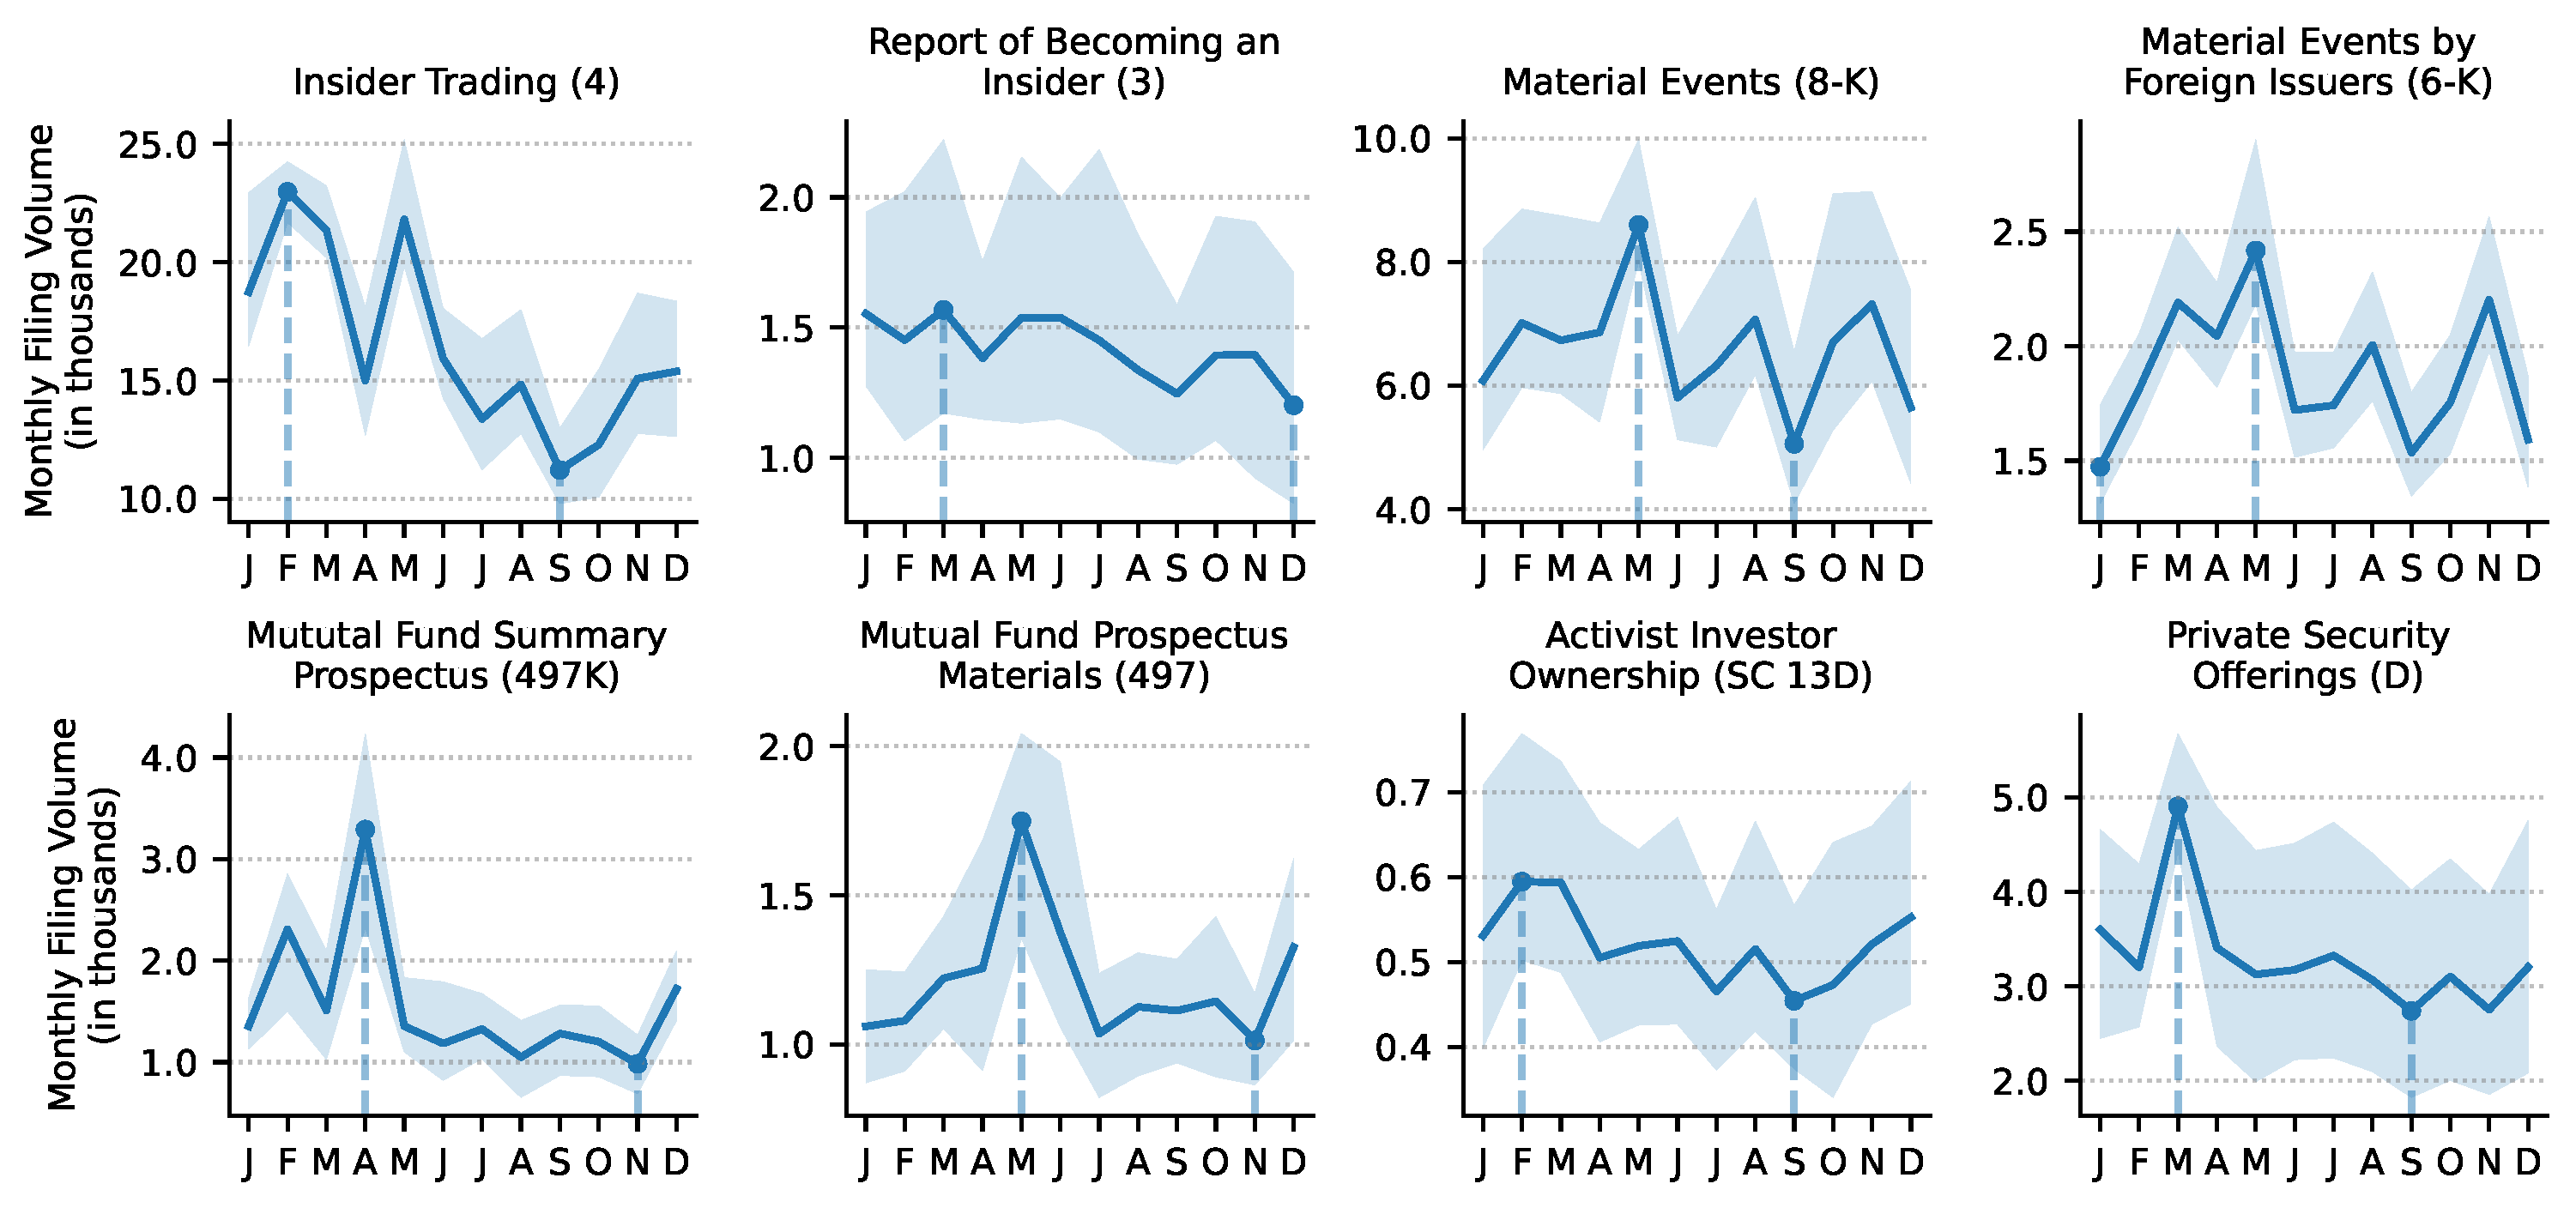
- Unscheduled Filings Triggered by Specific Events Rather Than a Pre-defined Regulatory Timeline (Figure 3): These are mostly unscheduled filings and include eight of the most frequently disclosed form types, namely insider trading forms (Form 3 and 4), material event disclosures (Forms 8-K and 6-K), mutual fund prospectuses (Form 497, 497K), ownership reports by activist investors (Form SC 13D, D/A), and private security offerings (Form D, D/A). The data reveals distinct seasonal patterns, with peaks typically observed between February and May, and noticeable declines during the summer months.
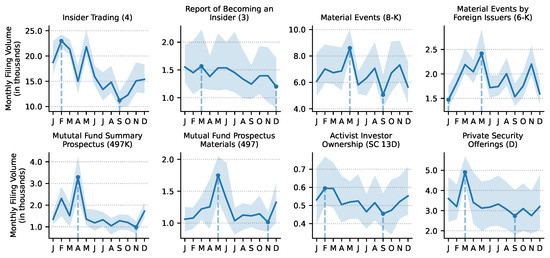 Figure 3. Patterns in average monthly filing volumes from 2004 to 2023 for eight event-driven EDGAR form types, not caused by pre-defined regulatory timelines, but by triggering events. The forms include insider trading reports (Forms 3 and 4), material event disclosures (Forms 8-K and 6-K), mutual fund and investment company filings (Form 497, 497K), ownership reports by activist investors (Forms SC 13D and D/A), and private security offerings (Forms D and D/A).
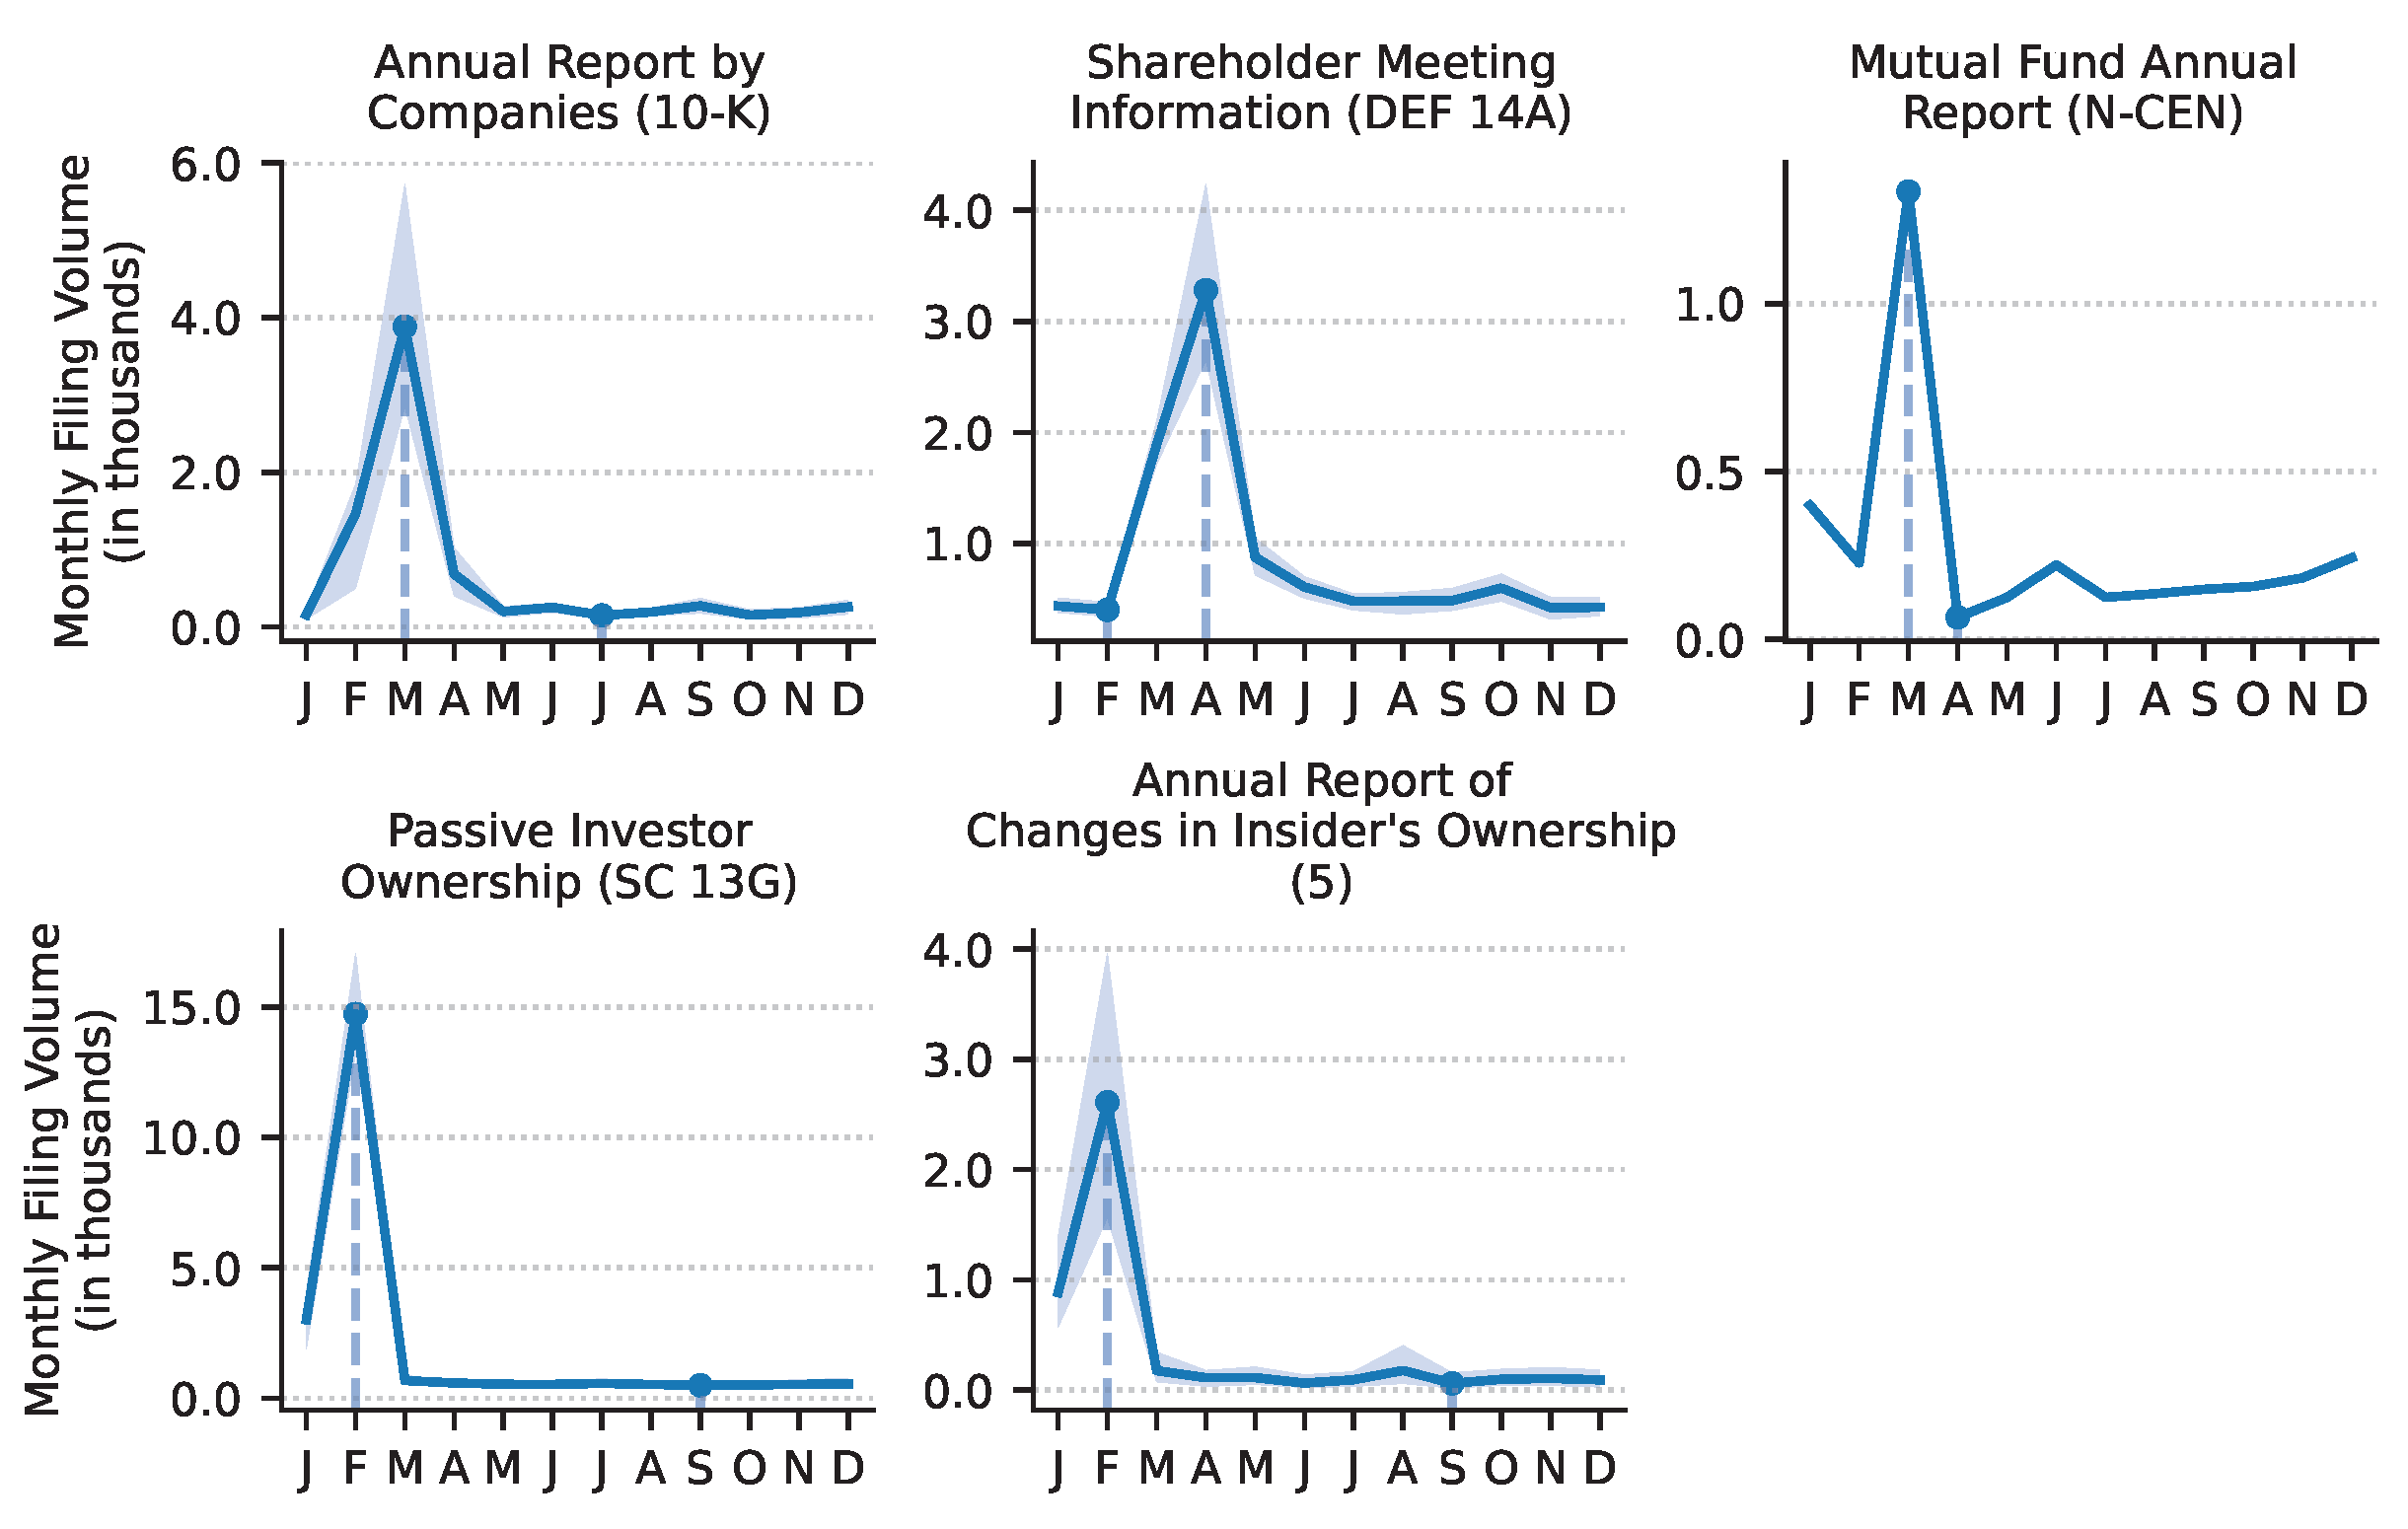
 - Once-Annually Occurring Volume Spikes (Figure 4): These are filings required to be filed once per year and include annual reports and audited financial statements on Form 10-K, shareholder proxy statements (DEF 14A, DEFA14A), mutual fund annual reports (N-CEN), reports disclosing of over 5% passive ownership (Form SC 13G, 13G/A), and annual statements of ownership by insiders (Form 5). The data reveals peaks in February and March, with a decline in filings observed throughout the remainder of the year.
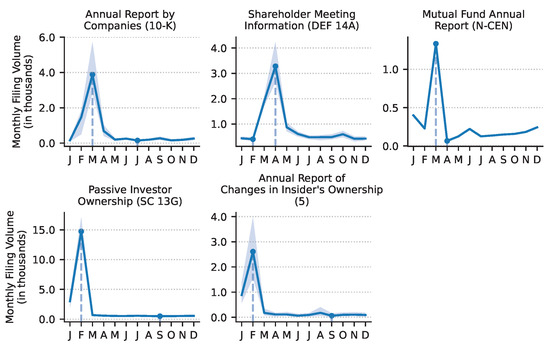 Figure 4. Once-annually occurring volume spikes of five EDGAR filing types from 2004 to 2023. The forms include annual reports by companies (Form 10-K), shareholder meeting information as proxy statements (Forms DEF 14A and DEFA14A), mutual fund annual reports (Form N-CEN), passive investor ownership disclosures (Forms SC 13G and SC 13G/A), and annual statements of ownership structure by insiders (Form 5).
 - Quarterly Recurring Volume Spikes (Figure 5): Quarterly recurring pattern driven by regulatory schedules. Form 10-K and Form 10-Q are classified as the same group, as companies are required to disclose quarterly reports four times a year – one annual report on Form 10-K and three quarterly updates on Form 10-Q. Annual reports peak in March, and quarterly in May, August, and November. Similarly, mutual fund and hedge fund reports (Form NPORT-P and 13F-HR) also peak in February, May, August, and November every year.
 Figure 5. Quarterly recurring disclosure pattern, driven by regulatory schedules, as measured by monthly average filing volume (January to December, 2004 to 2023). Form 10-K and 10-Q filings are related as companies are required to disclose quarterly reports four times a year—one annual report on Form 10-K and three quarterly updates on Form 10-Q. Quarterly reports by companies peak in March, May, August, and November. Similarly, quarterly holding reports of mutual funds (investment companies) and hedge funds (institutional investment managers) on Forms NPORT-P and 13F-HR peak in February, May, August, and November each year.
 - Consistent Information Flow Without a Pattern (Figure 6): These filings exhibit a stable average monthly volume throughout the year, showing no discernible pattern. Examples include complex financial product prospectuses (Form 424B2) and supplemental information provided during a securities offering (Form FWP), as well as SEC comment letters (CORRESP, LETTER) used by the SEC to comment on filings published by companies and other entities, for example, to request more information.
 Figure 6. Consistent flow of information with no discernible pattern and stable average monthly filing volumes throughout the years from 2004 to 2023. These filings include complex financial product prospectuses (Form 424B2), information for investors during securities offerings (Form FWP), as well as correspondence between the SEC and its filers (CORRESP, LETTER).
Consistent with the overall pattern observed in SEC filings, we find a similar temporal variation in insider trading, activist investor activity, mutual fund summary prospectuses, and private securities offerings (Table 6). The results indicate a significant increase in the mean monthly filing volume of 21.3%, 11.7%, 14.8%, and 13.4%, respectively. For these event-driven filings, not disclosed on a predefined regulatory timeline but triggered by specific events, six of the eight filing types reach their highest volume during the winter period (November–April). Material event disclosures and mutual fund prospectus materials peak just one month after the official Halloween winter period ends, in May. Not a single filing type reaches its peak volume during any summer month (Table 6 and Table 7). The majority of event-driven filings reach their lowest volume in September during the summer period of the Halloween effect. This includes filings disclosing insider trading activities, material events, activist investor announcements, and private securities offerings. When treating May as an extended winter month, we find that 10 of 12 high and low peak-volume months align with the summer and winter cycles of the Halloween period. The other two observations represent the second-lowest month, and one is unrelated.

Table 6.
Summary statistics of unscheduled filings triggered by specific events, not by regulatory deadlines (2004–2023).

Table 7.
Statistics of filings with once-annually occurring volume spikes (2004–2023).
When analyzing the quarterly gross market values and quarterly buy-and-sell activities of all hedge funds from 2013 to 2023, we did not find any discernible temporal pattern that aligns with the winter and summer periods discussed here, nor did we uncover any meaningful additional insights. The same applies to analyst recommendations and their price target upgrades and downgrades.
In summary, our findings indicate an information surge during the winter periods (November to April) compared to the summer periods (May to October). Bouman and Jacobsen (2002) observed that winter periods consistently outperformed summer periods. This suggests that the information surge in winter coincides with observed outperformance, while the information drought in summer aligns with underperformance, indicating a correlation between filing volume and stock price performance. Another correlation between filing volume and performance is evident in the month of September. In the United States, September is the only month of the year that exhibits a negative average return over the past century (Fang et al., 2017; Hirsch, 2023). Coincidentally, September also has the lowest average monthly filing volume, a pattern observed consistently over the past 20 years.
Jeon et al. (2022) found that the influence of news on stock returns has increased over time, particularly after the adoption of the EDGAR system and the widespread use of the Internet. We therefore discuss in the next section how the surge in filing volume can lead to the outperformance observed in the winter period relative to the summer period. We focus on filing types that exhibit a strong temporal pattern aligning with the Halloween effect periods. These filings also belong to the group of the top 2% of the most commonly disclosed information each year, and make up 86% of the total annual filing volume. Coincidentally, these filing types have shown the strongest results in studies examining the impact of SEC filings on stock prices. This convergence of factors makes them particularly relevant to our analysis of the Halloween effect.
3.1. Annual Reports (Form 10-K)
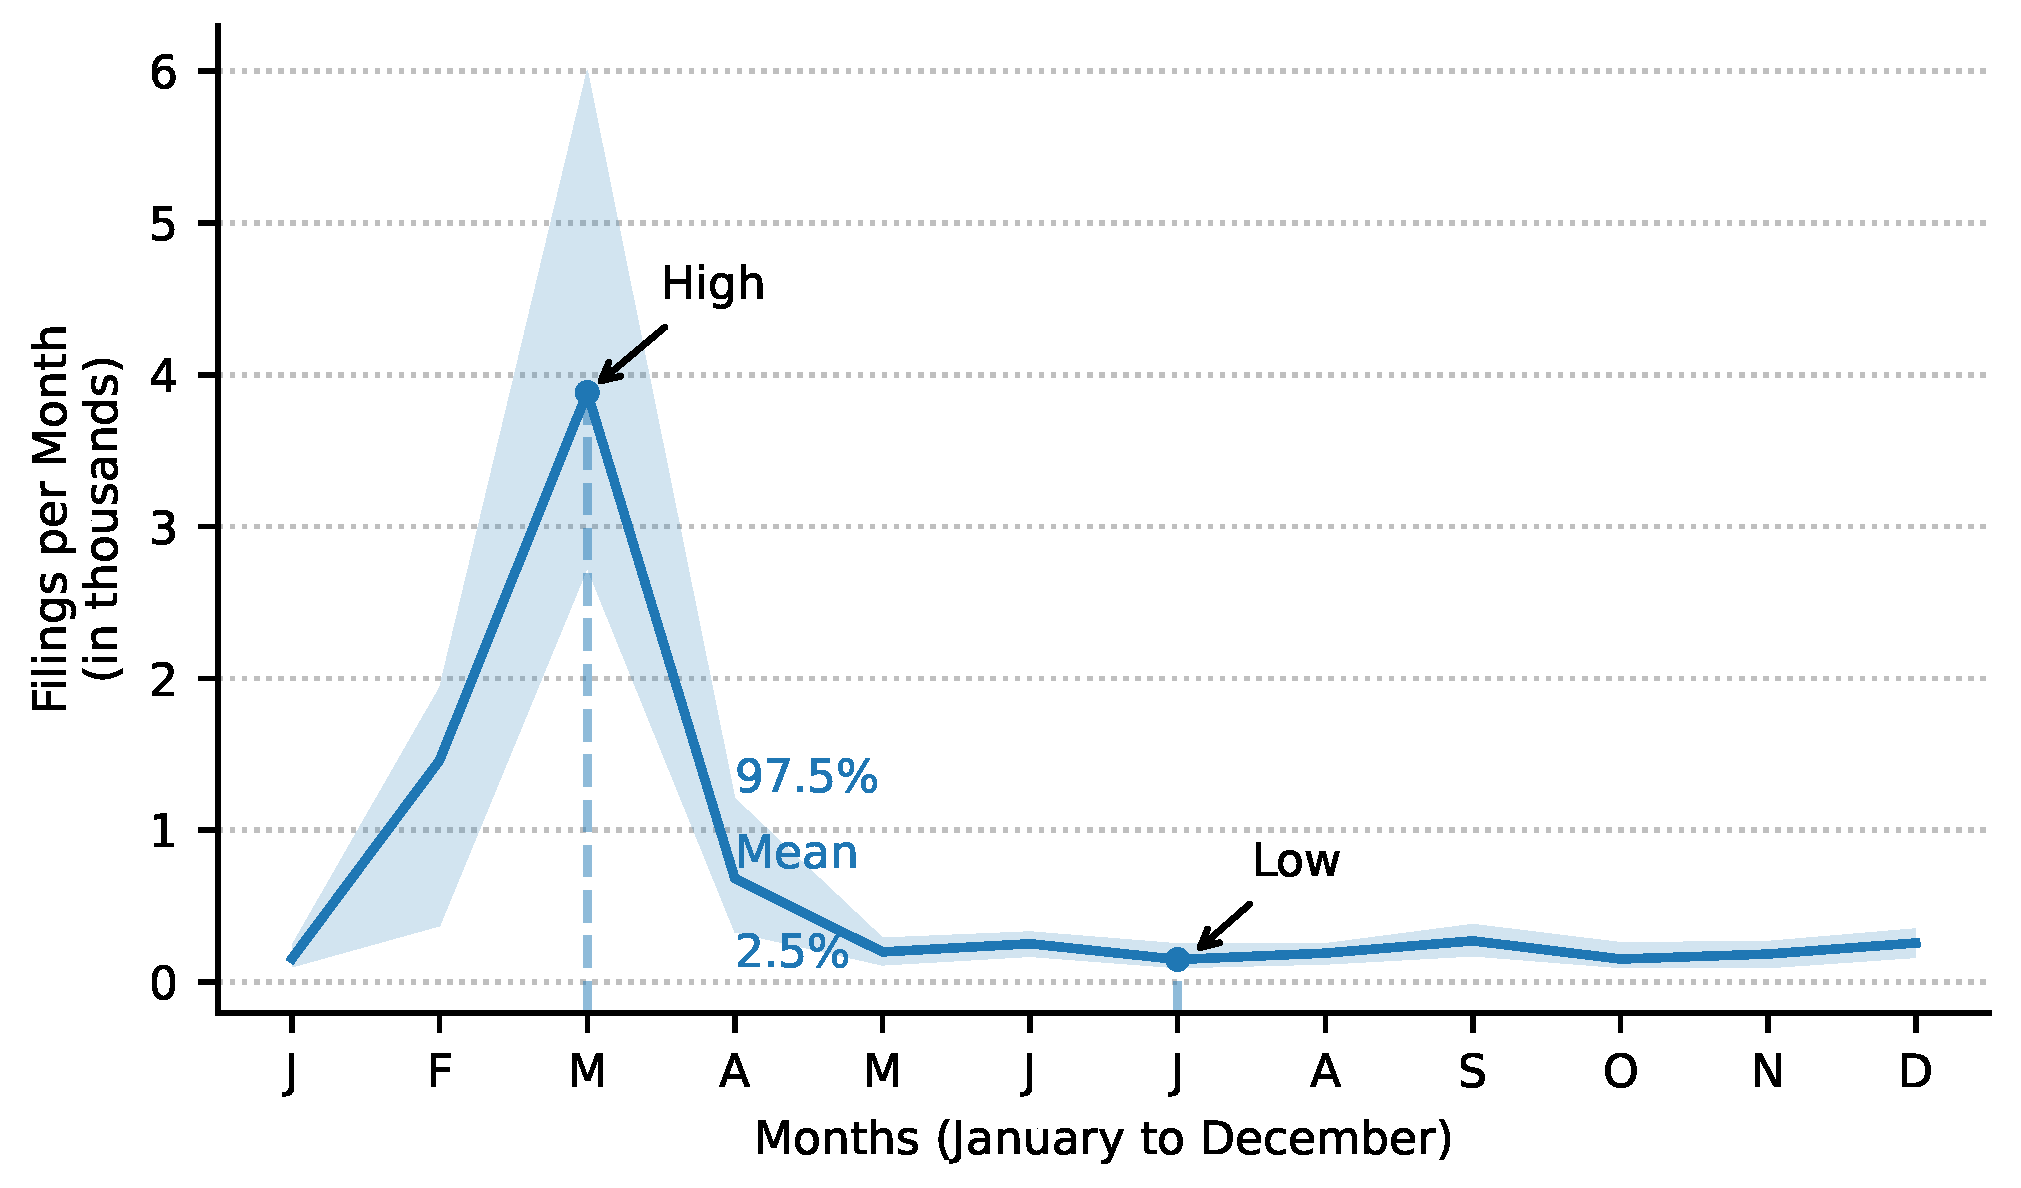
We begin with the most pronounced surge in volume: 10-K filings (annual reports with audited financial statements). The majority, 84%, of all annual reports in 10-K filings are disclosed during the winter period, from November to April (Figure 7, Table 8). March consistently marks the month with the highest disclosure volume, accounting for 49.56% of all annually published 10-Ks.
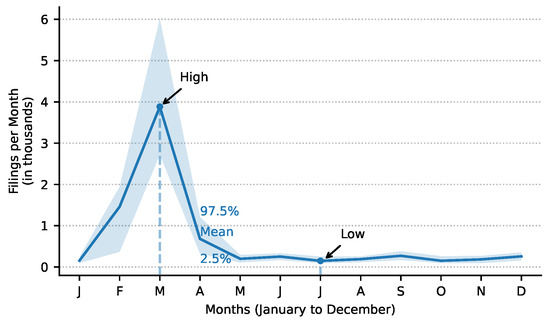
Figure 7.
Average monthly filing volume (January to December, 2004–2023) for all annual reports with audited financial statements filed on Form 10-K. The blue line indicates the mean number of filings per month, with the light-blue shaded area indicating the interval between the 2.5% and 97.5% percentiles.

Table 8.
Monthly disclosure statistics of annual reports with audited financial statements on Form 10-K filings (January to December, 2004–2023).
L. Cohen et al. (2020) found that changes to the language and construction of 10-Ks predict future returns, earnings, profitability, news announcements, and even firm-level bankruptcies. Portfolios that short companies that changed key sections of their 10-K reports year-over-year and buy those with no changes earn up to 188 basis points per month in risk-adjusted returns. Similarly, Loughran and McDonald (2014) discovered that 10-K file size correlates with subsequent stock return volatility. Specifically, a one-standard-deviation increase in file size, number of words, common words, and vocabulary leads to respective increases of 9%, 7%, 6%, and 6% of the absolute standardized unexpected earnings (SUE) standard deviation. They found that larger 10-K file sizes are associated with significantly higher post-filing date abnormal return volatility and higher absolute SUE.
Two decades before Loughran and McDonald (2014), Bernard and Thomas (1989) replicated prior findings of a significant post-earnings-announcement drift. They showed that a long position in the highest SUE decile and a short position in the lowest decile yielded an abnormal return of approximately 4.2% over 60 days, annualized to about 18%. Most of the drift occurred within the first 60 trading days after the earnings announcement, with little evidence of significant drift beyond 180 trading days.
Another important aspect to consider is the impact of announcements on companies with customer–supplier relationships with the disclosing company. L. Cohen and Frazzini (2008) examined the effect of significant news, such as earnings announcements, disclosed by customer firms on their supplier firms’ stock prices. They found that a long–short strategy based on customer returns yields significant abnormal returns (1.55% per month or 18.6% annualized). While this is specifically applicable to customer–supplier relationships, their findings provide additional support for our thesis. The information surge not only directly impacts the disclosing entities but also affects stock price movements in related supplier firms.
Similar to L. Cohen et al. (2020), You and Zhang (2008) highlighted the gradual incorporation of earnings information, noting that investors tend to underreact to information in complex 10-K filings, resulting in significant stock price drifts. Hirshleifer et al. (2009) confirmed these findings, showing that the immediate price and volume reaction to a firm’s earnings surprise is much weaker on high-news days, with post-announcement drift being much stronger when a greater number of same-day earnings announcements are made by other firms.
The incorporation of information from annual reports into prices can continue for days to weeks after the release of the report. The timeframe of 60 days (as observed by Bernard and Thomas (1989)) coincides with the two-month gap between the March peak and May, marking the beginning of the underperforming summer cycle.
The importance of 10-K filings and their impact on the market is further validated by Kim et al. (2019), who found that more readable 10-K reports are associated with lower stock price crash risk. Additionally, Brown and Tucker (2011) discovered that while price reactions to modifications in the Management Discussion & Analysis (MD&A) section of 10-K filings have weakened, investors still respond positively to such changes. Other studies, such as those by Li (2010), Merkley (2013), Mayew et al. (2014), and Muslu et al. (2015), also highlight the impact of 10-K content, particularly the MD&A section, on stock prices.
Given that 84% of all annually published 10-Ks are disclosed during the winter period, combined with the observed effects that 10-Ks have on stock prices, we find strong support for the SEC filing volume surge directly impacting the overperformance.
One might argue that 10-Q filings, which disclose financial performance and operating results three times a year, should be equally important as 10-K filings. However, it is crucial to understand that 10-Qs contain significantly less information compared to 10-Ks. 10-Q filings include only unaudited financial results, whereas 10-Ks provide audited financial results and auditor opinions, among other material information. Additionally, 10-K filings consist of 21 sections, while 10-Qs include only 11 sections. Furthermore, the market reacts more strongly to 10-K filings than to 10-Qs (Griffin, 2003).
3.2. Ownership Reports: Insider Trading (Form 4) and Activist Investors (Form SC 13D)
Insider trading reports on Form 4 are filed by officers, directors, and significant shareholders who own more than 10% of a company’s shares whenever they buy or sell shares in the company. The form includes details such as the insider’s name, their relationship to the company, the date of the transaction, the number of shares traded, and the price at which the shares were bought or sold, and must be filed within two business days of the transaction.
Figure 8 illustrates the temporal pattern in insider trading activity reported on Form 4. February and May consistently see the most insider trading, followed by a sharp decline from June to September, with September marking the month with the lowest disclosures (Table 9).
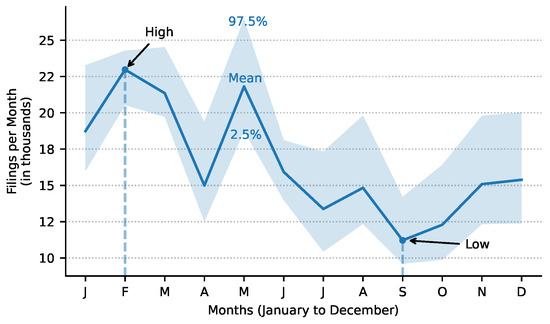
Figure 8.
Average monthly filing volume (January to December, 2004–2023) of the largest regulatory information class: insider trading disclosures (Form 4).

Table 9.
Monthly disclosure statistics of insider trading disclosures on Form 4 (January to December, 2004–2023).
The 22% increase in insider trading activity during the winter period compared to the summer period could additionally contribute to the outperformance, as explained by findings from L. Cohen et al. (2012), who found that opportunistic trades are significant predictors of future returns, while routine trades are not. A portfolio that focuses on opportunistic trades yields higher abnormal returns than one that focuses on routine trades. The increased insider trading activity, particularly opportunistic trades, likely contributes to the better performance observed in the winter months.
Cline et al. (2017) found that persistently profitable insider buys are associated with significant abnormal returns of 2.52%, with the market reaction to such trades being more pronounced in the post-electronic reporting period. The increased insider trading activity during the winter period, coupled with the abnormal positive returns observed by Cline et al. (2017), provides another plausible contributing factor to the outperformance during the winter period.
Further contributing to better performance during the winter period is the market’s reaction to activism announcements, with their frequency measured by the monthly volume of Forms SC 13D and D/A. Activist investors who intend to influence or control a company must file these forms within 10 days after acquiring more than 5% of the company’s shares. Brav et al. (2008) identified positive abnormal returns of 7% to 8% around activism announcements. These filings reach their highest monthly volume in February and March and their lowest volume in September.
3.3. Material Event Disclosures (Form 8-K)
Material event disclosures on Form 8-K are filed by companies to inform about significant events that might materially impact a company’s financial condition or operations. It covers a wide range of events, including entry into or termination of material agreements; completion of acquisition or disposition of assets; bankruptcy; shareholder voting matters; legal proceedings; changes in the company’s executives, board, and certifying accountant; corporate changes such as mergers and reorganizations; or amendments to the articles of incorporation or bylaws. Form 8-K must be filed within four business days of the occurrence of the event.
As shown in Figure 9, a similar pattern is observable in material event disclosures, which peak in May and decline over the summer months, reaching their lowest volume in September (Table 10). It is important to note that some events in 8-K filings are disclosed on a repetitive schedule. For instance, Item 2.02 “Results of Operations” is often used by companies to disclose preliminary quarterly or annual results before filing their 10-K or 10-Q reports. Therefore, the August volume spike can be attributed to the quarterly results published in August, aligning with the 10-Q pattern shown further below.
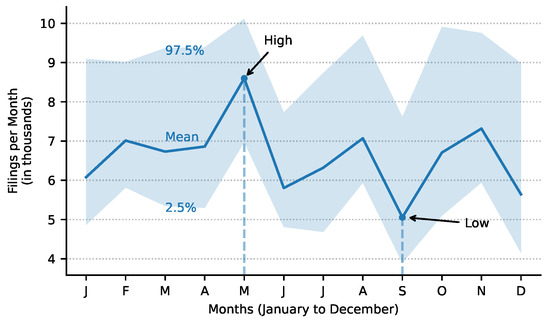
Figure 9.
Average monthly filing volume (January to December, 2004–2023) of the second largest regulatory information class: material event disclosures (Form 8-K).

Table 10.
Monthly disclosure statistics of material event disclosures on Form 8-K (January to December, 2004–2023).
For material event disclosures, no significant difference is observed between the November–April and May–October periods, with a negligible increase of 0.21%. However, when comparing the November–May period to the June–October period, we found a statistically significant increase of 11.31% (), highlighting a higher filing volume during the winter months.
The interaction between material event disclosures (Form 8-K), which see an increase in average monthly filing volume of 11.3% during the extended winter period, and insider trading was demonstrated by A. Cohen et al. (2015). Insiders seem to enjoy systematic abnormal returns of 42 basis points per trade during the “8-K Trading Gap,” the period between a material event and the company’s disclosure in a Form 8-K, up to four days later. A trading strategy based on positive 8-K filings yields abnormal returns of 35.4 basis points, with insider trading during the 8-K Trading Gap predicting the directional impact of 8-K filings on stock prices with high accuracy. This led to the US Congress passing the “8-K Trading Gap Act of 2021,” which requires certain publicly traded companies to adopt policies to prevent executives from trading their securities after a significant event but before disclosing it through a public filing.
Additionally, Form 8-Ks are used to announce special dividends. Beladi et al. (2016) found that firms are more likely to announce special dividends at the end of the year, particularly in November and December, resulting in short-term abnormal returns that are higher during the Halloween period (November–April).
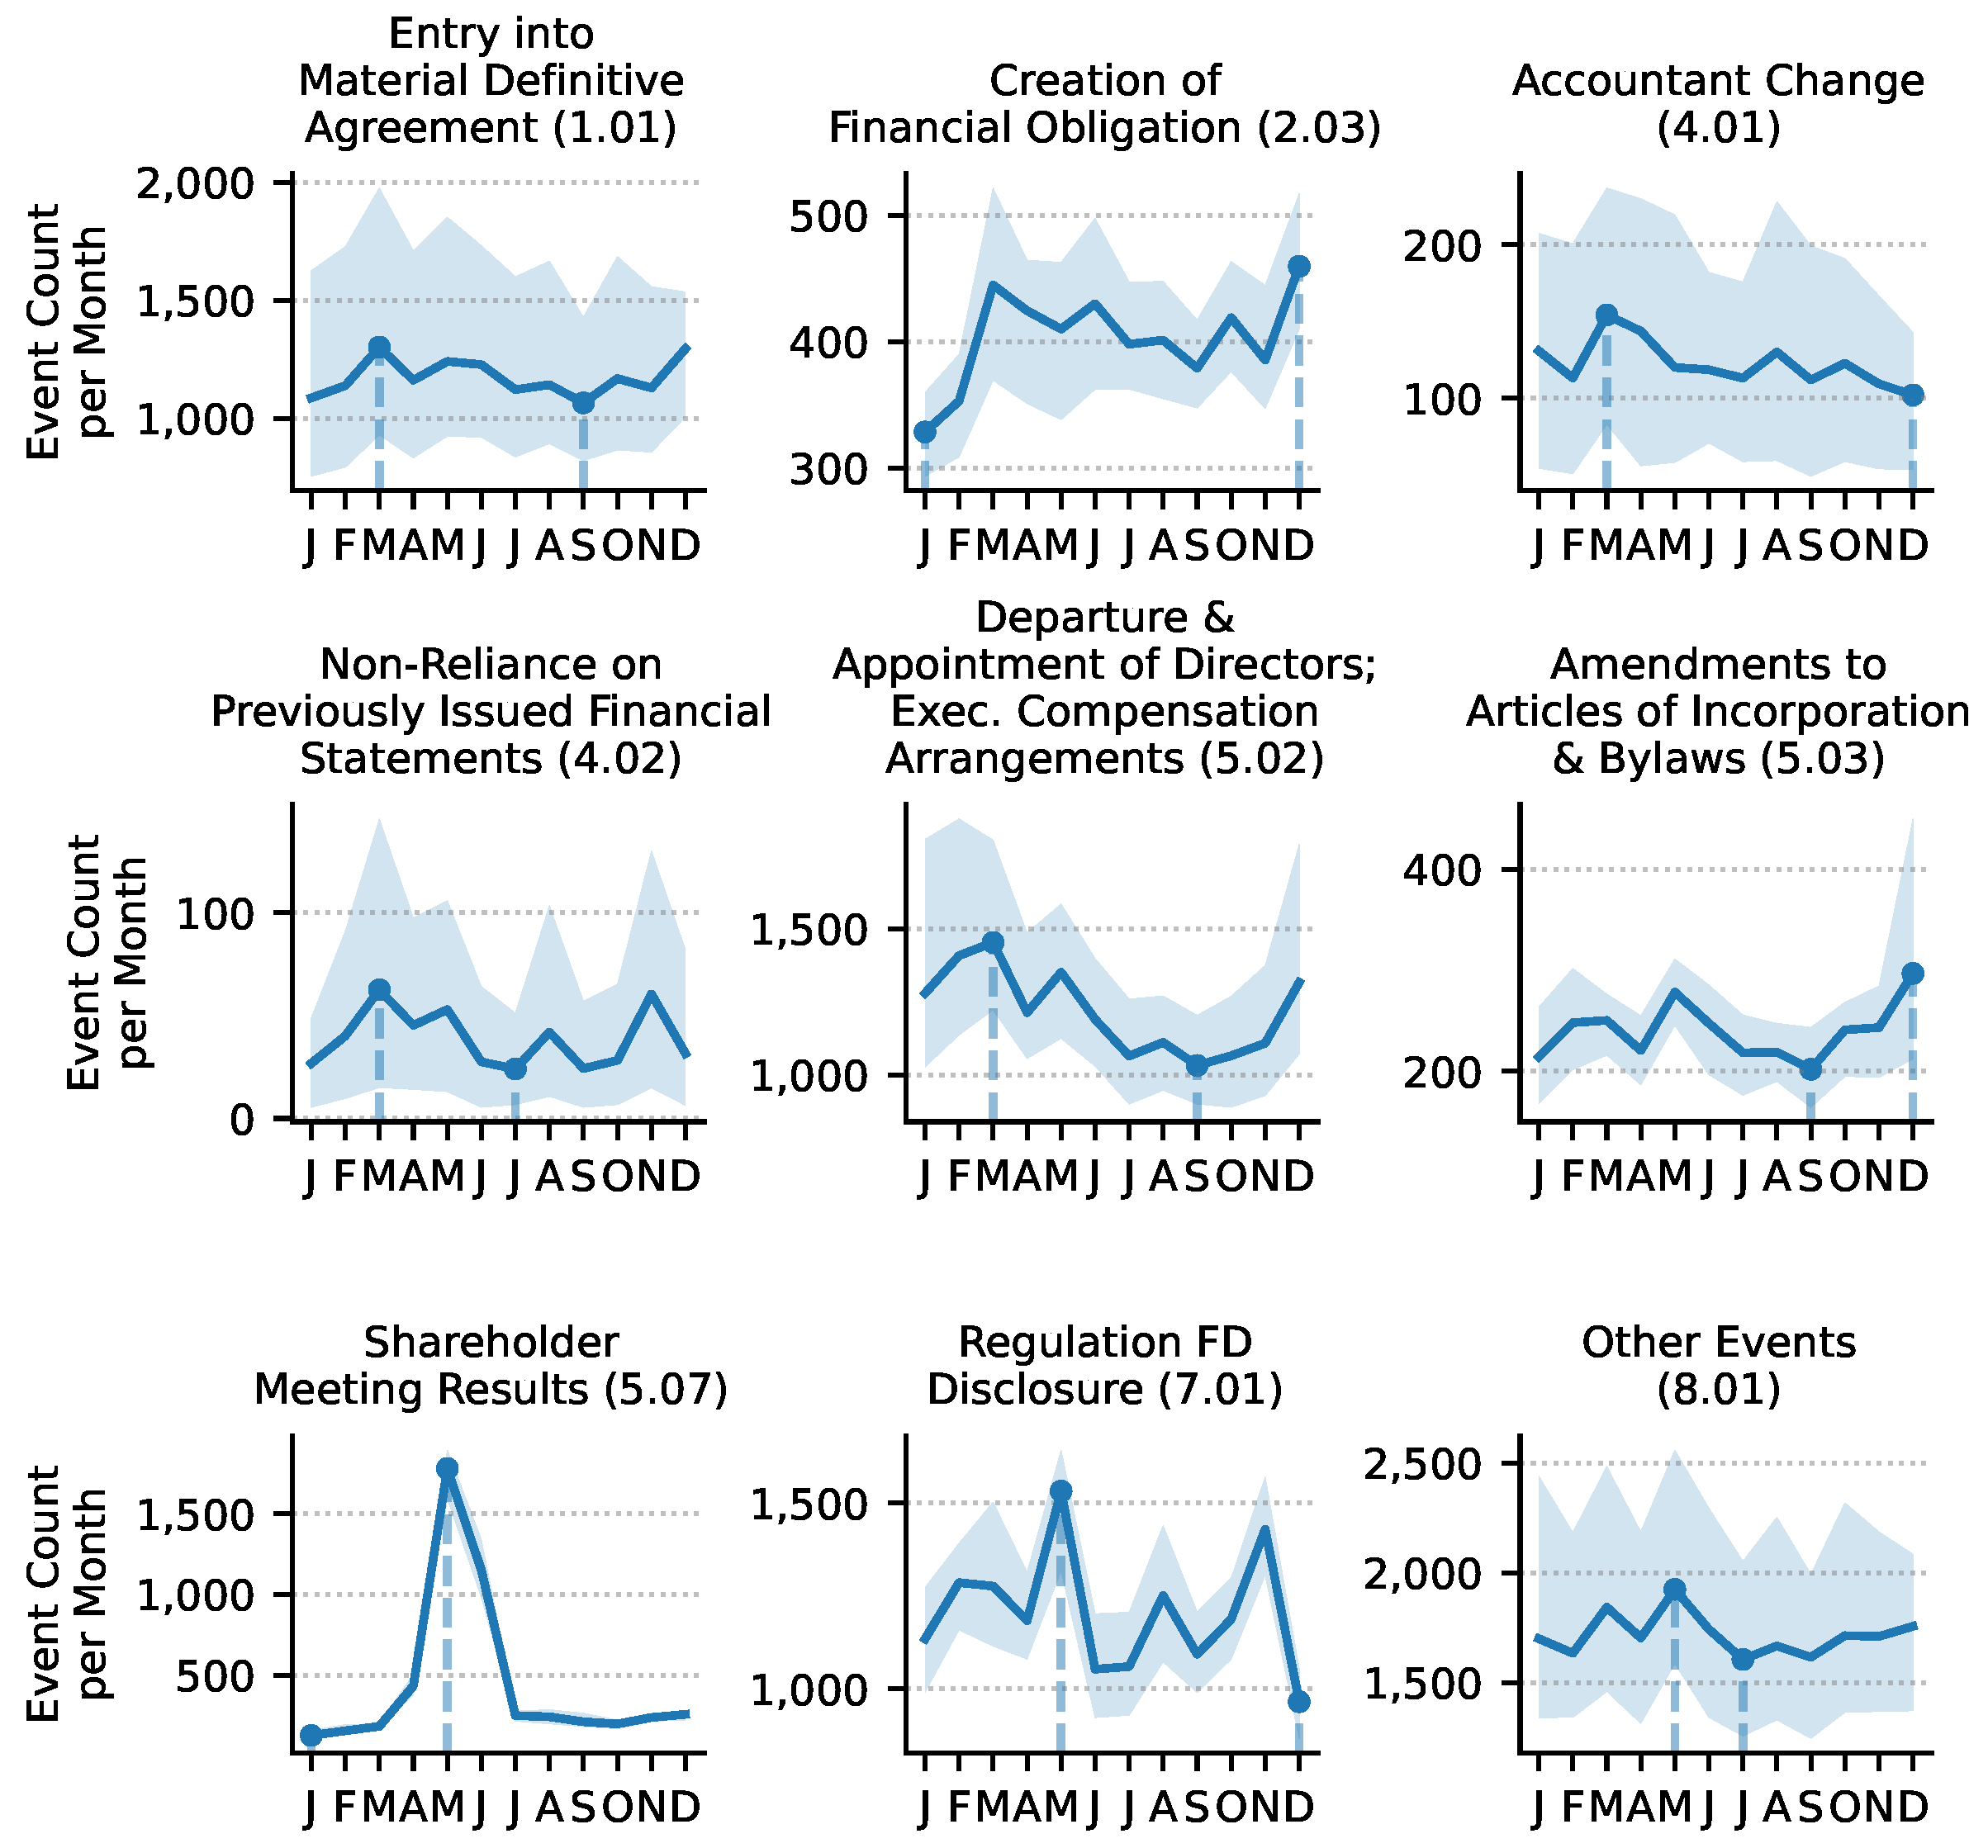
The majority of shareholder meetings occur between April and June, peaking in May each year, as evidenced by the average monthly filing volume of Item 5.07 disclosed in Form 8-K (Figure 10). Item 5.07, titled “Submission of Matters to a Vote of Security Holders,” reports the outcomes of matters such as elections of directors, advisory votes on executive compensation, and other significant corporate actions, with a maximum delay of four days after the vote. Although the April to June period spans the transition from winter to summer, we still assume that shareholder meetings positively impact the winter cycle. This is because of the distribution of various information to shareholders weeks and months in advance to prepare for decision-making. Proxy statements (Form DEF 14A), which provide shareholders with important information to be voted on and solicit their votes on various proposals and matters, reach their highest disclosure volume in April. Brickley (1986) found significant positive abnormal returns around stockholder meeting dates, therefore suggesting that the surge of shareholder meetings during the winter-to-summer transition period (April to June) partially contributes to the Halloween effect.
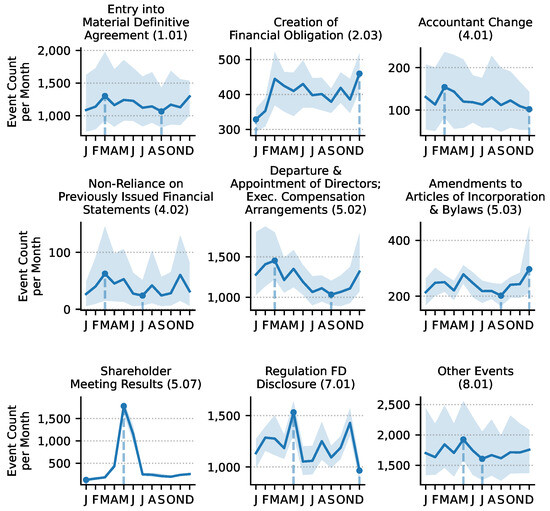
Figure 10.
Average monthly occurrences of selected material events from 2005 to 2023, as extracted from Form 8-K filings. The events include Entry into a Material Definitive Agreement (Item 1.01), Creation of a Financial Obligation (Item 2.03), Accountant Change (Item 4.01), Non-Reliance on Previously Issued Financial Statements (Item 4.02), Departure and Appointment of Directors or Executive Compensation Arrangements (Item 5.02), Amendments to Articles of Incorporation & Bylaws (Item 5.03), Shareholder Meeting Results (Item 5.07), Regulation FD Disclosure (Item 7.01), and Other Events (Item 8.01). Each panel shows the mean event count per month (blue line), with the light blue shaded area indicating the interval between the 2.5% and 97.5% percentiles. High and low months are marked to highlight the seasonality and frequency of these corporate actions over the given period.
In addition, Dimitrov and Jain (2011) identified that managers generally report more positive news before annual shareholder meetings to reduce shareholder discontent. They found that firms exhibit significantly positive abnormal returns during the 40 days leading up to the annual shareholder meeting, which falls within the end of the winter cycle. Notably, approximately two-thirds of these positive pre-meeting returns are reversed in the post-meeting period, which falls within the beginning of the summer cycle.
4. Similar Patterns in European Markets
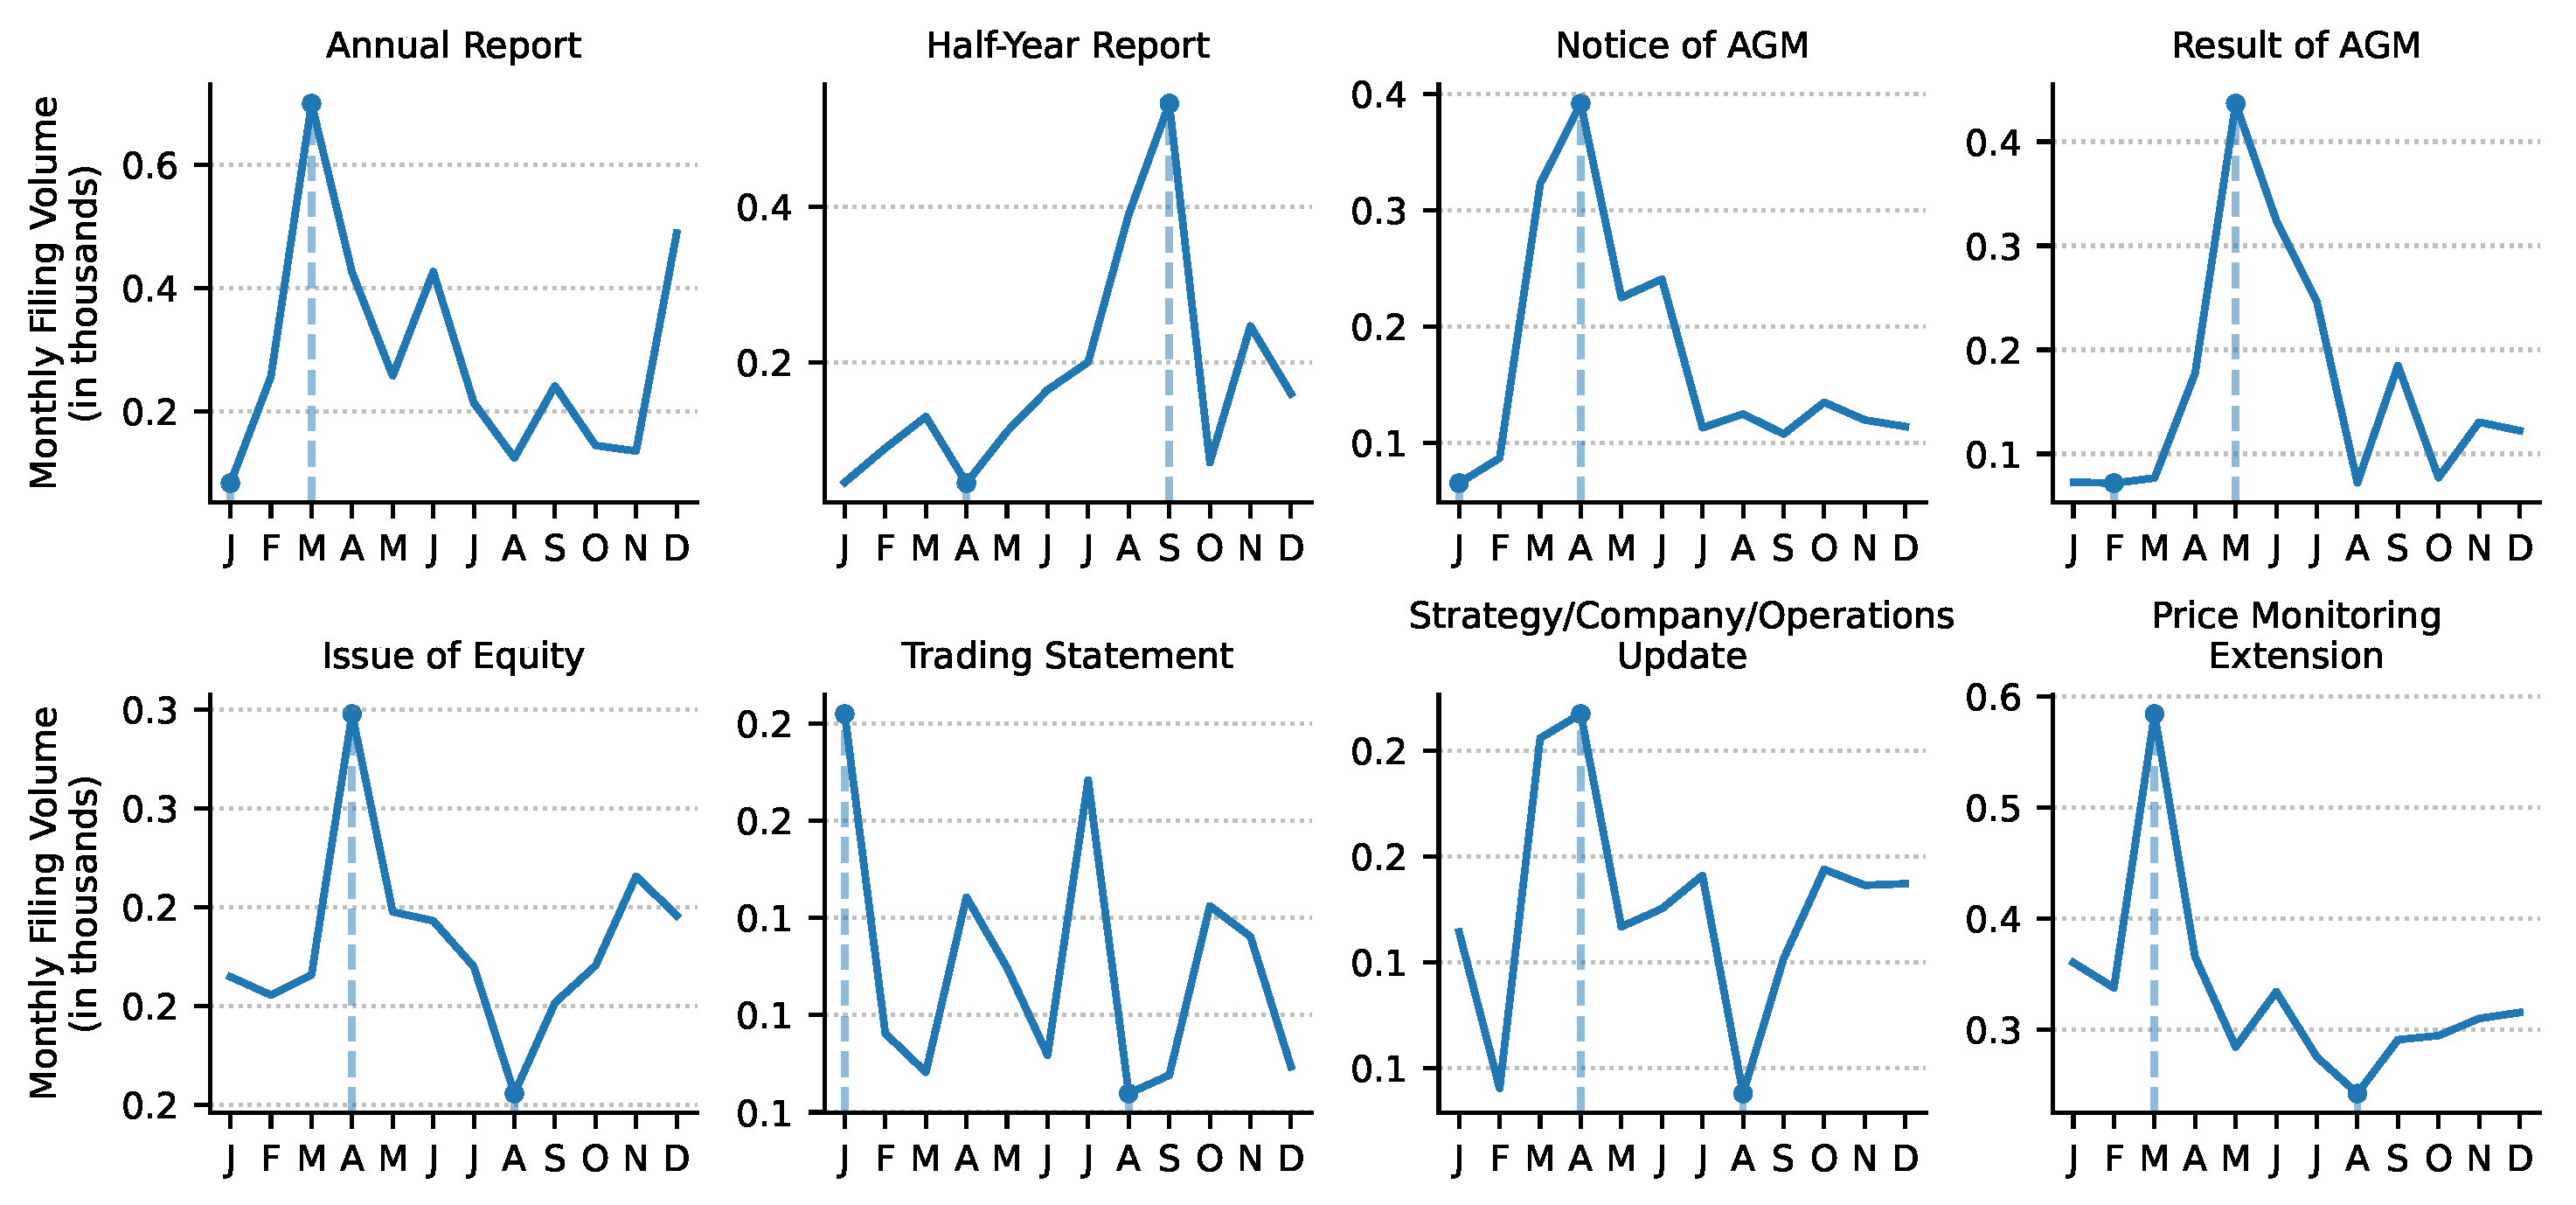
While we do not observe a similar seasonal pattern across the total number of regulatory disclosures submitted to the London Stock Exchange’s (LSE) RNS system by UK-regulated entities, we do find notable patterns in specific disclosure types between 2013 and 2023. For instance, the number of annual reports disclosed by companies listed on the LSE during the winter period (November–April) is 48% higher compared to the summer period (May–October), with the majority of these reports consistently published in March each year (Table 11, Figure 11). This March peak mirrors the pattern observed for US-listed companies, which also show the highest volume of annual report disclosures in March. Similarly, the winter period sees a 61% increase in the issuance of proxy voting forms, aligning with the majority of annual general meetings occurring in April and May each year.

Table 11.
Statistics of disclosure volumes via the LSE’s RNS system (2013–2023).
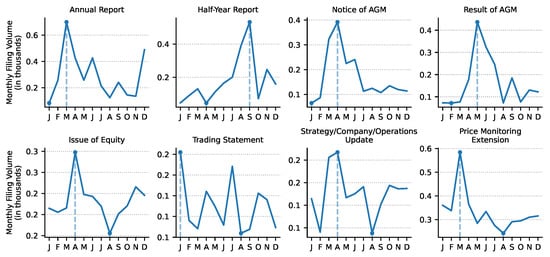
Figure 11.
Average number of regulatory disclosures per month by form type filed by publicly listed companies with the LSE’s RNS system (2013–2023).
Additionally, we find an 11% increase in trading statements during the winter months. Trading statements provide periodic updates from publicly listed companies on key financial performance indicators, including revenue and profitability metrics, market conditions, operational highlights (e.g., contract wins), future guidance and outlook, and significant events such as litigation, acquisitions, or divestments.
The volume of issuance of equity disclosures increases by 7.4% during the winter compared to the summer, reflecting a seasonal preference for raising capital during this period. Price Monitoring Extensions (PMEs) are regulatory announcements triggered automatically by the LSE to highlight significant volatility or unusual price movements in listed securities during auction periods at the start or end of trading sessions, and they also exhibit a seasonal pattern. During the winter months, 31% more PMEs are issued, suggesting increased market volatility and unusual price movements during this time.
While September consistently marks the month with the lowest number of regulatory disclosures in the US, August represents the lowest filing volume for companies listed in the UK and on EuroNext exchanges (Figure 12, Table 12). In the UK, August sees the lowest number of filings across all disclosure types, including equity issuance announcements, trading statements, operational updates, and PMEs, marking August as the least active month for regulatory disclosures.

Figure 12.
Monthly average number of regulatory disclosures from companies listed on the EuroNext exchange (2017–2023). The left panel shows the monthly average number of disclosures filed from 2017 to 2020, while the right panel focuses on the period from 2022 to 2023. Data from 2021 was excluded due to a new regulation implemented mid-year that caused a tenfold increase in disclosure volume, creating an outlier.

Table 12.
Total EuroNext company disclosures by year and period (2017–2023).
5. Press Releases vs. Financial News
Bouman and Jacobsen (2002) did not find a discernible pattern in general financial news volume. Although journalists and news outlets like Reuters, Bloomberg, and the Wall Street Journal use SEC and other regulatory filings as sources of information, their job is to provide a constant flow of news. As Shiller (2016) states, “many news stories in fact seem to have been written under a deadline to produce something–anything–to go along with the numbers from the market.”
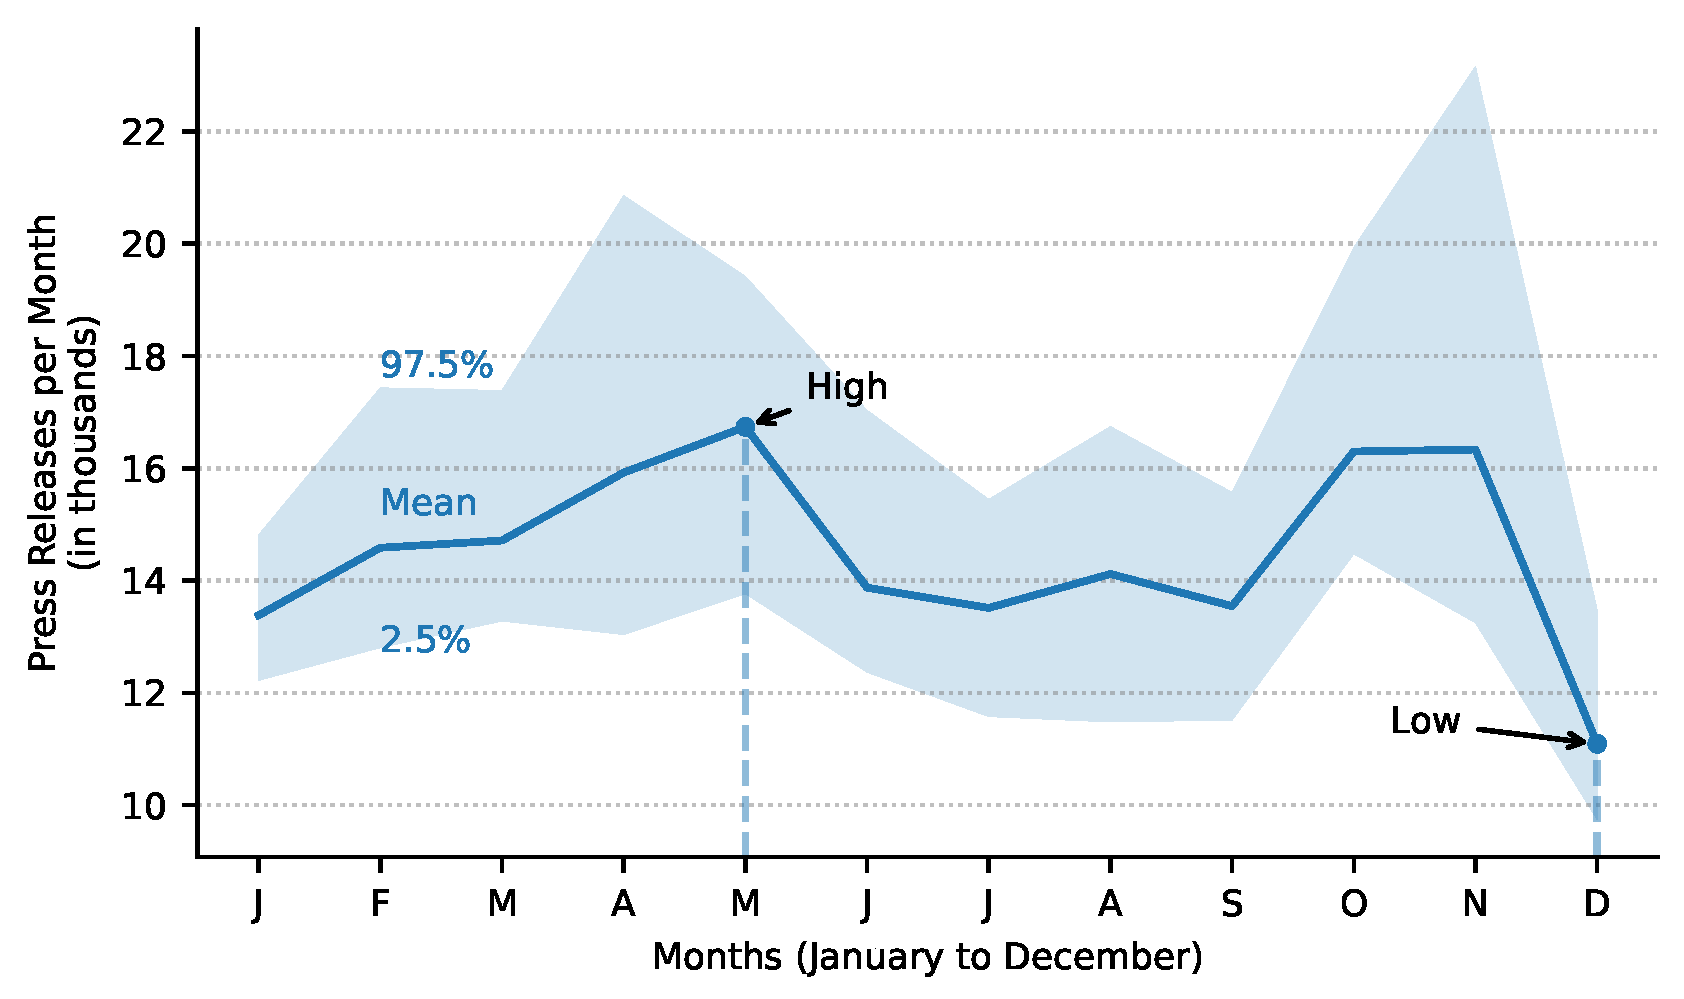
We find a similar, albeit less pronounced, temporal pattern in the number of press releases (PRs) companies publish each month. From 2009 to 2023, PRs of all NASDAQ and NYSE listed companies exhibit the highest average volume in May, followed by a sharp drop over the summer months from June to September (Figure 13, Table 13). Unlike SEC filings, the fewest PRs are published in December. This can be attributed to the Christmas and New Year holidays, which result in fewer working days and a potential decrease in non-material PRs being disclosed, leaving mainly material PRs to be published.
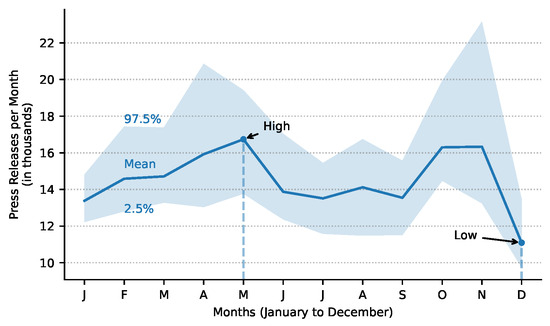
Figure 13.
Average number of press releases published per month by NASDAQ- and NYSE-listed companies (2009–2023). The graph shows the mean number of press releases per month, with the 2.5% and 97.5% percentiles shaded.

Table 13.
Descriptive statistics of monthly press releases published by NASDAQ- and NYSE-listed companies (2009–2023).
During periods of low SEC filing volume, journalists still have a job and need to report news, which may involve recycling old stories or covering less significant topics. This constant supply of content means that the volume of general financial news is high, introducing a lot of noise that may obscure the signal of underlying SEC filing patterns. The varied motivations of journalists to publish news can further obscure the patterns. In some cases, journalists have accepted payments for stock recommendations, and certain newspapers have even taken a share of profits from traders in exchange for favorable coverage (Quinn & Turner, 2020). When comparing the average monthly volume for the summer period (May to October) to the winter period (November to April), we do not find a statistically significant difference. However, when comparing the summer months (June to September) to an extended winter period (October to May), we find a statistically significant increase in average monthly PR volume during the winter of 8.05% (Table 14).

Table 14.
Comparison of mean monthly press release volumes across periods from 2009 to 2023 for all NASDAQ- and NYSE-listed companies.
Unlike journalists, companies have strong incentives to report positive news in their PRs and are not obligated to report when there is nothing significant to disclose. Journalists, on the other hand, must continuously produce content to maintain their employment. This explains the high noise level in general financial news compared to corporate press releases.
Extended Reasoning Beyond Regulatory Filings
We will now indulge in a thought experiment, trying to logically derive through inversion why it is reasonable to assume that an information surge leads to positive momentum.
For the information surge in winter to cause outperformance during this period, information generally needs to have a stronger positive impact on stock prices than a negative one. In other words, an increase in information disclosure tends to generate more positive sentiment, leading to stronger stock price momentum during the November–April period. Information can create positive or negative stock price momentum or have a neutral impact on prices (i.e., no impact at all). To validate the assumption that more information leads to improved performance and strengthen our thesis, let’s apply Charlie Munger’s famous approach of “invert, always invert,” a principle originating from the German mathematician Carl Gustav Jacob Jacobi (Munger et al., 2023), and consider the opposite scenario: the majority of information causes negative stock price momentum.
From 1926 to 2012, the S&P 500 index exhibited an average positive annual return of 9.7%. The compound annual real return after inflation across all U.S. stocks from 1802 to 2012 was 6.6%, and 3.6% for bonds, including major market crashes such as the Wall Street Crash of 1929, Black Monday in 1987, the Dot-Com bubble burst in 2000, and the Global Financial Crisis in 2008 (Siegel, 2014).
Over the last 100 years, the volume of information has undoubtedly increased year over year. If information had had a dominant negative impact, we would expect to see long-term negative stock price momentum, with prices declining as information accumulated. However, this is not what we observe. Instead, we see positive annual returns over the long run. This suggests that while prices may drop temporarily due to the negative impact of information, there must be other factors driving the long-term positive momentum.
Potential factors include the following:
- Weather: Studies by Saunders (1993) and Hirshleifer and Shumway (2003) found that stock prices tend to be higher on sunny days and lower on cloudy days. Keef and Roush (2016) identified that temperatures and wind speeds also impact stock prices, while trading volume drops significantly during blizzards (Loughran & Schultz, 2004). However, these effects are short-lived, affecting only the day and the following day with the corresponding weather, and cannot explain longer-term trends.
- Daylight Saving Time: Kamstra et al. (2000) showed that daylight-saving weekends are typically followed by large negative returns on financial market indices, which is statistically significant for the U.S., Canadian, and U.K. indices across various metrics. However, the impact is only short-lived.
- Sports Events: Edmans et al. (2007) analyzed 1100 international soccer matches and 1500 additional games from cricket, rugby, ice hockey, and basketball from January 1973 to December 2004. They found that national stock markets experience significant negative returns following losses in major soccer matches. Losses in other sports also impact returns, though the effect is generally smaller, and there is no significant impact on positive returns following wins.
- Day of the Week: Cross (1973) found that stock prices rose more often on Fridays than on any other day of the week and least often on Mondays. Lakonishok and Smidt (1988) confirmed this weekend effect, noting significantly negative mean stock returns on Mondays and positive returns on the last trading day of the week. Dellavigna and Pollet (2009) also identified that the immediate stock price response to earnings announcements is 15% lower on Fridays compared to other weekdays. However, these effects are short-lived and impact only single-day returns.
- Holidays: Bergsma and Jiang (2015) found that stocks earn 2.5% higher abnormal returns in the month of a cultural New Year relative to other months. Fang et al. (2017) discovered a strong link between school holidays and market returns, with stock market returns in the month after major school holidays being 0.6% to 1% lower than in other months. Ariel (1990) found that stocks tend to advance with disproportionate frequency and high mean returns on the trading day prior to holidays, averaging nine to fourteen times the mean return for the remaining days of the year. Lakonishok and Smidt (1988) observed the Holiday Effect, with significantly higher returns before holidays compared to regular days. Kim and Park (1994) confirmed these findings, noting abnormally high returns on the trading day before holidays in the stock markets of the UK and Japan, independent of the US holiday effect.
In conclusion, while temporary factors such as weather, daylight saving time, sports events, day of the week, and holidays can influence short-term stock price movements, they do not account for the long-term positive momentum observed in the market. One could argue that emotions, psychology, and biases might play a role (Pring, 1995).
However, this would imply that those factors drive long-run positive stock momentum, which is unlikely to be the primary driver. Therefore, the assumption that the majority of information causes negative momentum cannot be true, supporting our hypothesis that information has a stronger positive impact on stock prices.
The third and final scenario is that information generally has no impact on stock prices. If this were true, markets would not be driven by information but by other factors, primarily emotions, behavioral biases, and psychology, as the factors outlined above are only short-lived. This would imply that market prices over the last 100 years are driven solely by investment psychology rather than fundamental, material information. If this were the case, any data-based valuation, statistical investment model, or number-driven approach would be rendered useless. Since these models are not universally considered ineffective, it follows that information cannot be entirely neutral in its impact on stock prices.
Thus, it is reasonable to conclude that information does affect stock prices, supporting the idea that information, in general, has a stronger positive influence on price momentum than a negative one. Thereby strengthening our findings that the information surge in winter is a plausible contributing factor for the outperformance during the November-to-April period.
6. Limitations and Future Research Opportunities
Our study does not attempt to establish a causal explanation for the Halloween effect, nor does it claim a direct cause-and-effect relationship between disclosure volume and seasonal stock market performance. Rather, we identify a new recurring seasonal pattern in regulatory disclosures that aligns with the Halloween effect periods over the analyzed period from 2004 to 2023. While prior research has demonstrated that various SEC form types significantly impact stock prices, we do not empirically test the direct relationship between disclosure volume and stock returns. The reason such an analysis was not conducted is straightforward: it would require an entirely new research project, effectively consolidating and replicating over 20 prior studies on the most common form types and their impact on stock prices into a single comprehensive study. Our findings provide a compelling reason to perform such a new project.
Our analysis is descriptive in nature, highlighting strong temporal correlations but not establishing causality. The mechanism through which SEC filings may influence the Halloween effect remains unexplored and provides a promising avenue for future research. To validate a causal link, more rigorous empirical testing, potentially at the firm or event level and incorporating return data, is needed.
Additionally, while the Halloween effect is often more pronounced in European markets, our analysis of European regulatory disclosures is limited. We obtained London Stock Exchange data from 2013 to 2023 and EuroNext data from 2017 to 2023. However, the EuroNext dataset excludes 2021 due to a mid-year change in disclosure requirements that led to an anomalous increase in filings. Despite these constraints, we observe similar seasonal disclosure patterns in both markets, with EuroNext data showing peak volumes in April and May.
Overall, while our findings offer a compelling new angle on the Halloween effect, the empirical scope remains limited, and further research is required to assess causality and extend analysis across broader international markets.
7. Conclusions
We provide a new puzzle piece to help decipher the Halloween effect anomaly, known as “Sell in May and Go Away,” which suggests that stocks perform better between November and April than they do between May and October. By analyzing all regulatory SEC disclosures from 2004 to 2023, including filings from publicly listed companies, insiders, institutional investors, funds, and other market participants, we identify an annually recurring pattern in disclosure volume. This pattern aligns with the Halloween effect periods, with an increase in disclosure volume during the winter (November to April) and a decline during the summer (May to October). September stands out as the month with the lowest disclosure volume in the U.S., aligning with prior findings that September is the only month in the past century to exhibit a negative average return.
Across all information categories, we find a 16% increase in disclosure volumes during the winter period compared to the summer. Insider trading, activist investor activity, and private securities offerings exhibit similar patterns, with filing volumes rising by 22%, 11%, and 13%, respectively, during the winter period. The publication of annual reports with audited financial statements increased by 473% during the winter compared to the summer.
We also observe similar seasonal disclosure patterns in European markets. For example, companies listed on the London Stock Exchange publish 48% more annual reports during the winter than in the summer, with March consistently being the peak month. Price Monitoring Extensions, triggered by market volatility and unusual price movements, increase by 31% during the winter months, while trading statements, which include updates on company performance, rise by 11% during the same period. In contrast, August consistently marks the lowest filing volume for companies listed on the London Stock Exchange and EuroNext exchanges.
We do not attempt to establish a causal explanation for the Halloween effect, nor do we claim a direct cause-and-effect relationship between disclosure volume and seasonal stock market performance. With prior research demonstrating the significant impact of SEC filings on stock prices, and our finding that regulatory information surges and droughts align with periods of stock overperformance and underperformance during the winter and summer, respectively, we offer a compelling new piece to the Halloween effect puzzle. Future research could empirically test the direct relationship between disclosure volume and stock returns across the most common SEC form types to evaluate the mechanism through which SEC filings may influence the Halloween effect.
Funding
This research received no external funding.
Institutional Review Board Statement
Not applicable.
Informed Consent Statement
Not applicable.
Data Availability Statement
The original contributions presented in this study are included in the article. Further inquiries can be directed to the corresponding author.
Acknowledgments
This paper was accepted for the 37th Australasian Finance and Banking Conference (AFBC), Australia, 10–13 December 2024. We are sincerely grateful for the constructive feedback and comments from Ben Jacobsen (Finance, TIAS Business School, Tilburg University), author of the original Halloween effect paper, Jonathan W. Lewellen (Finance, Tuck School of Business at Dartmouth), and Peter N. Posch (Finance, TU Dortmund).
Conflicts of Interest
The author declares no conflicts of interest.
Notes
| 1 | See https://sec-api.io/docs/query-api, (accessed on 10 August 2025). |
| 2 | See https://sec-api.io/resources/analyzing-sec-edgar-filing-trends-and-patterns-from-1994-to-2022, https://sec-api.io/resources/edgar-filer-analysis, (accessed on 10 August 2025). |
References
- Andrade, S. C., Chhaochharia, V., & Fuerst, M. E. (2013). “Sell in May and go away” just won’t go away. Financial Analysts Journal, 69(4), 94–105. [Google Scholar] [CrossRef]
- Ariel, R. A. (1990). High stock returns before holidays: Existence and evidence on possible causes. The Journal of Finance, 45(5), 1611–1626. [Google Scholar] [CrossRef]
- Beladi, H., Chao, C.-C., & Hu, M. (2016). The Christmas effect—Special dividend announcements. International Review of Financial Analysis, 43, 15–30. [Google Scholar] [CrossRef]
- Bergsma, K., & Jiang, D. (2015). Cultural new year holidays and Stock returns around the world. Financial Management, 45(1), 3–35. [Google Scholar] [CrossRef]
- Bernard, V. L., & Thomas, J. K. (1989). Post-Earnings-Announcement drift: Delayed price response or risk premium? Journal of Accounting Research, 27, 1–36. [Google Scholar] [CrossRef]
- Bouman, S., & Jacobsen, B. (2002). The Halloween indicator, “Sell in May and go away”: Another puzzle. American Economic Review, 92(5), 1618–1635. [Google Scholar] [CrossRef]
- Brav, A., Jiang, W., Partnoy, F., & Thomas, R. (2008). Hedge fund activism, corporate governance, and firm performance. The Journal of Finance, 63(4), 1729–1775. [Google Scholar] [CrossRef]
- Brickley, J. A. (1986). Interpreting common stock returns around proxy statement disclosures and annual shareholder meetings. Journal of Financial and Quantitative Analysis, 21(3), 343–355. [Google Scholar] [CrossRef]
- Brown, S. V., & Tucker, J. W. (2011). Large-sample evidence on firms’ year-over-year MD&A modifications. Journal of Accounting Research, 49(2), 309–346. [Google Scholar] [CrossRef]
- Cline, B. N., Gokkaya, S., & Liu, X. (2017). The persistence of opportunistic insider trading. Financial Management, 46(4), 919–964. [Google Scholar] [CrossRef]
- Cohen, A., Jackson, R. J., & Mitts, J. (2015). The 8-K trading gap (Tech. Rep.). Columbia Law and Economics Working Paper No. 524. [CrossRef]
- Cohen, L., & Frazzini, A. (2008). Economic links and predictable returns. The Journal of Finance, 63(4), 1977–2011. [Google Scholar] [CrossRef]
- Cohen, L., Malloy, C., & Nguyen, Q. (2020). Lazy prices. The Journal of Finance, 75(3), 1371–1415. [Google Scholar] [CrossRef]
- Cohen, L., Malloy, C., & Pomorski, L. (2012). Decoding inside information. The Journal of Finance, 67(3), 1009–1043. [Google Scholar] [CrossRef]
- Cross, F. (1973). The behavior of stock prices on Fridays and Mondays. Financial Analysts Journal, 29(6), 67–69. [Google Scholar] [CrossRef]
- Dellavigna, S., & Pollet, J. M. (2009). Investor inattention and Friday earnings announcements. The Journal of Finance, 64(2), 709–749. [Google Scholar] [CrossRef]
- Dimitrov, V., & Jain, P. C. (2011). It’s showtime: Do managers report better news before annual shareholder meetings? Journal of Accounting Research, 49(5), 1193–1221. [Google Scholar] [CrossRef]
- Edmans, A., García, D., & Norli, O. (2007). Sports sentiment and stock returns. The Journal of Finance, 62(4), 1967–1998. [Google Scholar] [CrossRef]
- Fang, L., Lin, C., & Shao, Y. (2017). School holidays and stock market seasonality. Financial Management, 47(1), 131–157. [Google Scholar] [CrossRef]
- Griffin, P. A. (2003). Got information? Investor response to form 10-K and form 10-Q EDGAR filings. Review of Accounting Studies, 8(4), 433–460. [Google Scholar] [CrossRef]
- Haggard, K. S., & Witte, H. D. (2010). The Halloween effect: Trick or treat? International Review of Financial Analysis, 19(5), 379–387. [Google Scholar] [CrossRef]
- Hirsch, J. A. (2023). Stock trader’s almanac 2024. John Wiley & Sons. [Google Scholar]
- Hirshleifer, D., Lim, S. H., & Teoh, S. H. (2009). Driven to distraction: Extraneous events and underreaction to earnings news. The Journal of Finance, 64(5), 2289–2325. [Google Scholar] [CrossRef]
- Hirshleifer, D., & Shumway, T. (2003). Good day sunshine: Stock returns and the weather. The Journal of Finance, 58(3), 1009–1032. [Google Scholar] [CrossRef]
- Jacobsen, B., & Marquering, W. (2008). Is it the weather? Journal of Banking & Finance, 32(4), 526–540. [Google Scholar] [CrossRef]
- Jacobsen, B., & Visaltanachoti, N. (2009). The Halloween effect in U.S. sectors. The Financial Review, 44(3), 437–459. [Google Scholar] [CrossRef]
- Jeon, Y., McCurdy, T. H., & Zhao, X. (2022). News as sources of jumps in stock returns: Evidence from 21 million news articles for 9000 companies. Journal of Financial Economics, 145(2), 1–17. [Google Scholar] [CrossRef]
- Kamstra, M. J., Kramer, L. A., & Levi, M. D. (2000). Losing sleep at the market: The daylight saving anomaly. The American Economic Review, 90(4), 1005–1011. [Google Scholar] [CrossRef]
- Keef, S. P., & Roush, M. L. (2016). The weather and stock returns in New Zealand. Quarterly Journal of Business and Economics, 41, 61. [Google Scholar]
- Kim, C., & Park, J. (1994). Holiday effects and stock returns: Further evidence. Journal of Financial and Quantitative Analysis, 29(1), 145–157. [Google Scholar] [CrossRef]
- Kim, C., Wang, K., & Zhang, L. (2019). Readability of 10-K reports and stock price crash risk. Contemporary Accounting Research, 36(2), 1184–1216. [Google Scholar] [CrossRef]
- Lakonishok, J., & Smidt, S. (1988). Are seasonal anomalies real? A ninety-year perspective. The Review of Financial Studies, 1(4), 403–425. [Google Scholar] [CrossRef]
- Li, F. (2010). The information content of forward-looking statements in corporate filings—A naïve Bayesian machine learning approach. Journal of Accounting Research, 48(5), 1049–1102. [Google Scholar] [CrossRef]
- Loughran, T., & McDonald, B. (2014). Measuring readability in financial disclosures. The Journal of Finance, 69(4), 1643–1671. [Google Scholar] [CrossRef]
- Loughran, T., & Schultz, P. (2004). Weather, stock returns, and the impact of localized trading behavior. Journal of Financial and Quantitative Analysis, 39(2), 343–364. [Google Scholar] [CrossRef]
- Lucey, B. M., & Zhao, S. (2008). Halloween or January? Yet another puzzle. International Review of Financial Analysis, 17(5), 1055–1069. [Google Scholar] [CrossRef]
- Mayew, W. J., Sethuraman, M., & Venkatachalam, M. (2014). MD&A disclosure and the firm’s ability to continue as a going concern. The Accounting Review, 90(4), 1621–1651. [Google Scholar] [CrossRef]
- Merkley, K. J. (2013). Narrative disclosure and earnings performance: Evidence from R&D disclosures. The Accounting Review, 89(2), 725–757. [Google Scholar] [CrossRef]
- Munger, C., Kaufman, P., Collison, J., & Buffett, W. (2023). Poor Charlie’s almanack: The essential wit and wisdom of Charles T. Munger. Stripe Matter Incorporated. [Google Scholar]
- Muslu, V., Radhakrishnan, S., Subramanyam, K. R., & Lim, D. (2015). Forward-looking MD&A disclosures and the information environment. Management Science, 61(5), 931–948. [Google Scholar] [CrossRef]
- Powell, J. G., Shi, J., Smith, T., & Whaley, R. E. (2009). Political regimes, business cycles, seasonalities, and returns. Journal of Banking & Finance, 33(6), 1112–1128. [Google Scholar] [CrossRef]
- Pring, M. J. (1995). Investment psychology explained: Classic strategies to beat the markets. John Wiley & Sons. [Google Scholar]
- Quinn, W., & Turner, J. D. (2020). Boom and bust: A global history of financial bubbles. Cambridge University Press. [Google Scholar]
- Saunders, E. M. (1993). Stock prices and the Wall Street Weather. The American Economic Review, 83(5), 1337–1345. [Google Scholar]
- Schroeder, J. (2023). Anomalies, trends and patterns in disclosure activities: Understanding EDGAR. Social Science Research Network. [Google Scholar] [CrossRef]
- Shiller, R. J. (2016). Irrational exuberance: Revised and expanded third edition. Princeton University Press. [Google Scholar]
- Siegel, J. J. (2014). Stocks for the long run 5/E: The definitive guide to financial market returns & long-term investment strategies. McGraw Hill Professional. [Google Scholar]
- You, H., & Zhang, X.-J. (2008). Financial reporting complexity and investor underreaction to 10-K information. Review of Accounting Studies, 14(4), 559–586. [Google Scholar] [CrossRef]
- Zhang, C. Y., & Jacobsen, B. (2021). The Halloween indicator, “Sell in May and Go Away”: Everywhere and all the time. Journal of International Money and Finance, 110, 102268. [Google Scholar] [CrossRef]
Disclaimer/Publisher’s Note: The statements, opinions and data contained in all publications are solely those of the individual author(s) and contributor(s) and not of MDPI and/or the editor(s). MDPI and/or the editor(s) disclaim responsibility for any injury to people or property resulting from any ideas, methods, instructions or products referred to in the content. |
© 2025 by the author. Licensee MDPI, Basel, Switzerland. This article is an open access article distributed under the terms and conditions of the Creative Commons Attribution (CC BY) license (https://creativecommons.org/licenses/by/4.0/).

