Inverse DEA for Portfolio Volatility Targeting: Industry Evidence from Taiwan Stock Exchange
Abstract
1. Introduction
2. Literature Review
2.1. Portfolio Optimization Using DEA
2.2. Selecting Inputs and Outputs for DEA in Equity Portfolio Poblem
2.3. Inverse DEA in Finance
2.4. Research Gap
3. Methodology
| Indices and sets |
| n: total number of DMUs |
| k: target DMU being evaluated (k = 1, 2, …, n) |
| j: index for the DMU under evaluation (j = 1, 2, …, n) |
| i: index for input |
| r: index of good output |
| Parameters |
| : input for DMUj (j = 1, 2, …, n) |
| : good output (Return) for DMUj (j = 1, 2, …, n) |
| : bad output (Risk) for DMUj (j = 1, 2, …, n) |
| Decision variables |
| : efficiency score of DMUk under evaluation |
| : inefficiency score of DMUk under evaluation |
| : weight assigned to DMUj (j = 1, 2, …, n) |
3.1. Model Formulation
- , implies efficiency (efficiency score = 1).
- , implies inefficiency.
3.2. Net Zero Volatility (NZV) Goal
4. Empirical Analysis and Discussion
4.1. Data Source and Statistics
4.2. Model Application
4.3. Pre- and Post-COVID Regime Analysis
4.4. Feasibility Validation
4.5. Managerial Implications
5. Conclusions and Future Study
Author Contributions
Funding
Data Availability Statement
Conflicts of Interest
References
- Akbarian, D., & Oukil, A. (2025). Improving efficiency evaluation in the presence of ratio data: Inverse non-radial Enhanced Russell Models. IMA Journal of Management Mathematics, 36(2), 339–362. [Google Scholar] [CrossRef]
- Amin, G. R., & Al-Muharrami, S. (2018). A new inverse data envelopment analysis model for mergers with negative data. IMA Journal of Management Mathematics, 29(2), 137–149. [Google Scholar] [CrossRef]
- Amin, G. R., Al-Muharrami, S., & Toloo, M. (2019). A combined goal programming and inverse DEA method for target setting in mergers. Expert Systems with Applications, 115, 412–417. [Google Scholar] [CrossRef]
- Amin, G. R., Emrouznejad, A., & Gattoufi, S. (2017a). Minor and major consolidations in inverse DEA: Definition and determination. Computers and Industrial Engineering, 103, 193–200. [Google Scholar] [CrossRef]
- Amin, G. R., Emrouznejad, A., & Gattoufi, S. (2017b). Modelling generalized firms’ restructuring using inverse DEA. Journal of Productivity Analysis, 48(1), 51–61. [Google Scholar] [CrossRef]
- Amin, G. R., & Ibn-Boamah, M. (2021). A two-stage inverse data envelopment analysis approach for estimating potential merger gains in the US banking sector. Managerial and Decision Economics, 42(6), 1454–1465. [Google Scholar] [CrossRef]
- Amin, G. R., & Ibn-Boamah, M. (2023). Modeling business partnerships: A data envelopment analysis approach. European Journal of Operational Research, 305(1), 329–337. [Google Scholar] [CrossRef]
- Amin, G. R., & Oukil, A. (2019). Flexible target setting in mergers using inverse data envelopment analysis. International Journal of Operational Research, 35(3), 301–317. [Google Scholar] [CrossRef]
- Amirteimoori, A., & Allahviranloo, T. (2024). Improving technical efficiency in data envelopment analysis for efficient firms: A case on Chinese banks. Information Sciences, 681, 121237. [Google Scholar] [CrossRef]
- An, Q., Liu, X., Li, Y., & Xiong, B. (2019). Resource planning of Chinese commercial banking systems using two-stage inverse data envelopment analysis with undesirable outputs. PLoS ONE, 14(6), e0218214. [Google Scholar] [CrossRef]
- Andria, J., di Tollo, G., & Lokketangen, A. (2017). Distance measures for portfolio selection. In Financial decision aid using multiple criteria: Recent models and applications (pp. 113–129). Springer. [Google Scholar]
- Andria, J., Di Tollo, G., & Pesenti, R. (2021). Fuzzy multi-criteria decision-making: An entropy-based approach to assess tourism sustainability. Tourism Economics, 27(1), 168–186. [Google Scholar]
- Asadi, F., Kordrostami, S., Amirteimoori, A., & Bazrafshan, M. (2023). Inverse data envelopment analysis without convexity: Double frontiers. Decisions in Economics and Finance, 46(1), 335–354. [Google Scholar] [CrossRef]
- Basso, A., & Funari, S. (2001). A data envelopment analysis approach to measure the mutual fund performance. European Journal of Operational Research, 135(3), 477–492. [Google Scholar] [CrossRef]
- Bauder, D., Bodnar, T., Parolya, N., & Schmid, W. (2021). Bayesian mean–variance analysis: Optimal portfolio selection under parameter uncertainty. Quantitative Finance, 21(2), 221–242. [Google Scholar]
- Caldeira, J. F., Santos, A. A., & Torrent, H. S. (2023). Semiparametric portfolios: Improving portfolio performance by exploiting non-linearities in firm characteristics. Economic Modelling, 122, 106239. [Google Scholar] [CrossRef]
- Choi, T.-M., Chung, S.-H., Sun, X., & Wen, X. (2021). Using blockchain to improve buffer-stock-sharing and combat cheating behaviors under virtual pooling. IEEE Transactions on Engineering Management, 71, 328–345. [Google Scholar]
- Chung, Y. H., Färe, R., & Grosskopf, S. (1997). Productivity and undesirable outputs: A directional distance function approach. Journal of Environmental Management, 51(3), 229–240. [Google Scholar] [CrossRef]
- Daryani, Z. S., Tohidi, G., Daneshian, B., Razavyan, S., & Hosseinzadeh Lotfi, F. H. (2021). Inverse DEA in two-stage systems based on allocative efficiency. Journal of Intelligent and Fuzzy Systems, 40(1), 591–603. [Google Scholar] [CrossRef]
- Ebrahimi, M., Valami, H. B., & Karamali, L. (2021). Portfolio Selection by a Non-Radial DEA Model: Evidence from of Tehran Stock Exchange (TSE). Journal of Mathematics and Modeling in Finance, 1(2), 181–193. [Google Scholar]
- Edirisinghe, N. C. P., & Zhang, X. (2008). Portfolio selection under DEA-based relative financial strength indicators: Case of US industries. Journal of the Operational Research Society, 59, 842–856. [Google Scholar] [CrossRef]
- Emrouznejad, A., & Amin, G. R. (2023). Advances in inverse data envelopment analysis: Empowering performance assessment. IMA Journal of Management Mathematics, 34(3), 415–419. [Google Scholar] [CrossRef]
- Emrouznejad, A., Amin, G. R., Ghiyasi, M., & Michali, M. (2023). A review of inverse data envelopment analysis: Origins, development and future directions. IMA Journal of Management Mathematics, 34(3), 421–440. [Google Scholar] [CrossRef]
- Galagedera, D. U. A. (2024). Planning for potential increases in disbursements and risk of managed funds conditional on desired short-term performance levels. Applied Economics, 56(28), 3385–3400. [Google Scholar] [CrossRef]
- Gattoufi, S., Amin, G. R., & Emrouznejad, A. (2014). A new inverse DEA method for merging banks. IMA Journal of Management Mathematics, 25(1), 73–87. [Google Scholar] [CrossRef]
- Gerami, J., Mozaffari, M. R., Wanke, P. F., & Corrêa, H. L. (2023). A generalized inverse DEA model for firm restructuring based on value efficiency. IMA Journal of Management Mathematics, 34(3), 541–580. [Google Scholar] [CrossRef]
- Ghiyasi, M. (2024). An inverse data envelopment analysis model for solving time substitution problems. Decision Analytics Journal, 11, 100467. [Google Scholar] [CrossRef]
- Ghiyasi, M. (2025). New insights and theoretical conditions for determining minor and major consolidations in the inverse DEA. IMA Journal of Management Mathematics, 36(3), 563–578. [Google Scholar] [CrossRef]
- Ghiyasi, M., & Zhu, N. (2020). An inverse semi-oriented radial data envelopment analysis measure for dealing with negative data. IMA Journal of Management Mathematics, 31(4), 505–516. [Google Scholar] [CrossRef]
- Ghiyasi, M., & Zhu, N. (2025). Inverse data envelopment analysis for parallel production systems: An analysis in four types of Chinese banks. International Journal of System Assurance Engineering and Management, 16(1), 29–37. [Google Scholar] [CrossRef]
- Ghobadi, S. (2021). Merging decision-making units with interval data. RAIRO—Operations Research, 55, S1605–S1631. [Google Scholar] [CrossRef]
- Ghobadi, S., Soleimani-Chamkhorami, K., & Zanboori, E. (2023). Simultaneous estimation of input–output levels under improving efficiency level in an assessment window. Soft Computing, 27(8), 4553–4577. [Google Scholar] [CrossRef]
- Ghomi, A., Ghobadi, S., Behzadi, M. H., & Rostamy-Malkhlifeh, M. (2021). Inverse data envelopment analysis with stochastic data. RAIRO—Operations Research, 55(5), 2739–2762. [Google Scholar] [CrossRef]
- Guijarro, F., Martínez-Gómez, M., & Visbal-Cadavid, D. (2020). A model for sector restructuring through genetic algorithm and inverse DEA. Expert Systems with Applications, 154, 113422. [Google Scholar] [CrossRef]
- Hosseinzadeh Lotfi, F. H., Ghazi, N. E., Ghazi, S. E., & Namin, M. A. (2012). The outputs estimation of a DMU according to improvement of its progress in context dependent DEA. Applied Mathematical Sciences, 6(5–8), 247–258. Available online: https://www.scopus.com/inward/record.uri?eid=2-s2.0-84856584121&partnerID=40&md5=98dd03a645023acec84f852884c2583c (accessed on 15 January 2025).
- Ibn-Boamah, M., & Amin, G. R. (2024). Partner selection in business mergers: A data envelopment analysis approach. RAIRO—Operations Research, 58(4), 3107–3117. [Google Scholar] [CrossRef]
- Jing, D., Imeni, M., Edalatpanah, S. A., Alburaikan, A., & Khalifa, H. A. E.-W. (2023). Optimal selection of stock portfolios using multi-criteria decision-making methods. Mathematics, 11(2), 415. [Google Scholar]
- Kehinde, T., Adedokun, O. J., Joseph, A., Kabirat, K. M., Akano, H. A., & Olanrewaju, O. A. (2025). Helformer: An attention-based deep learning model for cryptocurrency price forecasting. Journal of Big Data, 12(1), 81. [Google Scholar] [CrossRef]
- Kehinde, T., Chan, F. T., & Chung, S. (2023a). Scientometric review and analysis of recent approaches to stock market forecasting: Two decades survey. Expert Systems with Applications, 213, 119299. [Google Scholar]
- Kehinde, T., Chung, S., & Chan, F. T. (2023b, July 13–14). Benchmarking TPU and GPU for stock price forecasting using LSTM model development. Science and Information Conference, London, UK. [Google Scholar]
- Kehinde, T., Khan, W. A., & Chung, S.-H. (2023c, October 10–12). Financial market forecasting using RNN, LSTM, BiLSTM, GRU and transformer-based deep learning algorithms. IEOM International Conference on Smart Mobility and Vehicle Electrification, Detroit, MI, USA. [Google Scholar]
- Kehinde, T. O., Adedokun, O. J., Kareem, M. K., Akpan, J., & Olanrewaju, O. A. (2025a). STL-ELM: A computationally efficient hybrid approach for predicting high volatility stock market. Intelligent Systems with Applications, 27, 200564. [Google Scholar] [CrossRef]
- Kehinde, T. O., Chung, S. H., & Olanrewaju, O. A. (2025b). An integrated approach to stock selection and ranking: Combining Shannon entropy technique, DEA, and inverse DEA. IEEE Access, 13, 138851–138866. [Google Scholar] [CrossRef]
- Khan, W. A. (2023). Balanced weighted extreme learning machine for imbalance learning of credit default risk and manufacturing productivity. Annals of Operations Research, 348, 833–861. [Google Scholar] [CrossRef]
- Khan, W. A., Chung, S. H., Awan, M. U., & Wen, X. (2020). Machine learning facilitated business intelligence (Part II) Neural networks optimization techniques and applications. Industrial Management & Data Systems, 120(1), 128–163. [Google Scholar]
- Khan, W. A., Chung, S.-H., Liu, S. Q., Masoud, M., & Wen, X. (2025). Smoothing and Matrix decomposition-based stacked bidirectional GRU model for machine downtime forecasting. IEEE Transactions on Systems, Man, and Cybernetics: Systems, 55(10), 7215–7227. [Google Scholar] [CrossRef]
- Kuo, K.-C., Lu, W.-M., & Dinh, T. N. (2021). An integrated efficiency evaluation of China stock market. Journal of the Operational Research Society, 72(4), 950–969. [Google Scholar] [CrossRef]
- Markowitz, H. M. (1991). Foundations of portfolio theory. The Journal of Finance, 46(2), 469–477. [Google Scholar] [CrossRef]
- Mergoni, A., Emrouznejad, A., & De Witte, K. (2024). Fifty years of data envelopment analysis. European Journal of Operational Research, 326(3), 389–412. [Google Scholar] [CrossRef]
- Oloko, T. F. (2018). Portfolio diversification between developed and developing stock markets: The case of US and UK investors in Nigeria. Research in International Business and Finance, 45, 219–232. [Google Scholar] [CrossRef]
- Orisaremi, K. K., Chan, F. T. S., & Chung, N. S. H. (2021). Potential reductions in global gas flaring for determining the optimal sizing of gas-to-wire (GTW) process: An inverse DEA approach. Journal of Natural Gas Science and Engineering, 93, 103995. [Google Scholar] [CrossRef]
- Panwar, A., Olfati, M., Pant, M., & Snasel, V. (2022). A review on the 40 years of existence of data envelopment analysis models: Historic development and current trends. Archives of Computational Methods in Engineering, 29(7), 5397–5426. Available online: https://pmc.ncbi.nlm.nih.gov/articles/PMC9184254/pdf/11831_2022_Article_9770.pdf (accessed on 15 January 2025). [CrossRef]
- Peykani, P., Seyed Esmaeili, F. S., Mirmozaffari, M., Jabbarzadeh, A., & Khamechian, M. (2022). Input/output variables selection in data envelopment analysis: A shannon entropy approach. Machine Learning and Knowledge Extraction, 4(3), 688–699. [Google Scholar] [CrossRef]
- Pirgaip, B., Ertuğrul, H. M., & Ulussever, T. (2021). Is portfolio diversification possible in integrated markets? Evidence from South Eastern Europe. Research in International Business and Finance, 56, 101384. [Google Scholar] [CrossRef]
- Sohrabi, A., Gerami, J., & Mozaffari, M. R. (2024). A novel approach for modelling strategic alliances and partnerships based on the DEA-R models. Japan Journal of Industrial and Applied Mathematics, 41(3), 1629–1678. [Google Scholar] [CrossRef]
- Soleimani-Chamkhorami, K., Hosseinzadeh Lotfi, F., Jahanshahloo, G., & Rostamy-Malkhlifeh, M. (2020). A ranking system based on inverse data envelopment analysis. IMA Journal of Management Mathematics, 31(3), 367–385. [Google Scholar] [CrossRef]
- Soleimani-Chamkhorami, K., Hosseinzadeh Lotfi, F. H., Jahanshahloo, G. R., & Rostamy-Malkhlifeh, M. (2019). Preserving cost and revenue efficiency through inverse data envelopment analysis models. INFOR, 58(4), 561–578. [Google Scholar] [CrossRef]
- Soltanifar, M., Ghiyasi, M., Emrouznejad, A., & Sharafi, H. (2024). A novel model for merger analysis and target setting: A CSW-Inverse DEA approach. Expert Systems with Applications, 249, 123326. [Google Scholar] [CrossRef]
- Soltanifar, M., Ghiyasi, M., & Sharafi, H. (2023). Inverse DEA-R models for merger analysis with negative data. IMA Journal of Management Mathematics, 34(3), 491–510. [Google Scholar] [CrossRef]
- Soltanifar, M., Tavana, M., Charles, V., Ghiyasi, M., & Sharafi, H. (2025). A novel inverse data envelopment analysis model with negative ratio data. Operational Research, 25(2), 25. [Google Scholar] [CrossRef]
- Statista. (2023). Total market capitalizations of domestic companies listed on stock exchanges worldwide from 2013 to July 2023. Statista. Available online: https://www.statista.com/statistics/274490/global-value-of-share-holdings-since-2000/#:~:text=As%20of%20July%202023%2C%20the,world%20stocks%20as%20of%202023 (accessed on 16 December 2023).
- Tarnaud, A. C., & Leleu, H. (2018). Portfolio analysis with DEA: Prior to choosing a model. Omega, 75, 57–76. [Google Scholar] [CrossRef]
- Trichilli, Y., Abbes, M. B., & Masmoudi, A. (2020). Islamic and conventional portfolios optimization under investor sentiment states: Bayesian vs. Markowitz portfolio analysis. Research in International Business and Finance, 51, 101071. [Google Scholar] [CrossRef]
- Wang, W., Jingyun, L., Bin, L., Wang, W., Zhang, Z., Kaining, S., & Mao, F. (2023). Effectiveness and risk of initial carbon quota allocation principle under the uncertainty of the Chinese electricity market. China Economic Review, 77, 101892. [Google Scholar] [CrossRef]
- Wegener, M., & Amin, G. R. (2019). Minimizing greenhouse gas emissions using inverse DEA with an application in oil and gas. Expert Systems with Applications, 122, 369–375. [Google Scholar] [CrossRef]
- Wei, Q., Zhang, J., & Zhang, X. (2000). An inverse DEA model for inputs/outputs estimate. European Journal of Operational Research, 121(1), 151–163. [Google Scholar] [CrossRef]
- Wijaya, W., & Sidarto, K. A. (2023). Large-scale portfolio optimization using biogeography-based optimization. International Journal of Financial Studies, 11(4), 125. [Google Scholar] [CrossRef]
- Xie, Q., Dai, Q., Li, Y., & Jiang, A. (2014). Increasing the discriminatory power of DEA using Shannon’s entropy. Entropy, 16(3), 1571–1585. [Google Scholar] [CrossRef]
- Yadav, M. P., Sharif, T., Ashok, S., Dhingra, D., & Abedin, M. Z. (2023). Investigating volatility spillover of energy commodities in the context of the Chinese and European stock markets. Research in International Business and Finance, 65, 101948. [Google Scholar] [CrossRef]
- Yu, A., Shao, Y., You, J., Wu, M., & Xu, T. (2019). Estimations of operational efficiencies and potential income gains considering the credit risk for China’s banks. Journal of the Operational Research Society, 70(12), 2153–2168. [Google Scholar] [CrossRef]
- Zeinodin, E., & Ghobadi, S. (2020). Merging decision-making units under inter-temporal dependence. IMA Journal of Management Mathematics, 31(2), 139–166. [Google Scholar] [CrossRef]
- Zeng, X., Zhou, Z., Gong, Y., & Liu, W. (2022). A data envelopment analysis model integrated with portfolio theory for energy mix adjustment: Evidence in the power industry. Socio-Economic Planning Sciences, 83, 101332. [Google Scholar] [CrossRef]
- Zhou, B. (2023). The impact of the US Chip Act and the Chip4 Alliance, and China how to respond it. Transactions on Social Science, Education and Humanities Research, 1, 407–410. [Google Scholar]
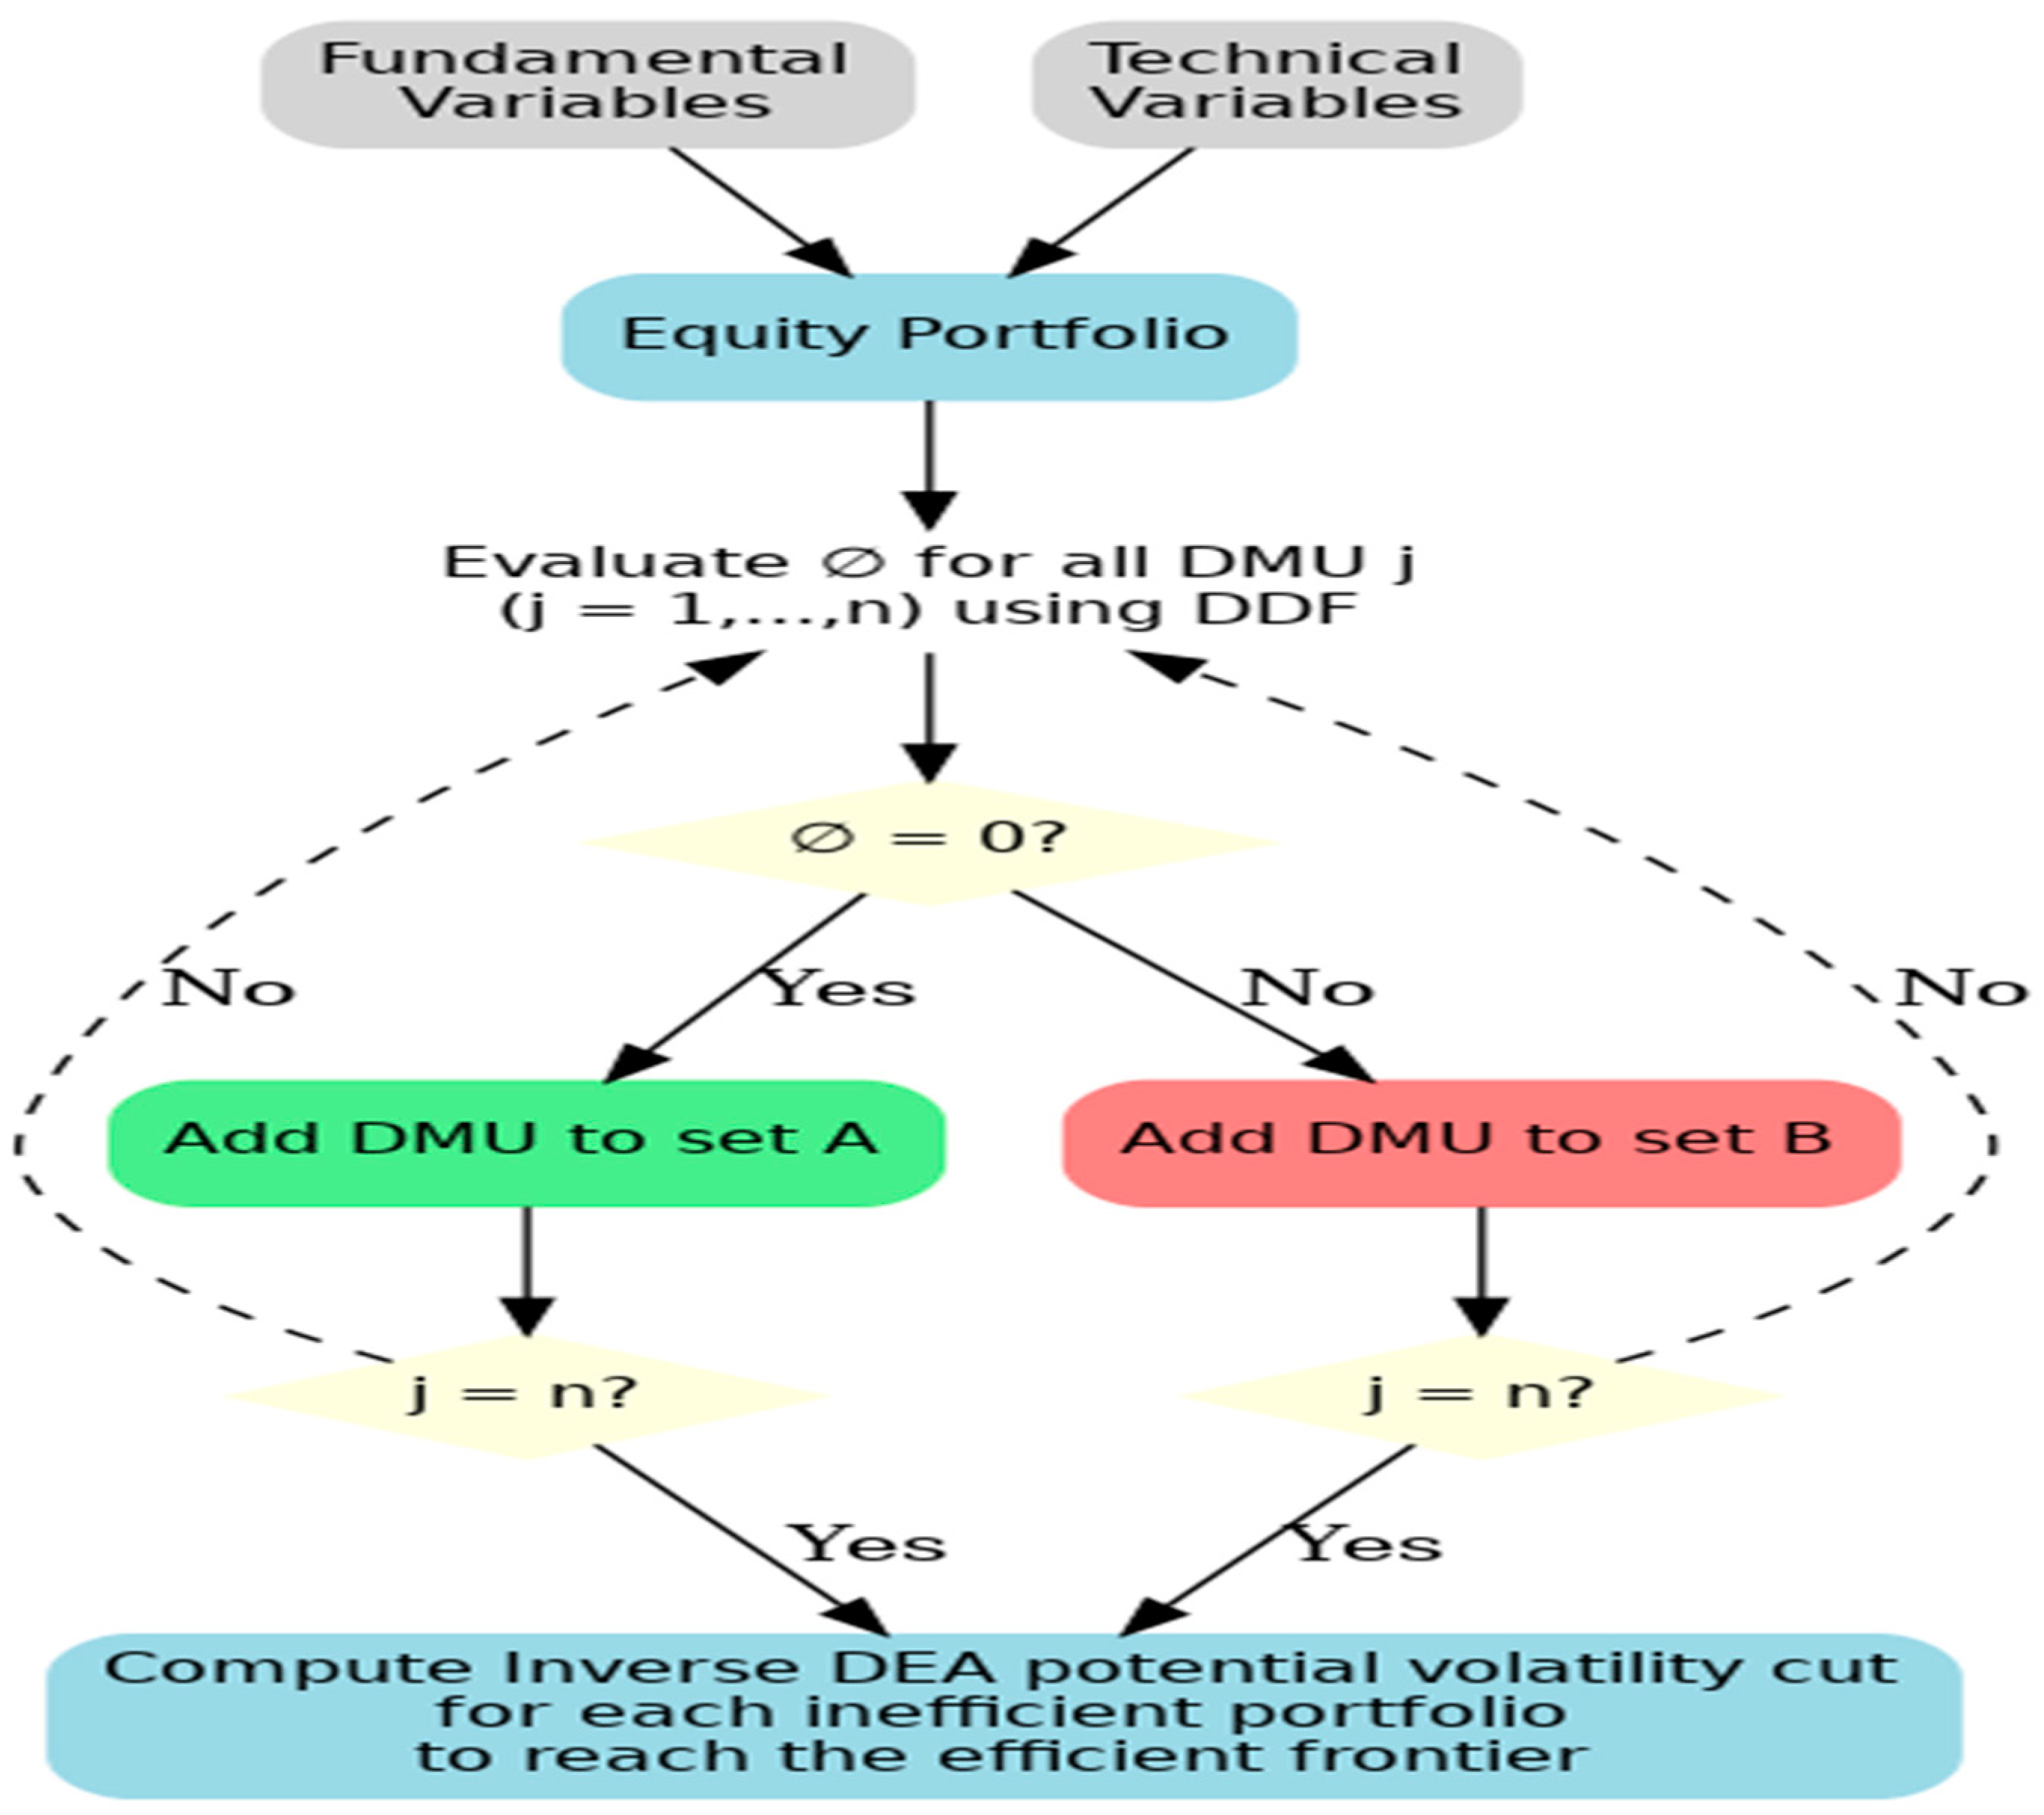
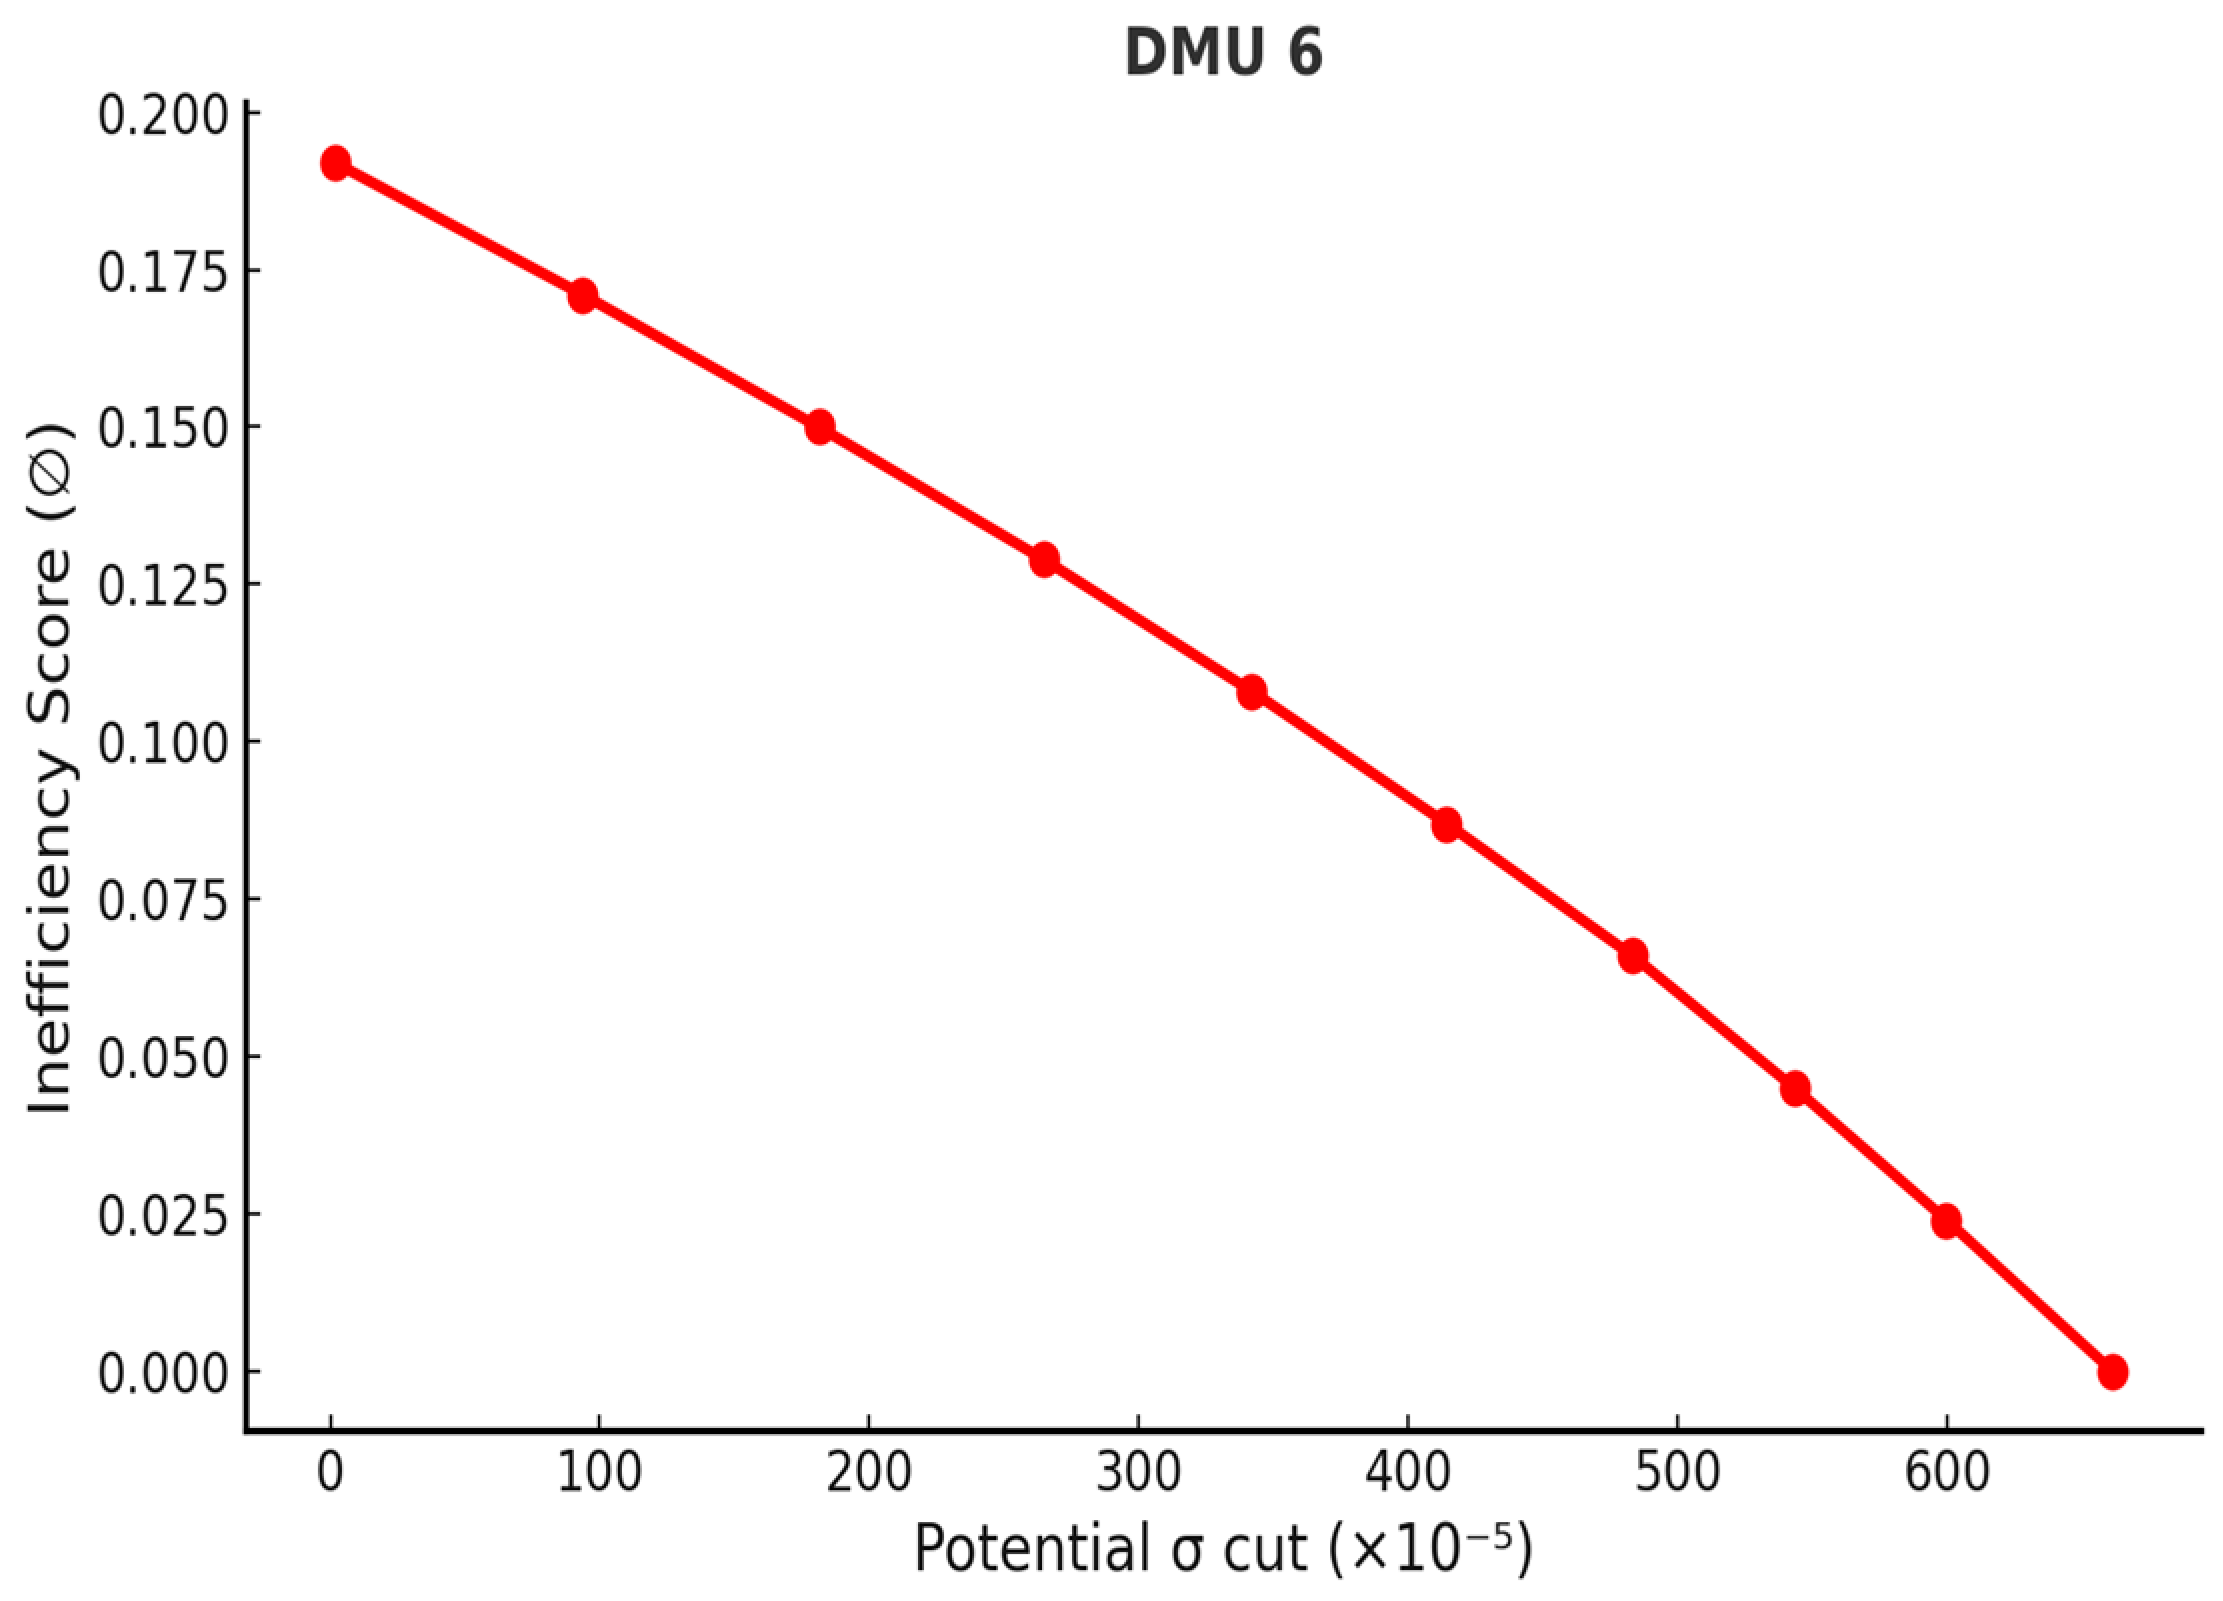
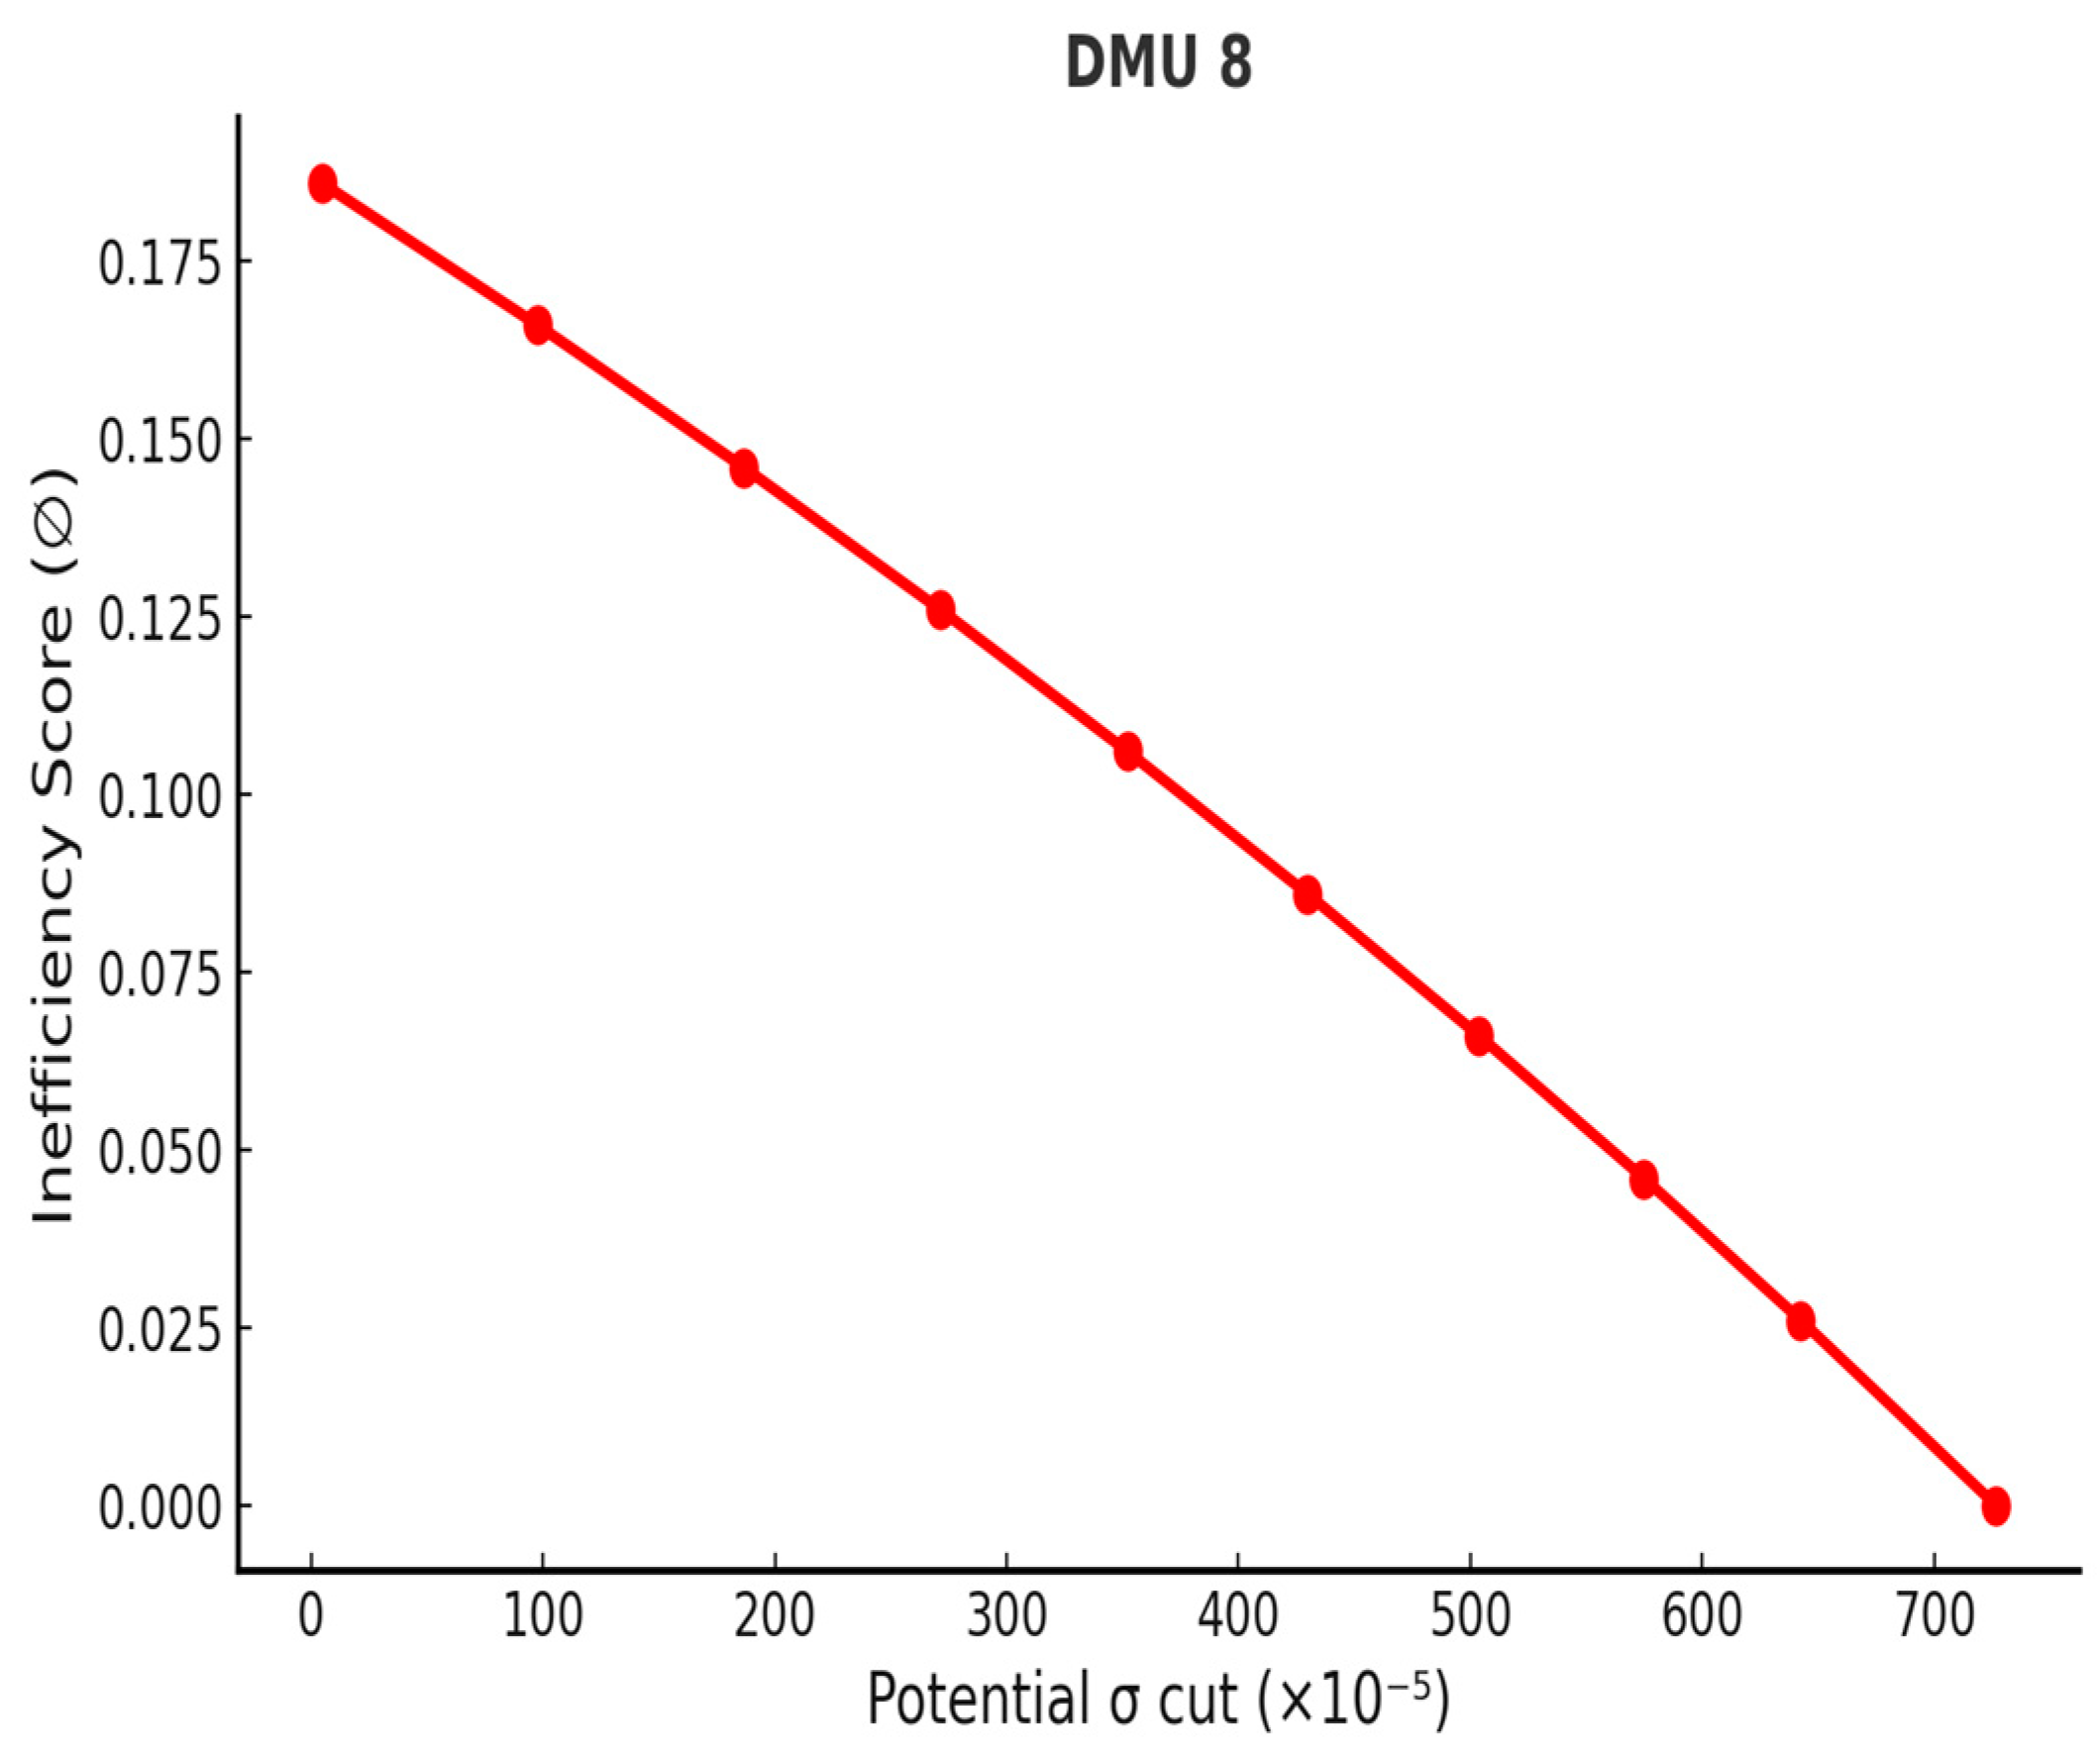
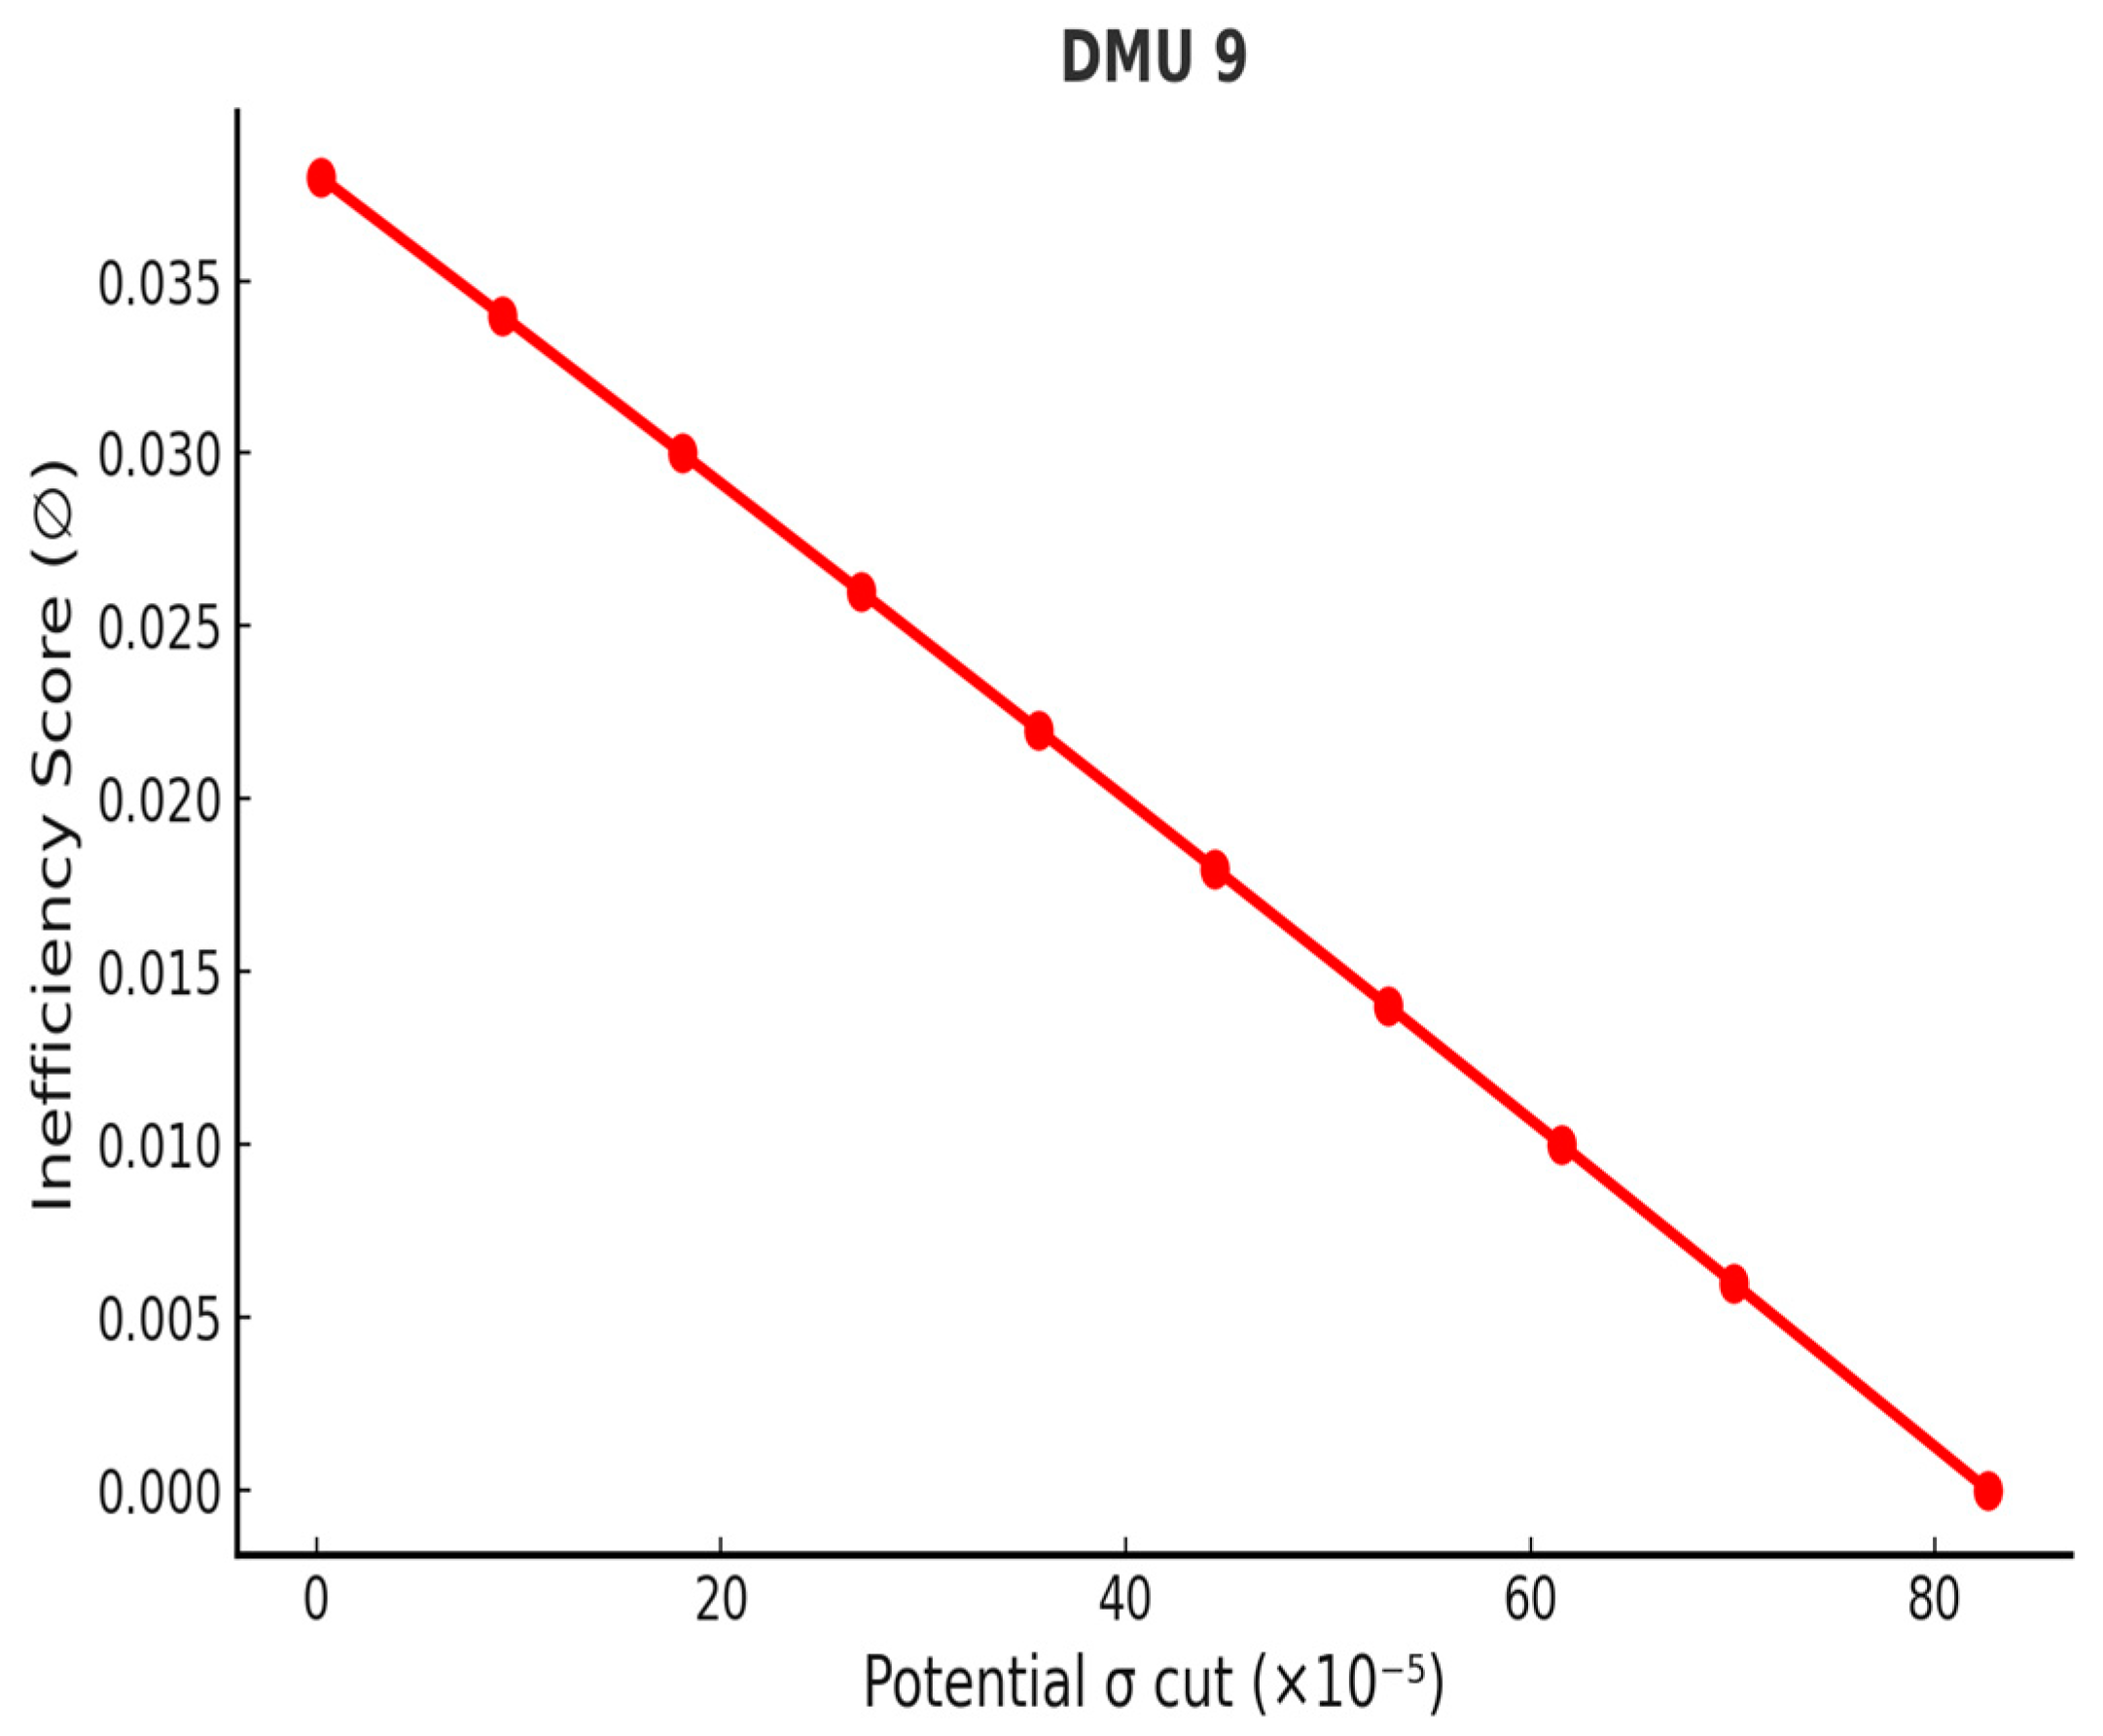
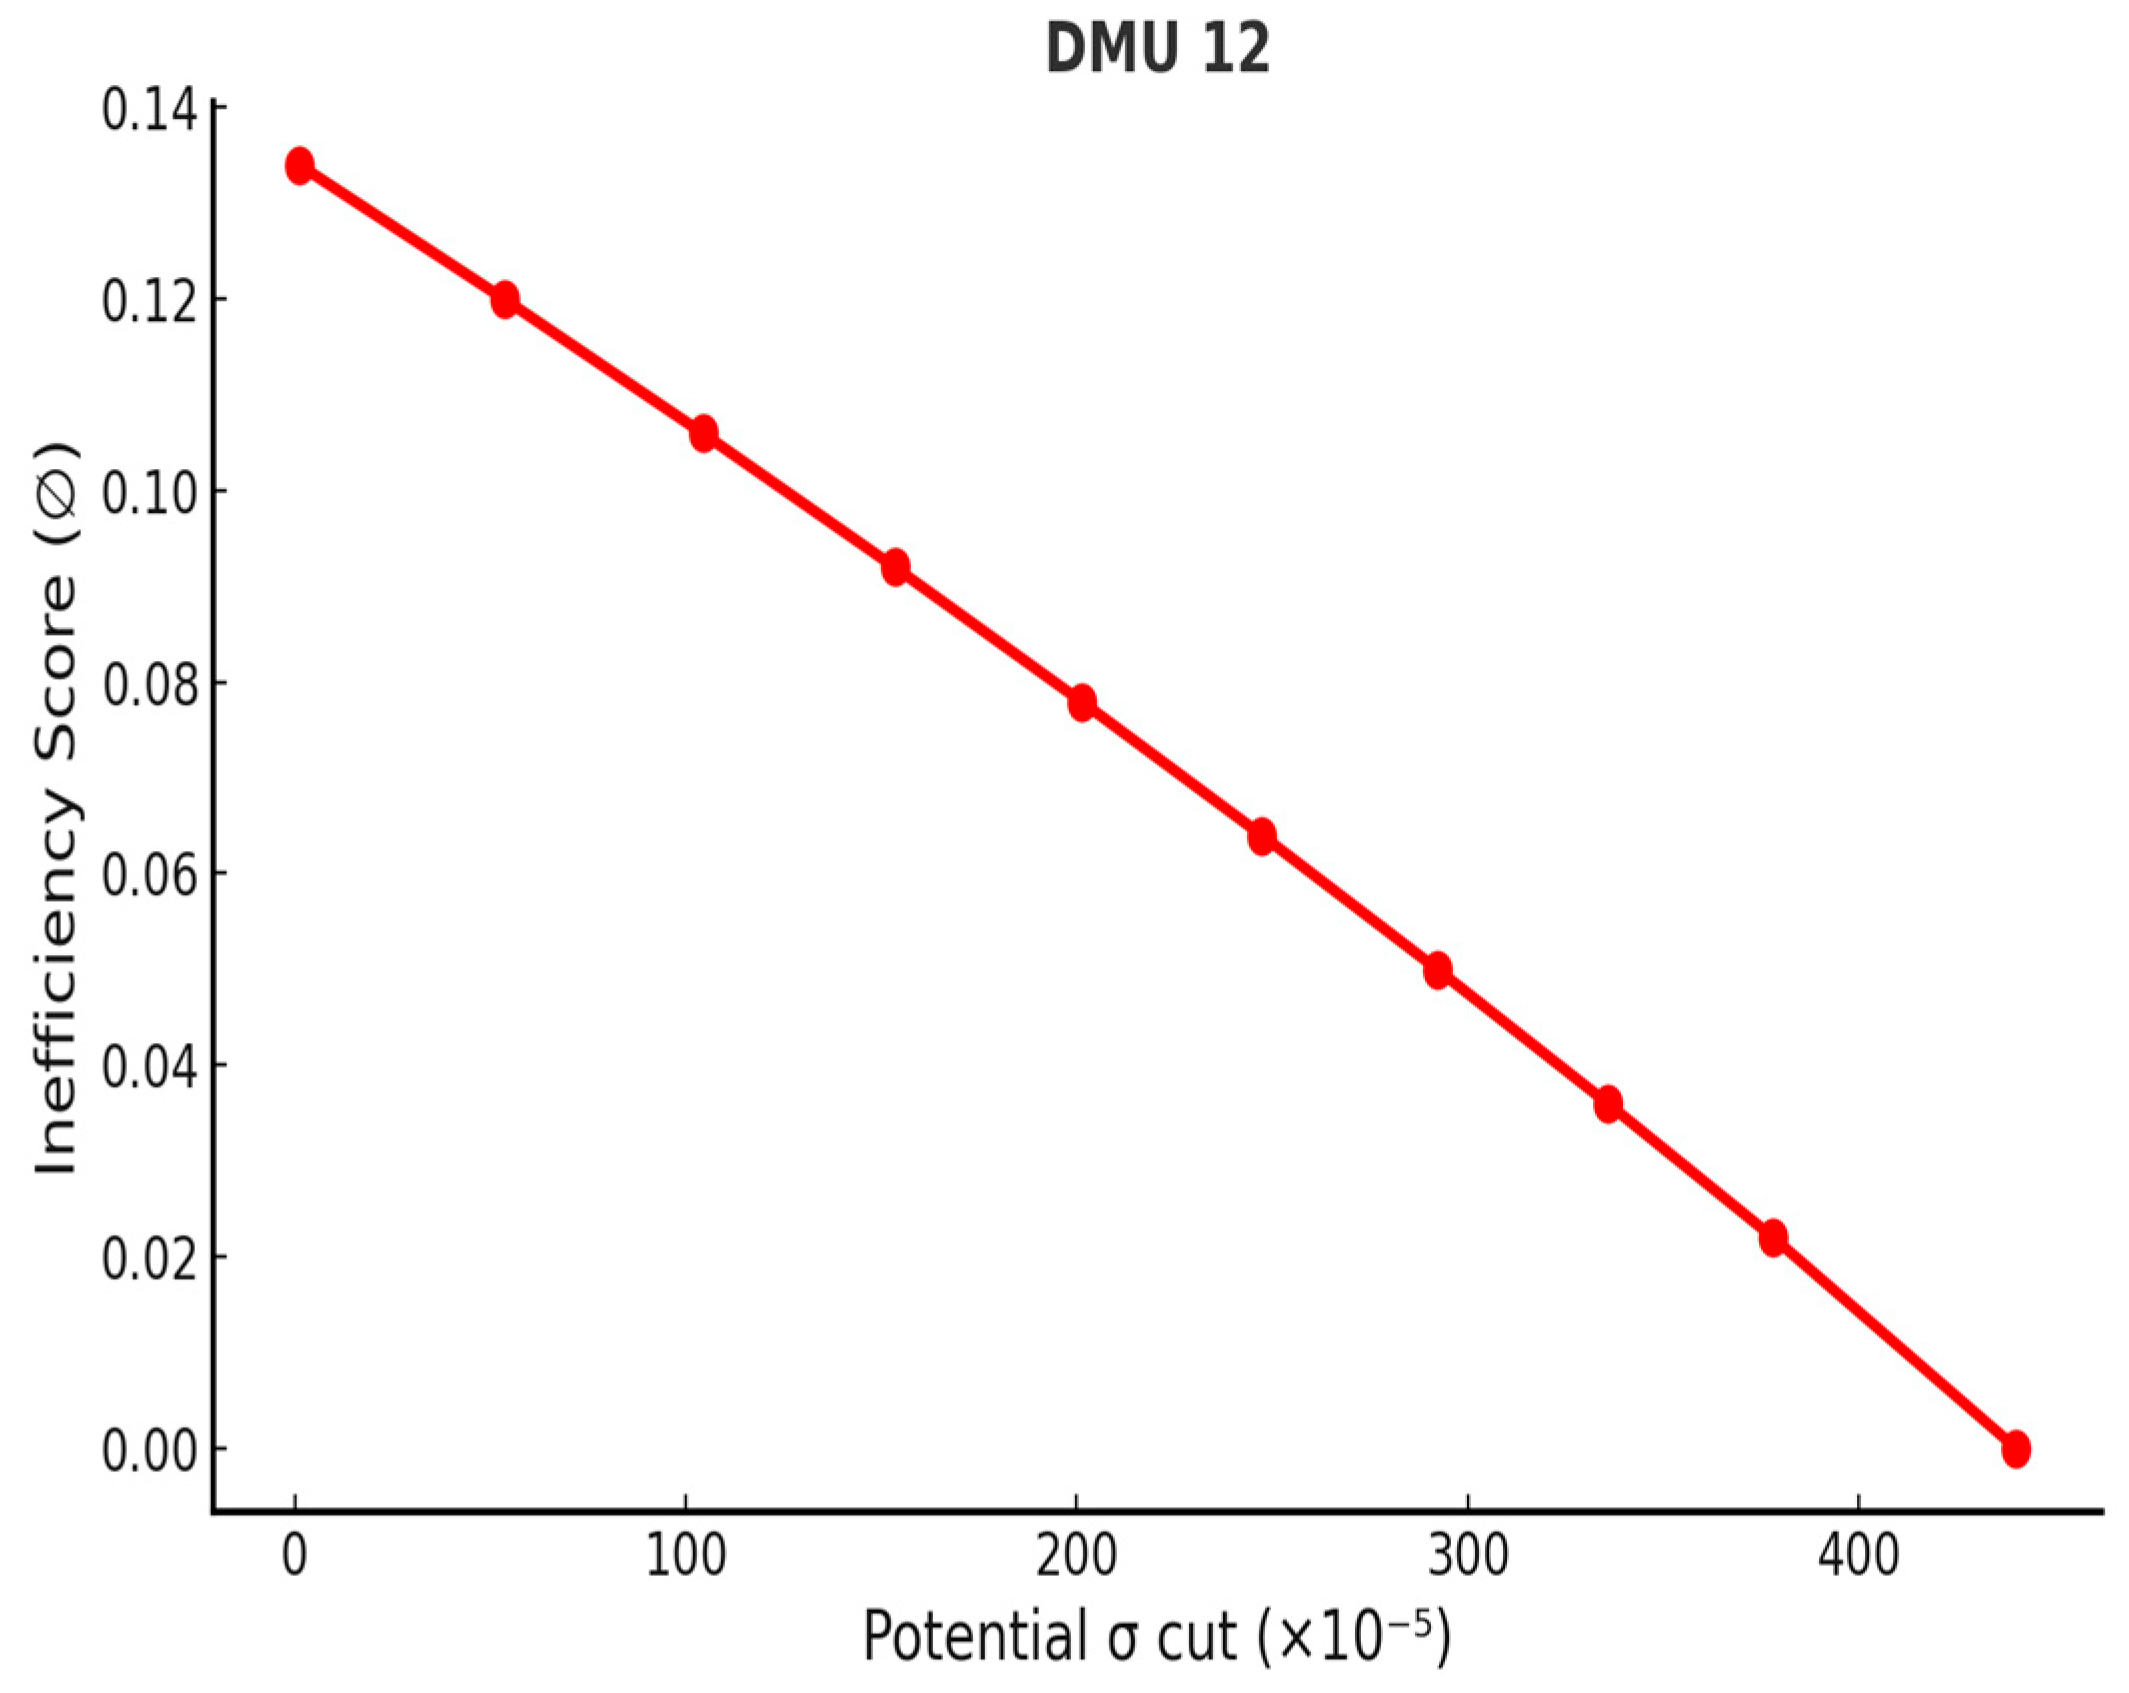
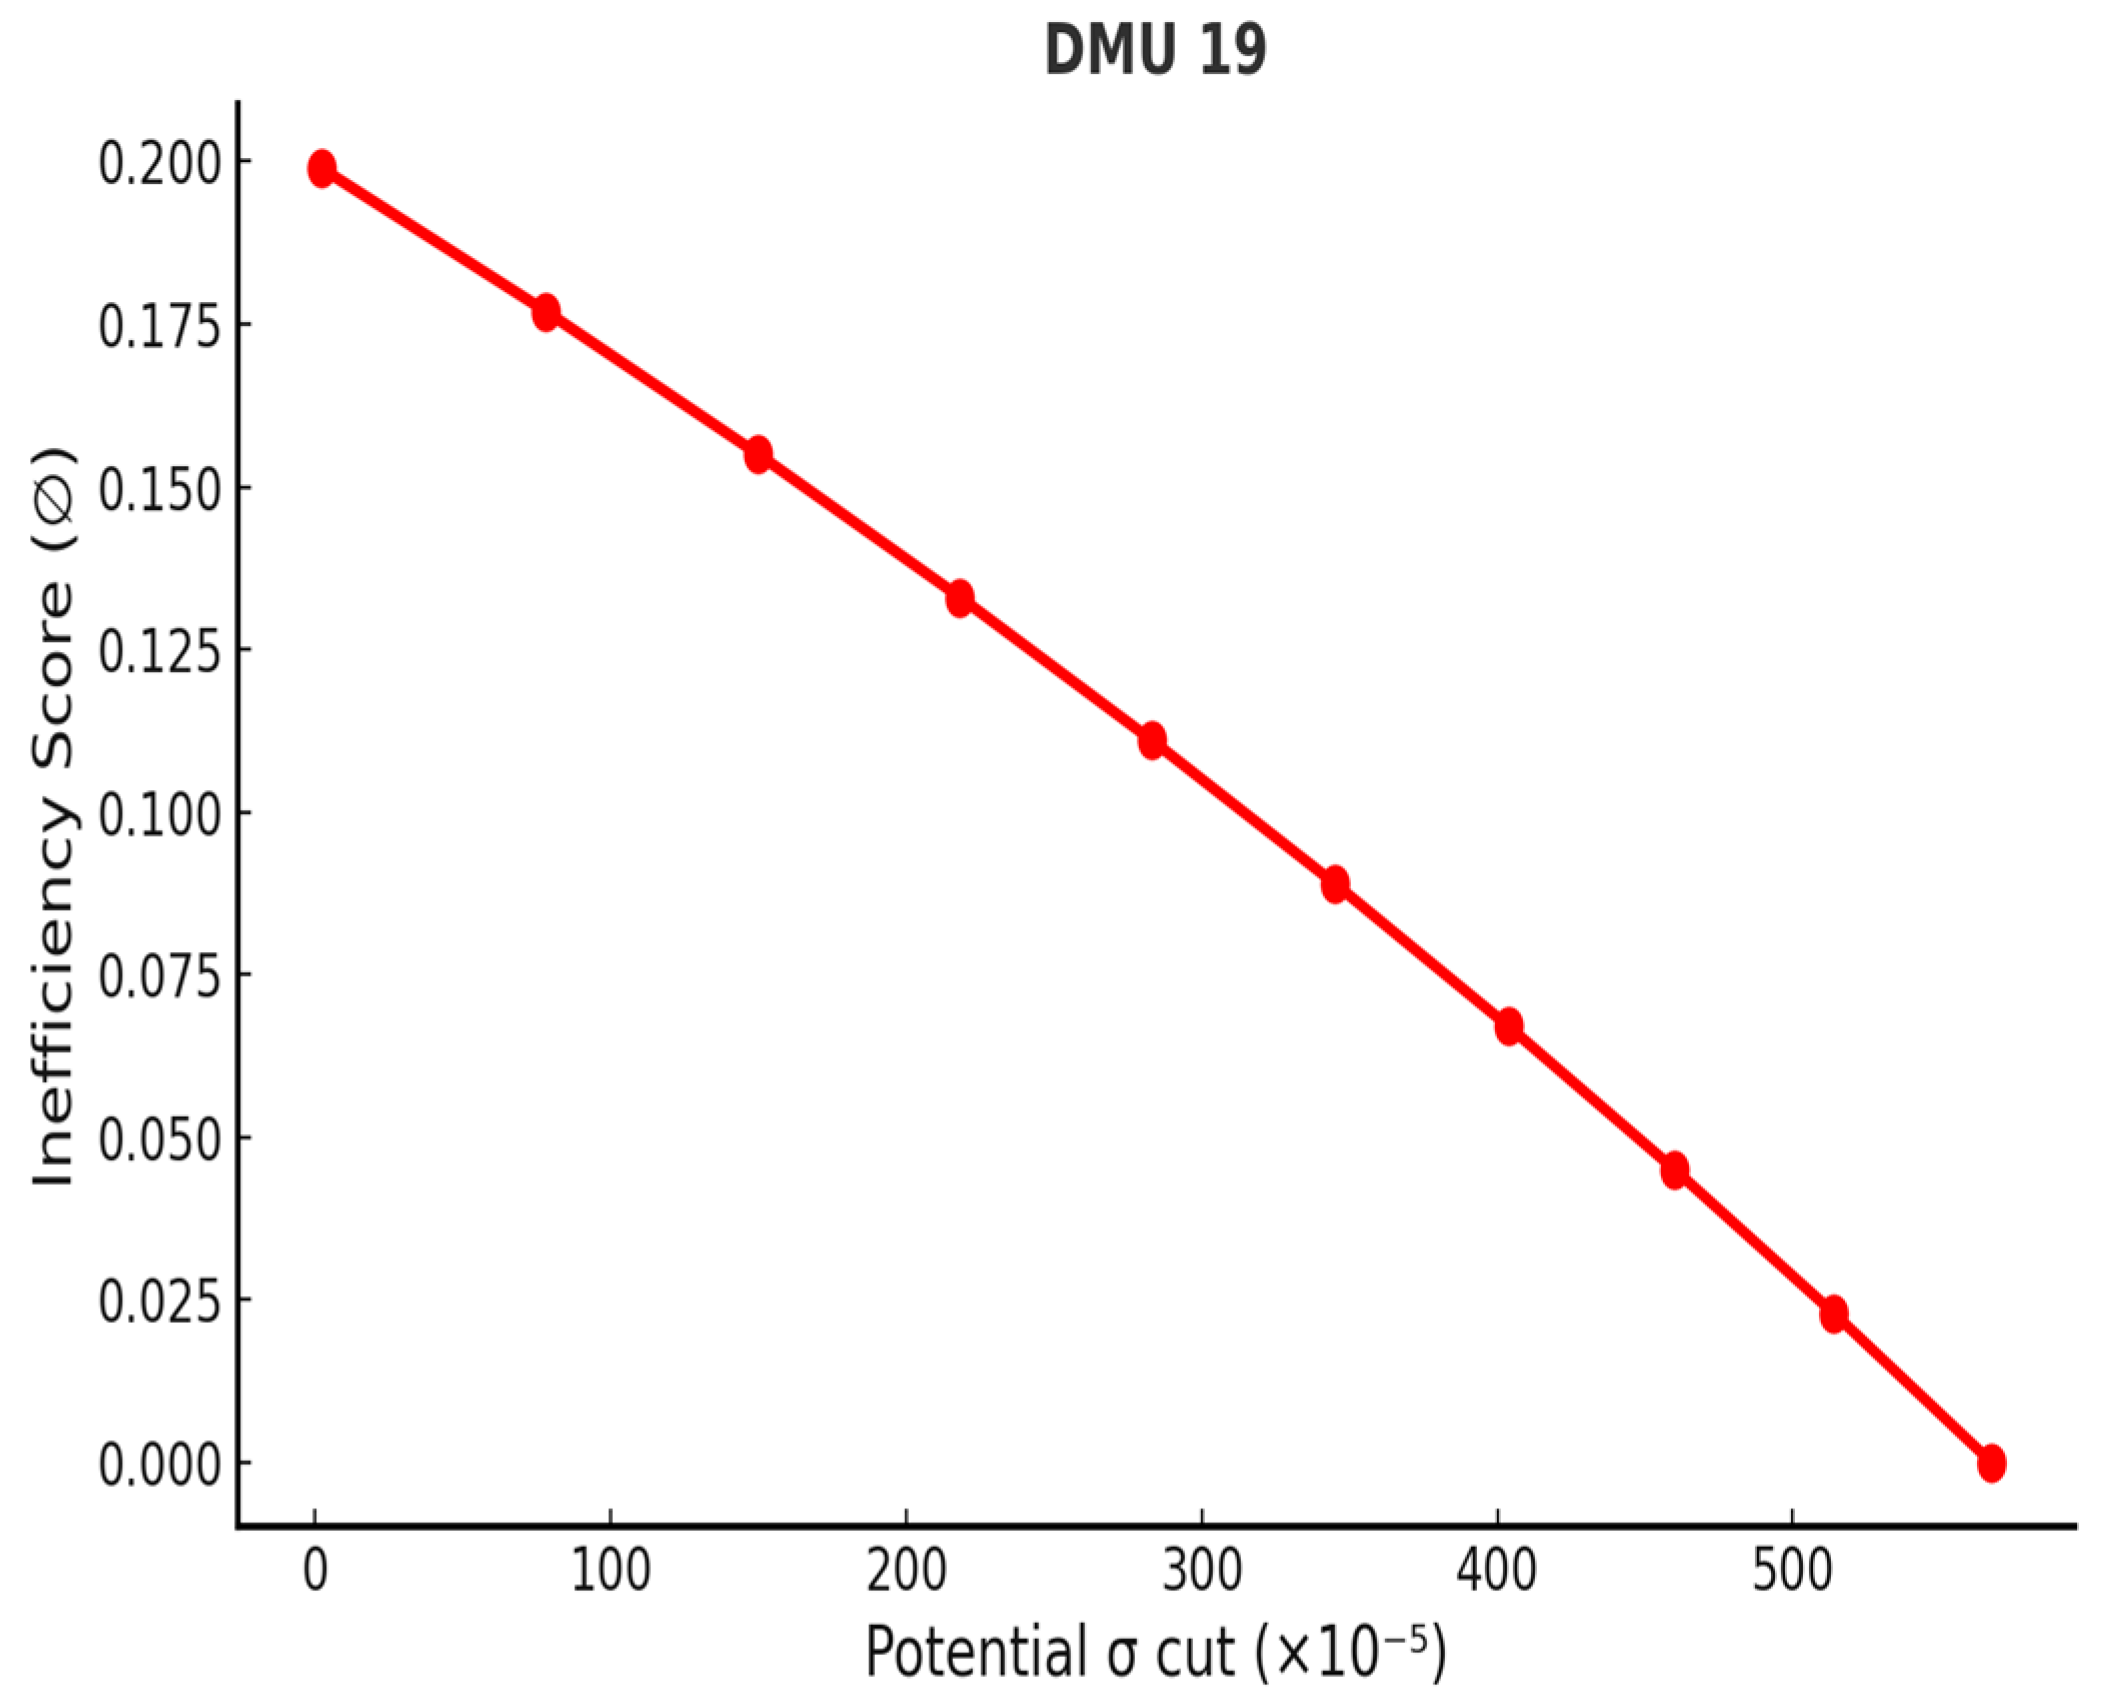
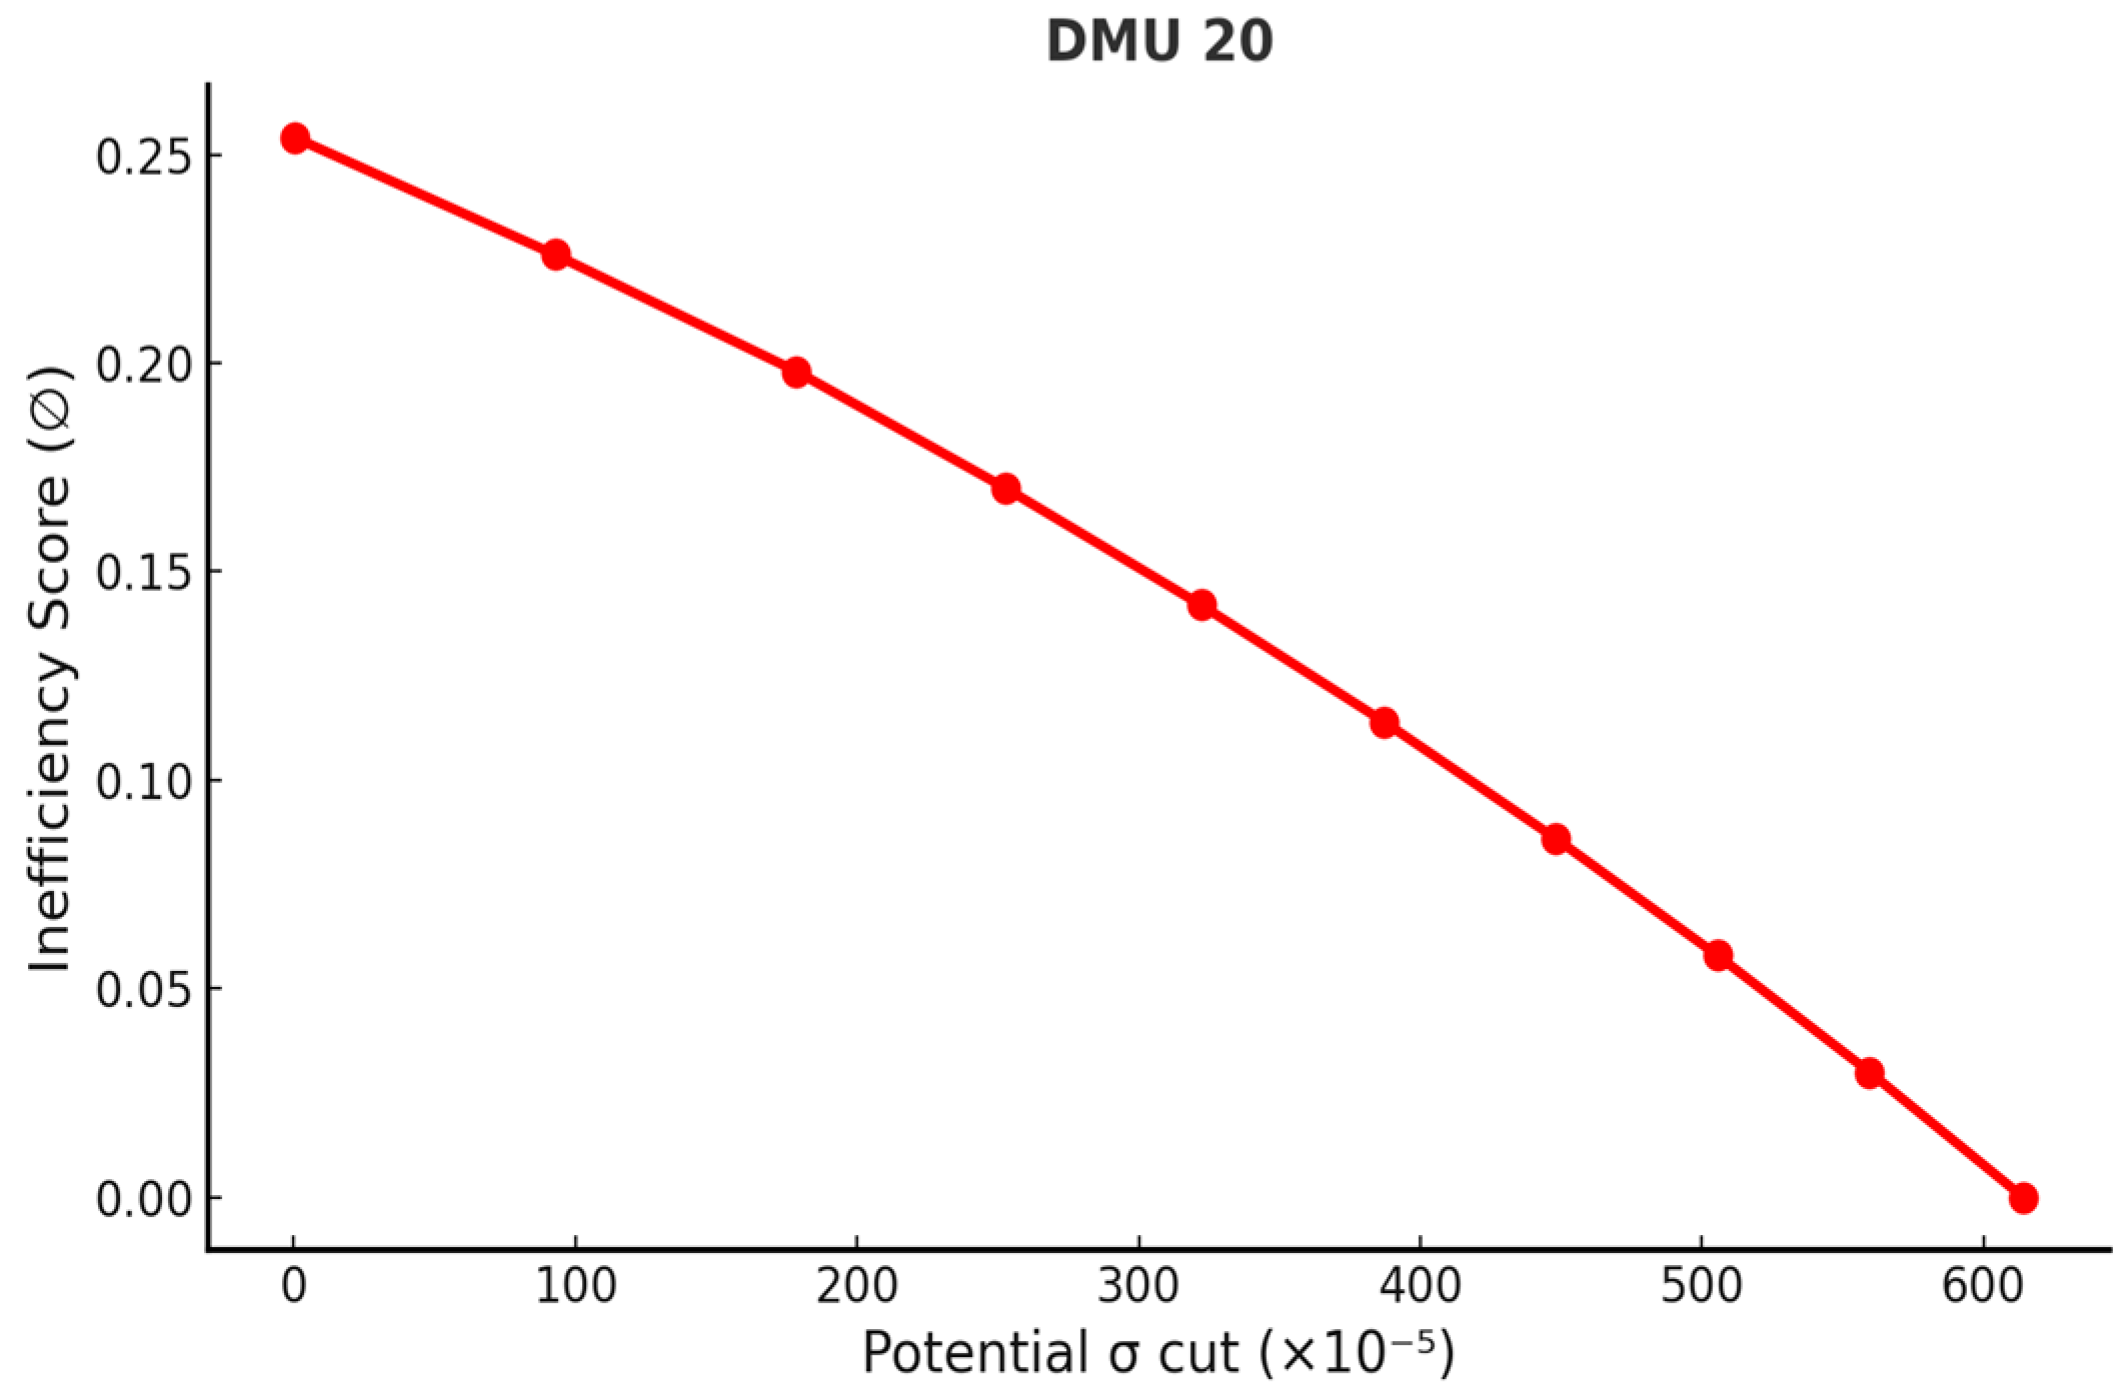
| Author(s) | Method | Application(s) |
|---|---|---|
| Ghiyasi and Zhu (2020) | Inverse DEA under VRS with mixed-sign (negative) data via SORM | Banking |
| Soleimani-Chamkhorami et al. (2020) | Ranks efficient DMUs by required input increments at fixed efficiency | Banking |
| Zeinodin and Ghobadi (2020) | Dynamic Inverse DEA for mergers with inter-temporal carryovers | Banking, M&A |
| Guijarro et al. (2020) | Inverse DEA + genetic algorithms for sector-wide restructuring with global efficiency target and merger cardinality limits. | Banking, higher education |
| Ghobadi (2021) | Inverse DEA for mergers with interval (uncertain) data; estimates inherited inputs/outputs and achievable efficiency bounds. | Banking, M&A |
| Daryani et al. (2021) | Two-stage Inverse DEA with price/cost data | Banking/supply chains |
| Ghomi et al. (2021) | Stochastic Inverse DEA with (weak) Pareto at level α | Banking |
| Amin and Ibn-Boamah (2021) | Two-stage Inverse DEA for bank mergers | Banking, M&A |
| Soltanifar et al. (2023) | Inverse DEA-R handling negative ratios | Banking, M&A |
| Asadi et al. (2023) | Inverse FDH (non-convex) with double frontiers | Banking |
| Ghobadi et al. (2023) | Dynamic Inverse DEA estimating inputs/outputs | Banking, time-dependent planning |
| Amin and Ibn-Boamah (2023) | DEA + Inverse DEA for partnerships; redistributes inputs/outputs; alliances boost competitiveness. | Banking, strategic alliances |
| Gerami et al. (2023) | Generalized Inverse DEA with value efficiency | Banking, mergers/splits |
| Sohrabi et al. (2024) | DEA-R + Inverse DEA-R for alliances | Banking, alliances |
| Ibn-Boamah and Amin (2024) | Inverse DEA for partner selection in mergers | Banking, alliances |
| Ghiyasi (2024) | New Inverse DEA for time substitution | Economic planning |
| Soltanifar et al. (2024) | CSW-Inverse DEA for mergers; analyzes multiple scenarios simultaneously. | Banking |
| Amirteimoori and Allahviranloo (2024) | Statistical Inverse DEA corrector for efficient DMUs | Banking |
| Ghiyasi (2025) | Defines consolidation types (minor/major) using pre/post effects | Banking, M&A |
| Ghiyasi and Zhu (2025) | Parallel Inverse DEA with/without price info | Banking |
| Soltanifar et al. (2025) | Inverse DEA-R for ratio data with negatives | Healthcare, finance |
| Akbarian and Oukil (2025) | Inverse non-radial ERM for ratios | Finance |
| T. O. Kehinde et al. (2025b) | SET–DEA–IDEA for stock ranking | Stock market |
| Variable | CR | AT | SR | R | σ |
|---|---|---|---|---|---|
| count | 20 | 20 | 20 | 20 | 20 |
| mean | 275.7521 | 0.7639 | 44.9438 | 0.2268 | 0.0264 |
| std | 85.4976 | 0.3653 | 8.5394 | 0.1066 | 0.0057 |
| min | 164.6368 | 0.3308 | 32.1940 | 0.0946 | 0.0176 |
| 25% | 215.8115 | 0.5801 | 39.5355 | 0.1354 | 0.0227 |
| 50% | 252.6442 | 0.6721 | 42.4166 | 0.2131 | 0.0259 |
| 75% | 341.4549 | 0.8527 | 52.3626 | 0.2712 | 0.0287 |
| max | 482.6248 | 2.1173 | 58.7947 | 0.4763 | 0.0431 |
| variance | 7309.8323 | 0.1334 | 72.9208 | 0.0114 | 0.0000 |
| DMU | Industry | CR | AT | SR | R | σ | Inefficiency Score (∅) |
|---|---|---|---|---|---|---|---|
| 1 | AU | 165.3803 | 0.5971 | 52.0781 | 0.1398 | 0.02676 | 0.0000 |
| 2 | BM | 482.6248 | 0.5057 | 33.4804 | 0.2457 | 0.03058 | 0.0000 |
| 3 | BU | 226.3188 | 0.3308 | 58.7947 | 0.1223 | 0.02075 | 0.0000 |
| 4 | CH | 285.4622 | 0.6998 | 39.1417 | 0.1431 | 0.02115 | 0.0000 |
| 5 | CI | 342.7023 | 0.7821 | 40.1926 | 0.1954 | 0.02789 | 0.2287 |
| 6 | CP | 218.7953 | 1.0585 | 46.865 | 0.2614 | 0.02693 | 0.1924 |
| 7 | CC | 356.1352 | 0.512 | 38.8936 | 0.297 | 0.04306 | 0.0000 |
| 8 | EC | 247.6624 | 0.7547 | 43.3909 | 0.2474 | 0.02943 | 0.1870 |
| 9 | EP | 192.1785 | 2.1173 | 56.5897 | 0.189 | 0.02169 | 0.0381 |
| 10 | EM | 235.1505 | 0.6158 | 44.8115 | 0.1186 | 0.02369 | 0.0000 |
| 11 | FO | 231.8879 | 0.8621 | 40.3361 | 0.1133 | 0.01764 | 0.0000 |
| 12 | IF | 280.8194 | 0.9726 | 40.648 | 0.2171 | 0.02508 | 0.1344 |
| 13 | IS | 206.8602 | 0.8496 | 48.3002 | 0.314 | 0.02127 | 0.0000 |
| 14 | OE | 257.6259 | 0.6272 | 41.4422 | 0.3795 | 0.03234 | 0.0000 |
| 15 | PL | 414.0608 | 0.632 | 33.5508 | 0.2626 | 0.02422 | 0.0000 |
| 16 | SC | 353.3933 | 0.7707 | 32.194 | 0.4763 | 0.03329 | 0.0000 |
| 17 | ST | 164.6368 | 0.6443 | 58.7457 | 0.4008 | 0.0231 | 0.0000 |
| 18 | TX | 320.1915 | 0.5289 | 39.6668 | 0.209 | 0.02675 | 0.0000 |
| 19 | TO | 192.116 | 0.518 | 56.5375 | 0.1093 | 0.02842 | 0.1995 |
| 20 | TC | 341.0391 | 0.8982 | 53.2159 | 0.0946 | 0.02378 | 0.2541 |
| DMU | Volatility (σ) | Potential σ Cut | Max. σ Cut | Deviation |
|---|---|---|---|---|
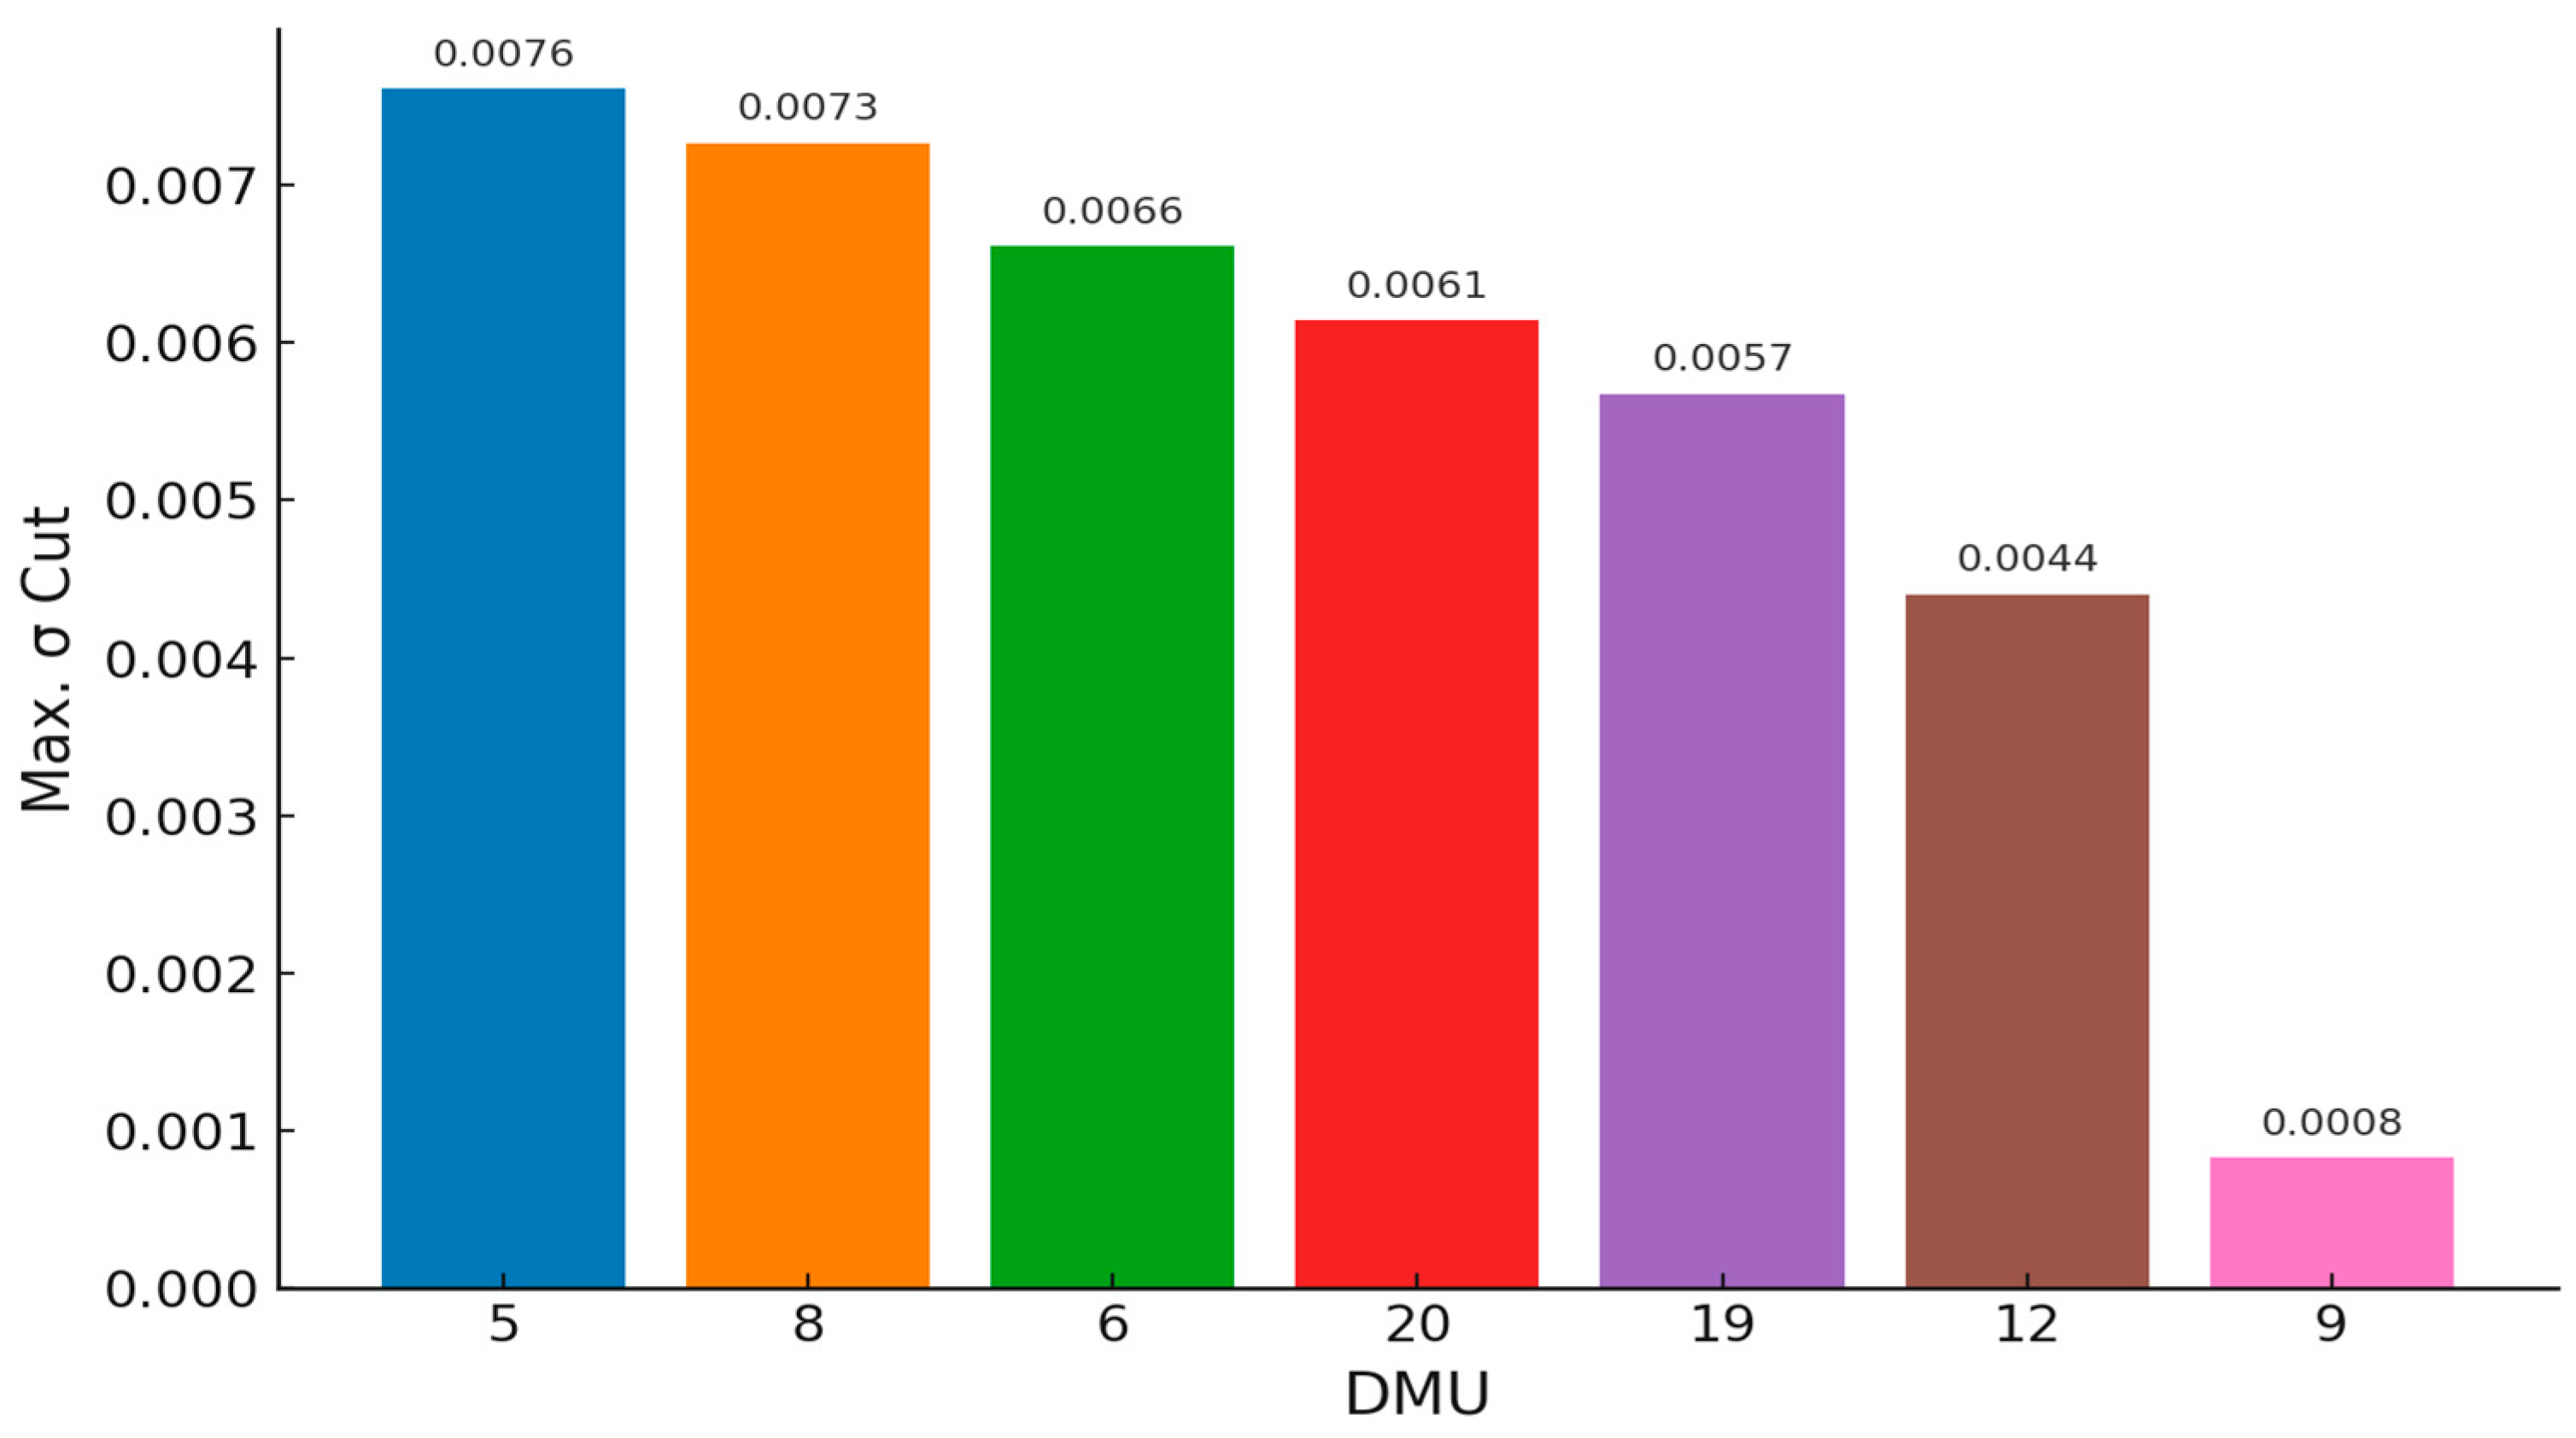
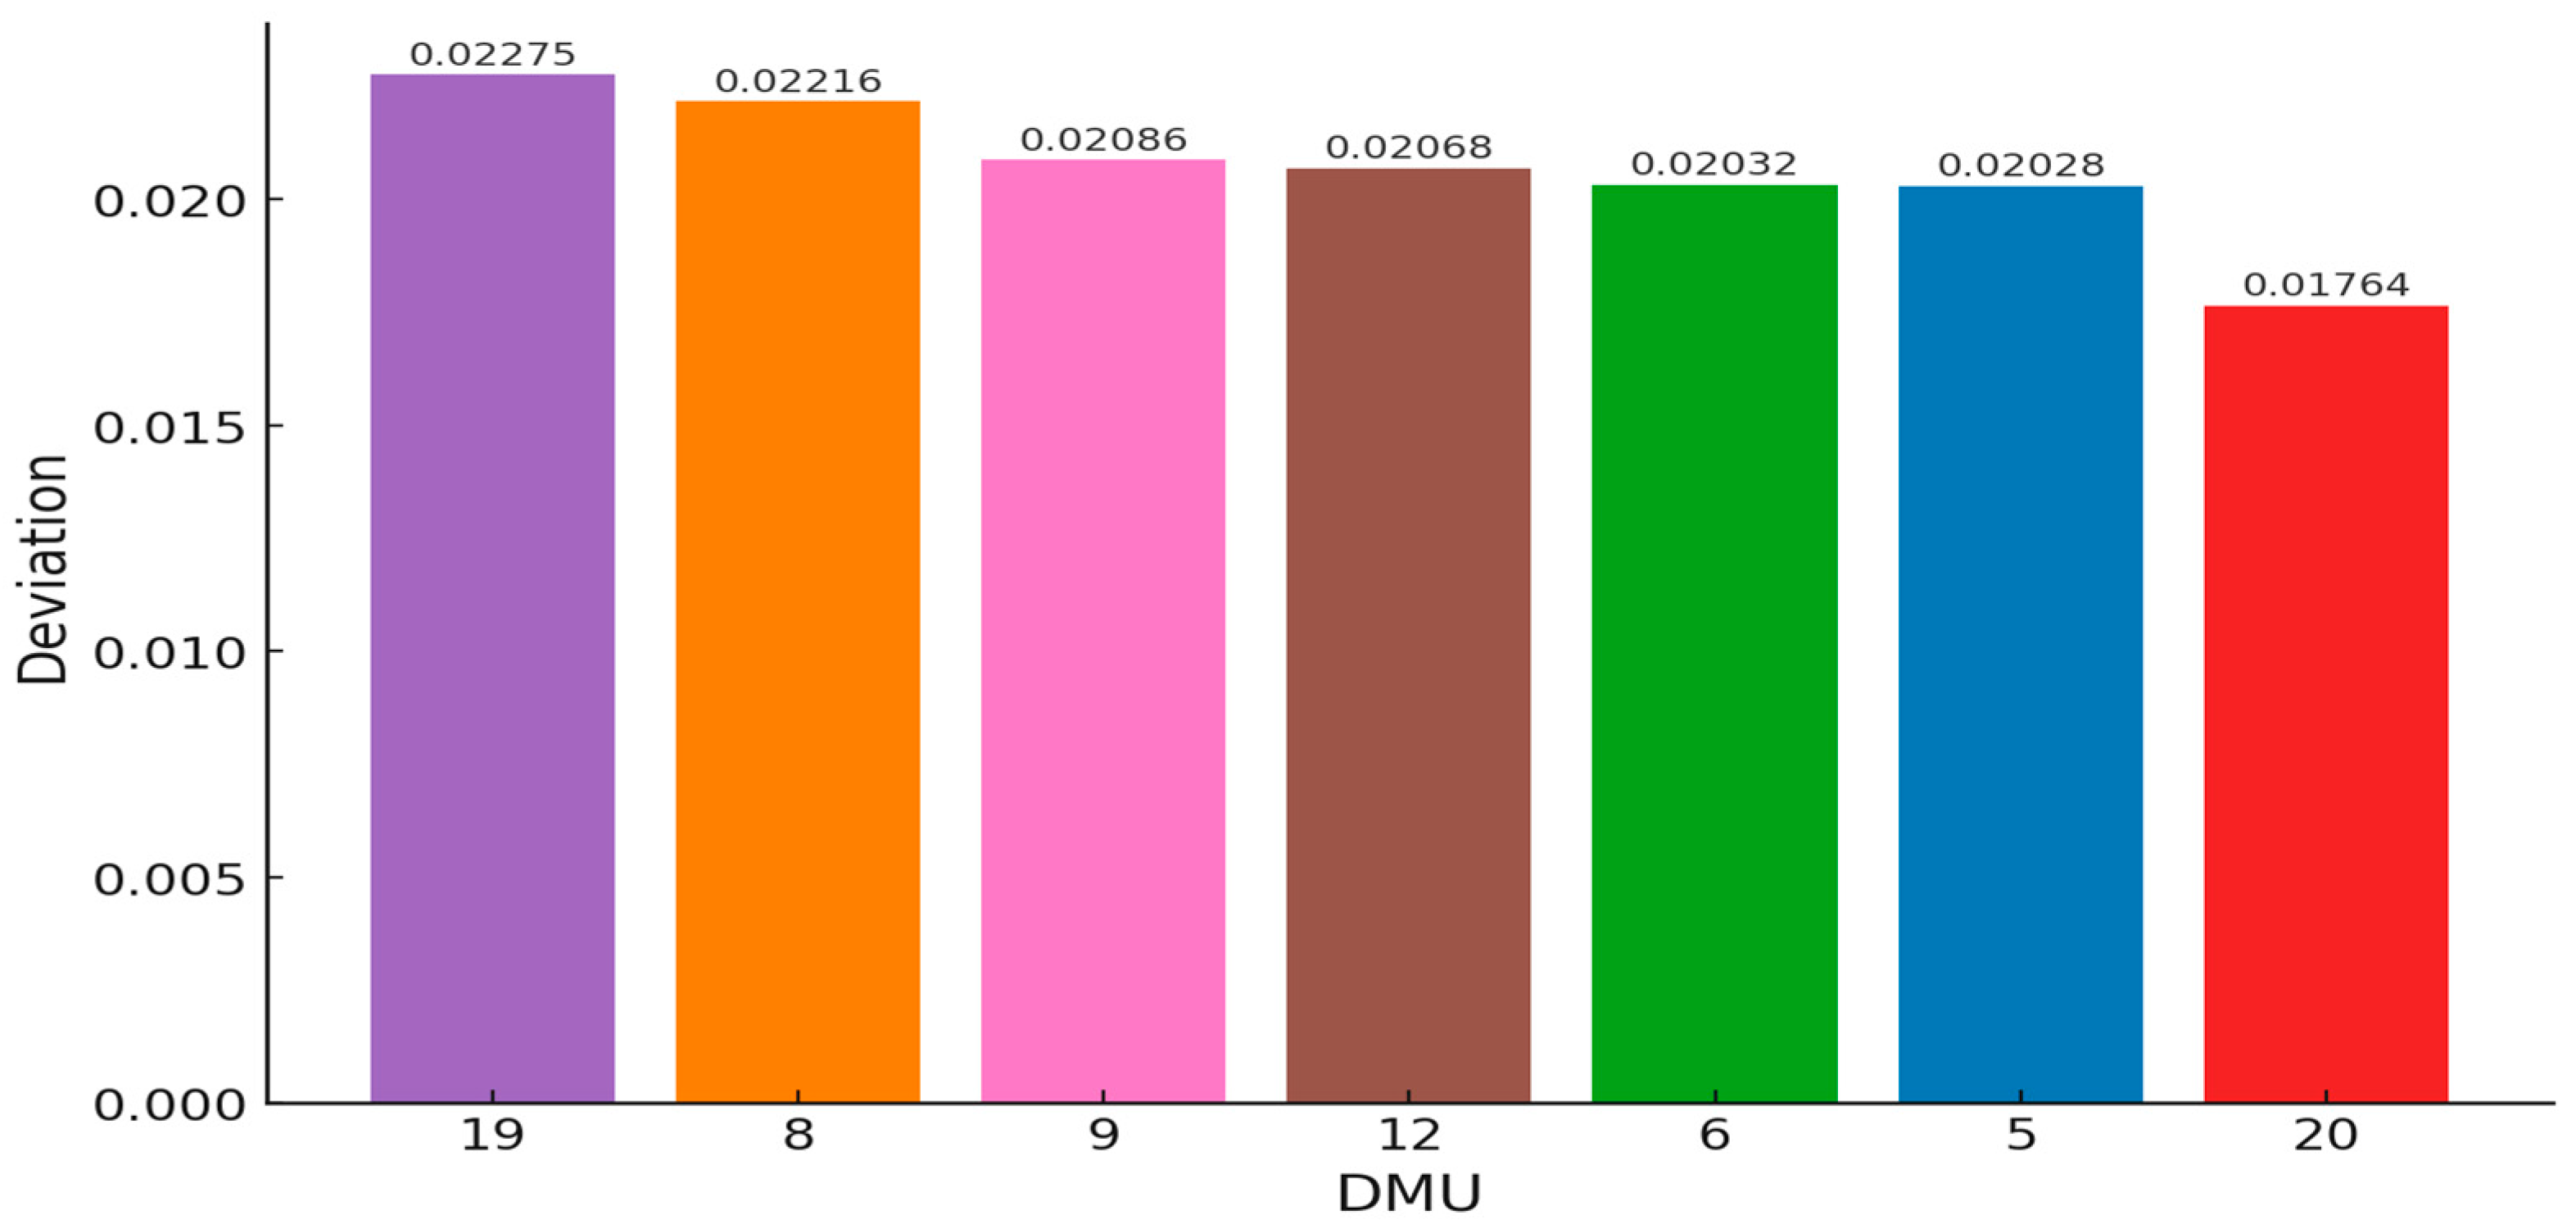
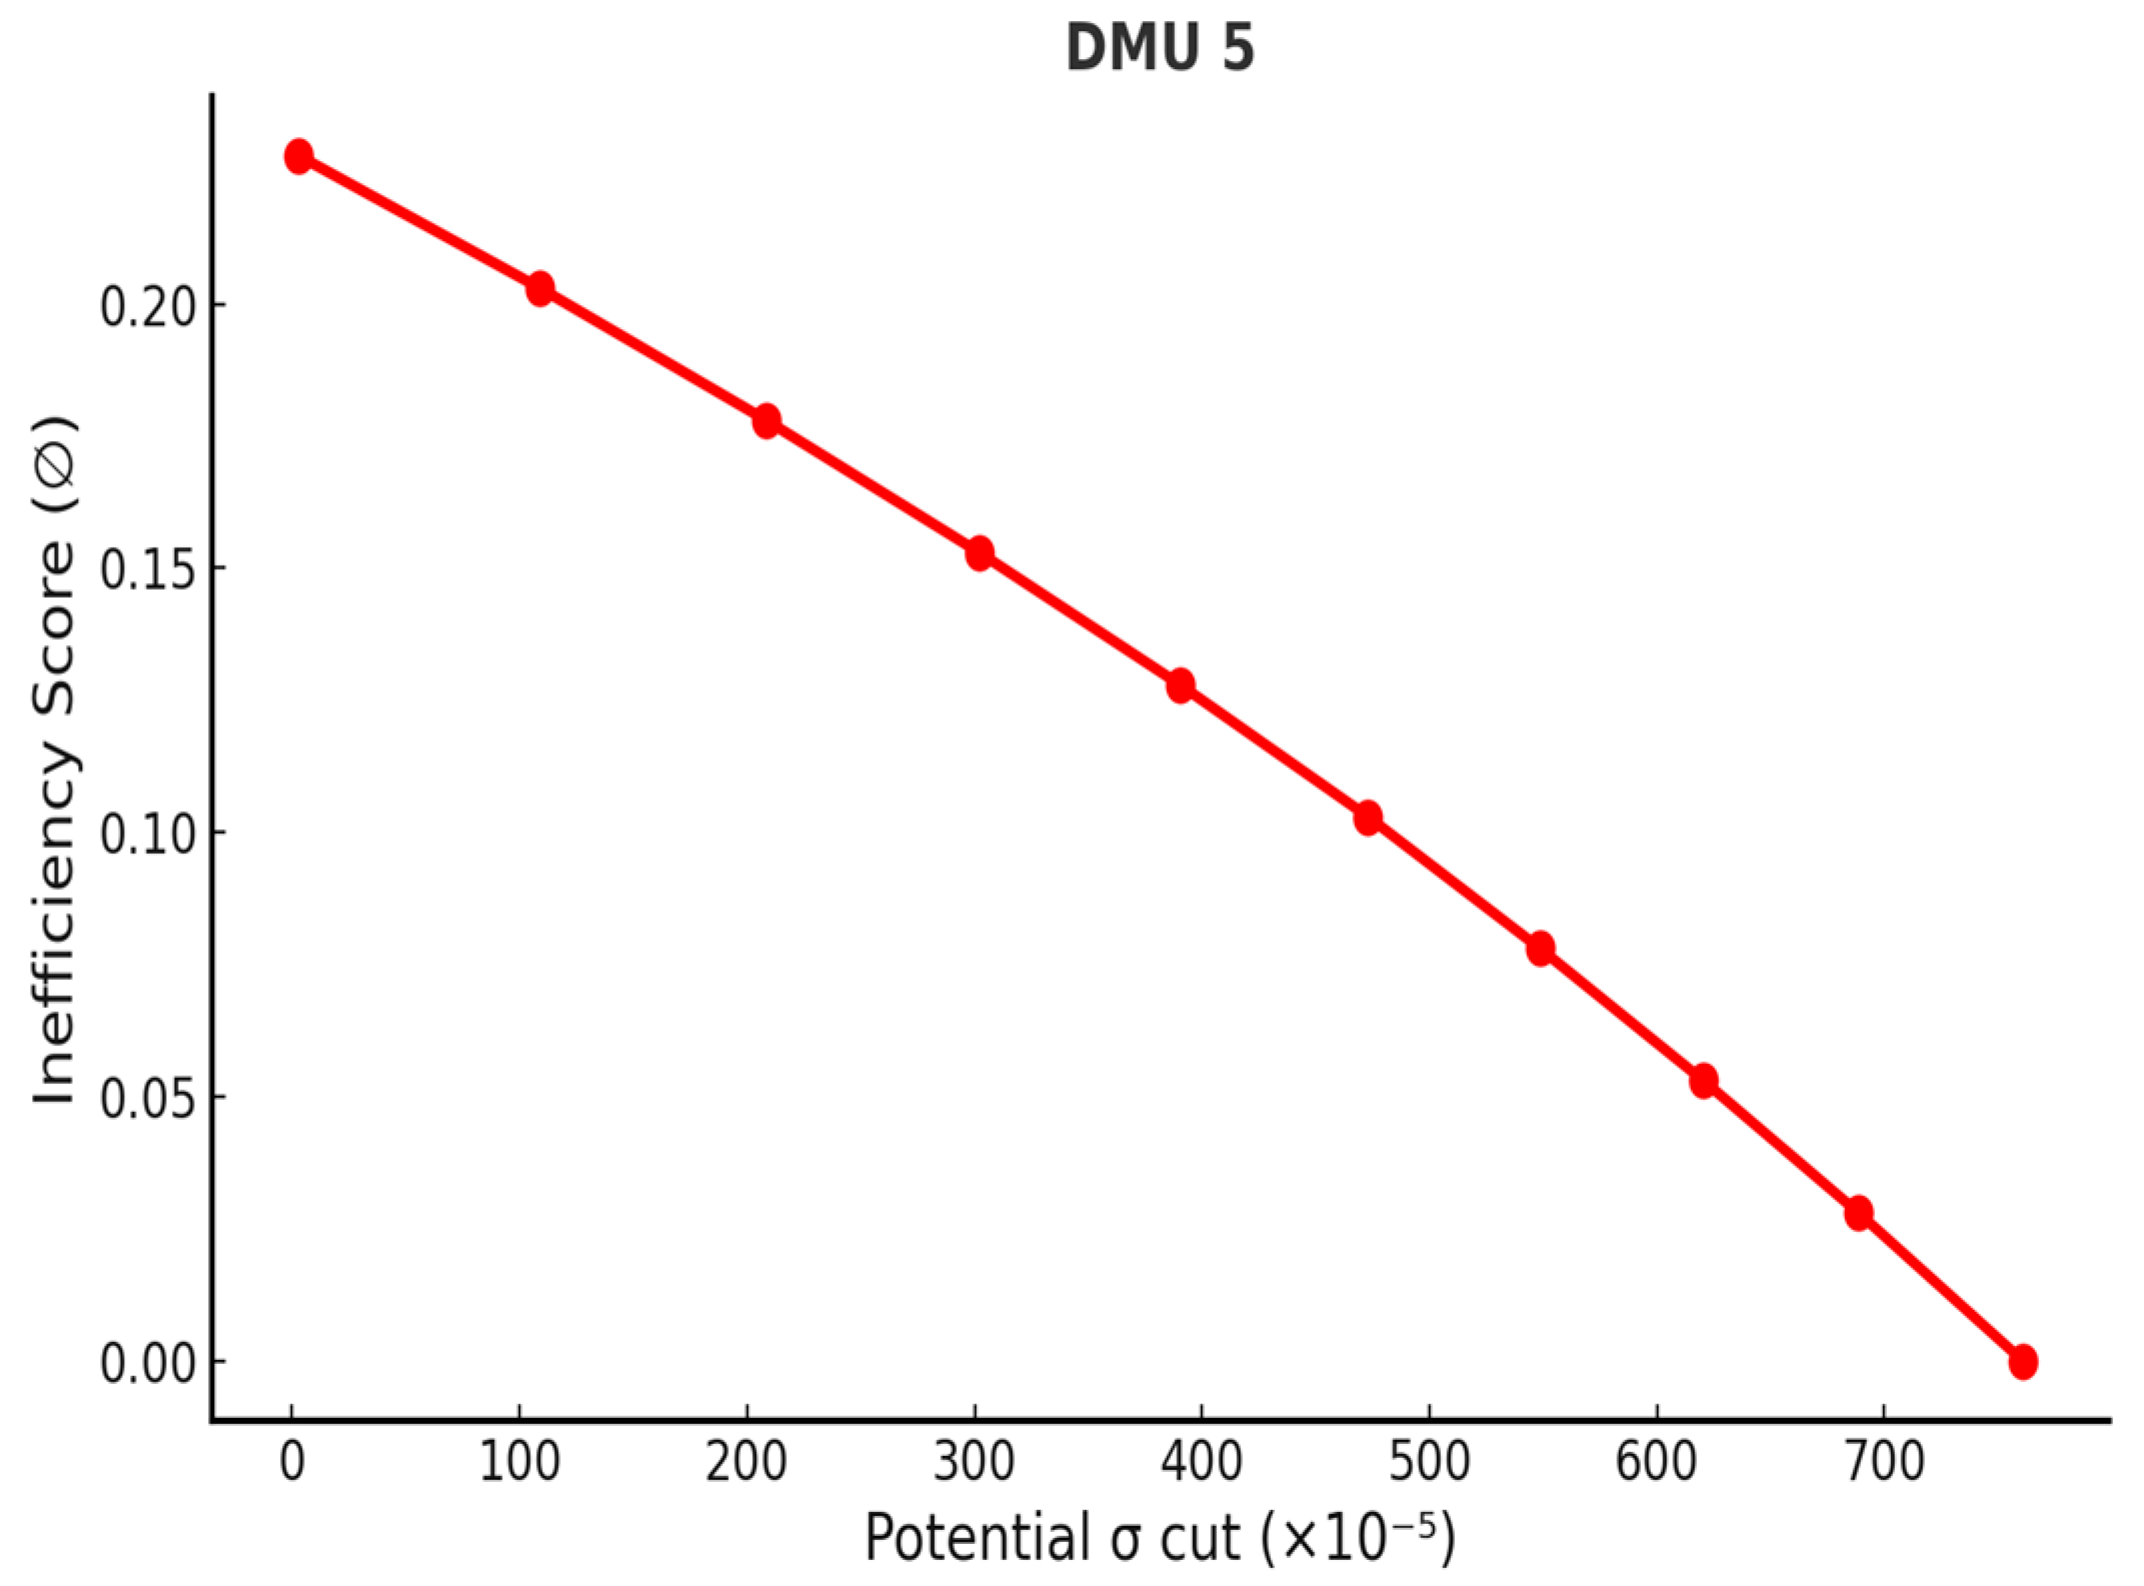
| 5 | 0.02789 | 0.00002911 | 0.007610 | 0.020280 |
| 6 | 0.02693 | 0.00001658 | 0.006612 | 0.020318 |
| 8 | 0.02943 | 0.00004598 | 0.007267 | 0.022163 |
| 9 | 0.02169 | 0.00000192 | 0.000827 | 0.020863 |
| 12 | 0.02508 | 0.00001329 | 0.004401 | 0.020679 |
| 19 | 0.02842 | 0.00001948 | 0.005672 | 0.022748 |
| 20 | 0.02378 | 0.00000470 | 0.006140 | 0.017640 |
| DMU | Industry | CR | AT | SR | R | σ | ∅ |
|---|---|---|---|---|---|---|---|
| 1 | AU | 168.3755 | 0.6913 | 50.4835 | 0.142 | 0.01783 | 0 |
| 2 | BM | 417.2419 | 0.5303 | 34.3005 | 0.0984 | 0.01697 | 0 |
| 3 | BU | 1184.417 | 0.3372 | 56.3809 | 0.2024 | 0.01473 | 0 |
| 4 | CH | 274.6407 | 0.804 | 40.0614 | 0.0906 | 0.01508 | 0.0128 |
| 5 | CI | 301.361 | 0.8369 | 38.2367 | 0.259 | 0.02051 | 0 |
| 6 | CP | 217.2237 | 1.0508 | 45.4901 | 0.2012 | 0.01866 | 0 |
| 7 | CC | 293.0824 | 0.5884 | 39.0496 | 0.1465 | 0.0223 | 0 |
| 8 | EC | 253.0539 | 0.776 | 43.1949 | 0.2583 | 0.0204 | 0 |
| 9 | EP | 227.2874 | 2.0703 | 55.0632 | 0.1593 | 0.01434 | 0 |
| 10 | EM | 232.3705 | 0.666 | 44.11 | 0.0528 | 0.01614 | 0 |
| 11 | FO | 234.6261 | 0.9179 | 41.1532 | 0.0429 | 0.01238 | 0 |
| 12 | IF | 252.4844 | 1.045 | 40.2063 | 0.1656 | 0.01949 | 0 |
| 13 | IS | 215.4966 | 0.9311 | 49.2159 | 0.0246 | 0.01222 | 0 |
| 14 | OE | 261.2601 | 0.639 | 40.3925 | 0.1855 | 0.02202 | 0 |
| 15 | PL | 402.4628 | 0.7144 | 34.8824 | 0.0778 | 0.01328 | 0 |
| 16 | SC | 362.3101 | 0.738 | 31.9894 | 0.3673 | 0.02527 | 0 |
| 17 | ST | 159.5332 | 0.6893 | 59.7275 | 0.0841 | 0.01292 | 0 |
| 18 | TX | 642.5896 | 0.644 | 38.7975 | 0.0488 | 0.0158 | 0.1407 |
| 19 | TO | 185.2172 | 0.929 | 57.9303 | 0.0607 | 0.01918 | 0.3287 |
| 20 | TC | 292.1347 | 1.0156 | 52.2109 | 0.1011 | 0.01401 | 0.0429 |
| DMU | Volatility (σ) | Potential σ Cut | Max. σ Cut | Deviation |
|---|---|---|---|---|
| 4 | 0.01508 | 0.00001389 | 0.000229 | 0.014850 |
| 18 | 0.01580 | 0.00001298 | 0.002223 | 0.013576 |
| 19 | 0.01918 | 0.00002036 | 0.006540 | 0.012639 |
| 20 | 0.01401 | 0.00001475 | 0.000703 | 0.013306 |
| DMU | Industry | CR | AT | SR | R | σ | ∅ |
|---|---|---|---|---|---|---|---|
| 1 | AU | 177.9139 | 0.6776 | 50.2594 | 0.0258 | 0.02254 | 0 |
| 2 | BM | 525.1983 | 0.5025 | 32.6861 | 0.0658 | 0.02256 | 0 |
| 3 | BU | 203.6848 | 0.3448 | 61.1749 | 0.1633 | 0.0193 | 0 |
| 4 | CH | 254.9808 | 0.7858 | 39.8413 | 0.329 | 0.02364 | 0 |
| 5 | CI | 311.3627 | 0.7698 | 41.2931 | 0.1522 | 0.02621 | 0.2576 |
| 6 | CP | 200.7394 | 1.0541 | 48.5383 | 0.2507 | 0.02808 | 0.1468 |
| 7 | CC | 321.86 | 0.465 | 37.6129 | 0.1615 | 0.02669 | 0 |
| 8 | EC | 246.4232 | 0.8213 | 45.7866 | 0.3187 | 0.02805 | 0.1352 |
| 9 | EP | 185.6718 | 2.0538 | 58.1085 | 0.3663 | 0.02339 | 0 |
| 10 | EM | 217.3011 | 0.6791 | 46.3666 | 0.1712 | 0.02239 | 0 |
| 11 | FO | 212.2829 | 0.9143 | 41.1432 | 0.179 | 0.01689 | 0 |
| 12 | IF | 273.7689 | 0.9992 | 40.4905 | 0.2086 | 0.02488 | 0.194 |
| 13 | IS | 197.8907 | 1.0593 | 48.4251 | 0.4512 | 0.03327 | 0 |
| 14 | OE | 251.759 | 0.674 | 42.4803 | 0.3375 | 0.03163 | 0 |
| 15 | PL | 466.9524 | 0.7136 | 32.3364 | 0.1407 | 0.02322 | 0 |
| 16 | SC | 476.8166 | 0.7918 | 32.5843 | 0.5588 | 0.03536 | 0 |
| 17 | ST | 225.4054 | 0.7786 | 51.1514 | 0.7475 | 0.03894 | 0 |
| 18 | TX | 317.0738 | 0.6258 | 42.8383 | 0.1947 | 0.02608 | 0.1495 |
| 19 | TO | 212.6319 | 0.4033 | 54.5226 | 0.1065 | 0.02305 | 0 |
| 20 | TC | 355.664 | 0.918 | 53.3811 | 0.0751 | 0.02093 | 0.193 |
| DMU | Volatility (σ) | Potential σ Cut | Max. σ Cut | Deviation |
|---|---|---|---|---|
| 5 | 0.02621 | 0.00002533 | 0.007864 | 0.018346 |
| 6 | 0.02808 | 0.00003653 | 0.005964 | 0.022116 |
| 8 | 0.02805 | 0.00000710 | 0.005427 | 0.022623 |
| 12 | 0.02488 | 0.00004005 | 0.006554 | 0.018326 |
| 18 | 0.02608 | 0.00002005 | 0.004745 | 0.021335 |
| 20 | 0.02093 | 0.00002653 | 0.00404 | 0.016890 |
| Year | Inefficient DMUs | ∅ Range | Max. σ Cut Range |
|---|---|---|---|
| 2019 | 4/20 | 0.0128–0.3287 | 0.000229–0.006540 |
| 2020 | 7/20 | 0.0381–0.2541 | 0.000827–0.007610 |
| 2021 | 6/20 | 0.1352–0.2576 | 0.004040–0.007864 |
| DMU | Initial σ | Final σ | Initial ∅ | Final ∅ |
|---|---|---|---|---|
| 5 | 0.02789 | 0.020280 | 0.2287 | 0 |
| 6 | 0.02693 | 0.020318 | 0.1924 | 0 |
| 8 | 0.02943 | 0.022163 | 0.1870 | 0 |
| 9 | 0.02169 | 0.020863 | 0.0381 | 0 |
| 12 | 0.02508 | 0.020679 | 0.1344 | 0 |
| 19 | 0.02842 | 0.022748 | 0.1995 | 0 |
| 20 | 0.02378 | 0.017640 | 0.2541 | 0 |
Disclaimer/Publisher’s Note: The statements, opinions and data contained in all publications are solely those of the individual author(s) and contributor(s) and not of MDPI and/or the editor(s). MDPI and/or the editor(s) disclaim responsibility for any injury to people or property resulting from any ideas, methods, instructions or products referred to in the content. |
© 2025 by the authors. Licensee MDPI, Basel, Switzerland. This article is an open access article distributed under the terms and conditions of the Creative Commons Attribution (CC BY) license (https://creativecommons.org/licenses/by/4.0/).
Share and Cite
Kehinde, T.O.; Chung, S.-H.; Olanrewaju, O.A. Inverse DEA for Portfolio Volatility Targeting: Industry Evidence from Taiwan Stock Exchange. Int. J. Financial Stud. 2025, 13, 192. https://doi.org/10.3390/ijfs13040192
Kehinde TO, Chung S-H, Olanrewaju OA. Inverse DEA for Portfolio Volatility Targeting: Industry Evidence from Taiwan Stock Exchange. International Journal of Financial Studies. 2025; 13(4):192. https://doi.org/10.3390/ijfs13040192
Chicago/Turabian StyleKehinde, Temitope Olubanjo, Sai-Ho Chung, and Oludolapo Akanni Olanrewaju. 2025. "Inverse DEA for Portfolio Volatility Targeting: Industry Evidence from Taiwan Stock Exchange" International Journal of Financial Studies 13, no. 4: 192. https://doi.org/10.3390/ijfs13040192
APA StyleKehinde, T. O., Chung, S.-H., & Olanrewaju, O. A. (2025). Inverse DEA for Portfolio Volatility Targeting: Industry Evidence from Taiwan Stock Exchange. International Journal of Financial Studies, 13(4), 192. https://doi.org/10.3390/ijfs13040192


_Chung.png)


