Abstract
Climate risk, as a significant factor affecting human sustainable development, has emerged as a focal topic of concern for governments and all sectors of society. Using a dataset from China’s Shanghai and Shenzhen A-share markets spanning 2007 to 2019, this study empirically examines how climate risk influences corporate financialization. The empirical results show that heightened climate risk significantly reduces the level of corporate financialization, a finding that remains robust across multiple tests. Further heterogeneity analyses indicate that the suppressive effect of climate risk is particularly evident among state-owned enterprises, firms operating in intensely competitive industries, and those located in regions subject to more stringent environmental policies. Mechanism analysis suggests that climate risk inhibits corporate financialization primarily by intensifying firms’ financing constraints while simultaneously stimulating their innovation capacity. These findings imply that corporate financialization in China is largely driven by profit-maximizing behaviors rooted in “investment substitution” and “real-sector intermediation” motives. Collectively, this research enhances understanding of the channels through which climate risk impacts corporate financial behavior and offers valuable empirical insights for policymakers aiming to optimize climate regulations and redirect financial resources toward productive real-sector activities.
1. Introduction
In recent years, natural disasters triggered by climate risks such as extreme weather, glacial melting, and sea-level rise have caused severe damage to human lives and property. As a result, climate risk has emerged as a major concern for governments and societies worldwide. The World Economic Forum (2021) identifies the failure of climate action, the increasing frequency of extreme weather, and environmental degradation driven by human activities as some of the most severe global threats. In the Chinese context, the report of the 20th National Congress of the Communist Party of China emphasizes the strategic significance of ecological civilization and sustainable development, explicitly calling for strengthened climate change mitigation, promotion of green and low-carbon growth, and achievement of the national “dual carbon” targets. In light of both global warming trends and China’s ambitious carbon peaking and neutrality goals, enterprises, as essential participants in the market economy, are increasingly expected to align with national policies, heighten their awareness of climate-related risks, and enhance their capabilities to manage and adapt to these emerging challenges.
Concurrently, the phenomenon of China’s economy “decoupling from the real sector towards the virtual sector” has garnered significant academic attention. At the macro level, this manifests specifically as the continuous rise in the relative proportion of the financial sector within the national economy. At the micro level, financial assets offer relatively higher liquidity and potentially superior returns compared with physical assets, therefore firms may increasingly shift their asset allocation toward financial instruments to ease financial constraints (Almeida et al., 2004; Demir, 2009b), pursue short-term earnings (C. Chen et al., 2023), or participate in shadow banking activities that generate interest spreads (Shin & Zhao, 2013; J. Du et al., 2017), which is called corporate financialization. Accordingly, a growing body of literature has explored the drivers and consequences of this trend. Macroeconomic determinants include economic policy uncertainty (Zhao & Su, 2022) and financial cycles (Guan & Wei, 2024), while firm-level factors range from interbank competition (S. Wang et al., 2025) and compensation incentives (P. Du et al., 2022) to CEO social capital (Y. Chen et al., 2024). Studies also show that corporate financialization can have adverse economic consequences, such as reduced innovation quality (Zhu et al., 2023), increased systemic risk (Rajan, 2006), and greater income inequality (Hein & Dodig, 2014).
Similarly, climate risk has emerged as a prominent topic of common concern in both academic and practical circles in recent years, and its economic impact on enterprises has also been widely discussed. Overall, existing literature primarily addresses the issue from physical risk and transition risk perspectives. From the perspective of physical risk, extreme climate events such as floods and hurricanes can damage corporate transportation routes and production facilities, leading to an overall decline in business performance. Furthermore, existing research has shown that extreme weather severely impairs the health of outdoor workers (Flouris et al., 2018; Parsons et al., 2021), reduces industry working hours (Somanathan et al., 2021), and increases the intensity of corporate layoffs (W. Li et al., 2025). From the perspective of transition risk, prior studies have documented that climate risk raises the cost of both debt and equity financing for firms (Huynh et al., 2020), diminishes corporate profitability (Pankratz et al., 2023), and imposes additional transition costs as firms respond to increasingly stringent climate regulations (Seltzer et al., 2022; Addoum et al., 2023). These factors collectively contribute to prolonged adverse effects on firms’ long-term operational sustainability (Linnenluecke et al., 2011; Moscona & Sastry, 2023). Under such circumstances, firms face growing pressure to adopt investment strategies that can effectively mitigate climate-related risks and support sustainable growth.
However, relatively little research has comprehensively investigated the impact of climate risk on firms’ allocation of financial assets. Drawing on the existing literature that connects climate risk with corporate financialization, this study identifies two competing theoretical channels. On the one hand, firms may allocate a higher proportion of financial assets to cope with the uncertainties of climate risk shocks, motivated by the need for “precautionary savings” and to alleviate financial pressures (Almeida et al., 2004; Demir, 2009b). On the other hand, climate risks may increase the cost of capital for enterprises and constrain the sources of funding required for their financial investment activities, thereby suppressing corporate financialization. Furthermore, in response to tightening environmental regulations and in pursuit of legitimacy and support from governments, investors, and other stakeholders, firms may redirect their resources toward upgrading energy-efficient infrastructure and strengthening innovation capacity to advance their green transition efforts (Feng et al., 2024; Dong et al., 2025), which could diminish their incentives to accumulate financial assets. Despite these conceptual perspectives, empirical evidence on the relationship between climate risk and corporate financialization remains limited. Therefore, our study incorporates firm-level climate risk exposure into the analysis to explore the mechanisms through which climate risk influences financialization behavior. In doing so, it supports the expansion of research into the impact of climate risk on corporate investment decisions, while also providing a foundation for enterprises to cope with climate change.
This paper investigates the impact of climate risk on corporate financialization by employing A-share listed companies in China from 2007 to 2019 as the research sample. The empirical results reveal a significant inverse relationship between climate risk exposure and the extent of financialization, suggesting that firms facing higher climate-related risks tend to engage less in financial asset accumulation. This finding remains robust across multiple verification tests, including instrumental variable estimations, alternative financialization metrics, and expanded temporal frameworks. Further heterogeneity analyses demonstrate that the effect of climate risk on financialization exhibits substantial variation depending on firms’ ownership types, degrees of industry competition, and the stringency of local environmental regulations. Additional mechanism analyses indicate that heightened climate risk reduces financialization by amplifying firms’ financing constraints while simultaneously fostering their innovation efforts. Collectively, these findings suggest that corporate financialization within China’s real sector is largely driven by motives such as investment substitution and real-sector intermediation, which prioritize short-term financial returns over long-term productive investment in the real economy.
The marginal contributions of this study can be summarized as follows: (1) while prior research has largely concentrated on the effects of climate risk on corporate financing constraints (Huang et al., 2022), firm performance (Pankratz et al., 2023), and firm valuation (Berkman et al., 2024), limited attention has been given to the mechanisms through which climate risk shapes corporate investment behavior. To address this research gap, this paper introduces corporate financialization as a novel analytical lens to examine the influence and transmission channels of climate risk, thereby extending the literature on the broader economic consequences of climate-related shocks. (2) Although existing studies on corporate financialization have investigated determinants such as corporate social responsibility (Su & Lu, 2023), economic policy uncertainty (Zhao & Su, 2022; Cheng & Masron, 2024), managerial traits (Fan & Tang, 2024), and investor risk appetite (C. Li et al., 2019; J. Wang & Mao, 2022), few have directly incorporated climate change as a driving factor. By integrating climate risk into the analysis of corporate financialization, and by examining how ownership structure, industry competition, and regional environmental regulation moderate this relationship, this study expands the identification framework and contributes to a more comprehensive understanding of the determinants of corporate financialization. (3) This study reveals that climate risk significantly suppresses corporate financialization through two channels: exacerbating financing constraints and fostering innovation capability. These findings indicate that corporate financialization in China is driven primarily by profit-seeking motives rather than precautionary savings. Such conclusions provide important practical implications for refining China’s financial market mechanisms and facilitating the growth of its real economy. (4) This paper focuses on China as a typical developing country, and its findings may offer valuable insights for other developing nations with similar social systems and economic levels in addressing climate risks and improving financial market mechanisms.
The remainder of the paper is organized as follows. Section 2 develops the theoretical framework and formulates the empirical hypotheses regarding the impact of climate risk on corporate financialization. Section 3 describes the research design, including data sources, variable construction, and model specifications. Section 4 presents the baseline empirical results and conducts a series of robustness tests. Section 5 investigates the underlying mechanisms through which climate risk influences financialization, focusing on financing constraints and innovation capacity. Finally, Section 6 concludes the paper and discusses the policy implications.
2. Theoretical Analysis and Research Hypotheses
Theoretical perspectives on corporate financialization are generally classified into three main frameworks: the “reservoir” theory, the “investment substitution” theory, and the “real-sector intermediation” theory. According to the reservoir theory, firms accumulate financial assets as a buffer to alleviate financing constraints and mitigate the costs associated with financial distress. Compared to fixed assets, financial assets, particularly non-cash instruments, possess greater liquidity, allowing firms to liquidate them in times of financial strain to ease funding shortages and reinforce cash flow (Almeida et al., 2004). Through an analysis of the investment portfolios of non-financial firms in Argentina, Demir (2009a) concludes that coping with macroeconomic uncertainty is one of the key reasons for firms to hold financial assets in addition to return differentials. Furthermore, some enterprises utilize financial derivatives for hedging transactions to achieve tax savings and reduce financial distress costs (Smith & Stulz, 1985; Bessembinder, 1991).
In contrast, the investment substitution theory emphasizes that financialization is primarily driven by capital arbitrage motives (Demir, 2009b). When financial investments yield returns that surpass those from real-sector projects, firms are incentivized to reallocate resources from real investment toward financial assets to maximize profits. Seo et al. (2012) and Akkemik and Özen (2014) conducted studies in South Korea and Turkey, respectively, which confirmed that enterprises tend to increase their investments in financial assets, especially those with high returns, while reducing investment of research and fix assets, which might lead to a “crowding out” effect on the real economy. Furthermore, drawing on upper echelons theory and agency theory, managers with a short-term orientation may exhibit a preference for financial investments that deliver immediate gains at the expense of long-term real-sector development (Brochet et al., 2015). The real-sector intermediation theory, advanced by Shin and Zhao (2013), posits that, under information asymmetry, financial frictions arise between banks and enterprises, resulting in financing constraints when firms seek loans from banks. But low-risk enterprises are more likely to gain favor with banks and therefore face relatively lighter financing constraints, whereas high-risk enterprises tend to be marginalized and encounter more severe restrictions on financing. Therefore, the firms with strong access to external capital and relatively low borrowing costs may engage in shadow banking activities. In doing so, they function as quasi-financial intermediaries, channeling funds to financially constrained and higher-risk firms.
In summary, while financialization driven by the reservoir motive can stabilize corporate operations and ultimately support the real economy, financialization prompted by investment substitution or real-sector intermediation often crowds out real investment, thereby hindering sustained economic growth.
Building upon the three theoretical motivations for corporate financialization discussed earlier, this study explores how climate risk may influence firms’ financialization behavior. On one hand, prior studies indicate that climate risk has increasingly attracted the attention of investors (Seltzer et al., 2022) and has become an important determinant in the pricing of financial assets such as stocks and bonds (Huynh et al., 2020). Elevated climate risk amplifies firms’ exposure to systematic uncertainty, affects market sentiment and investor confidence, raises the discount rates applied to investment projects, and reduces the scope of viable investment opportunities (Y. Li & Wan, 2025). These factors, in turn, increase the likelihood of corporate default (Bell & Van Vuuren, 2022) and elevate the cost of both debt and equity financing. When confronted with tightening financing conditions, firms may respond differently depending on their financialization motives. Under the “reservoir” motive, firms tend to increase their holdings of financial assets to serve as liquidity buffers against future investment uncertainties. Conversely, under the “investment substitution” and “real-sector intermediation” motives, rising financing costs reduce the attractiveness and feasibility of financial investments by limiting available capital, thereby constraining corporate financialization.
On the other hand, as climate-related challenges intensify, governments are increasingly likely to implement more stringent environmental regulations. In line with the Porter hypothesis, tighter regulatory frameworks may compel firms facing heightened climate risks to strengthen their technological innovation efforts as a means of reducing their exposure and vulnerability. For example, Xie and Li (2024) found that cities facing higher climate risks can significantly enhance energy-saving innovation technologies through increased energy consumption, research, and government regulation. At the same time, growing public awareness and heightened investor concern regarding climate risks further motivate firms to pursue innovation, not only to enhance their reputational standing but also to signal proactive climate risk management and foster stronger relationships with key stakeholders (Hahn et al., 2015), thereby improving their adaptive capacity in the face of climate change. As emphasized by Feng et al. (2024), firms that disclose more climate risk information are able to build stronger reputation capital, which subsequently contributes to enhanced innovation capabilities. Furthermore, the operational efficiency gains and improved real-sector returns generated through enhanced innovation may diminish firms’ incentives to pursue financialization through “investment substitution” or “real-sector intermediation” motives, ultimately curbing excessive financial asset allocation. Based on this theoretical foundation, the following research hypotheses are proposed.
Hypothesis 1a.
If the “reservoir” motive dominates, climate risk will promote corporate financialization.
Hypothesis 1b.
If the “investment substitution” and “real-sector intermediation” motives dominate, climate risk will inhibit corporate financialization.
Hypothesis 2.
Financing constraints and innovation capability mediate the relationship between climate risk and corporate financialization.
3. Research Design
3.1. Sample Selection and Data Source
To minimize potential confounding effects arising from the substantial revisions to China’s Accounting Standards in 2006 and the external shock of the COVID-19 pandemic beginning in 2020, this paper focuses on a sample of 16,479 observations, 2679 firms listed on the Shanghai and Shenzhen A-share markets, covering the period from 2007 to 2019. Consistent with established practices in the literature, the sample is refined through several screening steps. First, firms operating in the financial sector are excluded. Second, we have removed the companies designated as ST, ST*, or PT. Third, observations with missing values for key variables are excluded. Finally, all continuous variables are winsorized at the 1st and 99th percentiles to mitigate the influence of extreme outliers. After these procedures, the final dataset comprises 16,479 observations, 2679 firms spanning 2007 to 2019. Corporate financial data are obtained from the CSMAR database, while climate risk indicators are extracted from corporate annual reports using a combination of text analysis and machine learning techniques, following the approach developed by Feng et al. (2024).
3.2. Model Construction
To examine the relationship between climate risk and corporate financialization, this study employs the following multivariate regression model:
where , the explained variable, is the degree of financialization of enterprise i in year t, is the degree of climate risk disclosure of enterprise i in year t, is the control variable, , , and are year, industry, and province fixed effect, respectively, and is the error term.
3.3. Variables’ Definitions
The dependent variable in this study is corporate financialization. In the existing literature, corporate financialization is typically assessed from two dimensions: asset-based and profit-based measures. Given the focus of this paper on examining how climate risk influences corporate financialization, particular attention is directed toward capturing firms’ financialization intentions. Therefore, this study adopts an asset-based metric, which reflects the absolute scale of financial asset holdings. Specifically, financial assets are defined as the aggregate of trading financial assets, net held-to-maturity investments, derivative financial instruments, net interest receivables, net dividend receivables, net long-term equity investments, and net investment properties.
3.3.1. Independent Variable
This study adopts the methodology developed by Feng et al. (2024) to construct a firm-level measure of climate risk, employing text analysis and machine learning techniques to generate the core explanatory variable, namely the Climate Risk Index (Clr). Specifically, all A-share listed companies’ annual reports from 2007 to 2019 were collected from the CNINFO platform as the primary data source. An initial set of seed words associated with climate risk was manually compiled. To expand this lexicon, the Continuous Bag of Words (CBOW) word embedding model was applied, retrieving the ten most semantically similar terms for each seed word. After filtering out irrelevant or noise terms unrelated to climate risk, a final list of 91 climate-risk-related keywords was established. For example, physical risks refer to the direct impacts of climate change such as extreme rainfall, high temperatures, and other climatic events on economic entities, which include words like disasters, earthquakes, typhoons, tsunamis, and so on. On the other hand, transition risks arise indirectly from changes in climate policies, market preferences, and technological innovations, which may lead to asset devaluation or increased financing costs for firms, and the relevant words include energy conservation, energy, clean, ecology, and so on. Finally, the Climate Risk Index was then calculated by dividing the frequency of climate-risk-related keywords by the total word count in each firm’s annual report, thereby capturing the firm’s relative exposure to climate risk.
3.3.2. Control Variables
Following Su and Lu (2023), this study incorporates a set of firm-level control variables that may affect corporate financialization. These controls include firm size (Size), firm age (Age), firm valuation measured by Tobin’s Q (Tobin’s Q), profitability proxied by return on assets (ROA), leverage ratio (Lev), ownership concentration among the top ten shareholders (top10_HHI), liquidity measured by the current ratio (Liquid), the return differential between financial and real-sector investments (Return_Gap), CEO–chairperson duality (Adjoint), market-to-book ratio (MB), the proportion of independent directors on the board (idr), and income tax expenses (tax). The detailed definitions and measurement of these variables are summarized in Appendix A.1.
4. Empirical Results
4.1. Descriptive Statistics
Table 1 summarizes the descriptive statistics for the key variables. The average level of financialization (Fin) is 6%, with substantial dispersion (SD = 10.2%), indicating significant variation in firms’ financial asset holdings and that the trend of “shifting from a real to virtual economy” among Chinese firms does exist but has not yet reached a level where it dominates their balance sheets. Climate Risk Index (Clr) averages 0.13% and exhibits considerable heterogeneity (SD = 0.155%), consistent with firms’ varying exposures to climate-related risks. Firm size (Size) shows a mean of 21.80 (log assets), capturing a wide distribution of firm scales. The mean firm age (Age) is 2.60 years. Tobin’s Q averages 2.16, suggesting that, on average, market valuations exceed book values. Profitability (ROA) is positive on average but displays wide variability, ranging from −34.1% to 27.5%. Leverage (Lev) averages 45%, while ownership concentration (top10_HHI) centers around 48%. Liquidity (Liquid) is highly dispersed, with a mean current ratio of 2.50. CEO duality (Adjoint) occurs in 23% of observations. The market-to-book ratio (MB) averages 0.59, while board independence (idr) averages 38%. The effective tax burden (tax) averages 3.6% of assets. Overall, the data displays substantial cross-sectional variation, providing a rich empirical setting to explore the relationship between climate risk and corporate financialization.

Table 1.
Descriptive Statistics.
4.2. Effectiveness of Climate Risk Indicators
Before conducting empirical analysis, this paper matches the industry average of climate risk with the scope of high-carbon industries to test the effectiveness of the climate risk indicators at the industry level. Within the context of low-carbon transition, high-carbon industries are expected to face elevated climate risks, particularly those related to fossil fuels, where transition risks may significantly impact their operations, investments, and financing activities. Existing literature also commonly classifies high-carbon industries such as fossil energy production, diesel, electricity, thermal power, coke mining, and equipment manufacturing as energy-intensive industries (Tan & Lin, 2018; Lyu et al., 2024). Accordingly, this paper calculates the average of climate risk indicators by industry classification in the corporate sample and lists the top fifteen industries with the highest average climate risk, as shown in Figure 1. The results show that most of these industries belong to energy-intensive sectors, demonstrating the effectiveness of the climate risk indicators proposed in this study.
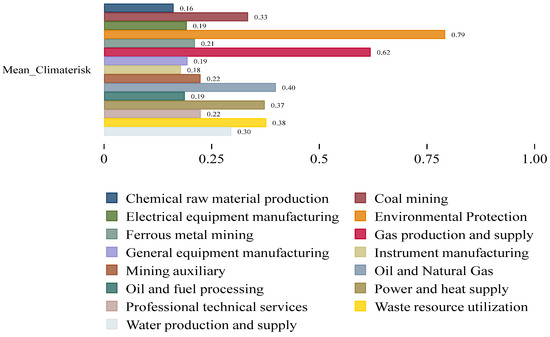
Figure 1.
Top Fifteen Industries by Average Climate Risk.
4.3. Baseline Regression Result
The baseline regression results are presented in Table 2. Columns (1) and (2) present the ordinary least squares (OLS) estimates. In both specifications, with and without the inclusion of control variables, the coefficient for Clr remains significantly negative, which indicates that the firms with greater climate risk exposure have a lower proportion of financial assets, consistent with Hypothesis 1. After that we further employ a two-stage least squares (2SLS) approach to address endogeneity issues. Following the identification strategy used by Feng et al. (2024), the average climate risk exposure of other firms within the same industry is used as an instrumental variable (IV). This instrument is plausibly correlated with a firm’s own climate risk exposure while being unlikely to directly influence its financial asset allocation decisions, thereby satisfying both the relevance and exclusion restrictions. In Column (3), the first-stage regression shows that the IV is strongly correlated with the endogenous regressor. The corresponding first-stage F-statistic exceeds conventional thresholds, supporting instrument relevance. Additionally, the K-P LM statistic is significant at the 1% level, further confirming instrument strength and mitigating concerns about weak identification. Column (4) presents the second-stage estimates, where the coefficient on Clr remains significantly negative. Overall, the 2SLS results reinforce the baseline findings, indicating that greater climate risk exposure significantly suppresses corporate financialization even after accounting for endogeneity.
Table 2.
The impact of climate risk on corporate financialization.
4.4. Endogeneity Test
To make the experimental conclusions more credible, in addition to employing the 2SLS method, this paper also adopts the following methods to mitigate endogeneity issues:
4.4.1. Propensity Score Matching
The propensity score matching (PSM) method can mitigate endogeneity issues arising from bidirectional causality. This study uses the propensity score matching (PSM) method to select control group samples (L. Liu, 2024). We first create a dummy variable for climate risk, assigning a value of 1 if a firm’s climate risk exceeds the median level and 0 otherwise. Using firm characteristic variables—such as firm size, age, market value, price-to-earnings ratio, ownership concentration, current ratio, duality of the chairman and general manager, market-to-book ratio, proportion of independent directors, and tax expense—we estimate propensity scores for each firm through a Logit model. We then perform one-to-one nearest neighbor matching with a caliper value of 0.05. After that, we further present the results of the balance tests in Appendix A.3, which indicates that, after matching, the standardized differences for all covariates are below 10%. Finally, we use regression model (1) to analyze the matched sample. Table 3, column (1) presents the corresponding regression results.
Table 3.
Endogeneity test.
4.4.2. Heckman Two-Step Method
The Heckman two-stage method is a statistical method to address sample selection bias, which corrects endogeneity arising from non-random sample selection through a two-stage regression analysis. In the first stage, we use the firm-level control variables as characteristics influencing corporate financialization and group all samples according to the median climate risk within their industry, which is employed as the dependent variable to construct a Probit model for estimating the inverse Mills ratio (IMR). Subsequently, we incorporate the variable imr into a second-stage regression, and the results are shown in columns (2)–(3) of Table 3. The coefficient of the core independent variable remained significantly negative, which indicates that Hypothesis 1b remains valid.
4.5. Replacing the Instrumental Variable
This study further conducts endogeneity tests by replacing the instrumental variable to ensure the robustness of the experimental results. However, after reviewing existing literature, no instrumental variable was found that simultaneously satisfies the relevance and exogeneity conditions at the firm level. Therefore, this paper constructs a firm-level instrumental variable based on heteroscedasticity for re-examination referring to Lewbel (2012). The detail is as follows:
This method primarily utilizes information contained in the heteroscedasticity of ε2 to construct an effective instrumental variable for , where refers to the corporate financialization, denotes the Climate Risk Index, and X′ represents a set of control variables. ε1 and ε2 are the error terms. Lewbel (2012) suggests that, in the absence of suitable instrumental variables or when weak instrument problems exist, an observable set of exogenous variables Z can be used to construct [Z − E(Z)]ε2 as the instrumental variable. This paper assumes that Z is derived from all firm- and region-level variables in X′.
First of all, this study estimates Equation (3) by using the OLS regression and calculates the error term ε2. Second, we construct the instrumental variable [Z − E(Z)]ε2 and use the two-stage least squares (2SLS) regression to estimate Equation (2). The result shows that the coefficient of the explanatory variable remains significantly negative at the 5% level, as shown in Table 4. Moreover, the results of the weak instrument test and the instrument identifiability test further confirm the validity of the instrumental variables. This demonstrates that the research conclusion remains robust even after re-estimation with alternative instrumental variables.
Table 4.
Replacing the Instrumental Variable.
4.6. Robustness Test
4.6.1. Replacing the Dependent Variable
A mechanical increase in the proportion of financial assets may occur if non-financial assets decline unexpectedly, even in the absence of intentional changes in firms’ investment strategies. To mitigate this potential measurement bias, we construct an alternative dependent variable by taking the natural logarithm of financial assets (Fin2) to capture corporate financialization. Meanwhile, long-term equity investments often include shares in joint ventures and associated companies held by firms for productive purposes, which should not be entirely categorized as financialization behavior. Therefore, this paper excludes such investments from financial assets and constructs the dependent variable Fin3 for regression. The results of columns (1) and (2) in Table 5 show that the coefficients of independent variable Clr remain significantly negative at the 1% level, indicating that the adverse impact of climate risk on corporate financialization persists and is robust to the use of alternative measurement approaches.
Table 5.
Robustness test: Replacing the Dependent Variable.
4.6.2. Extend the Time Window
We extend the analysis over a longer temporal horizon by incorporating lagged measures of climate risk to verify. As reported in Table 6, columns (1) to (3), the regression coefficients on the lagged values of Clr remain significantly negative, which indicates that the adverse effect of climate risk persists beyond the contemporaneous period. Columns (4) to (6) further confirm that this suppressive effect remains stable over extended periods, suggesting a lasting influence of climate risk exposure on firms’ financialization decisions. These findings imply that the impact of climate risk is not merely transitory or driven by short-term shocks but rather reflects a persistent adjustment in corporate asset allocation behavior in response to heightened climate uncertainty. The stability of these results across multiple lag structures strengthens the argument that firms internalize climate risk into their strategic financial decision-making processes. This long-term consistency also mitigates concerns that the observed relationship may be driven by short-term fluctuations or reverse causality, thereby reinforcing the credibility of the baseline findings.
Table 6.
Robustness test: Extend the time window.
4.7. Additional Robustness Checks
To address potential confounding effects arising from unobserved time trends, we augment the baseline specification by incorporating both a linear time trend and industry-specific linear time trends into the model. This adjustment controls for common temporal shocks and industry-level dynamics that may jointly influence climate risk exposure and firms’ financialization behavior. In addition, to alleviate concerns that the results may be driven by industries that are inherently more sensitive to climate policies or subject to stricter environmental regulations, we conduct a sample exclusion test. Specifically, following the classification proposed by Yang et al. (2020), we exclude firms operating in 13 highly energy-consuming and heavily polluting sectors, including petrochemicals, chemicals, building materials, steel, and non-ferrous metals. These industries are more directly exposed to regulatory interventions and may exhibit systematically different financialization patterns compared to other sectors. By removing these firms from the sample, we reduce the risk that our estimates are influenced by industry-specific regulatory distortions.
Table 7 presents the results of these robustness checks. Across all model specifications, the coefficient on Clr remains significantly negative and largely consistent in magnitude with the baseline estimates. These findings underscore the robustness of the negative relationship between climate risk and corporate financialization, even after accounting for potential time trends and sectoral composition effects. The persistence of the results further suggests that the observed effects are not confined to industries with inherently high climate sensitivity but instead reflect a broader and systematic firm-level response to climate risk across the real economy.
Table 7.
Additional Robustness Checks.
4.8. Heterogeneity Analysis
4.8.1. Climate Risk, Ownership Structure, and Corporate Financialization
From the perspective of corporate governance, state-owned enterprises (SOEs) are subject to more direct influence from government policies and administrative interventions. Under the policy framework that emphasizes encouraging SOEs to shift their focus from financial markets back to real-sector development, firms with higher exposure to climate risk may have stronger incentives to allocate production resources toward upgrading obsolete production lines and investing in energy-efficient and environmentally friendly technologies as part of their climate adaptation strategies. Thus, we divide the full sample into two groups: SOEs and non-SOEs, and conduct separate regression analyses for each subsample by using model (1). To formally test for differential effects, we perform a coefficient comparison on the Clr variable across the two groups. The results, presented in columns (1) and (2) of Table 8, indicate that the negative impact of climate risk on corporate financialization is more substantial among SOEs, as reflected by a larger coefficient in absolute magnitude. The coefficient difference test further confirms that this disparity is statistically significant, suggesting that ownership structure significantly moderates the relationship between climate risk and firms’ financialization behavior.
Table 8.
Heterogeneity Analysis Results.
4.8.2. Climate Risk, Industry Competition, and Corporate Financialization
At the industry level, market competition plays an important role in shaping firms’ asset allocation decisions. Prior literature suggests that intensified competition induces managers to enhance shareholder value (Megginson & Netter, 2001) and to proactively engage in corporate social responsibility to secure broader stakeholder support. In more competitive industries, external pressure increases managerial accountability, constrains short-term opportunism, and incentivizes firms to pursue market expansion through real-sector investments. As a result, firms operating in highly competitive environments are less reliant on financial asset allocation, leading to a lower degree of financialization. Based on this reasoning, we expect the negative effect of climate risk on corporate financialization to be more pronounced in industries characterized by higher competition.
To empirically test this hypothesis, we measure industry competition using the inverse of the Herfindahl–Hirschman Index (HHI). Firms operating in industries with competition levels above the median are classified as high-competition (above_HHI = 1), while those below the median are categorized as low-competition (above_HHI = 0). After that, we estimate subsample regressions for these two groups by using model (1). As reported in columns (3) and (4) of Table 8, the coefficient on Clr is significantly larger in absolute magnitude for the high-competition subsample. The coefficient difference test confirms that this difference is statistically significant at the 5 percent level. These findings provide evidence that industry competition amplifies the suppressive effect of climate risk on corporate financialization, consistent with the proposed hypothesis.
4.8.3. Climate Risk, Environmental Regulation, and Corporate Financialization
The Porter hypothesis suggests that appropriately stringent environmental regulations can incentivize firms, particularly those with elevated climate risk exposure, to invest in technological innovation and upgrade production processes to sustain long-term competitiveness. This “innovation compensation effect” may reduce firms’ reliance on financialization as real-sector returns improve. However, when regulatory stringency becomes excessive, compliance costs may rise substantially (Dean et al., 2000; Y. Wang et al., 2019), potentially discouraging real-sector investment and inducing firms to shift resources toward financial assets due to deteriorating returns or prohibitive transformation costs.
To assess the moderating role of environmental regulation in the relationship between climate risk and corporate financialization, we construct a regional measure of regulatory intensity, defined as the ratio of completed industrial pollution control investment to the value added of the secondary industry. Firms located in regions where regulatory intensity exceeds the sample median are assigned above_EI = 1; those below the median are assigned above_EI = 0. We estimate subsample regressions for these two groups by using model (1). Columns (5) and (6) of Table 8 present the results. The coefficient on Clr remains negative in both subsamples but is significantly larger in absolute magnitude among firms operating under stronger regulatory regimes. The coefficient difference test confirms that this difference is statistically significant, indicating that stricter environmental regulation amplifies the suppressive effect of climate risk on corporate financialization. These findings suggest that, under stronger regulatory pressure, firms with greater climate risk exposure are more likely to reallocate resources toward real-sector investment in order to meet environmental compliance standards and align with the expectations of external stakeholders.
5. Mechanism Analysis
5.1. Financing Constraints Channel
The preceding empirical evidence establishes a significant negative relationship between climate risk and corporate financialization. Building on the theoretical framework, one plausible transmission mechanism operates through firms’ financing constraints. Elevated climate risk increases systematic uncertainty, thereby tightening financing conditions, raising risk premiums, and limiting firms’ access to external capital. As a result, the funds available for financial investments motivated by investment substitution or real-sector intermediation diminish, ultimately suppressing financialization behavior.
To empirically test this channel, we follow the methodologies of Wei et al. (2014), employing both the FC index and the KZ index as proxies for financing constraints. Ordinary least squares regressions are estimated with financing constraints as the dependent variable and climate risk exposure as the explanatory variable. The results, reported in Table 9, show that the coefficient on Clr is significantly positive across all specifications, regardless of which financing constraint measure is used. These findings are consistent with Huang et al. (2022), confirming that heightened climate risk exposure exacerbates firms’ financing constraints by increasing perceived risk and restricting capital access. The evidence thus supports financing constraints as a key mechanism through which climate risk reduces corporate financialization.
Table 9.
Mechanism Test Results.
The financing constraint mechanism further interacts with structural distortions in credit allocation and underdeveloped financial markets. In China’s financial system, state-owned enterprises (SOEs) and large listed firms enjoy preferential access to credit due to higher collateral values, implicit government guarantees, and political connections. Conversely, small and medium-sized enterprises (SMEs), which often lack sufficient collateral and face greater information asymmetry, encounter substantial difficulties securing affordable long-term financing. This disparity allows financially advantaged large firms to accumulate excess internal capital that remains idle when attractive real-sector investment opportunities are scarce.
Under these conditions, agency conflicts and weak monitoring mechanisms incentivize managers to reallocate idle funds into financial assets to exploit short-term arbitrage opportunities (Stein, 2003) or into shadow banking activities where firms operate as quasi-financial intermediaries (Shin & Zhao, 2013). These behaviors reinforce speculative financialization among firms with superior financing capacity, contributing to persistent financialization growth despite increasing climate-related risks.
Moreover, the extent to which firms can rely on financial assets for precautionary liquidity management depends heavily on financial market completeness. Yet, China’s financial markets remain relatively immature, characterized by limited financial instruments, elevated price volatility, and underdeveloped risk-sharing mechanisms. As a result, available financial assets are insufficient to fully serve precautionary motives (Peng et al., 2018). Related empirical studies further corroborate this view. W. Liu and Cao (2019) find that financialization has significantly crowded out real-sector investment. Su and Lu (2023) report that improved corporate social responsibility unexpectedly intensifies financialization by easing financing access. Zhao and Su (2022) document that higher economic policy uncertainty suppresses financialization, highlighting its sensitivity to macroeconomic risks. Collectively, these findings suggest that financialization in China is predominantly driven by short-term profit-seeking and arbitrage motives, rather than by precautionary saving behavior.
5.2. Innovation Capacity Channel
To further explore the mechanisms through which climate risk affects financialization, we examine firms’ innovation capacity as an additional transmission channel. As heightened climate risk increases regulatory pressure and stakeholder expectations, firms may respond by reallocating resources toward technological innovation to strengthen resilience and secure long-term competitiveness. Following Bereskin et al. (2016) and Feng et al. (2024), we construct four alternative innovation proxies to ensure robustness. The first measure (Patent1) captures the natural logarithm of one plus the total number of invention, utility model, and design patents. The second (Patent2) applies a weighted scheme assigning weights of 3, 2, and 1 to invention, utility model, and design patents, respectively. The third (Patent3) focuses on invention patent applications, while the fourth (Patent4) combines utility model and design patent applications. These alternative measures allow for a comprehensive assessment of firms’ technological capacity in responding to climate risk and moderating financialization behavior.
The regression results reported in columns (3) through (6) of Table 9 provide consistent evidence that climate risk significantly promotes firms’ innovation activities. These findings are aligned with Feng et al. (2024) and Xie and Li (2024) and suggest that heightened regulatory pressure and growing societal attention to environmental issues incentivize firms to adopt technological innovation as a strategic response to mitigate climate-related vulnerabilities and to maintain legitimacy with key external stakeholders. The observed positive association between climate risk exposure and innovation capacity supports the notion that firms actively reallocate internal resources toward innovation as part of their long-term adaptation strategies.
Importantly, this resource reallocation mechanism has implications for firms’ financialization behavior. Given the constraints on internal capital and managerial attention, increased investment in innovation inevitably competes with financial asset accumulation. As innovation capacity improves, firms not only strengthen their competitive positioning but also enhance the expected returns from real-sector activities. Consequently, the incentives to pursue financial investments motivated by short-term arbitrage (investment substitution) or shadow banking (real-sector intermediation) diminish. These results provide direct empirical support for the innovation channel as a mechanism through which climate risk suppresses corporate financialization, further reinforcing the robustness of the baseline findings.
The mechanism tests in this study demonstrate that climate risk not only increases firms’ financing constraints but also enhances their innovation capacity. However, does the increase in financing constraints weaken the promoting effect of climate risk on innovation? To address this question, we standardized the KZ index and the FC index, then multiplied each by the standardized climate risk variable Clr to construct interaction terms C_K and C_F. Regression results presented in Table 10 show that the coefficients of both interaction terms C_K and C_F are statistically insignificant, indicating that financing constraints do not significantly diminish the positive impact of climate risk on innovation capacity.
Table 10.
Examining the Offset Effect of Financing Constraints.
6. Conclusions and Policy Recommendation
6.1. Conclusions
This paper examines the effect of climate risk on corporate financialization and explores its underlying transmission mechanisms using a panel of Chinese A-share listed firms over the period 2007 to 2019. The empirical results consistently demonstrate that climate risk significantly dampens the extent of financialization, and this relationship remains robust across multiple sensitivity analyses. Heterogeneity tests further reveal that the suppressive effect is more pronounced for state-owned enterprises, firms operating in highly competitive industries, and those located in regions with stricter environmental regulatory regimes. The mechanism analysis identifies two primary channels through which climate risk constrains financialization: by tightening firms’ financing constraints and by promoting innovation capacity. Collectively, these findings suggest that financialization among Chinese non-financial firms is predominantly driven by short-term profit-seeking motives, including speculative investment substitution and real-sector intermediation, rather than by precautionary saving objectives.
6.2. Policy Recommendation
These findings yield several important policy implications that speak directly to the role of climate risk in shaping corporate financialization behavior. Although climate risk itself does not directly induce financialization or amplify financialization trends, the persistent presence of credit discrimination tied to firms’ climate risk exposure highlights structural distortions in capital allocation.
Addressing this issue requires policymakers to strengthen climate risk disclosure mandates, promote the development of independent and credible climate risk assessment institutions, and reduce information asymmetry between firms, investors, and financial intermediaries. First of all, the policymakers should formulate clear standards for climate risk information (such as ESG information) disclosure to enhance the comparability of the information. Secondly, policymakers should establish a regulatory framework for climate risk disclosure to ensure accurate and timely reporting. After that, the policymakers should improve the third-party audit system by encouraging their participation in the review of climate risk information disclosure, thereby enhancing the reliability of the disclosed information. Improving climate risk disclosure and scoring mechanisms holds significant guiding importance for regulators, creditors, and enterprises. For regulatory agencies, it provides comprehensive data that enables accurate assessment of the environmental impact, social risks, and governance gaps across economic activities, thereby supporting the formulation of more scientific and targeted policies. For financial institutions, it reduces information asymmetry between creditors and borrowers. Incorporating ESG risks into credit assessment models allows for more accurate risk pricing, while continuous monitoring of borrowers’ ESG rating changes facilitates dynamic risk evaluation. For enterprises, those with strong ESG performance and high ratings are more likely to attract investors and banks, enabling them to issue bonds or secure loans at lower interest rates, which directly reduces financing costs. In addition, greater transparency in climate-related information is essential for mitigating credit discrimination, improving the allocative efficiency of financial markets, restoring the core function of financial intermediation, and channeling financial resources more effectively toward real-sector investment.
Moreover, the finding that climate risk suppresses financialization primarily by tightening financing constraints suggests that firms are not engaging in financial asset allocation out of precautionary liquidity motives but rather are limited by constrained access to external capital. In this regard, policymakers should continue to develop financial market infrastructure, expand derivative markets, and broaden the range of risk management instruments available to firms. For example, policymakers can encourage financial institutions and enterprises to innovate climate risk derivatives such as climate futures and options to help businesses hedge against climate-related risks. At the same time, the policymakers should expand financing channels for low-carbon transition enterprises and use the supply chain finance to enhance financial services for these companies. Furthermore, the policymakers should establish relevant regulations to provide a transparent legal environment for the climate risk derivatives market, thereby reducing trading risks for low-carbon transitioning enterprises. Strengthening financial market completeness would allow firms to utilize financial assets more effectively as liquidity buffers and to diversify their exposure to climate-related uncertainties without excessive reliance on financialization for short-term arbitrage.
In addition, the mechanism analysis underscores that innovation capacity serves as a key pathway through which climate risk influences financialization behavior. Specifically, stronger innovation capability enables firms to enhance real-sector returns and reduces their dependence on financial asset investments. To foster this adjustment, policymakers should implement supportive measures such as targeted tax incentives, preferential financing policies, and transition subsidies that facilitate firms’ low-carbon transformation and lower adjustment costs. Encouraging sustained R&D investment not only strengthens firms’ technological competitiveness but also activates the innovation compensation effect embedded in environmental regulation, thereby aligning environmental objectives with long-term real-sector growth.
Collectively, these findings contribute to the broader climate finance research by providing novel empirical evidence on how climate risk reshapes corporate financialization through the joint channels of financing constraints and innovation incentives. The results offer meaningful insights for policymakers seeking to balance climate goals with financial stability while ensuring that financial markets continue to serve their essential role in supporting sustainable economic development in the face of escalating climate challenges.
6.3. Limitation and Future Research Outlook
This study has several limitations as follows: first, the existing literature has not yet proposed firm-level instrumental variables for climate risk, and the firm-level instrumental variables constructed in this study are based on heteroscedasticity, therefore, identifying appropriate firm-level instrumental variables in future research could further improve the robustness of the endogeneity tests. Second, while this paper identifies financing constraints and innovation capability as mechanisms through which climate risk suppresses corporate financialization, there may be other underlying mechanisms that researchers could explore in future studies. Third, the sample period ends in 2019 to avoid the impact of the COVID-19 pandemic on the empirical results, but it is worth noting that, after the pandemic, China’s climate policies and economic development models have undergone certain changes, and corporate motivations for holding financial assets may also have shifted. Nonetheless, due to the relatively insufficient number of firm observations in the post-pandemic period, this study does not provide an in-depth analysis of corporate financialization behavior after COVID-19. Finally, this study focuses on China, a typical developing country, and its findings can provide empirical insights for other developing countries with similar socio-economic systems, however, the conclusions may not be generalizable to countries with different social systems or stages of economic development. Researchers may extend this field of study by examining such countries in the future.
Author Contributions
Conceptualization, H.L. and J.T.; methodology, H.L.; software, H.L.; validation, Z.S.; formal analysis, H.L.; investigation, H.L.; resources, J.T.; data curation, J.T.; writing—original draft preparation, H.L.; writing—review and editing, Z.S.; visualization, J.T.; supervision, J.T.; project administration, J.T.; funding acquisition, J.T. All authors have read and agreed to the published version of the manuscript.
Funding
This research is supported by National Nature Science Foundation of China (NSFC) (No. 71764001).
Institutional Review Board Statement
Not appliable.
Informed Consent Statement
Not appliable.
Data Availability Statement
The original contributions presented in this study are included in the article. Further inquiries can be directed to the corresponding author.
Conflicts of Interest
The authors declare no conflicts of interest.
Appendix A
Appendix A.1. Variable Definition Table
| Variable Name | Symbol | Variable Definition |
| Corporate Financialization | Fin | |
| Corporate Risk | Clr | |
| Size of Total Assets | Size | Natural logarithm of total assets |
| List Age | Age | Log (Current year − Listing year + 1) |
| Firm Value | Tobin’s Q | (Market value of tradable shares + Number of non-tradable shares × Net asset value per share + Book value of liabilities)/Total assets |
| Return of Assets | ROA | Net profit/Total assets |
| Leverage | Lev | Total debt/Total assets |
| Ownership Concentration | top10_HHI | Concentration of shareholding ratios of the top ten shareholders |
| Current Ratio | Liquid | Current assets/Current liabilities |
| CEO Duality | Adjoint | 1 = concurrently serves as chairman and CEO; 0 = neither concurrently serves as chairman or CEO |
| Market-to-Book | MB | Market value to book value ratio |
| Proportion of Independent Directors | idr | Proportion of independent directors on the board of directors |
| Income Tax Expense | tax | The natural logarithm of income tax expense |
Appendix A.2. Sample Distribution Table
| Year | Frequency | Percent (%) |
| 2007 | 903 | 0.055 |
| 2008 | 1171 | 0.071 |
| 2009 | 1370 | 0.083 |
| 2010 | 1710 | 0.104 |
| 2011 | 1413 | 0.086 |
| 2012 | 1250 | 0.076 |
| 2013 | 1243 | 0.075 |
| 2014 | 2249 | 0.136 |
| 2015 | 1179 | 0.072 |
| 2016 | 1468 | 0.089 |
| 2017 | 1007 | 0.061 |
| 2018 | 708 | 0.043 |
| 2019 | 808 | 0.049 |
| Total | 16,479 | 1.000 |
Appendix A.3. Balance Test Results
| Variable | Unmatched | Mean | %Reduct | t-Test | V(T)/ | t | p > |t| | V(C) |
|---|---|---|---|---|---|---|---|---|
| Matched | Treated | Control | %bias | |bias| | ||||
| Size | U | 22.07 | 21.53 | 45.00 | 97.20 | 28.87 | 0.000 | 1.17 * |
| M | 22.07 | 22.08 | −1.200 | −0.760 | 0.447 | 0.94 * | ||
| Age | U | 2.609 | 2.591 | 4.200 | 57.90 | 2.670 | 0.008 | 0.86 * |
| M | 2.610 | 2.602 | 1.800 | 1.110 | 0.268 | 0.82 * | ||
| Q | U | 1.983 | 2.344 | −25.80 | 97.70 | −16.55 | 0.000 | 0.56 * |
| M | 1.986 | 1.994 | −0.600 | −0.450 | 0.650 | 0.99 | ||
| ROA | U | 0.035 | 0.042 | −10.10 | 76.40 | −6.500 | 0.000 | 0.74 * |
| M | 0.035 | 0.037 | −2.400 | −1.600 | 0.111 | 0.85 * | ||
| Lev | U | 0.463 | 0.430 | 14.70 | 92.40 | 9.450 | 0.000 | 0.83 * |
| M | 0.463 | 0.460 | 1.100 | 0.750 | 0.455 | 0.97 | ||
| top10 HHI | U | 0.491 | 0.472 | 8.900 | 81.30 | 5.690 | 0.000 | 1.02 |
| M | 0.491 | 0.488 | 1.700 | 1.060 | 0.291 | 0.98 | ||
| Liquid | U | 2.169 | 2.831 | −23.60 | 88.90 | −15.15 | 0.000 | 0.59 * |
| M | 2.172 | 2.246 | −2.600 | −2.020 | 0.044 | 1.15 * | ||
| Adjoint | U | 0.215 | 0.246 | −7.500 | 79.90 | −4.800 | 0.000 | |
| M | 0.215 | 0.209 | 1.500 | 0.990 | 0.321 | |||
| MB | U | 0.621 | 0.559 | 26.00 | 98.00 | 16.70 | 0.000 | 0.95 * |
| M | 0.620 | 0.618 | 0.500 | 0.340 | 0.730 | 0.98 | ||
| idr | U | 0.378 | 0.376 | 2.300 | 32.20 | 1.480 | 0.138 | 1.05 * |
| M | 0.378 | 0.379 | −1.600 | −0.960 | 0.335 | 0.90 * | ||
| tax | U | 0.019 | 0.024 | −18.80 | 95.70 | −12.10 | 0.000 | 0.67 * |
| M | 0.019 | 0.019 | −0.800 | −0.580 | 0.564 | 0.94 * |
Note: The “%bias” in column 5 indicates that the standardized deviation for all matched variables is less than 10%. The “t-values” in column 7 and “p-values” in column 8 demonstrate that no significant differences exist in the means of all variables following matching. All variable definitions within the table are detailed in Appendix A.1. The “*” in column V(c) indicates that after matching, there is a statistically significant difference in the mean of this variable between the treatment group and the control group.
References
- Addoum, J. M., Ng, D. T., & Ortiz-Bobea, A. (2023). Temperature shocks and industry earnings news. Journal of Financial Economics, 150(1), 1–45. [Google Scholar] [CrossRef]
- Akkemik, K. A., & Özen, Ş. (2014). Macroeconomic and institutional determinants of financialisation of non-financial firms: Case study of Turkey. Socio-Economic Review, 12(1), 71–98. [Google Scholar] [CrossRef]
- Almeida, H., Campello, M., & Weisbach, M. S. (2004). The cash flow sensitivity of cash. The Journal of Finance, 59(4), 1777–1804. [Google Scholar] [CrossRef]
- Bell, F., & Van Vuuren, G. (2022). The impact of climate risk on corporate credit risk. Cogent Economics & Finance, 10(1), 2148362. [Google Scholar] [CrossRef]
- Bereskin, F. L., Campbell, T. L., & Hsu, P. H. (2016). Corporate philanthropy, research networks, and collaborative innovation. Financial Management, 45(1), 175–206. [Google Scholar] [CrossRef]
- Berkman, H., Jona, J., & Soderstrom, N. (2024). Firm-specific climate risk and market valuation. Accounting, Organizations and Society, 112, 101547. [Google Scholar] [CrossRef]
- Bessembinder, H. (1991). Forward contracts and firm value: Investment incentive and contracting effects. Journal of Financial and Quantitative Analysis, 26(4), 519–532. [Google Scholar] [CrossRef]
- Brochet, F., Loumioti, M., & Serafeim, G. (2015). Speaking of the short-term: Disclosure horizon and managerial myopia. Review of Accounting Studies, 20(3), 1122–1163. [Google Scholar] [CrossRef]
- Chen, C., Wang, T., & Jia, X. (2023). Short-termism in financial decision-making: Uncovering the influence of managerial myopia on corporate financial asset allocation through MD&A textual analysis. International Review of Financial Analysis, 90, 102900. [Google Scholar]
- Chen, Y., Shen, B., Cao, Y., & Wang, S. (2024). CEO social capital, financing constraints and corporate financialisation: Evidence from Chinese listed companies. Finance Research Letters, 60, 104781. [Google Scholar] [CrossRef]
- Cheng, Z., & Masron, T. A. (2024). Does economic policy uncertainty exacerbate corporate financialization? Evidence from China. Applied Economics Letters, 31(11), 1028–1036. [Google Scholar] [CrossRef]
- Dean, T. J., Brown, R. L., & Stango, V. (2000). Environmental regulation as a barrier to the formation of small manufacturing establishments: A longitudinal examination. Journal of Environmental Economics and Management, 40(1), 56–75. [Google Scholar] [CrossRef]
- Demir, F. (2009a). Capital market imperfections and financialization of real sectors in emerging markets: Private investment and cash flow relationship revisited. World Development, 37(5), 953–964. [Google Scholar] [CrossRef]
- Demir, F. (2009b). Financial liberalization, private investment and portfolio choice: Financialization of real sectors in emerging markets. Journal of Development Economics, 88(2), 314–324. [Google Scholar] [CrossRef]
- Dong, X., Meng, S., Xu, L., & Xin, Y. (2025). Digital transformation and corporate green innovation forms: Evidence from China. Journal of Environmental Planning and Management, 68(11), 2644–2672. [Google Scholar] [CrossRef]
- Du, J., Li, C., & Wang, Y. (2017). A comparative study of shadow banking activities of non-financial firms in transition economies. China Economic Review, 46, S35–S49. [Google Scholar] [CrossRef]
- Du, P., Zheng, Y., & Wang, S. (2022). The minimum wage and the financialization of firms: Evidence from China. China Economic Review, 76, 101870. [Google Scholar] [CrossRef]
- Fan, Z., & Tang, J. (2024). Gender equality and the risk assessment of corporate financialization: An analysis of the increase in the proportion of female executives. Social Sciences in China, 45(1), 182–208. [Google Scholar] [CrossRef]
- Feng, L., Huang, D., Chen, F., & Liao, F. (2024). Leveraging climate risk disclosure for enhanced corporate innovation: Pathways to sustainable and resilient business practices. International Review of Financial Analysis, 96, 103724. [Google Scholar] [CrossRef]
- Flouris, A. D., Dinas, P. C., Ioannou, L. G., Nybo, L., Havenith, G., Kenny, G. P., & Kjellstrom, T. (2018). Workers’ health and productivity under occupational heat strain: A systematic review and meta-analysis. The Lancet Planetary Health, 2(12), e521–e531. [Google Scholar] [CrossRef]
- Guan, Y., & Wei, Q. (2024). Financial cycles and corporate financialization levels—Evidence from the cultural industry enterprises. Finance Research Letters, 67, 105793. [Google Scholar] [CrossRef]
- Hahn, R., Reimsbach, D., & Schiemann, F. (2015). Organizations, climate change, and transparency: Reviewing the literature on carbon disclosure. Organization & Environment, 28(1), 80–102. [Google Scholar]
- Hein, E., & Dodig, N. (2014). Financialisation, distribution, growth and crises: Long-run tendencies. IPE Working Paper 35/2014. Berlin School of Economics and Law and Institute for International Political Economy. [Google Scholar]
- Huang, H. H., Kerstein, J., Wang, C., & Wu, F. (2022). Firm climate risk, risk management, and bank loan financing. Strategic Management Journal, 43(13), 2849–2880. [Google Scholar] [CrossRef]
- Huynh, T. D., Nguyen, T. H., & Truong, C. (2020). Climate risk: The price of drought. Journal of Corporate Finance, 65, 101750. [Google Scholar] [CrossRef]
- Lewbel, A. (2012). Using heteroscedasticity to identify and estimate mismeasured and endogenous regressor models. Journal of Business & Economic Statistics, 30(1), 67–80. [Google Scholar] [CrossRef]
- Li, C., Yao, Q., Wu, J., & Wang, D. (2019). Financialization and risk taking of non-financial corporations empirical evidence from Chinese listed companies. Journal of Applied Finance and Banking, 9(3), 79–107. [Google Scholar]
- Li, W., Chen, J., & Yuan, K. (2025). Changes in corporate employment under climate risk. Journal of International Money and Finance, 157, 103368. [Google Scholar] [CrossRef]
- Li, Y., & Wan, T. (2025). How does corporate climate risk exposure affect cash holdings? Applied Economics, 57(39), 6148–6165. [Google Scholar] [CrossRef]
- Linnenluecke, M. K., Stathakis, A., & Griffiths, A. (2011). Firm relocation as adaptive response to climate change and weather extremes. Global Environmental Change, 21(1), 123–133. [Google Scholar] [CrossRef]
- Liu, L. (2024). Impact of firm ESG performance on cost of debt: Insights from the Chinese bond market. Macroeconomics and Finance in Emerging Market Economies, 1–20. [Google Scholar] [CrossRef]
- Liu, W., & Cao, Y. (2019). Do institutional investors drive financialization of real sectors? China Finance and Economic Review, 8(2), 25–46. [Google Scholar] [CrossRef]
- Lyu, Z., Yu, L., Liu, C., & Ma, T. (2024). When temperatures matter: Extreme heat and labor share. Energy Economics, 138, 107811. [Google Scholar] [CrossRef]
- Megginson, W. L., & Netter, J. M. (2001). From state to market: A survey of empirical studies on privatization. Journal of Economic Literature, 39(2), 321–389. [Google Scholar] [CrossRef]
- Moscona, J., & Sastry, K. A. (2023). Does directed innovation mitigate climate damage? Evidence from US agriculture. The Quarterly Journal of Economics, 138(2), 637–701. [Google Scholar] [CrossRef]
- Pankratz, N., Bauer, R., & Derwall, J. (2023). Climate change, firm performance, and investor surprises. Management Science, 69(12), 7352–7398. [Google Scholar] [CrossRef]
- Parsons, L. A., Shindell, D., Tigchelaar, M., Zhang, Y., & Spector, J. T. (2021). Increased labor losses and decreased adaptation potential in a warmer world. Nature Communications, 12(1), 7286. [Google Scholar] [CrossRef]
- Peng, Y. C., Han, X., & Li, J. J. (2018). Economic policy uncertainty and corporate financialization. China Industrial Economics, 1(1), 137–155. [Google Scholar] [CrossRef]
- Rajan, R. G. (2006). Has finance made the world riskier? European Financial Management, 12(4), 499–533. [Google Scholar] [CrossRef]
- Seltzer, L. H., Starks, L., & Zhu, Q. (2022). Climate regulatory risk and corporate bonds. (No. w29994). National Bureau of Economic Research. [Google Scholar]
- Seo, H. J., Kim, H. S., & Kim, Y. C. (2012). Financialization and the slowdown in Korean firms’ R&D investment. Asian Economic Papers, 11(3), 35–49. [Google Scholar]
- Shin, H. S., & Zhao, L. (2013). Firms as surrogate intermediaries: Evidence from emerging economies. Asian Development Bank. [Google Scholar]
- Smith, C. W., & Stulz, R. M. (1985). The determinants of firms’ hedging policies. Journal of Financial And Quantitative Analysis, 20(4), 391–405. [Google Scholar] [CrossRef]
- Somanathan, E., Somanathan, R., Sudarshan, A., & Tewari, M. (2021). The impact of temperature on productivity and labor supply: Evidence from Indian manufacturing. Journal of Political Economy, 129(6), 1797–1827. [Google Scholar] [CrossRef]
- Stein, J. C. (2003). Agency, information and corporate investment. Handbook of the Economics of Finance, 1, 111–165. [Google Scholar]
- Su, K., & Lu, Y. (2023). The impact of corporate social responsibility on corporate financialization. The European Journal of Finance, 29(17), 2047–2073. [Google Scholar] [CrossRef]
- Tan, R., & Lin, B. (2018). What factors lead to the decline of energy intensity in China’s energy intensive industries? Energy Economics, 71, 213–221. [Google Scholar] [CrossRef]
- Wang, J., & Mao, N. (2022). Does financialization of non-financial corporations promote or prohibit corporate risk-taking? Emerging Markets Finance and Trade, 58(7), 1913–1924. [Google Scholar] [CrossRef]
- Wang, S., Meng, H., & Chen, Z. (2025). Exploring the links between bank competition, economic policy uncertainty, and corporate financialization. Finance Research Letters, 78, 107100. [Google Scholar] [CrossRef]
- Wang, Y., Sun, X., & Guo, X. (2019). Environmental regulation and green productivity growth: Empirical evidence on the Porter Hypothesis from OECD industrial sectors. Energy Policy, 132, 611–619. [Google Scholar] [CrossRef]
- Wei, Z. H., Zeng, A. M., & Li, B. (2014). Financial ecological environment and corporate financial constraints—Evidence from Chinese listed firms. Accounting Research, 5, 73–80. [Google Scholar]
- World Economic Forum. (2021). The global risks report 2021. Available online: https://www.weforum.org/reports/the-global-risks-report-2021 (accessed on 2 September 2025).
- Xie, L., & Li, S. (2024). Climate risk and energy-saving technology innovation: Evidence from Chinese prefecture-level cities. Energy Economics, 139, 107917. [Google Scholar] [CrossRef]
- Yang, J., Zhang, M., & Liu, Y. (2020). Carbon information disclosure, environmental regulatory pressure and debt financing cost: Empirical evidence from Chinese listed firms of high-carbon industries. Journal Nanjing Technology University (Social Sciences Editon), 19, 86–98. [Google Scholar]
- Zhao, Y., & Su, K. (2022). Economic policy uncertainty and corporate financialization: Evidence from China. International Review of Financial Analysis, 82, 102182. [Google Scholar] [CrossRef]
- Zhu, J., Tang, Y., Wei, Y., Wang, S., & Chen, Y. (2023). Corporate financialization, financing constraints, and innovation efficiency—Empirical evidence based on listed Chinese pharmaceutical companies. Frontiers in Public Health, 11, 1085148. [Google Scholar] [CrossRef]

Disclaimer/Publisher’s Note: The statements, opinions and data contained in all publications are solely those of the individual author(s) and contributor(s) and not of MDPI and/or the editor(s). MDPI and/or the editor(s) disclaim responsibility for any injury to people or property resulting from any ideas, methods, instructions or products referred to in the content. |
© 2025 by the authors. Licensee MDPI, Basel, Switzerland. This article is an open access article distributed under the terms and conditions of the Creative Commons Attribution (CC BY) license (https://creativecommons.org/licenses/by/4.0/).