Abstract
The FTX collapse marked a significant shock to global crypto markets, prompting concerns about systemic contagion. This paper investigates the dynamic connectedness between cryptocurrencies, DeFi tokens, and tech stocks, focusing on the systemic impact of the FTX collapse. We decompose total, internal, and external connectedness across asset groups using a time-varying parameter VAR model. The results show that post-FTX, Bitcoin and Ethereum intensified their roles as core shock transmitters, while Tether consistently acted as a volatility absorber. DeFi tokens exhibited heightened intra-group spillovers and occasional external influence, reflecting structural fragility. Tech stocks remained largely insulated, with reduced cross-market linkages. Network visualizations confirm a post-crisis fragmentation, characterized by denser internal crypto-DeFi ties and weaker inter-group contagion. These findings have important policy implications for regulators, investors, and system designers, indicating the need for targeted risk monitoring and governance within decentralized finance.
1. Introduction
The rapid evolution of cryptocurrencies and DeFi has redefined the landscape of global financial markets, introducing novel forms of innovation, risk, and market interdependence. At the heart of this transformation, the collapse of the FTX cryptocurrency exchange in November 2022 marked a critical turning point. As one of the most prominent platforms in digital finance, FTX’s abrupt failure unleashed significant volatility, intensified fears of systemic risk, and catalyzed widespread concerns about the fragility and governance of crypto market structures (Bouri et al., 2023; Akyildirim et al., 2023). While previous studies have documented crisis episodes such as the Terra-LUNA crash (Lee et al., 2023; Santiago et al., 2025), the FTX collapse stands apart in terms of its systemic implications and the magnitude of value destruction, prompting renewed scrutiny over the resilience of digital assets and their potential contagion channels.
This study is motivated by two intertwined factors: the unprecedented shock associated with the FTX collapse and the growing systemic importance of digital assets within the broader financial ecosystem. Although research has increasingly examined return spillovers, tail risks, and dynamic connectedness among cryptocurrencies, equities, and alternative digital assets (Xu et al., 2021; Abdullah et al., 2024; Bejaoui et al., 2023), significant gaps remain regarding how shocks within the crypto economy propagate, both internally and across adjacent markets such as technology stocks. While rooted in traditional finance, these tech equities are often sentimentally or thematically correlated with digital innovation trends, including blockchain and Web3 development (Bas et al., 2024; Aharon et al., 2024). Furthermore, existing evidence indicates that crypto-induced shocks may exhibit asymmetric, quantile-dependent effects (Kumar et al., 2022; Ugolini et al., 2023), yet the directionality and persistence of these spillovers, particularly in crisis settings, remain underexplored.
This paper seeks to answer three core research questions: (i) How did the FTX collapse alter the connectedness structure among cryptocurrencies, DeFi tokens, and tech stocks? Do digital assets serve as net transmitters or receivers of shocks during systemic crypto events? To what extent are traditional equity markets insulated from crypto-induced financial turbulence? We employ a time-varying parameter vector autoregression (TVP-VAR) framework to address these questions to estimate dynamic total, partial, inclusive, and exclusive connectedness among nine digital and traditional financial assets. This methodology allows us to capture the dynamic interdependencies and isolate directional volatility flows. Our analysis indicates several novel insights: (i) post-FTX, Bitcoin and Ethereum assumed more dominant roles as net transmitters of volatility; (ii) DeFi tokens experienced heightened instability, with asymmetric and irregular spillovers within the DeFi segment; and (iii) tech stocks exhibited limited vulnerability to crypto-specific shocks.
The contribution of this study is fourfold. First, it systematically applies dynamic, partial, inclusive, and exclusive connectedness methodologies to the combined crypto-DeFi-tech ecosystem during a major crisis. Second, it distinguishes between internal and external sources of connectedness, providing insights into endogenous versus exogenous contagion channels. Third, by isolating the effects of crypto and DeFi shocks from tech sector dynamics, the study sheds light on whether tech stocks act as shock absorbers or transmitters during periods of crypto market stress. Finally, the findings offer important implications for portfolio diversification, systemic risk monitoring, and regulatory oversight in increasingly interconnected financial markets.
The remainder of this paper is organized as follows. Section 2 reviews the existing literature on financial connectedness in the context of cryptocurrencies, DeFi, and equity markets, emphasizing event-driven contagion. Section 3 outlines the data and details the methodological framework, including the TVP-VAR model and the decomposition of connectedness metrics. Section 4 presents empirical findings, highlighting pre- and post-FTX dynamics, group-specific spillovers, and partial interdependencies. Finally, Section 5 concludes the study with key insights, policy implications, and directions for future research.
2. Literature Review
The interconnectedness and contagion dynamics within digital financial ecosystems, especially between cryptocurrencies, DeFi tokens, and traditional equities, have attracted increasing scholarly attention, particularly in light of systemic disruptions such as the collapse of FTX. A growing literature (e.g., Abdullah et al., 2024; Bas et al., 2024; Bejaoui et al., 2023) has applied advanced econometric techniques, including time-varying parameter vector autoregressions (TVP-VAR) and tail-risk models, to examine return spillovers, volatility dependencies, and systemic risk transmission across digital and traditional financial assets.
Several studies explore connectedness within and across asset classes under different market conditions. Abdullah et al. (2024) analyze upside and downside tail-risk transmission between tech-sector tokens and equities, uncovering moderate levels of time-varying connectedness and highlighting the importance of global uncertainty drivers. Similarly, Bas et al. (2024) investigate the relationship between cryptocurrencies, NFTs, and tech stocks, finding strong intra-group but weak inter-group connectedness, even in the presence of structural breaks. These findings suggest that while digital assets form internally cohesive networks, their spillover to traditional markets remains limited under normal conditions. Aharon et al. (2024) expand on this by examining metaverse stocks and tokens, showing that while token fluctuations influence metaverse stocks, the reverse is less significant. Their TVP-VAR-based network analysis positions Bitcoin and Ethereum as pivotal spillover sources. Consistent with this, Bejaoui et al. (2023) document asymmetric, time-varying connectedness between cryptocurrencies, DeFi assets, and emerging stock markets using wavelet coherence, especially around geopolitical and health crises. More recently, the field has broadened in scope and methods: Chen (2025) uses a Bayesian structural VAR with Pandemic Priors (2015–2024) and finds that cryptocurrency price shocks account for sizeable variation in financial markets (≈18% of equities; ≈27% of commodities) and in the price level at longer horizons; a narrative analysis attributes crypto innovations primarily to sentiment and technology shocks. Iyer and Popescu (2023) apply the Diebold and Yilmaz (2012) framework (2014–2022) and show that crypto assets predominantly transmit spillovers to financial markets, with magnitudes rising during COVID peaks. Shahrour et al. (2025) employ TVP-VAR to reveal bidirectional volatility spillovers between leading cryptocurrencies and traditional instruments, identifying NEAR and Bitcoin as major transmitters (≈71.63% and ≈68.17%). Kumah and Baafi (2025) use a frequency-domain spillover index to show high-frequency contagion and limited short-term diversification among major cryptocurrencies. Liu et al. (2024) propose an R2-decomposition that separates contemporaneous from lagged components, reporting stronger contemporaneous dependencies with ETH/BTC as net transmitters and XRP/LINK as net receivers. Vuković et al. (2025) adopt a Bayesian Global VAR to trace globally distributed, but typically short-lived, adverse shocks from crypto into stocks, bonds, FX, and volatility indices.
The FTX collapse in November 2022 triggered a series of empirical inquiries into systemic risk, tail dependence, and contagion. Bouri et al. (2023) show that downside risk spillovers from FTT were most acute for Solana due to staking exposure, while Tether was the most resilient. Esparcia et al. (2024) and Khan et al. (2025) confirm the collapse’s significant effects on volatility and pricing in the crypto market, particularly for major coins like Bitcoin and Ethereum. Galati et al. (2024) find clear evidence of information cascades and cross-exchange contagion following FTX’s downfall. Complementary broader analyses indicate that crypto–financial linkages intensified during COVID peaks (Iyer & Popescu, 2023), underscoring how event context shapes measured spillovers.
Multiple studies indicate that traditional financial markets remained largely insulated despite the internal shock waves. Yousaf et al. (2023) and Conlon et al. (2023) report minimal spillover to equity and energy markets, though investor flight to precious metals was evident. Jalan and Matkovskyy (2023) argue that the FTX crisis reflects governance and regulatory failure more than systemic financial contagion, reinforcing calls for more apparent oversight in crypto markets. The role of stablecoins and DeFi tokens within this systemic dynamic has also been examined. Łęt et al. (2023) and Thanh et al. (2023) highlight the stabilizing function of Tether and USDC during crypto turbulence, though algorithmic stablecoins like DAI show higher instability. Alamsyah and Muhammad (2024) demonstrate the structural segmentation within DeFi networks, where tokens like UNI, DAI, and WBTC serve distinct roles with varying risk implications. Relatedly, Shahrour et al. (2025) identify TBILL and the Grayscale Bitcoin Trust ETF as net receivers of volatility, illustrating heterogeneity in how traditional assets absorb crypto-originated shocks.
Regarding modeling approaches, scholars have increasingly embraced dynamic, high-frequency, and tail-focused tools to capture nonlinear interdependencies. Kumar et al. (2022) and Xu et al. (2021) reveal stronger return and volatility connectedness during crises, particularly among top-tier coins. Barkai et al. (2024) propose a systemic risk model tailored to crypto idiosyncrasies, while Ahelegbey et al. (2021) distinguish between speculative contagion givers like Bitcoin and contagion receivers like Ethereum. Methodological fronts continue to diversify: Chen (2025) embeds crisis-time information via a Bayesian SVAR with Pandemic Priors for crypto–macro identification; Vuković et al. (2025) extend to a multi-country Bayesian GVAR to quantify cross-border diffusion; Kumah and Baafi (2025) reveal frequency-dependent spillovers; and Liu et al. (2024) decompose connectivity into contemporaneous versus lagged components, providing granularity beyond standard time-domain indices.
Finally, research increasingly examines how crypto innovation interacts with traditional finance. Liao et al. (2024) and Ugolini et al. (2023) document time-varying spillovers between DeFi, crypto, stocks, and safe-haven assets, while Katsiampa et al. (2022) and Hoang and Baur (2024) identify Ethereum’s growing influence during the DeFi and NFT boom, suggesting a more complex and evolving systemic profile for second-generation tokens. This body of work sets the stage for our contribution but also indicates gaps in channel attribution across market layers during extreme events. Against this backdrop, our study contributes along three margins: (i) we model an integrated tri-market system: cryptocurrencies, DeFi tokens, and technology equities rather than crypto-only or crypto–macro designs; (ii) we center identification on the FTX collapse (8 November 2022), enabling a direct pre- versus post-FTX comparison that complements COVID-era findings; and (iii) we jointly employ decomposed connectedness (internal vs. external) and partial connectedness (inclusive vs. exclusive) to attribute transmission channels, documenting a post-FTX fragmentation pattern, denser intra-crypto/DeFi ties alongside attenuated cross-market spillovers into tech.
3. Data Description and Research Methodology
3.1. Data Description
This study investigates the dynamic connectedness between cryptocurrencies, DeFi tokens, and technology stocks from October 2020 to December 2024. This timeframe is chosen to capture the emergence and maturation of decentralized finance (DeFi), increased institutional engagement with digital assets, and the systemic shock induced by the collapse of the FTX exchange in November 2022. Prior research highlights how these events marked inflection points in digital finance and significantly influenced volatility spillovers across digital asset markets (Bouri et al., 2023; Esparcia et al., 2024; Khan et al., 2025).
The dataset comprises nine assets grouped into three categories, reflecting their functional significance and market representativeness. The cryptocurrency group includes Bitcoin (BTC), Ethereum (ETH), and Tether (USDT). BTC is selected as the leading indicator of the cryptocurrency market, reflecting aggregate investor sentiment and systemic shocks (Conlon et al., 2023). ETH is included due to its foundational role in supporting DeFi protocols and smart contracts (Katsiampa et al., 2022), while USDT serves as a proxy for liquidity conditions and investor behavior during stress periods, supported by evidence of its stabilizing role and resistance to spillovers (Bouri et al., 2023; Thanh et al., 2023; Łęt et al., 2023).
The DeFi token group comprises Uniswap (UNI), Aave (AAVE), and Chainlink (LINK), which represent decentralized exchange, lending protocols, and oracle networks, respectively. Their selection aligns with Alamsyah and Muhammad (2024), who identified these tokens as foundational to the Ethereum-based DeFi infrastructure, each playing a distinct role in decentralized intermediation. Their active trading and robust market capitalization make them suitable for analyzing volatility transmission within the DeFi space.
The technology sector group includes the NASDAQ-100 ETF (QQQ), Microsoft (MSFT), and Apple (AAPL). These traditional financial assets are selected to explore cross-market contagion and insulation dynamics, as they represent firms with strong exposure to innovation, digital infrastructure, and, in some cases, blockchain-related ventures. Their inclusion enables an assessment of whether shocks within the crypto–DeFi ecosystem are transmitted to broader equity markets, or whether these two domains remain broadly segmented during crises. We intentionally adopt a broad, high-liquidity technology benchmark to test out-of-domain transmission through shared risk-appetite and retail-attention channels, rather than selecting financials where direct balance-sheet linkages could dominate. This design provides a conservative yardstick: if spillovers are limited for QQQ, MSFT, and AAPL, then cross-market transmission to broad equities is likely bounded. We therefore treat any crypto-to-tech spillovers measured here as lower-bound estimates and acknowledge that a banks or fintech basket could exhibit stronger linkages.
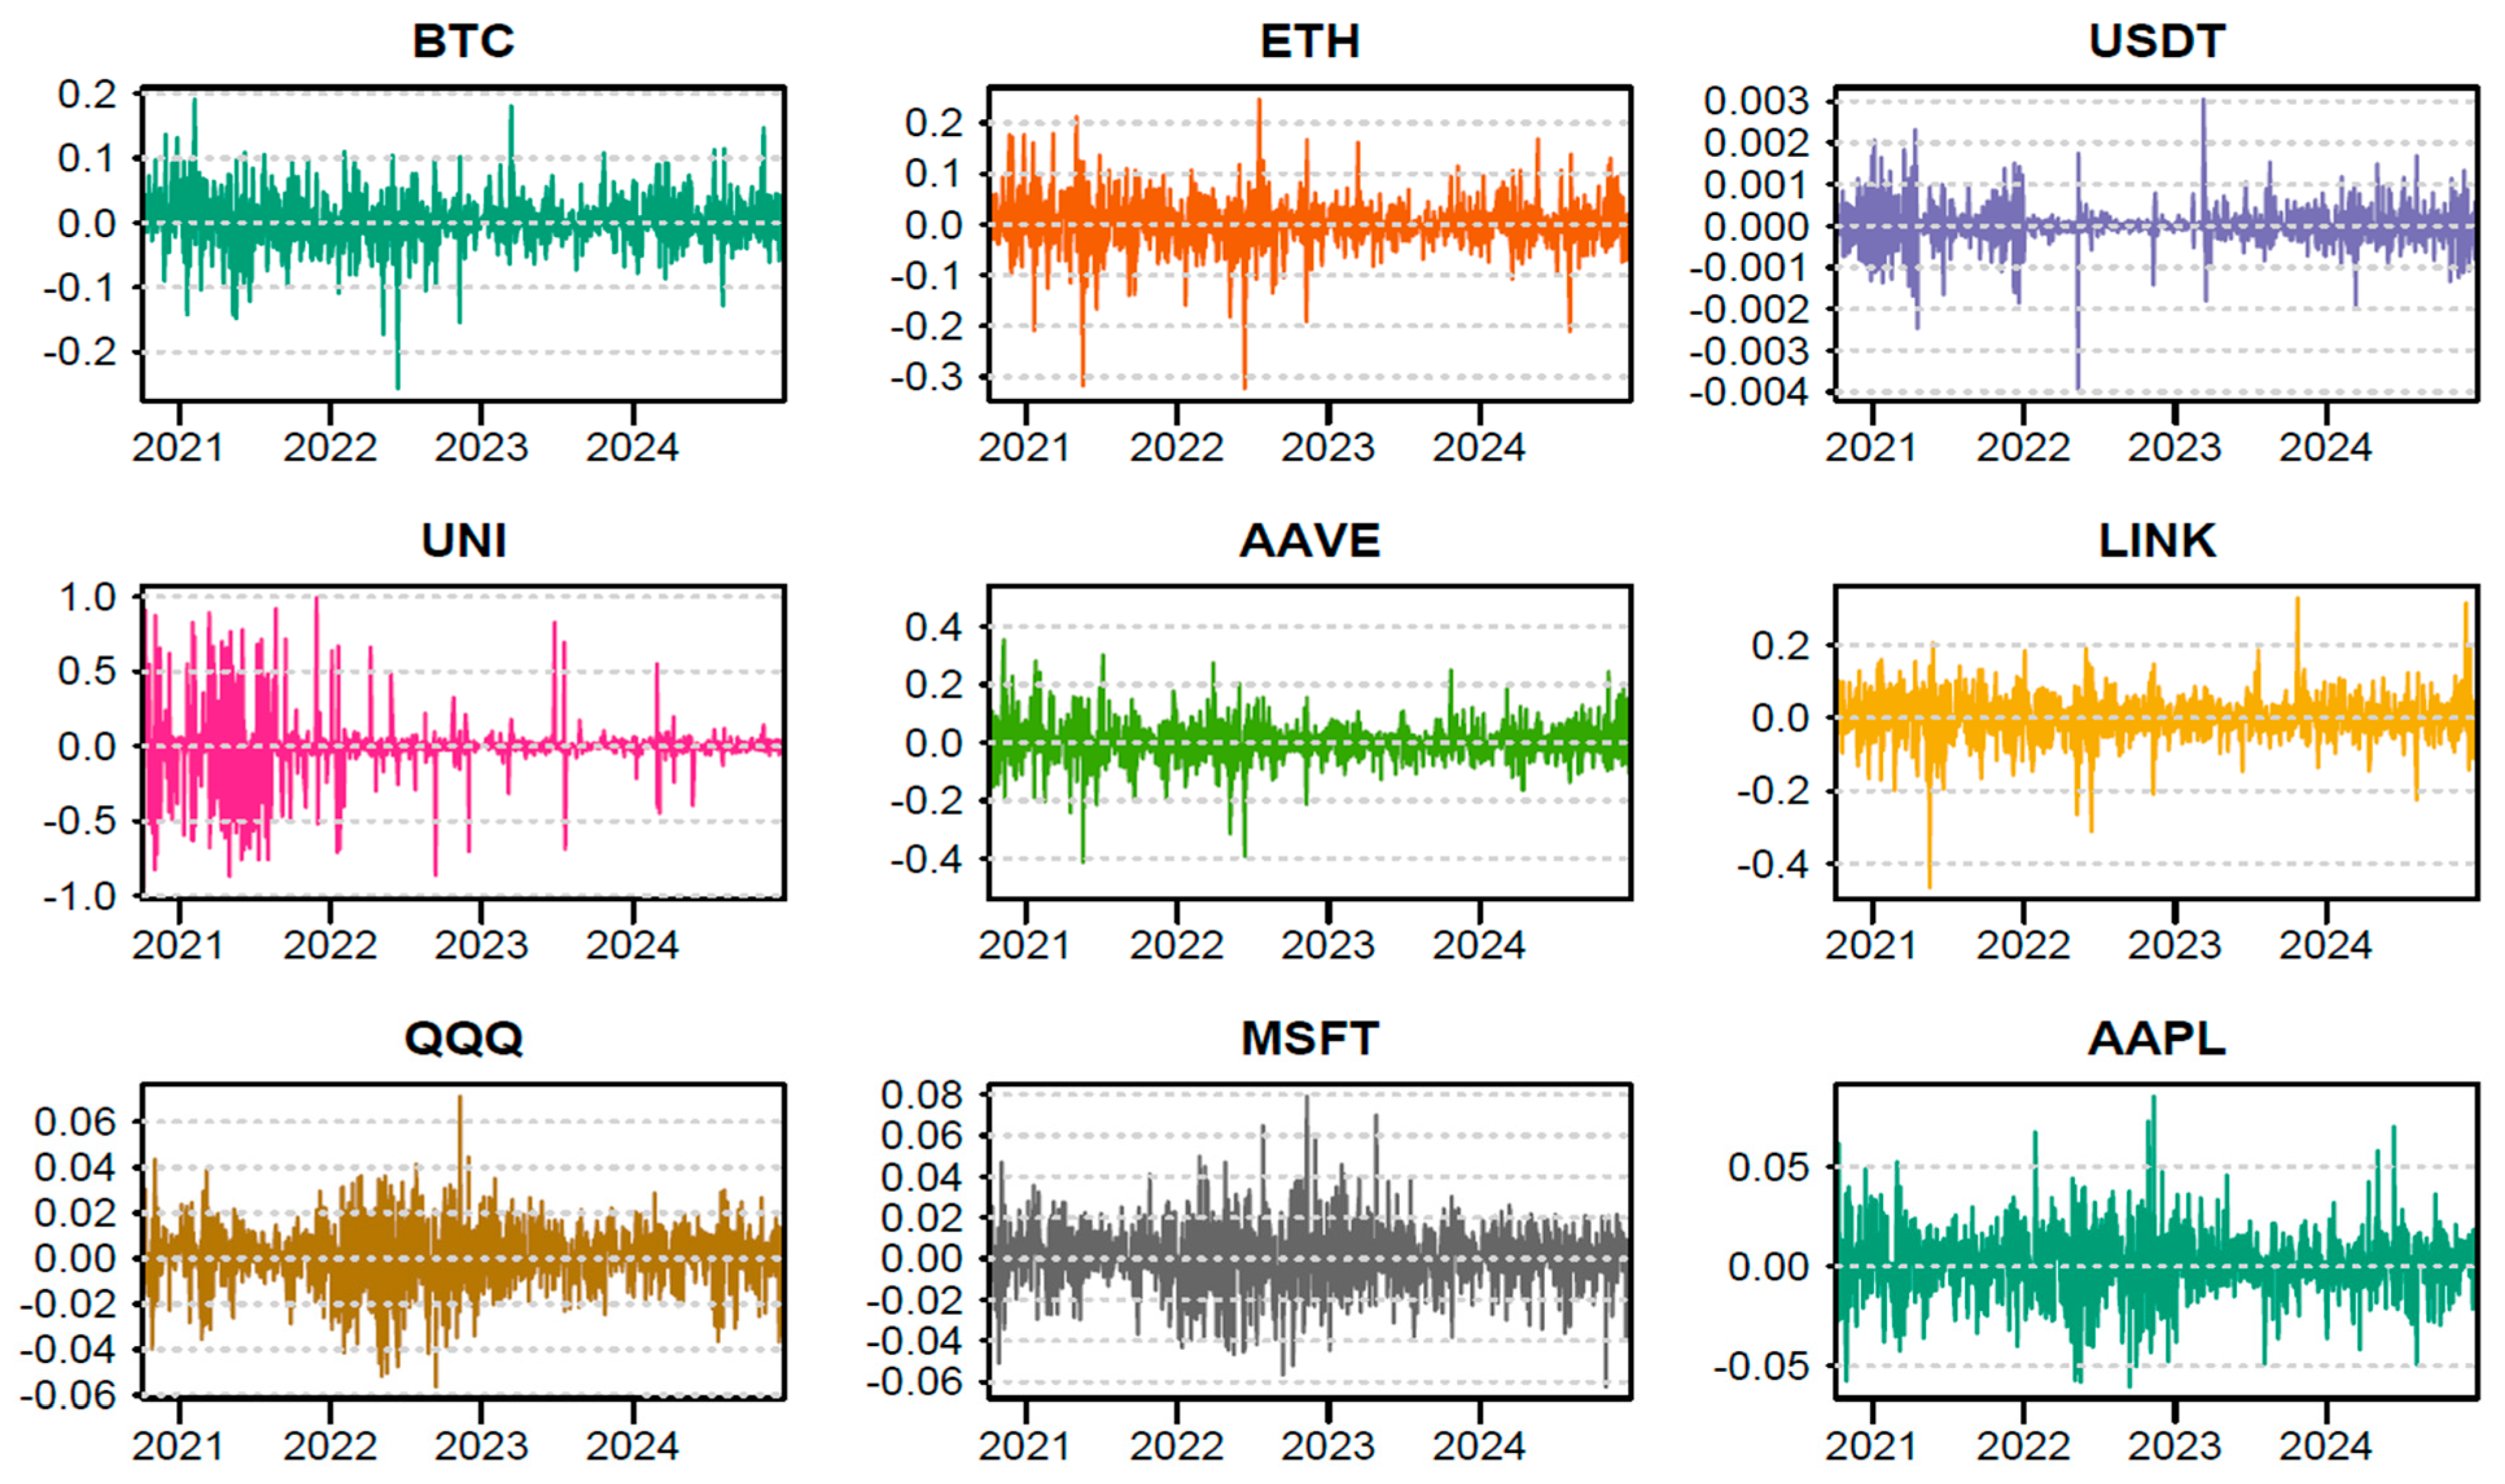
All asset prices are transformed into daily log returns and synchronized by business days to ensure consistent temporal alignment. This preprocessing facilitates accurate estimation of dynamic volatility spillovers and connectedness measures using the TVP-VAR framework. The dataset’s composition ensures a comprehensive and balanced representation of the decentralized-traditional finance interface, enhancing the study’s relevance to systemic risk monitoring, market integration, and portfolio diversification strategies. Figure 1 displays the time series of daily log returns for each of the nine selected assets, categorized into cryptocurrencies (BTC, ETH, USDT), DeFi tokens (UNI, AAVE, LINK), and tech stocks (QQQ, MSFT, AAPL).
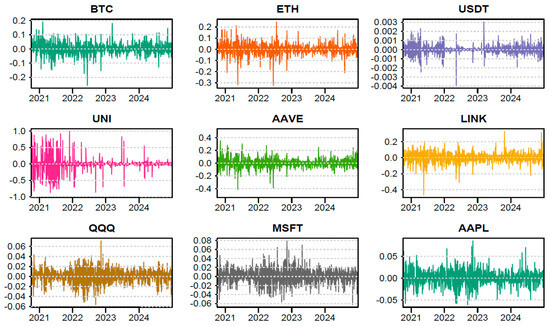
Figure 1.
Daily Log Returns of the Analyzed Assets (2021–2025) Note: This figure displays the time series of daily log returns for each of the nine selected assets, categorized into cryptocurrencies (BTC, ETH, USDT), DeFi tokens (UNI, AAVE, LINK), and tech stocks (QQQ, MSFT, AAPL).
Figure 1 indicates a notable difference in volatility patterns: DeFi tokens exhibit the highest return variability, particularly before 2022, while stablecoin USDT maintains low fluctuation, consistent with its pegged nature. Tech stocks show moderate and relatively stable return behavior. These dynamics inform the connectedness analysis by highlighting the contrasting volatility profiles across asset classes. Table 1 presents summary statistics for the nine selected assets.

Table 1.
Descriptive statistics.
Table 1 indicates that, on average, BTC and ETH exhibit the highest mean returns among the cryptocurrencies, consistent with their dominant market positions. The DeFi tokens, particularly AAVE and UNI, display significantly higher variances, indicating elevated volatility relative to traditional assets and stablecoins. Skewness and kurtosis values reveal substantial departures from normality, with most series exhibiting fat tails and asymmetry, especially for AAVE, which shows extreme kurtosis (662.59) and positive skewness (23.02), reflecting pronounced risk clustering. All assets reject the null hypothesis of normality based on the Jarque–Bera (JB) test at the 1% level. Furthermore, unit root tests (ERS, ADF, PP) confirm stationarity in all return series, satisfying the prerequisites for connectedness analysis using time-varying vector autoregressions.
3.2. Research Methodology
This study employs the decomposed connectedness framework developed by Gabauer and Gupta (2018) to investigate the evolving interconnections between cryptocurrencies, DeFi tokens, and technology stocks. This approach enhances the conventional TVP-VAR connectedness model by decomposing volatility spillovers into internal (within-group) and external (between-group) components. A significant advantage of this method over earlier rolling-window VAR models (e.g., Diebold & Yilmaz, 2012) is that it bypasses the need for selecting arbitrary window sizes, thereby mitigating risks of data smoothing and information loss.
The core contribution of the decomposed approach lies in its ability to capture the dynamics of intra- and inter-group connectedness distinctly. This is especially pertinent in major systemic disruptions such as the FTX collapse, where localized and cross-market contagion may unfold. Accordingly, the framework offers a robust lens to assess whether digital asset shocks remain confined within crypto and DeFi segments or extend to traditional financial assets. The key internal and external connectedness measures are computed as follows:
where denotes the time index, is the forecast horizon, and refers to the mth series variable within group I. The symbol I indicates the number of series within group I, and K is the total number of groups. The terms TO and FROM capture the directional spillovers sent and received, respectively.
Equations (1) and (2) quantify internal dynamics. Specifically, Equation (1) reflects the net directional influence of asset m within its group I, while Equation (2) measures the average total internal connectedness of the group. A positive net value indicates a net transmitter of volatility; a negative value implies a net receiver. Equations (3) and (4) extend the framework to external spillovers. Equation (3) calculates the net transmission from group I to all other groups. A positive (negative) value signals the group is a net contributor (recipient) of external shocks. Equation (4) provides the total external connectedness, averaged across all external linkages.
To enhance the interpretability of group-level dynamics, we incorporate the partial connectedness approach proposed by Chatziantoniou et al. (2023). This framework distinguishes between inclusive and exclusive connectedness. The former includes all pairwise interactions involving the targeted group, while the latter excludes interactions with selected groups, isolating specific transmission channels. The corresponding formulas for partial connectedness are:
Equations (5) and (6) capture the net and total inclusive connectedness, considering all series in the whole system. quantifies the net directional spillovers from series i to all other series, while reflects the overall level of inclusive connectedness in the system at time .
Equations (7) and (8) isolate the exclusive connectedness by removing the influence of a selected group. This differentiation enables clearer attribution of volatility transmission and helps reveal which assets or groups play systemic roles under specific scenarios. Equation (8) defines as the total exclusive connectedness, which represents the average spillovers among series while omitting interactions with the excluded group. The terms and correspond to the pairwise connectedness measures in the inclusive and exclusive frameworks, respectively. In practical terms, inclusive connectedness captures the overall interconnectedness across the full system, reflecting broader market dynamics. Conversely, exclusive connectedness isolates specific transmission channels by removing the influence of selected variables, enabling a more targeted analysis of spillover effects.
4. Empirical Results
4.1. Static Average Connectedness
Table 2 provides a comprehensive view of the average connectedness among cryptocurrencies, DeFi tokens, and tech stocks before and after the FTX collapse on 8 November 2022.

Table 2.
Average connectedness before and after the FTX collapse.
The results from Table 2 indicate meaningful shifts in market interdependencies in response to this systemic crypto event. Notably, while the own-variable connectedness for major cryptocurrencies such as Bitcoin (BTC) and Ethereum (ETH) remained high, their total “TO” connectedness values increased post-collapse (BTC: 67.00 to 82.21; ETH: 79.42 to 83.05), suggesting that these assets transmitted more volatility to the rest of the market after the shock. This rise in spillover effects points to the growing systemic role of cryptocurrencies in cross-asset risk propagation. Conversely, USDT’s connectedness remained relatively stable, consistent with its role as a stablecoin with limited speculative influence.
A particularly striking finding is the sharp increase in outward spillovers from DeFi tokens—especially Uniswap (UNI), which saw its FROM connectedness double from 14.89 to 30.92. This suggests that market participants may have reassessed the risk and interdependence of DeFi projects following the FTX failure, leading to heightened volatility transmission within this segment. The increase in inclusive connectedness from DeFi tokens also reflects their deeper integration into the broader crypto-financial ecosystem, likely due to elevated uncertainty, unwinding of liquidity pools, or repricing of protocol risks. In contrast, tech stocks such as QQQ, MSFT, and AAPL generally exhibited a modest decline in their FROM connectedness post-collapse, indicating that they became somewhat less sensitive to external shocks from the crypto domain. This reinforces the narrative that the FTX collapse represented a localized shock within digital asset markets, with limited direct contagion to traditional equity sectors.
From a net connectedness perspective, BTC and ETH became stronger net transmitters of volatility after the collapse, highlighting their central roles in the crypto volatility network. Interestingly, AAVE flipped from being a net receiver (−4.85) to a marginal transmitter (0.17), possibly reflecting shifts in perceived protocol-specific risks or changes in investor behavior toward lending platforms. The Total Connectedness Index (TCI) rose slightly post-FTX (from 60.32/53.62 to 61.29/54.48), indicating a mild increase in overall systemic connectedness. To conclude, Table 2 demonstrates how the collapse of a major centralized exchange led to a significant reconfiguration of volatility flows, with decentralized finance and core crypto assets at the epicenter of post-shock adjustments, while traditional tech stocks remained relatively insulated.
4.2. Partial Connectedness
Table 3 highlights how partial net connectedness across key asset groups, cryptocurrencies, DeFi tokens, and tech stocks shifted in response to the FTX collapse, isolating the unique spillover effects net of joint influences.

Table 3.
Partial connectedness before and after the FTX Collapse.
Table 3 indicates that, before the collapse, Bitcoin (BTC) and Ethereum (ETH) held contrasting roles within the cryptocurrency group: BTC was a slight net receiver of intra-crypto shocks (−1.00), while ETH acted as a net transmitter (4.19). Interestingly, both shifted closer to neutrality post-collapse (BTC: 3.28, ETH: 3.17), indicating a rebalancing of volatility dynamics among crypto leaders. In contrast, USDT’s role as a net receiver deepened from −3.20 to −6.45, reinforcing its behavior as a passive asset rather than an initiator of market spillovers, consistent with its role as a stablecoin designed to absorb rather than transmit shocks.
Within the DeFi segment, a key insight is the reversal of roles among the tokens. Before the collapse, all three, UNI, AAVE, and LINK, played different roles, but LINK emerged as a net transmitter (1.85). At the same time, UNI became a stronger net receiver (−3.60), suggesting that investors increasingly perceived LINK as a source of spillover risk, possibly due to its stronger market adoption or liquidity. AAVE also flipped from net receiver (−1.01) to mild transmitter (1.75), implying a reevaluation of its risk profile post-event. The asymmetry of these shifts reflects a differentiated response among DeFi protocols to systemic stress events.
Tech stocks revealed a notable divergence in behavior. QQQ acted as a consistent net transmitter, with its net connectedness increasing from 5.66 to 7.12, suggesting its growing influence despite the crypto shock. In contrast, Microsoft (MSFT) and Apple (AAPL) remained net receivers, with their post-FTX metrics deteriorating slightly (MSFT: −1.88, AAPL: −5.24). This pattern supports the interpretation that while broader tech indices absorbed and transmitted some volatility, individual mega-cap stocks became marginally more insulated or reactive to crypto-originated shocks.
Finally, the Net External connectedness row encapsulates the net directional spillovers from each asset to the broader system, excluding self-group effects. Most assets exhibit modest changes in this measure, but BTC (from 3.83 to 10.39) and ETH (from 8.18 to 10.51) showed significant increases, indicating their rising importance as volatility transmitters beyond the crypto domain. Meanwhile, the From column total (from 32.05/28.49 to 31.59/28.08) suggests a slight decline in overall external exposure post-collapse, which may indicate partial segmentation of asset classes after the shock. Table 3 demonstrates that the FTX collapse did not merely amplify volatility; It reshaped the structure of partial connectedness across asset groups, amplifying specific transmission channels while weakening others, especially within DeFi and between crypto and traditional tech assets.
4.3. Inclusive and Exclusive Connectedness
Table 4 illustrates the directional influence of individual assets through the lens of inclusive and exclusive connectedness before and after the FTX collapse. The net inclusive connectedness values measure how much each asset transmits volatility to the rest of the system, including its own group, while the net exclusive values isolate an asset’s spillover beyond its own group. This distinction is crucial in understanding whether an asset’s systemic relevance is internal (within-group) or external (across groups).

Table 4.
Inclusive and exclusive connectedness before and after the FTX Collapse.
Table 4 indicates that Bitcoin (BTC) and Ethereum (ETH) emerged as increasingly influential volatility transmitters post-FTX, with BTC’s net inclusive value rising sharply from 2.83 to 13.67 and ETH maintaining a similarly high level (13.67). This implies that these core assets sustained their systemic roles and expanded their influence, likely as liquidity repositioned toward perceived safe-haven cryptos. Meanwhile, USDT remained a net receiver throughout, with its net inclusive value falling further to −10.28, reinforcing its role as a passive stabilizing asset during crisis periods.
In the DeFi segment, results are more mixed. UNI and AAVE saw negative net inclusive values before and after the collapse, suggesting they absorbed more volatility than they transmitted. However, LINK exhibited a notable shift: its net inclusive value fell from 1.93 to −3.03, implying that it became a stronger net receiver of volatility post-collapse. Interestingly, exclusive connectedness measures reveal that AAVE and LINK were net transmitters beyond their group after the collapse, most notably, AAVE flipped from a net external receiver (−3.46) to a net external transmitter (2.40). This indicates that the DeFi category, particularly AAVE, may have contributed to broader system-wide volatility propagation despite its weak internal standing.
For tech stocks, the picture is relatively muted but informative. QQQ, MSFT, and AAPL maintained negative net inclusive values, showing they were still largely net receivers of total market spillovers. However, exclusive connectedness tells a different story: QQQ maintained a high and stable external transmission role (from 7.67 to 7.48), reflecting its position as a broad tech sector benchmark. In contrast, MSFT shifted from a slight net external transmitter (0.48) to a receiver (−2.06), while AAPL’s already negative value worsened, from −3.63 to −5.42, suggesting growing sensitivity to external shocks.
Overall, the inclusive connectedness “FROM” totals decreased slightly (from 33.77 to 30.02), and so did the exclusive “FROM” measures (from 27.53 to 24.47), pointing to a marginal decline in system-wide outward spillovers post-FTX. This could reflect a post-crisis dampening of cross-asset transmission as markets stabilized, even as certain core assets like BTC and ETH became more dominant sources of within-group volatility. The combined view provided by Table 4 indicates how the FTX event reshaped the topology of connectedness: it reinforced the leadership of core crypto assets, realigned DeFi transmission channels, and left tech stocks relatively insulated in their roles as net recipients of volatility.
4.4. Dynamic Total, Internal, and External Connectedness
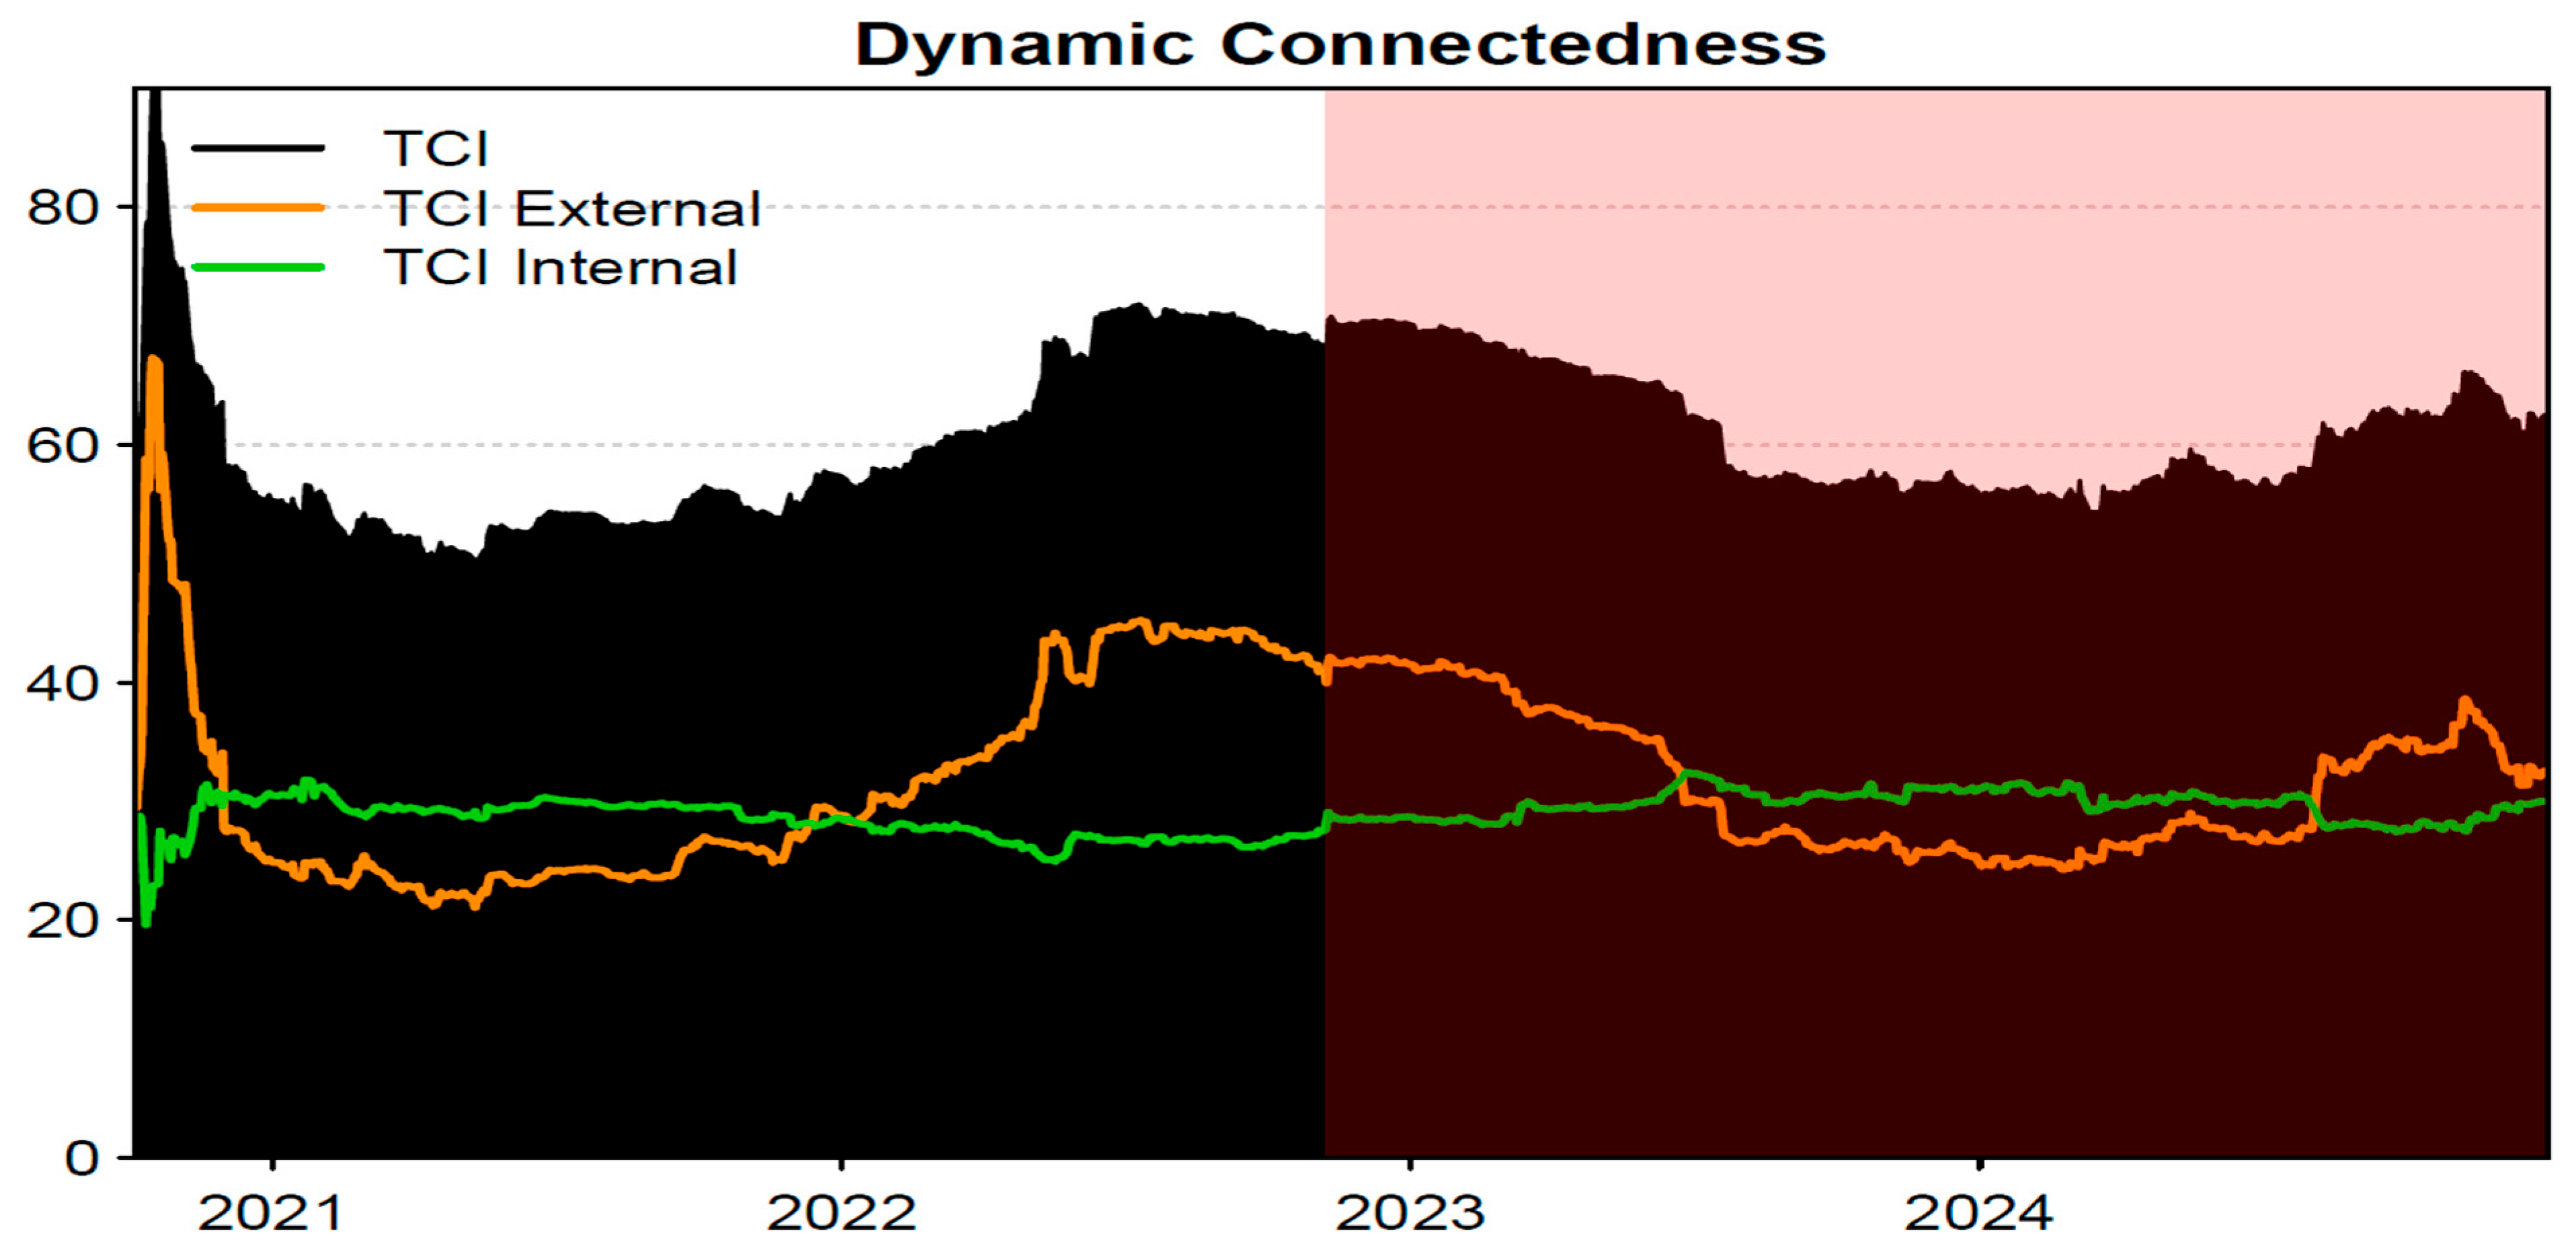
Figure 2 illustrates the evolution of total connectedness (black), internal connectedness (green), and external connectedness (orange) among cryptocurrencies, DeFi tokens, and tech stocks from October 2020 to December 2024. The vertical shading delineates the FTX collapse in November 2022, providing a natural break to examine pre- and post-crisis dynamics.
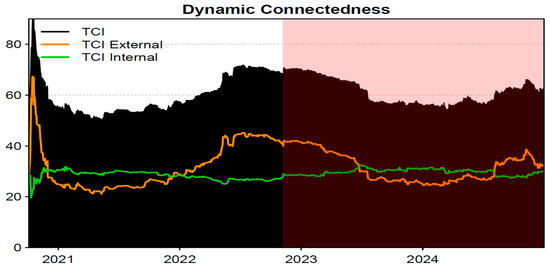
Figure 2.
Dynamic Total, Internal, and External Connectedness. Note: This figure presents the time-varying total connectedness index (TCI, black), internal connectedness within asset groups (green), and external connectedness across groups (orange) estimated using a TVP-VAR framework. The shaded area denotes the post-FTX collapse period, starting November 2022.
Before the FTX collapse, external connectedness consistently dominated internal spillovers, indicating strong volatility transmission across asset classes. This pattern reflects a period of intensified systemic interlinkages, where digital assets and traditional financial markets exhibited elevated cross-market dependencies. The rise in external connectedness around mid-2022 aligns with mounting macro-financial pressures and the lead-up to FTX’s failure, highlighting a broader contagion channel that extended beyond crypto-native domains.
Following the collapse, a marked shift occurs. External connectedness declines steadily, while internal connectedness maintains a relatively stable trajectory. This divergence signals a fragmentation of the risk propagation network, and volatility shocks became increasingly concentrated within asset classes rather than spreading across them. While severe, the decline in external spillovers implies that the FTX shock led to a retrenchment of market linkages and a partial decoupling of the crypto–DeFi segment from tech equity markets. This is consistent with Yousaf et al. (2023), who document muted reactions in traditional equity markets during the FTX fallout.
Interestingly, internal connectedness remains resilient post-collapse, indicating persistent intra-group volatility dependencies. The sustained level of within-group spillovers, particularly in the crypto and DeFi segments, suggests that investor responses and liquidity reallocations occurred primarily within the digital asset ecosystem rather than across the broader financial system. The result aligns with findings by Bouri et al. (2023) and Galati et al. (2024), who emphasize the localized nature of post-FTX contagion.
4.5. Dynamic Internal Connectedness
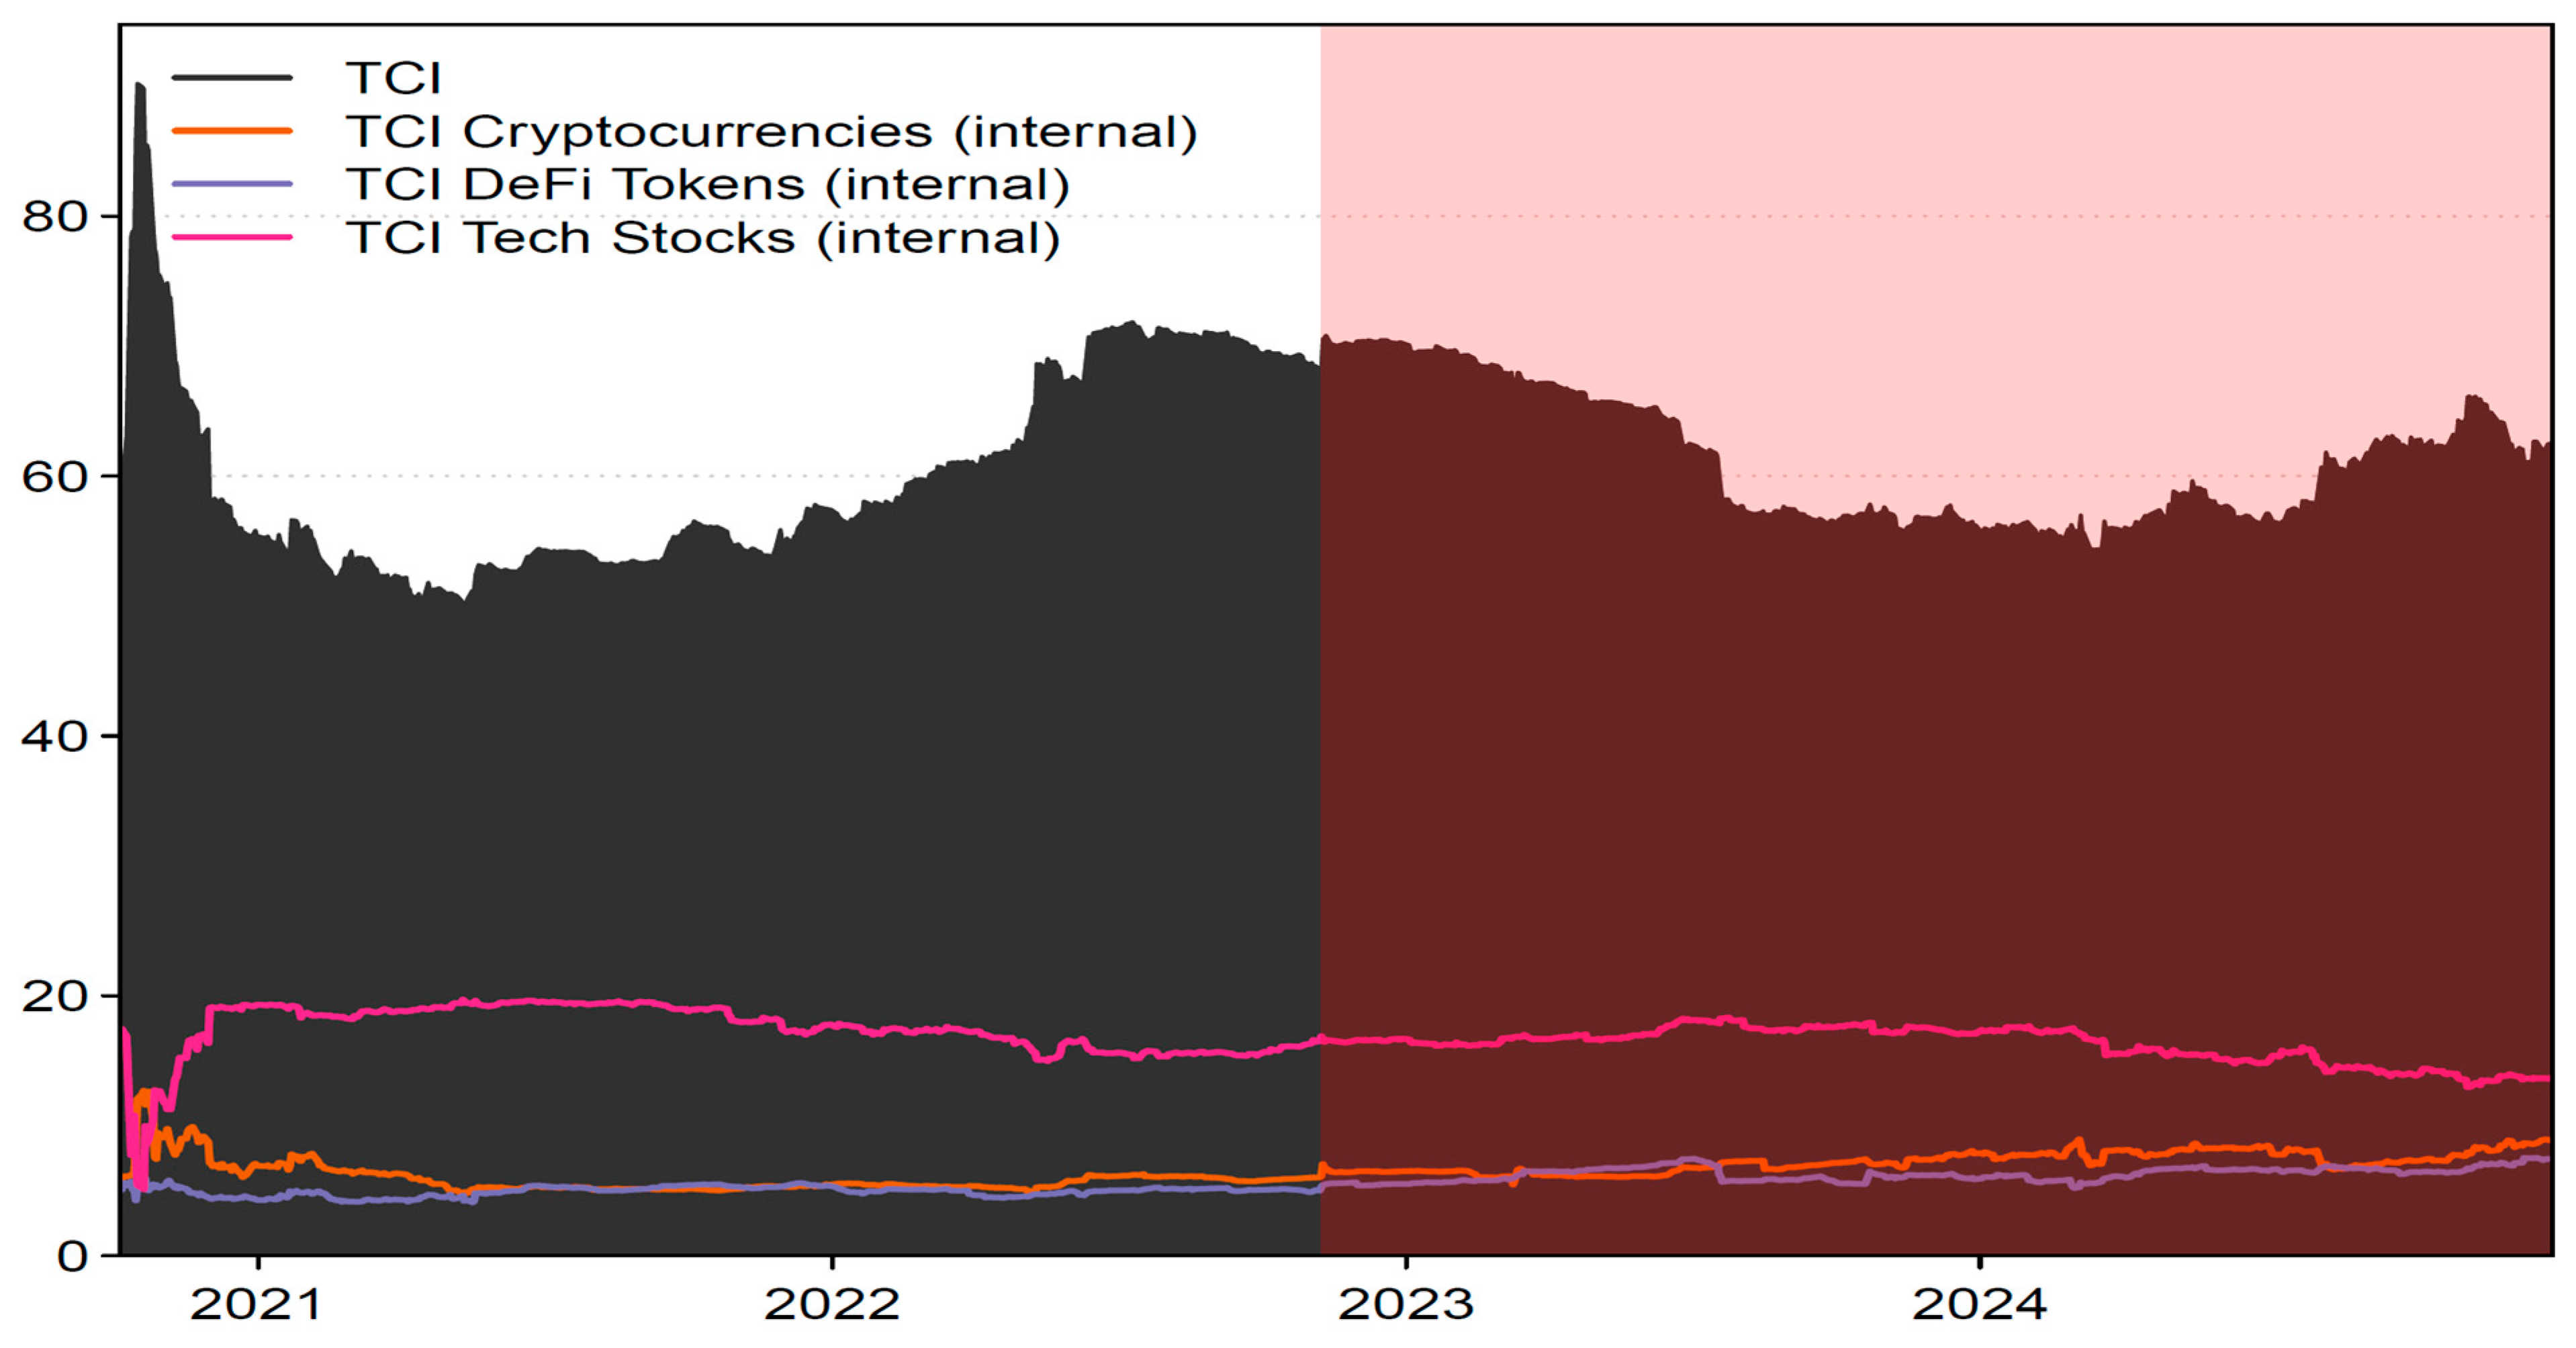
Figure 3 illustrates the evolution of total connectedness within each asset group, cryptocurrencies, DeFi tokens, and tech stocks, alongside the overall total connectedness index (TCI) from 2020 to 2024, with the post-FTX period shaded in red.
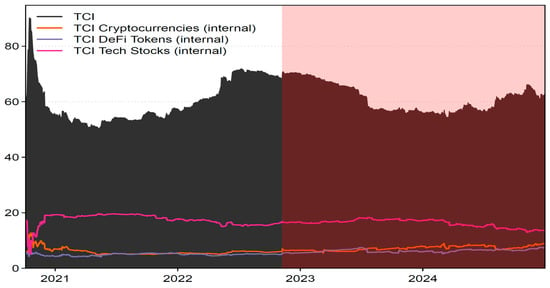
Figure 3.
Group-Specific Total Connectedness: Cryptocurrencies, DeFi Tokens, and Tech Stocks. Note: This figure illustrates the time-varying total connectedness within each asset group, cryptocurrencies (orange), DeFi tokens (purple/blue), and tech stocks (magenta), and the overall total connectedness index (TCI, black). The post-FTX collapse period is shaded.
Before the FTX collapse, tech stocks (magenta line) consistently exhibited the highest internal connectedness among the three groups, reflecting their relatively stable and integrated market dynamics. This internal cohesion remained largely unaffected by the FTX shock, suggesting that traditional tech equities remained insulated from systemic volatility originating in digital finance. In contrast, cryptocurrencies (orange) and DeFi tokens (purple/blue) exhibit gradual increases in their internal connectedness following the FTX collapse, but the rise is not dramatic. This mild upward trend may reflect a slow rebuilding of interdependence within each segment as the market adjusts to new risk perceptions. However, tech stocks (magenta) maintain the highest within-group connectedness throughout the sample, though their internal spillovers decline modestly post-FTX, suggesting a gradual decoupling from digital asset volatility.
The overall TCI (black area) remained relatively elevated post-FTX period. However, its composition increasingly reflected heightened intra-group spillovers within the crypto and DeFi segments, rather than cross-group transmission. This suggests that the FTX collapse intensified systemic interlinkages within digital asset classes, without significantly spilling over into the traditional tech equity space. Figure 3 illustrates the asymmetric connectedness dynamics across asset classes: crypto-native assets, both cryptocurrencies and DeFi tokens, became more interdependent internally, potentially amplifying vulnerability within those segments. In contrast, tech equities preserved their structural isolation, indicating resilience and limited exposure to crypto-induced systemic stress during the FTX fallout.
4.6. Dynamic Inclusive and Exclusive Connectedness
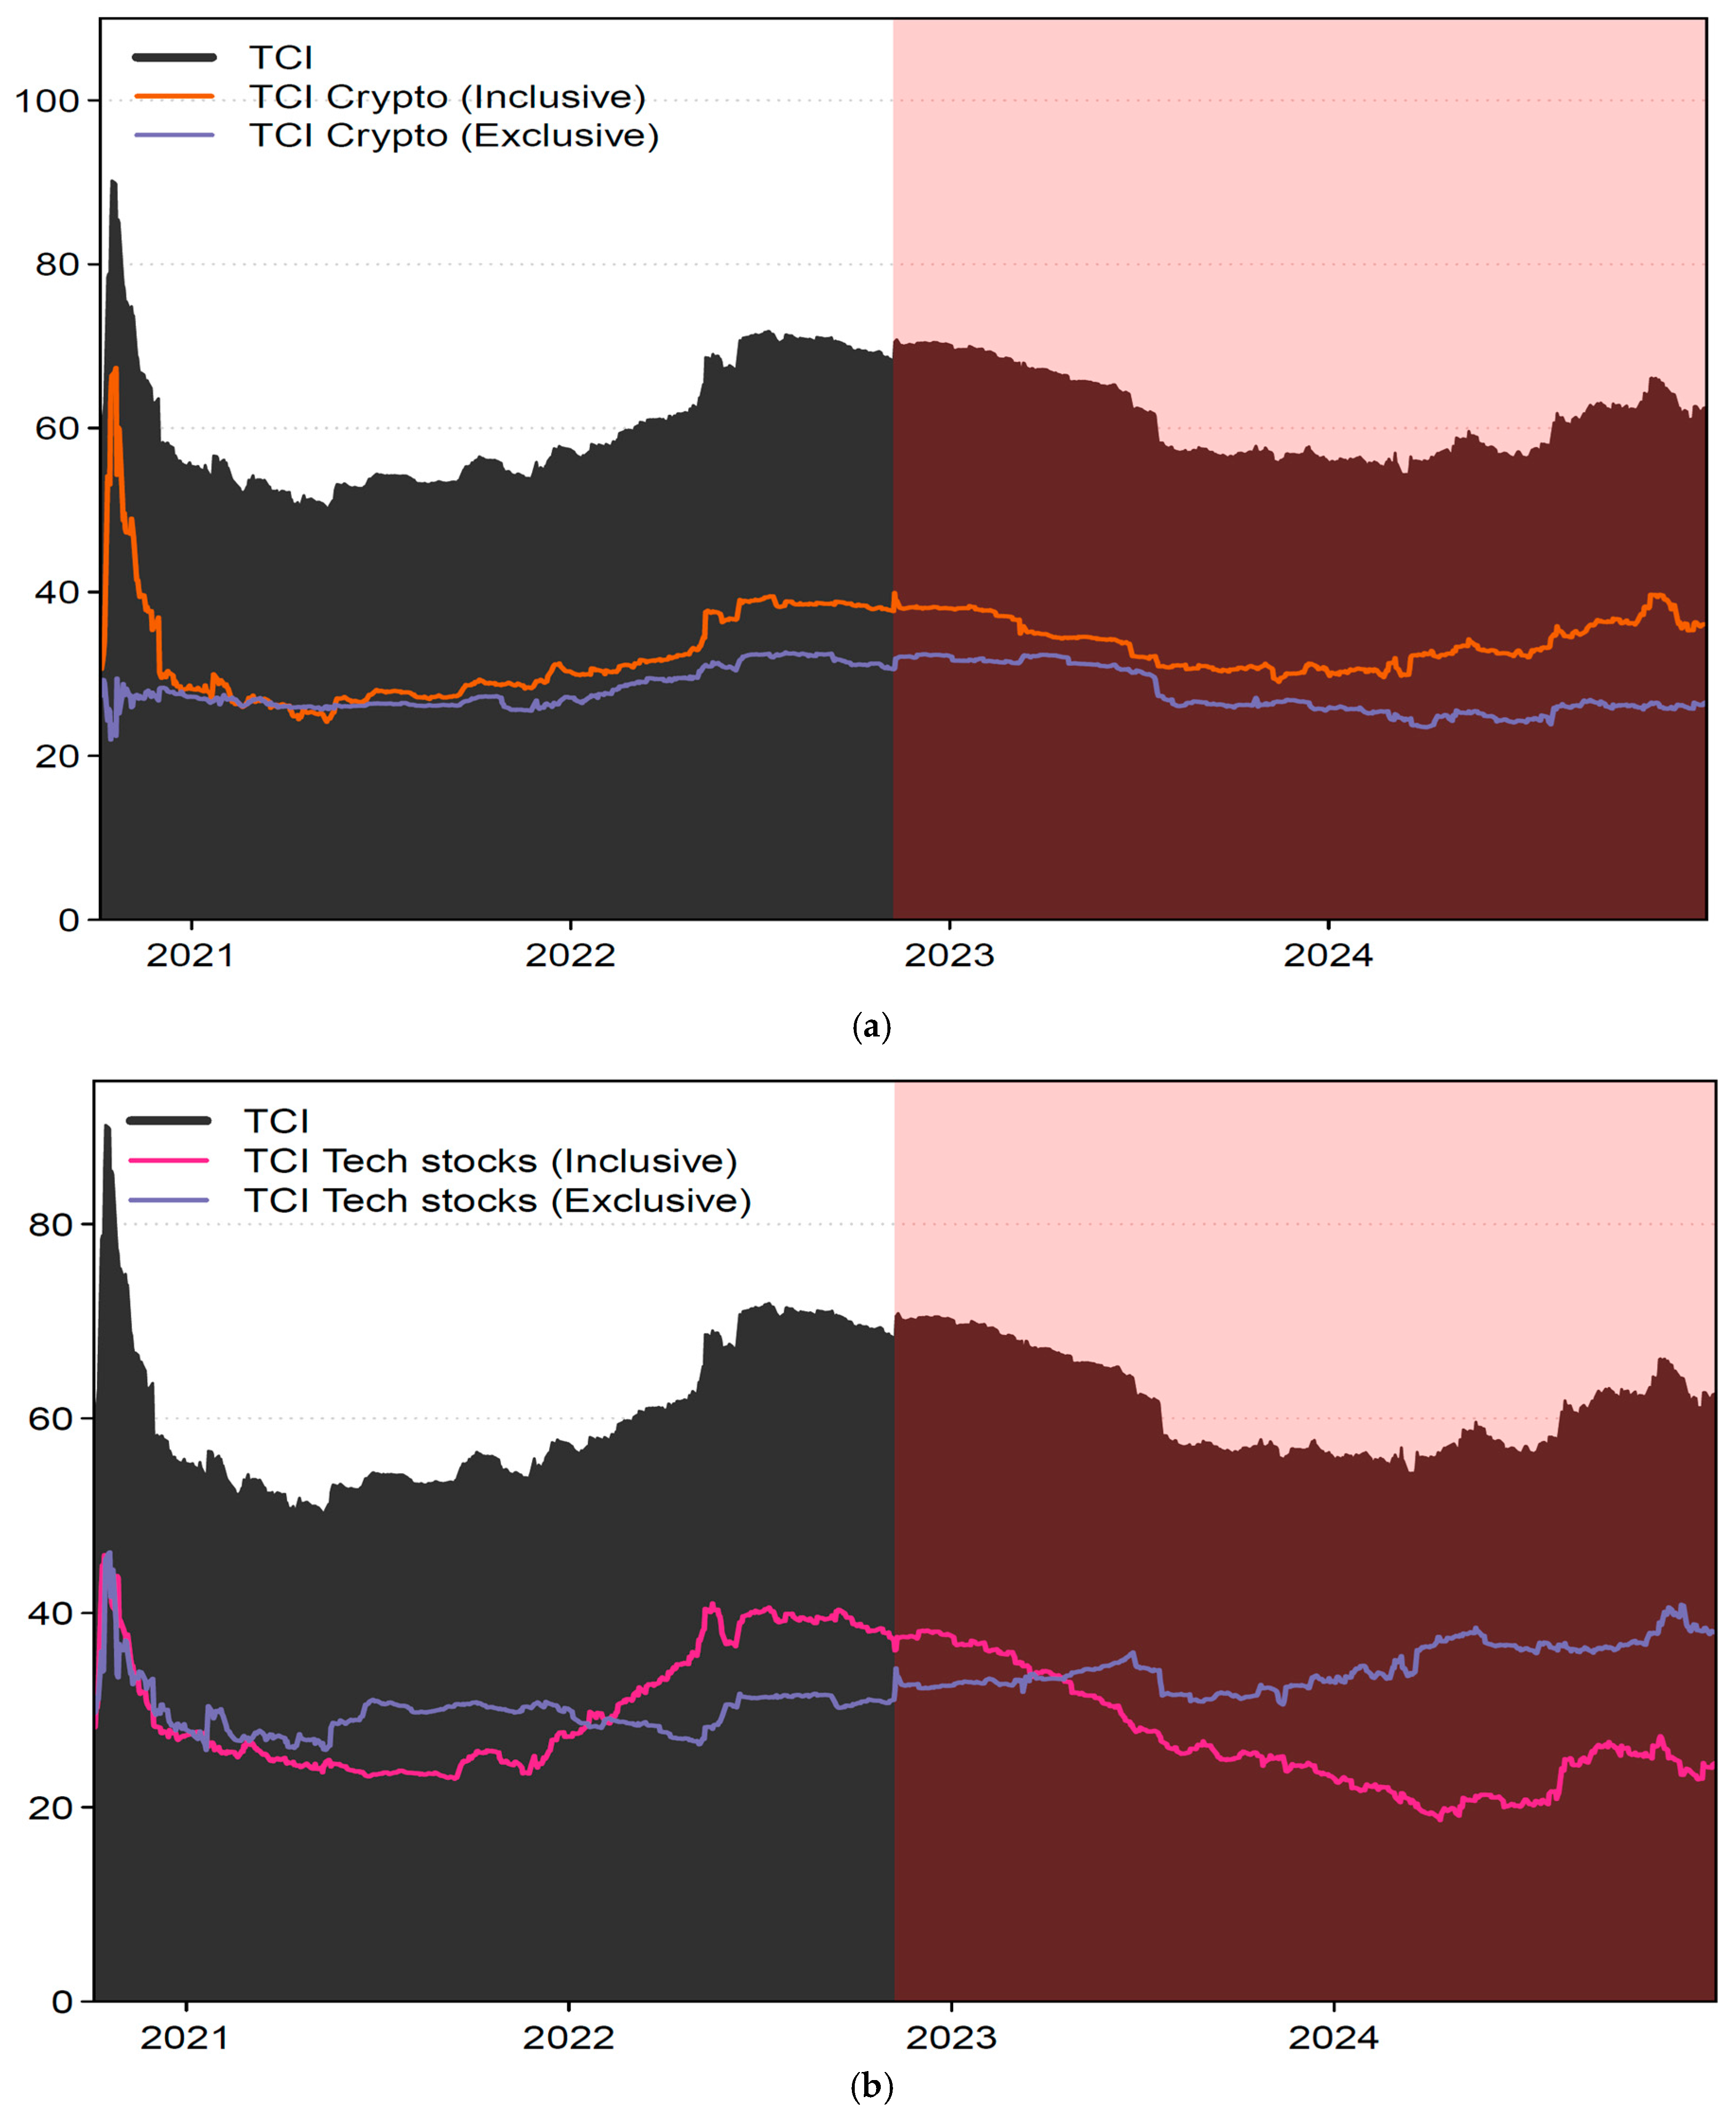
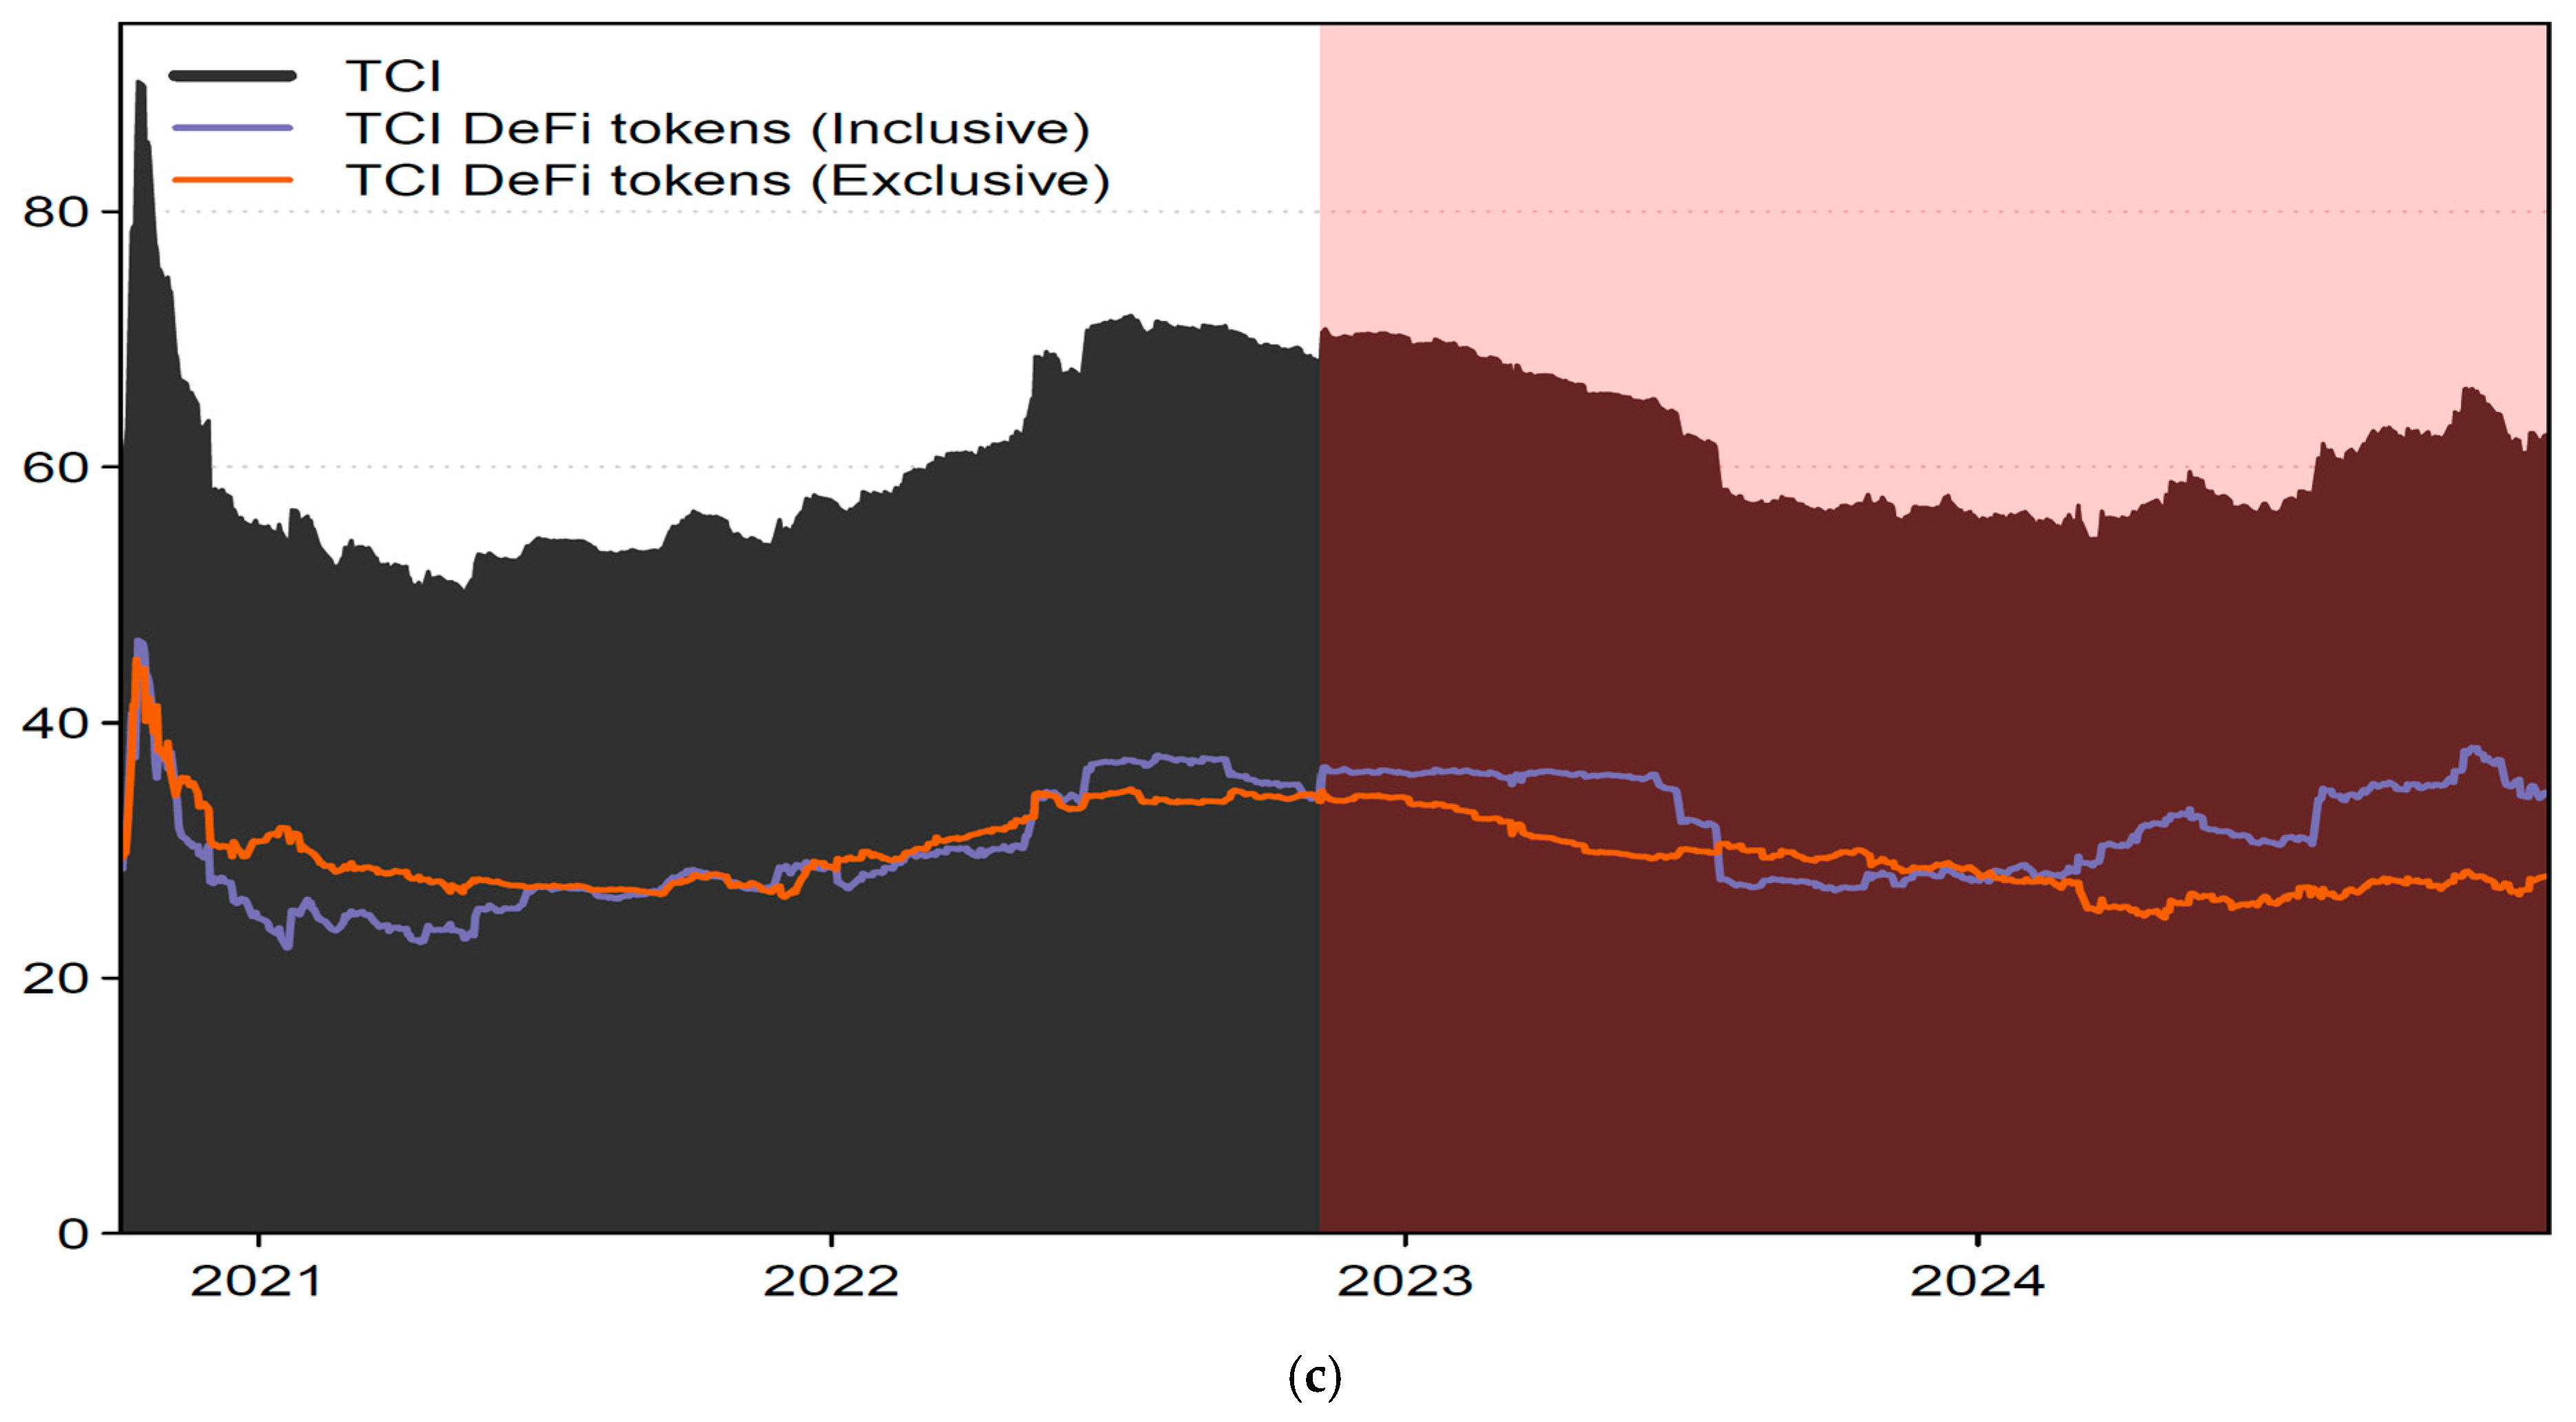
Figure 4a–c provide a more granular lens on how connectedness dynamics evolved within and across asset groups by decomposing total connectedness into inclusive and exclusive measures.
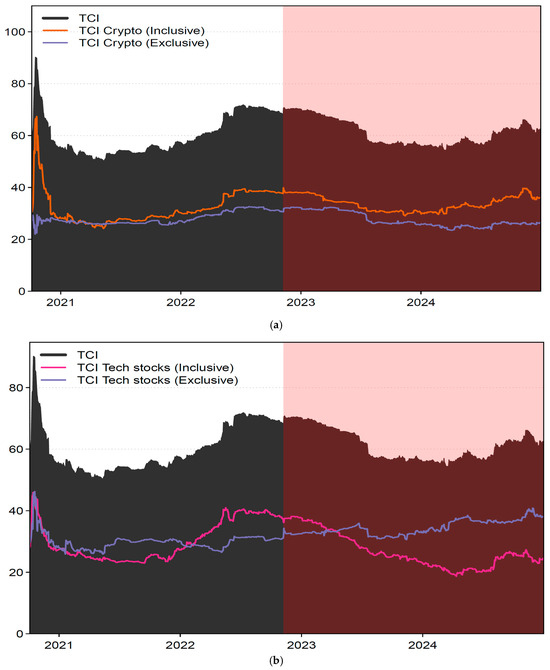
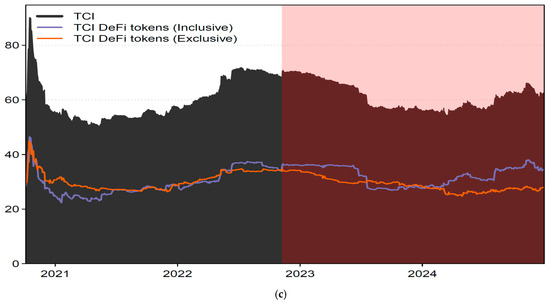
Figure 4.
(a) Dynamic Inclusive and Exclusive Connectedness—Cryptocurrencies. This figure illustrates the evolution of total connectedness within the cryptocurrency group (inclusive) and between crypto assets and other groups (exclusive) over time. The shaded region marks the post-FTX period. (b) Dynamic Inclusive and Exclusive Connectedness—Tech Stocks. This figure plots the inclusive and exclusive connectedness of the tech stock group, capturing intra-group transmission and spillovers to/from other groups, respectively. The post-FTX regime is highlighted. (c) Dynamic Inclusive and Exclusive Connectedness—DeFi Tokens. This figure displays the total connectedness measures for DeFi tokens, both internally (inclusive) and externally (exclusive), capturing the evolution of systemic relevance across the sample period. The post-FTX period is shaded.
In Figure 4a, the cryptocurrency group demonstrates a notable post-FTX divergence between inclusive and exclusive connectedness. Inclusive connectedness rises steadily, indicating tighter internal feedback loops within the crypto ecosystem, likely driven by synchronized movements among Bitcoin, Ethereum, and Tether. In contrast, exclusive connectedness (i.e., crypto’s influence beyond its group) declines slightly post-collapse, suggesting a retrenchment of crypto’s systemic footprint relative to external markets. This pattern implies that while crypto became more self-reinforcing internally, its volatility transmission to broader asset classes weakened after FTX.
Figure 4b indicates an opposite dynamic for tech stocks. Before the FTX collapse, inclusive connectedness among tech stocks (Microsoft, Apple, QQQ) was relatively stable and elevated. However, post-collapse, inclusive connectedness declines while exclusive connectedness increases, suggesting that tech equities, although less volatile internally, became more exposed to volatility transmitted from other markets, particularly crypto. This shift points to a growing sensitivity of traditional equities to systemic risk in the digital asset ecosystem, albeit through indirect channels.
Figure 4c shows that DeFi tokens experience rising inclusive connectedness after the FTX collapse, confirming intensified internal co-movements, possibly due to market fragmentation and structural vulnerabilities exposed by the crisis. However, their exclusive connectedness remains largely stable, indicating that DeFi’s external impact on other markets remained limited. This decoupling supports the view that DeFi remains a largely self-contained submarket, with growing internal contagion but limited outward transmission.
4.7. Net Total Directional Connectedness
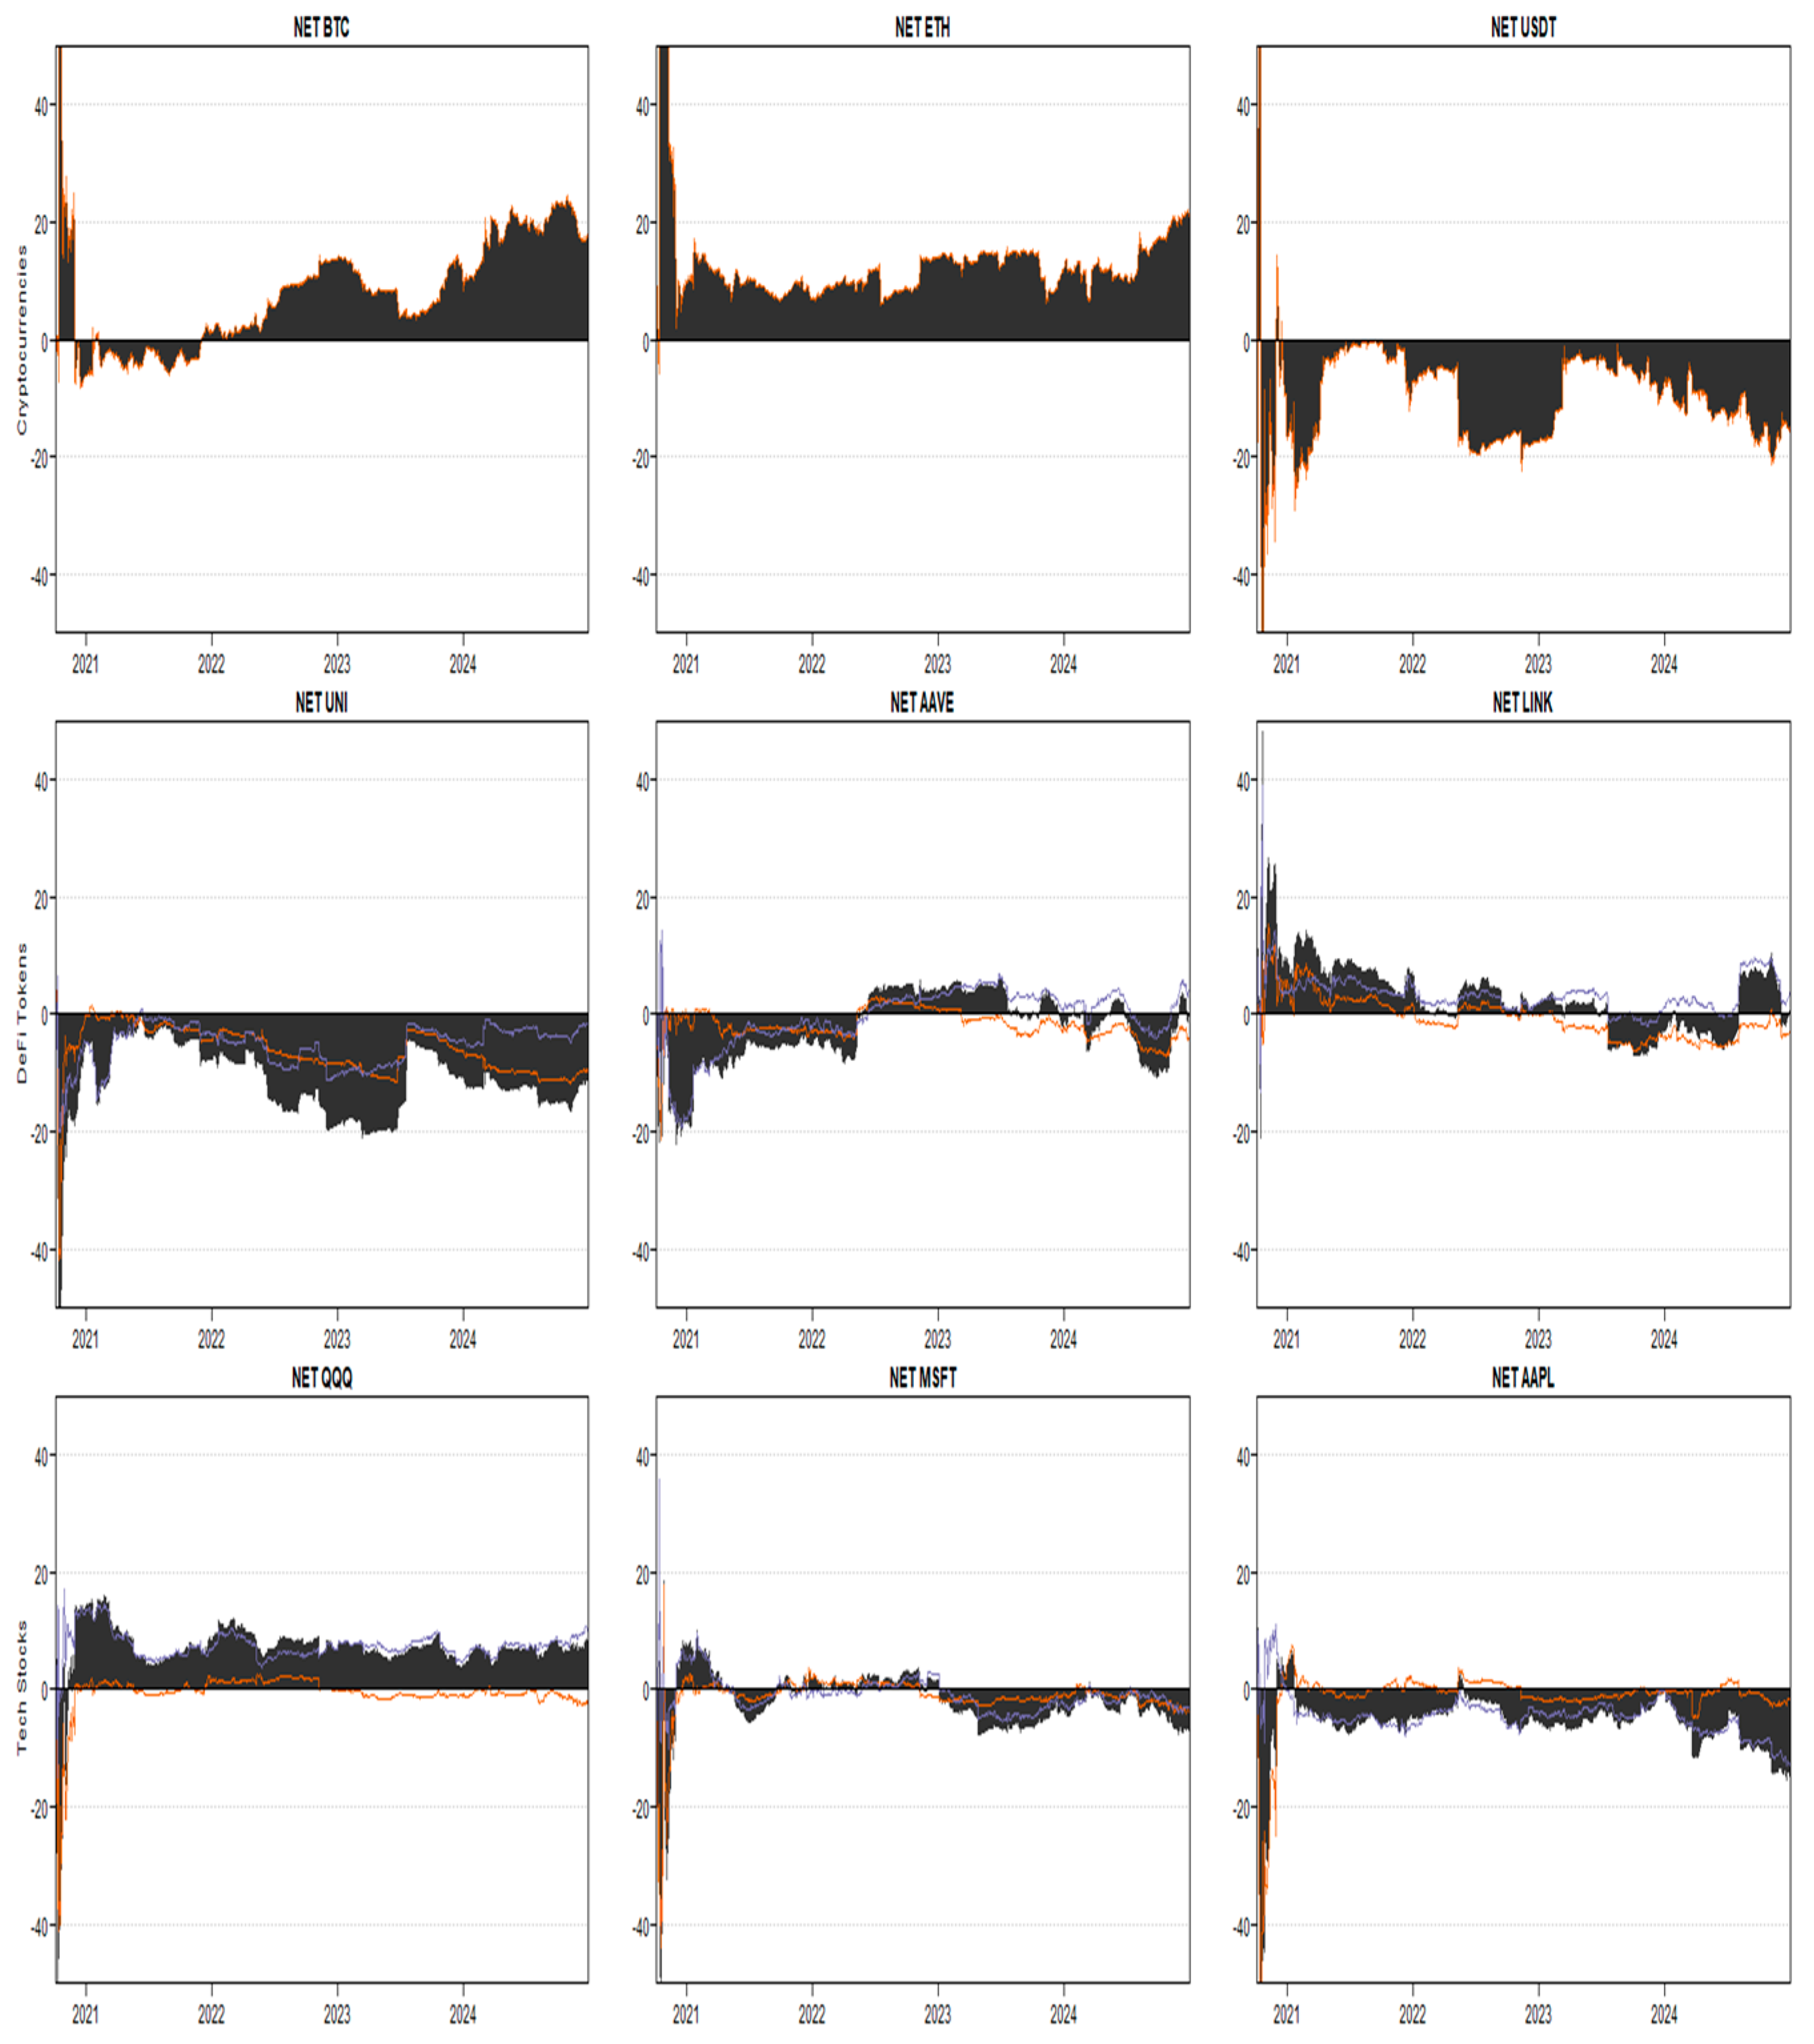
Figure 5 describes the dynamics of the net directional connectedness roles across individual assets over time.
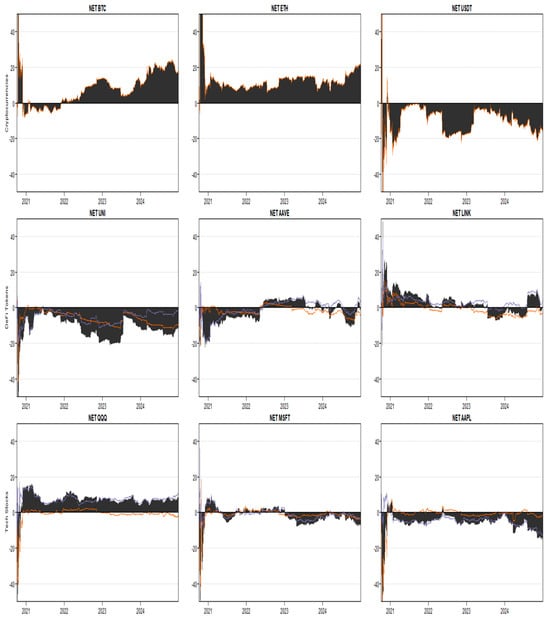
Figure 5.
Net Total Directional Connectedness of Individual Assets Over Time. Note. Each panel shows the time-varying net total connectedness of one asset. Positive values (above the horizontal axis) indicate that the asset is a net transmitter of shocks to the system, while negative values suggest it is a net receiver.
Figure 5 indicates that Bitcoin and Ethereum emerge as the most prominent net transmitters of shocks, particularly in the aftermath of the FTX collapse. Ethereum exhibits a steeper increase in transmission activity, indicating its central role in systemic volatility propagation within the crypto ecosystem. In contrast, Tether consistently functioned as a net absorber of volatility, a behavior consistent with its stablecoin purpose. Its net receiver status deepened further post-crisis, likely reflecting safe-haven capital reallocations.
Within the DeFi segment, Uniswap persistently exhibited negative net connectedness, indicating it largely absorbed systemic pressures rather than transmitting them, highlighting its reactive rather than leading role. AAVE showed a notable shift from a mild net receiver before FTX to periods of net transmission afterward, particularly when assessed using exclusive measures, suggesting it became more engaged in cross-group volatility transmission during market distress. Chainlink, meanwhile, remained a modest net receiver throughout, with relatively muted fluctuations, supporting its classification as a marginal volatility sink within both the DeFi and broader financial networks.
Turning to traditional assets, QQQ is the only tech stock to demonstrate a sustained net transmitter profile, albeit marginal. At the same time, Microsoft and Apple maintained largely negative net values, reinforcing their status as volatility recipients largely insulated from crypto-driven shocks. These patterns demonstrate the differentiated systemic roles of each asset class, with crypto assets exhibiting dynamic interdependencies and tech equities remaining relatively stable and decoupled throughout the sample period.
4.8. Net Pairwise Directional Connectedness
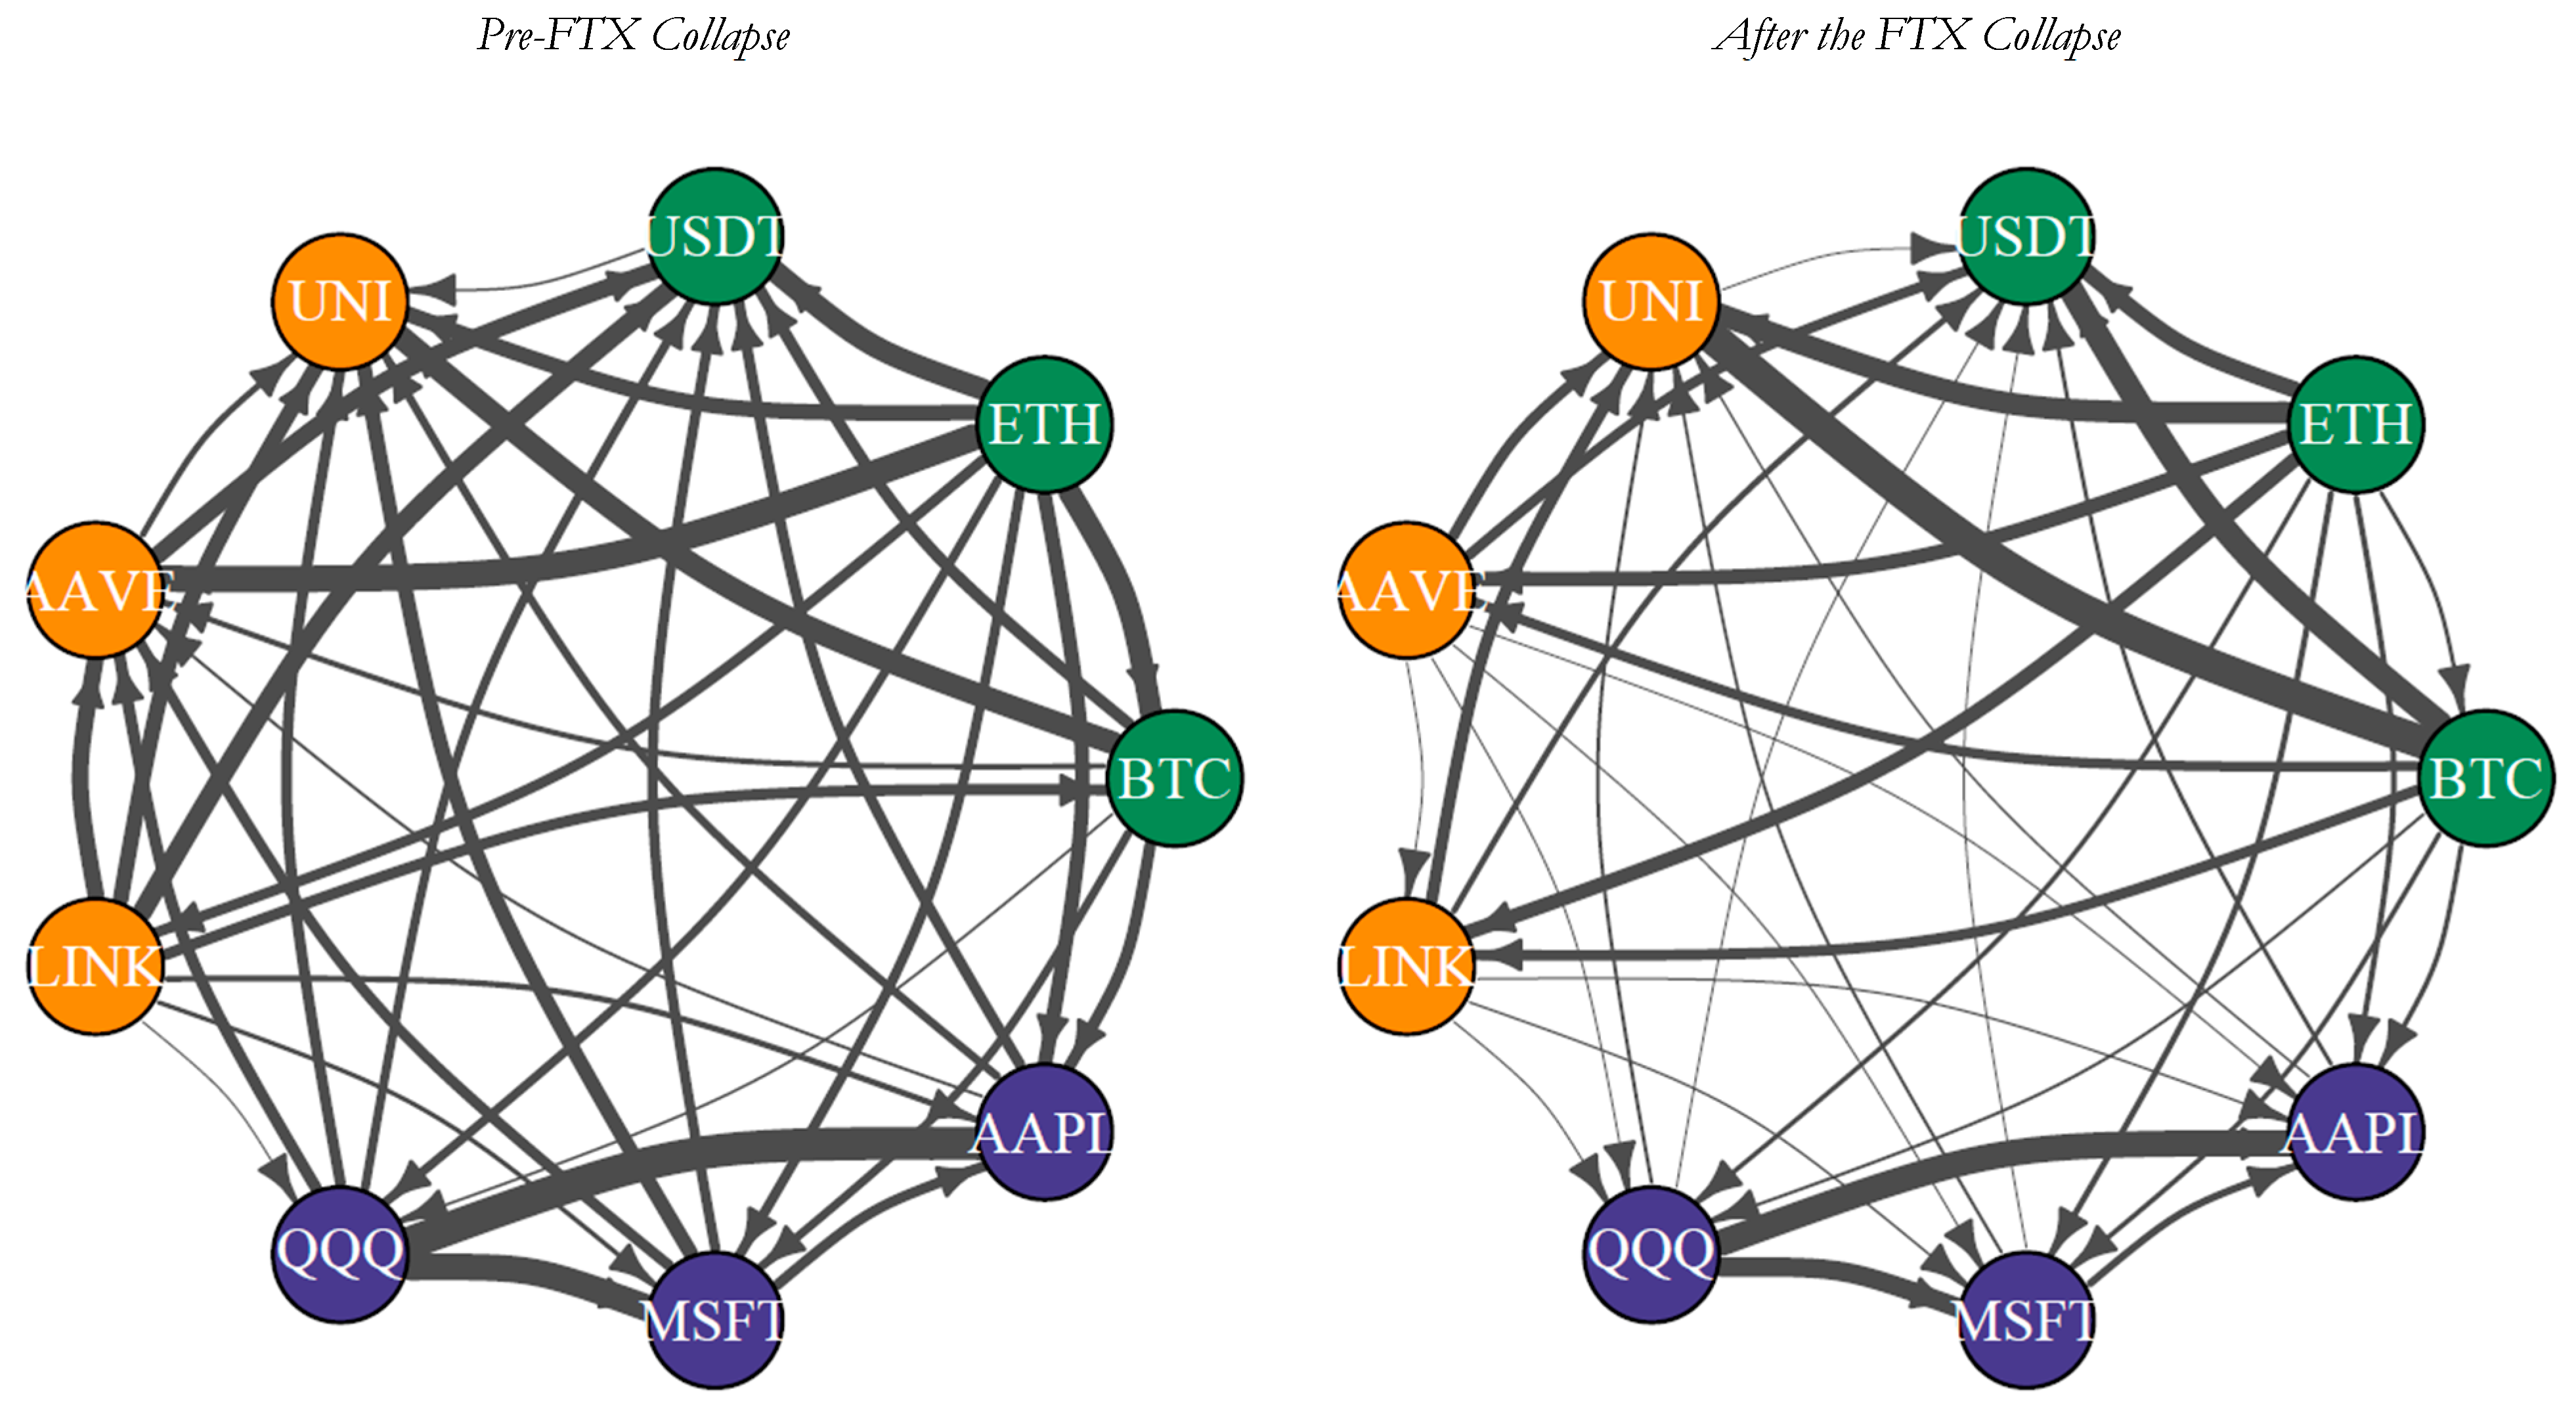
Figure 6 compares net pairwise directional connectedness across the system before and after the FTX collapse.
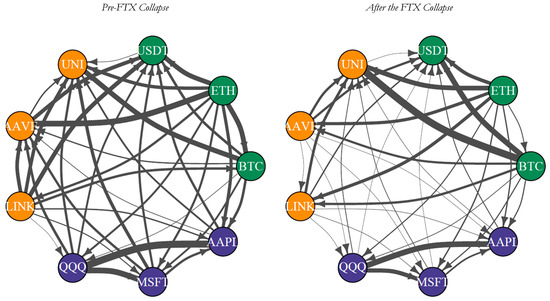
Figure 6.
Net Pairwise Directional Connectedness Before and After the FTX Collapse. Note. This figure visualizes the net pairwise directional connectedness among cryptocurrencies, DeFi tokens, and tech stocks before (left panel) and after (right panel) the FTX collapse. Arrows indicate the direction of net volatility transmission between assets, with arrow thickness proportional to the strength of spillovers. Outgoing arrows represent net transmitters, while incoming arrows represent net receivers.
Figure 6 indicates a significant shift in the structure and intensity of systemic relationships among the assets. Before the collapse, the network was densely connected, with relatively strong and balanced bidirectional linkages across cryptocurrencies, DeFi tokens, and tech stocks. Key transmitters included AAVE, ETH, and BTC, while USDT and LINK served as notable receivers. After the FTX collapse, however, the network became more asymmetric and polarized. The thickness of the outgoing arrows from BTC and ETH increases, highlighting their enhanced role as dominant volatility transmitters, a finding consistent with their elevated net connectedness levels in Table 4 and Figure 3, Figure 4a and Figure 5. In contrast, stablecoin USDT and DeFi assets such as LINK and UNI receive more shocks, evident from the concentration of inward-pointing arrows and fewer outward connections, which align with their persistent net receiver status observed in earlier results. Notably, cross-group connections between digital assets and tech equities appear thinner and more fragmented, echoing the decline in exclusive connectedness in Figure 2 and reinforcing that the FTX collapse intensified intra-group spillovers while dampening inter-group contagion. This post-crisis fragmentation supports the hypothesis that the FTX collapse triggered a realignment of systemic influence within the crypto-DeFi complex while insulating conventional equity markets from direct spillover effects.
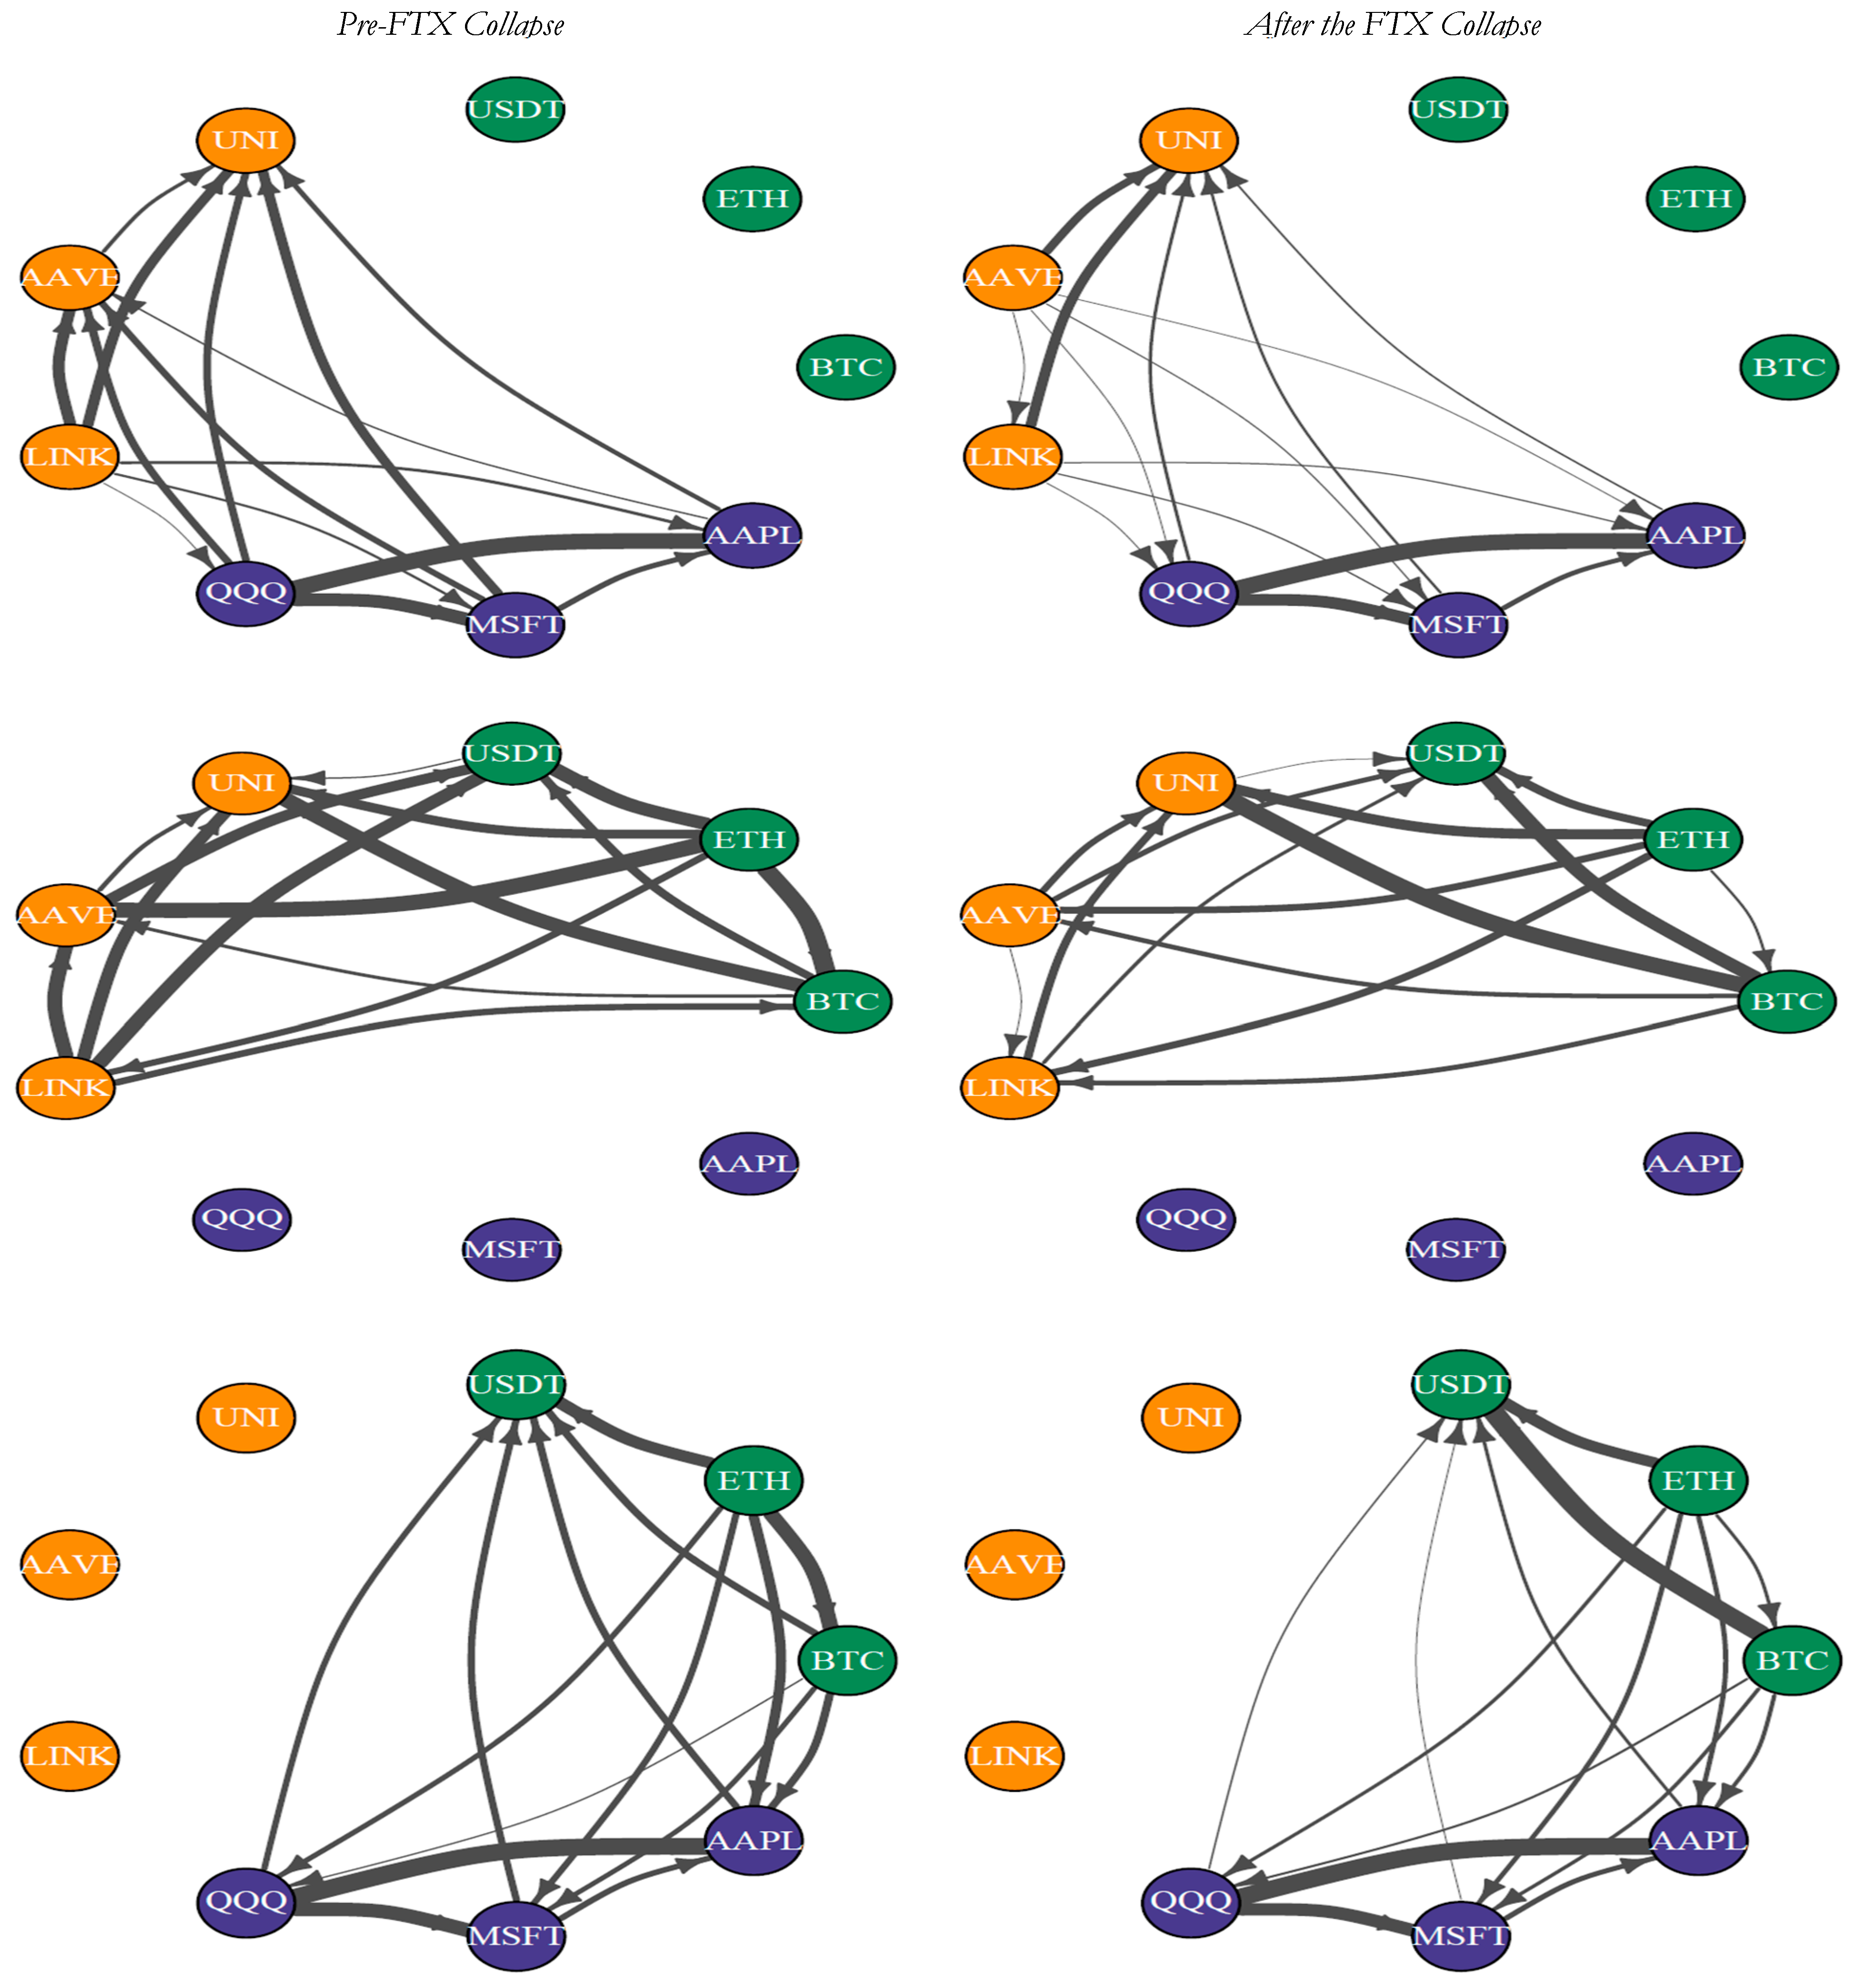
Figure 7 offers a detailed visualization of net pairwise exclusive connectedness by sequentially excluding each asset group, cryptocurrencies (top row), tech stocks (middle row), and DeFi tokens (bottom row), to isolate the cross-group dynamics before and after the FTX collapse.
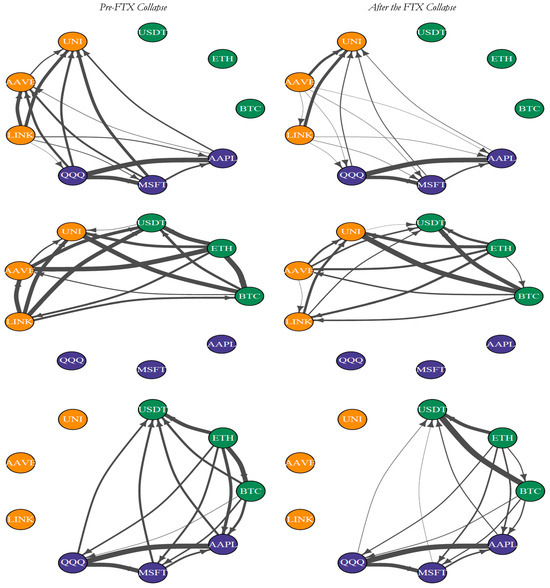
Figure 7.
Net Pairwise Directional Exclusive Connectedness Before and After the FTX Collapse. Note. This figure illustrates the net pairwise directional exclusive connectedness among the studied assets before (left panels) and after (right panels) the FTX collapse. Each row excludes a different asset group from the analysis: the top row excludes cryptocurrencies, the middle row excludes tech stocks, and the bottom row excludes DeFi tokens. Arrows represent the direction of net volatility transmission, and line thickness indicates the magnitude of spillovers. Exclusive connectedness captures only cross-group interactions, omitting intra-group dynamics to better isolate systemic spillovers involving the remaining assets.
In the top row of Figure 7, where cryptocurrencies are excluded, the exclusive network isolates interactions between DeFi tokens and tech stocks. Before the FTX collapse (left panel), DeFi tokens such as AAVE, LINK, and UNI acted as strong volatility transmitters to tech stocks (MSFT, QQQ, and AAPL), as shown by the thick outward arrows from DeFi nodes and dense connections toward tech stocks. This suggests active cross-group spillovers from DeFi to equities during the pre-crisis period. After the collapse (right panel), these connections weaken significantly, outgoing arrows from DeFi tokens become thinner, and some previously strong links disappear. This indicates a decline in DeFi’s influence over tech stocks and reflects a post-crisis retrenchment of systemic spillovers from DeFi into traditional financial assets. Thus, rather than DeFi becoming net receivers in this exclusive view, they appear to have lost transmission power to other asset classes, aligning with the broader narrative of fragmentation and insulation seen in previous figures.
The middle row of Figure 7 illustrates the net pairwise directional exclusive connectedness among cryptocurrencies and DeFi tokens, excluding tech stocks, before and after the FTX collapse. In the pre-crisis period, the network indicates strong outward spillovers from BTC and ETH to several DeFi tokens, confirming their role as dominant net transmitters within the digital asset ecosystem. AAVE also emerges as an active volatility sender, particularly toward LINK and UNI, while LINK and USDT stand out as primary receivers, absorbing significant shocks from other nodes. UNI occupies a dual role, transmitting to USDT and LINK while receiving from AAVE and ETH. After the collapse, this structure becomes more polarized. BTC and ETH maintain and even strengthen their transmission roles, sending concentrated shocks especially toward LINK and USDT. LINK, in particular, becomes a key volatility sink with increasingly dense inward arrows from ETH, BTC, and AAVE. Meanwhile, UNI appears more passive, with diminished outbound influence but continued inward spillovers.
The bottom row of Figure 7 presents the net pairwise directional exclusive connectedness among cryptocurrencies and tech stocks, excluding DeFi tokens, before and after the FTX collapse. In the pre-crisis period, BTC and ETH emerged as central transmitters, sending strong spillovers toward tech stocks, notably AAPL and MSF, as well as to USDT. These arrows indicate that, when DeFi tokens are excluded, crypto assets still exhibit significant influence over traditional equity benchmarks, suggesting notable cross-market interactions. After the FTX collapse, this dynamic shifts subtly. BTC and ETH influence persists, especially toward USDT, but arrows directed at tech stocks thin slightly, while intra-crypto connectedness (BTC to ETH and USDT) strengthens. USDT continues to act as a net receiver from major cryptocurrencies, which is consistent with its safe-haven role. Significantly, while still influenced by crypto assets, tech stocks do not amplify the spillovers, as evidenced by minimal outgoing arrows. This pattern reaffirms earlier findings from Figure 4b, Figure 5 and Figure 6 that traditional equities remained insulated mainly from systemic crypto shocks, even as contagion intensified within the digital asset domain.
4.9. Economic Mechanisms and Market-Microstructure Interpretation
In this section, we interpret the post-FTX evidence through the economics of crypto market microstructure. Bitcoin and Ethereum acted as dominant transmitters because they are balance-sheet and routing hubs across centralized exchanges (CEXs) and decentralized exchanges (DEXs); when depth thins and derivatives margins tighten, order imbalances and liquidations propagate system-wide through these hubs. By contrast, Tether (USDT) relies on peg-defense mechanics (arbitrage/redemptions) that absorb order flow, making it a persistent net receiver. The intensification of within-decentralized finance (DeFi) spillovers reflects automated market maker (AMM) mechanics: liquidity provider (LP) exits and declines in total value locked (TVL) raise slippage nonlinearly, multi-hop routing multiplies price impact, and protocol parameters (fee tiers, utilization curves, collateral haircuts, price-oracle update lags) endogenously amplify volatility inside DeFi while limiting outward transmission. Heterogeneous token reactions follow from design: Aave (AAVE), with its liquidation engine and oracle-mediated collateral calls, can push shocks across assets, yielding episodes of external transmission; Uniswap (UNI), a governance claim on trading/LP economics rather than a margin nexus, tends to internalize stress and remain a receiver; Chainlink (LINK) provides oracle utility that channels broad demand but lacks direct leverage linkages, keeping it a modest sink absent oracle incidents. At the macro interface, the decline in crypto-tech spillovers is consistent with a retreat of institutional basis/arbitrage trades and a shift toward retail-dominated crypto venues, producing financial segmentation: external connectedness falls as contagion concentrates within crypto/DeFi modules, while tech equities, anchored to cash-flow and rates, remain net receivers, with the Invesco QQQ Trust (QQQ) the lone mild thematic transmitter. These mechanisms explain the observed fragmentation and suggest testable levers, liquidity depth, derivatives stress, liquidation flow, and oracle frictions for risk monitoring and policy design.
4.10. Comparative Event Analysis
To contextualize the FTX episode, we replicate our TVP-VAR connectedness around Terra-LUNA (12 May 2022), Celsius/3AC deleveraging (12 June 2022), and FTX (8 November 2022) using identical ±20/±40-day windows.
The windowed means in Table 5 make two contrasts clear. First, system-wide intensity: Terra-LUNA produces the most significant jump in total connectedness (ΔTCI ≈ +6.66) and in cross-market spillovers (ΔEXT ≈ +6.30), with only a slight rise in within-group linkages (ΔINT ≈ +0.36). Celsius/3AC shows a milder, still broad-based response (ΔTCI ≈ +3.17, ΔEXT ≈ +2.58, ΔINT ≈ +0.59). Second, the FTX signature is different: the change in total connectedness is modest (ΔTCI ≈ +1.13), external spillovers decline slightly (ΔEXT ≈ −0.32), and the most significant increase is internal (ΔINT ≈ +1.45). In other words, Terra-LUNA and Celsius/3AC look like outward contagion events that strengthened cross-asset transmission. In contrast, FTX primarily internalized contagion within the crypto–DeFi module and coincided with attenuated linkages to tech. This comparative pattern reinforces our central result that post-FTX fragmentation concentrated volatility recycling inside the digital-asset complex while limiting propagation to traditional equities.

Table 5.
Pre- and Post-Event Connectedness Around Major Crypto Crises.
4.11. Robustness Check
To ensure the reliability of our findings, we conducted robustness checks by varying the window size of the rolling estimation in the TVP-VAR framework. Specifically, we experimented with shorter and longer windows to assess the sensitivity of the dynamic connectedness measures to the smoothing parameter. The main patterns and structural shifts observed in the baseline analysis, such as the rise of BTC and ETH as dominant volatility transmitters post-FTX, the persistent role of USDT as a net absorber, and the internalization of contagion within the crypto-DeFi complex, remained consistent across alternative specifications. These results confirm that the documented changes in connectedness dynamics are not artifacts of parameter selection but reflect shifts in systemic interlinkages triggered by the FTX collapse.
In addition, we report four complementary sensitivity exercises. First, we vary key TVP-VAR settings: (i) lag length p ∈ {1, 2} (baseline p = 1 chosen by BIC), (ii) generalized FEVD horizon H ∈ {10, 20, 30} trading days, and (iii) TVP discount factors κ1, κ2 ∈ {0.98, 0.99}. Across these alternatives, the identity of net volatility transmitters (BTC/ETH), the absorber role of USDT, and the post-FTX shift toward more substantial internal and weaker external spillovers are unchanged; only the level of TCI scales modestly with H. Second, we address potential concerns about extreme tails. Our baseline applies a targeted spike screen only to UNI (exclude |ΔlnP| ≥ 1 to remove early-trading artifacts. Re-estimating the full pipeline without this screen yields qualitatively identical directional results and group segmentation (crypto/DeFi internalization, limited tech spillovers). Third, we test the dating of the FTX break by shifting the split to t0 ± 2 trading days (4–10 November 2022). All pre-/and post-comparisons and directional rankings are robust to these alternative cutoffs. Fourth, to address lingering COVID-period contamination without altering the study’s core design, we re-estimate the key summary metrics after trimming early data: (i) excluding 2020, and (ii) excluding 2020–2021. Across all checks, three results are stable: (i) BTC and ETH act as systemic senders after FTX, (ii) USDT absorbs rather than transmits shocks, and (iii) the post-FTX regime features stronger internal connectedness within crypto and DeFi and weaker external transmission to tech. Only the level of total connectedness is sample-dependent when the pre-window is dominated by Terra and Celsius stress, which lifts the pre-FTX average.1
5. Conclusions
This study aimed to examine the evolving connectedness structure among cryptocurrencies, DeFi tokens, and tech stocks, with a particular focus on the systemic impact of the FTX collapse. By employing a TVP-VAR framework and leveraging both inclusive and exclusive connectedness measures, the paper provides a multidimensional analysis of how volatility spillovers propagated within and across asset classes before and after a major crisis event. The key findings highlight a clear reconfiguration of systemic relationships post-FTX. First, BTC and ETH emerged as dominant volatility transmitters, reinforcing their roles as systemic core nodes in the digital asset network. In contrast, USDT maintained its position as a consistent net receiver, acting as a volatility sink, particularly during periods of market stress. Within the DeFi space, assets like AAVE and LINK exhibited increased internal contagion and occasional external transmission roles, suggesting that structural fragilities were exposed and amplified following the collapse. Notably, tech stocks such as QQQ, MSFT, and AAPL remained largely insulated, with minimal evidence of spillovers from the crypto-DeFi domain. These dynamics were corroborated across multiple lenses: net total, pairwise, internal, and external connectedness measures, both in static and dynamic settings.
The study makes several contributions to the literature. Methodologically, it incorporates a decomposed connectedness framework that distinguishes between intra-group (internal) and cross-group (external) linkages. Empirically, it enriches our understanding of how a high-impact crypto event alters the topology of systemic risk transmission across decentralized and traditional markets. Visually, it presents a series of network-based graphs that track how directional influence realigns following market disruptions.
The findings carry significant policy implications for multiple stakeholders. For regulators, the asymmetric contagion pattern suggests that systemic risk is increasingly concentrated within crypto-native ecosystems. This calls for targeted oversight of core transmitting nodes (e.g., centralized exchanges, major tokens) rather than blanket regulation of all digital assets. Because our third group is a deliberately conservative technology benchmark, the limited spillovers we document should be interpreted as lower-bound cross-market effects rather than evidence against potential transmission to financials. Given the constrained coverage, supervisors should treat our measured crypto to tech spillovers as conservative. Broader inclusion of cross-chain tokens, bridge assets, and additional stablecoins could raise measured external connectedness in stress. For institutional investors, the persistence of crypto-to-tech decoupling implies that portfolio diversification benefits may still hold under stress, but only if allocations are mindful of internal crypto contagion. For DeFi developers and platform architects, the results indicate vulnerabilities in design and liquidity dynamics, emphasizing the need for robust governance and transparency mechanisms to mitigate endogenous instability. Finally, for central banks and financial stability boards, the growing complexity of spillover networks and episodic decoupling warrants continuous monitoring to detect early signs of systemic concentration or fragmentation. Policy use should therefore focus on mechanisms that generalize across tokens and venues such as AMM depth withdrawals, liquidation-driven fire sales, and oracle anchoring, while recognizing that magnitudes can vary with a wider asset set. In practical terms, alignment with current frameworks suggests: under European Markets in Crypto-Assets Regulation, prioritize reserve transparency, redemption and liquidity stress testing for stablecoins, incident reporting for major service providers, and operational risk standards for oracle and bridge infrastructure; in the United States, where rulemaking is evolving, focus on consolidated risk monitoring across CEX and DEX venues, leverage and margin controls on derivatives platforms, and disclosure of on-chain liquidity metrics; and for cross-border coordination, develop supervisory dashboards that track TO, FROM, and TCI thresholds as early-warning indicators and convene information-sharing colleges around dominant transmitters such as BTC and ETH hubs.
Our asset set is intentionally compact and Ethereum-centric: BTC, ETH, USDT, UNI, AAVE, LINK, and a narrow tech proxy (QQQ, MSFT, AAPL). We do not include other large stablecoins such as USDC, alternative layer-1s, and CEX-aligned tokens such as BNB, SOL, or ADA, nor a broader DeFi cross-section. As a result, the evidence should be read as representative of USD-quoted, high-liquidity assets on major venues over 2020–2024, rather than a census of the entire crypto universe. This scope can affect external validity in two ways. First, excluding USDC and other pegs may bias the magnitude of the “stablecoin as sink” result, since design and redemption mechanics differ across issuers. Second, omitting non-Ethereum ecosystems and CEX governance tokens may understate cross-chain and exchange-linked transmission channels. We therefore interpret the limited spillovers to tech as a lower-bound estimate of cross-market transmission, conditional on this asset universe.
Future research could expand this framework by incorporating macroeconomic variables (e.g., policy rates, interest-rate surprises, inflation news), stablecoin de-pegging episodes, and token-governance shocks to enrich the analysis of systemic interactions. A near-term priority is to re-estimate the tri-market system with a financial or fintech basket in place of the broad tech proxy, using banks, brokerages and exchanges, and payments firms to test for stronger balance-sheet and intermediation linkages and to benchmark cross-market transmission more directly. Extending the sample and asset universe to include newer crypto-assets and alternative financial technologies (e.g., real-world-asset tokens, AI-linked protocols, cross-region tech indices) would help assess how emerging innovations reshape contagion pathways in increasingly hybrid financial systems. A natural extension is to augment the system with a Macro-COVID factor, defined as the first principal component of standardized global risk indicators (VIX, EPU, GPR) and the Oxford Stringency Index, and to compute partial (exclusive) connectedness for this factor, thereby netting out broad pandemic–macro co-movements across alternative sample windows and asset sets. We view these extensions as essential for testing the generalizability of our lower-bound spillover estimates and for refining the policy map from crypto microstructure to systemic risk.
Author Contributions
Conceptualization, N.N.; Methodology, N.N.; Software, N.N.; Formal analysis, N.N.; Investigation, M.S.M.; Writing—original draft, N.N.; Writing—review and editing, M.S.M.; Supervision, M.S.M. All authors have read and agreed to the published version of the manuscript.
Funding
This work was supported and funded by the Deanship of Scientific Research at Imam Mohammad Ibn Saud Islamic University (IMSIU) (grant number IMSIU-DDRSP2504).
Data Availability Statement
The original data presented in the study are openly available in Investing.com at [Investing.com].
Conflicts of Interest
The authors declare no conflicts of interest.
Note
| 1 | Due to journal space constraints, detailed robustness results are not reported here but are available from the authors upon request. |
References
- Abdullah, M., Sarker, P. K., Abakah, E. J. A., Tiwari, A. K., & Rehman, M. Z. (2024). Tail risk intersection between tech-tokens and tech-stocks. Global Finance Journal, 61, 100989. [Google Scholar] [CrossRef]
- Aharon, D. Y., Alon, I., & Vakhromov, O. (2024). Metaverse tokens or metaverse stocks–Who’s the boss? Research in International Business and Finance, 69, 102259. [Google Scholar] [CrossRef]
- Ahelegbey, D. F., Giudici, P., & Mojtahedi, F. (2021). Tail risk measurement in crypto-asset markets. International Review of Financial Analysis, 73, 101604. [Google Scholar] [CrossRef]
- Akyildirim, E., Conlon, T., Corbet, S., & Goodell, J. W. (2023). Understanding the FTX exchange collapse: A dynamic connectedness approach. Finance Research Letters, 53, 103643. [Google Scholar] [CrossRef]
- Alamsyah, A., & Muhammad, I. F. (2024). Unraveling the crypto market: A journey into decentralized finance transaction network. Digital Business, 4(1), 100074. [Google Scholar] [CrossRef]
- Barkai, I., Hadad, E., Shushi, T., & Yosef, R. (2024). Capturing tail risks in cryptomarkets: A new systemic risk approach. Journal of Risk and Financial Management, 17(9), 397. [Google Scholar] [CrossRef]
- Bas, T., Malki, I., & Sivaprasad, S. (2024). Do returns and volatility spillovers exist across tech stocks, cryptocurrencies and NFTs? Heliyon, 10(2), e24615. [Google Scholar] [CrossRef]
- Bejaoui, A., Frikha, W., Jeribi, A., & Bariviera, A. F. (2023). Connectedness between emerging stock markets, gold, cryptocurrencies, DeFi and NFT: Some new evidence from wavelet analysis. Physica A: Statistical Mechanics and Its Applications, 619, 128720. [Google Scholar]
- Bouri, E., Kamal, E., & Kinateder, H. (2023). FTX collapse and systemic risk spillovers from FTX token to major cryptocurrencies. Finance Research Letters, 56, 104099. [Google Scholar] [CrossRef]
- Chatziantoniou, I., Elsayed, A. H., Gabauer, D., & Gozgor, G. (2023). Oil price shocks and exchange rate dynamics: Evidence from decomposed and partial connectedness measures for oil importing and exporting economies. Energy Economics, 120, 106627. [Google Scholar] [CrossRef]
- Chen, Z. (2025). From disruption to integration: Cryptocurrency prices, financial fluctuations, and macroeconomy. Journal of Risk and Financial Management, 18(7), 360. [Google Scholar] [CrossRef]
- Conlon, T., Corbet, S., & Hu, Y. (2023). The collapse of the FTX exchange: The end of cryptocurrency’s age of innocence. The British Accounting Review, 101277. Available online: https://www.sciencedirect.com/science/article/pii/S0890838923001348 (accessed on 23 July 2025). [CrossRef]
- Diebold, F. X., & Yilmaz, K. (2012). Better to give than to receive: Predictive directional measurement of volatility spillovers. International Journal of Forecasting, 28(1), 57–66. [Google Scholar] [CrossRef]
- Esparcia, C., Escribano, A., & Jareño, F. (2024). Assessing the crypto market stability after the FTX collapse: A study of high frequency volatility and connectedness. International Review of Financial Analysis, 94, 103287. [Google Scholar] [CrossRef]
- Gabauer, D., & Gupta, R. (2018). On the transmission mechanism of country-specific and international economic uncertainty spillovers: Evidence from a TVP-VAR connectedness decomposition approach. Economics Letters, 171, 63–71. [Google Scholar]
- Galati, L., Webb, A., & Webb, R. I. (2024). Financial contagion in cryptocurrency exchanges: Evidence from the FTT collapse. Finance Research Letters, 67, 105747. [Google Scholar] [CrossRef]
- Hoang, L. T., & Baur, D. G. (2024). How stable are stablecoins? The European Journal of Finance, 30(16), 1984–2000. [Google Scholar] [CrossRef]
- Iyer, R., & Popescu, A. (2023). New evidence on spillovers between crypto assets and financial markets. IMF Working Papers, No. 2023/213. International Monetary Fund. [Google Scholar]
- Jalan, A., & Matkovskyy, R. (2023). Systemic risks in the cryptocurrency market: Evidence from the FTX collapse. Finance Research Letters, 53, 103670. [Google Scholar] [CrossRef]
- Katsiampa, P., Yarovaya, L., & Zięba, D. (2022). High-frequency connectedness between Bitcoin and other top-traded crypto assets during the COVID-19 crisis. Journal of International Financial Markets, Institutions and Money, 79, 101578. [Google Scholar] [CrossRef]
- Khan, K., Khurshid, A., & Cifuentes-Faura, J. (2025). Causal estimation of FTX collapse on cryptocurrency: A counterfactual prediction analysis. Financial Innovation, 11(1), 16. [Google Scholar] [CrossRef]
- Kumah, P. S., & Baafi, J. A. (2025). Spillover effects among cryptocurrencies in a pandemic: A time frequency approach. Journal of Electronic Business & Digital Economics, 4(1), 151–166. [Google Scholar]
- Kumar, A., Iqbal, N., Mitra, S. K., Kristoufek, L., & Bouri, E. (2022). Connectedness among major cryptocurrencies in standard times and during the COVID-19 outbreak. Journal of International Financial Markets, Institutions and Money, 77, 101523. [Google Scholar] [CrossRef]
- Lee, S., Lee, J., & Lee, Y. (2023). Dissecting the Terra-LUNA crash: Evidence from the spillover effect and information flow. Finance Research Letters, 53, 103590. [Google Scholar]
- Liao, X., Li, Q., Chan, S., Chu, J., & Zhang, Y. (2024). Interconnections and contagion among cryptocurrencies, DeFi, NFT and traditional financial assets: Some new evidence from tail risk driven network. Physica A: Statistical Mechanics and Its Applications, 647, 129892. [Google Scholar]
- Liu, J., Julaiti, J., & Gou, S. (2024). Decomposing interconnectedness: A study of cryptocurrency spillover effects in global financial markets. Finance Research Letters, 61, 104950. [Google Scholar] [CrossRef]
- Łęt, B., Sobański, K., Świder, W., & Włosik, K. (2023). What drives the popularity of stablecoins? Measuring the frequency dynamics of connectedness between volatile and stable cryptocurrencies. Technological Forecasting and Social Change, 189, 122318. [Google Scholar] [CrossRef]
- Santiago, V., Charifzadeh, M., & Herberger, T. A. (2025). Risks of decentralized finance and their potential negative effects on capital markets: The Terra-Luna case. Studies in Economics and Finance, 42(3), 427–448. [Google Scholar]
- Shahrour, M. H., Lemand, R., & Mourey, M. (2025). Cross-market volatility dynamics in crypto and traditional financial instruments: Quantifying the spillover effect. The Journal of Risk Finance, 26(1), 1–21. [Google Scholar]
- Thanh, B. N., Hong, T. N. V., Pham, H., Cong, T. N., & Anh, T. P. T. (2023). Are the stabilities of stablecoins connected? Journal of Industrial and Business Economics, 50(3), 515–525. [Google Scholar]
- Ugolini, A., Reboredo, J. C., & Mensi, W. (2023). Connectedness between DeFi, cryptocurrency, stock, and safe-haven assets. Finance Research Letters, 53, 103692. [Google Scholar]
- Vuković, D. B., Frömmel, M., Vigne, S. A., & Zinovev, V. (2025). Spillovers between cryptocurrencies and financial markets in a global framework. Journal of International Money and Finance, 150(C), 103235. [Google Scholar] [CrossRef]
- Xu, Q., Zhang, Y., & Zhang, Z. (2021). Tail-risk spillovers in cryptocurrency markets. Finance Research Letters, 38, 101453. [Google Scholar] [CrossRef]
- Yousaf, I., Riaz, Y., & Goodell, J. W. (2023). What do responses of financial markets to the collapse of FTX say about investor interest in cryptocurrencies? Event-study evidence. Finance Research Letters, 53, 103661. [Google Scholar] [CrossRef]
Disclaimer/Publisher’s Note: The statements, opinions and data contained in all publications are solely those of the individual author(s) and contributor(s) and not of MDPI and/or the editor(s). MDPI and/or the editor(s) disclaim responsibility for any injury to people or property resulting from any ideas, methods, instructions or products referred to in the content. |
© 2025 by the authors. Licensee MDPI, Basel, Switzerland. This article is an open access article distributed under the terms and conditions of the Creative Commons Attribution (CC BY) license (https://creativecommons.org/licenses/by/4.0/).

