Abstract
This study investigates whether, and to what extent, dividend-paying firms follow pecking order behavior when altering their capital structure. Using a panel of 3173 U.S. firms from 1960 to 2020 (49,424 firm-year observations), we examine four financing activities: equity and debt issuance under a financing deficit, and equity repurchases and debt redemptions under a financing surplus. We find that firms generally follow the pecking order when issuing or redeeming debt but deviate from it when issuing or repurchasing equity. Adherence to the pecking order also varies with issuance and repurchase size. Very large debt issues and redemptions are associated with lower pecking order coefficients, while large equity issues and repurchases are associated with higher pecking order coefficients, although equity coefficients remain below 0.7. Our findings provide novel evidence of how financing choices, along with issuance and repurchase magnitudes, shape pecking order behavior among dividend-paying firms, offering new insights into capital structure literature.
1. Introduction
Corporate financing decisions play a central role in shaping firms’ capital structures and, ultimately, their market valuation and long-term performance. Among the most influential frameworks explaining such decisions is the pecking order theory, which posits that firms finance deficits first with internal funds, then with debt, and only as a last resort with equity (Myers, 1984; Myers & Majluf, 1984). While widely discussed, the theory remains contested, with evidence suggesting that many firms deviate from its strict hierarchy by issuing equity even when debt capacity is available (Fama & French, 2002; Frank & Goyal, 2003).
This paper provides new insights into how corporate financing decisions impact the pecking order of dividend-paying firms. We address three research questions to assess whether—and to what extent—dividend-paying firms follow the pecking order under specific financing conditions: how do financing deficits and financing surpluses affect pecking order behavior? To what extent do debt or equity issuing firms follow the pecking order when facing a financing deficit? To what extent do equity repurchasing or debt redeeming firms follow the pecking order when facing a financing surplus? Answering these questions, we provide evidence of how firms adjust pecking order when they alter their financing decisions. Understanding these dynamics is important for both scholars and market participants, as it sheds light on how capital structure adjustments reflect managerial preferences (e.g., equity versus debt), market conditions (e.g., market timing), financing constraints (e.g., limited debt capacity), and financial slack (e.g., unused borrowing capacity)—all factors that can influence firm value and investor decision-making.
This study contributes to the literature in two ways. Firstly, we build on the work of De Jong et al. (2010) by examining the pecking order hypothesis specifically for dividend-paying firms. Moreover, while De Jong et al. (2010) focus on financing surpluses and deficits in aggregate, we extend their analysis by separately investigating the effects of debt and equity issuance, as well as debt and equity repurchases, on pecking order behavior. Secondly, we also test whether the strength of adherence to the pecking order varies with the level of financing activity—that is, across varying magnitudes of equity and debt issuance, as well as equity and debt repurchases. This dual contribution allows us to provide new evidence of how firms adjust pecking order behavior both across financing types and across the intensity of financing choices.
Using a panel of 3173 U.S. dividend-paying firms from 1960 to 2020 (49,424 firm-year observations), we find evidence that firms generally follow the pecking order when issuing or redeeming debt but deviate from it when issuing or repurchasing equity. We also observe that issuance and repurchase size play a role, with large debt issues and redemptions associated with lower adherence, and large equity issues and redemptions associated with higher adherence—albeit at relatively low coefficient levels. These findings provide novel insights into how financing decisions, together with the magnitude of issuance and repurchase, shape the capital structure behavior of dividend-paying firms.
2. Theoretical Implications and Hypotheses Development
2.1. Pecking Order
A strand of the corporate finance literature focuses on the pecking order model of capital structure, which suggests that firms make financing decisions in a hierarchical order. Under a financing deficit, firms prefer internal to external financing. More specifically, when internal resources are insufficient to meet funding needs, firms turn to external sources, choosing the safest form of issuance first. In line with this hierarchy, firms prefer to issue safe debt, then risky debt, and, as a last resort, equity. This preference reflects asymmetric information problems, whereby managers avoid issuing riskier securities to fund their needs (Myers, 1984).
In theory, a “strict” pecking order hierarchy never allows equity issuance (Myers, 1984). Recognizing this limitation, Myers and Majluf (1984) proposed a “modified” pecking order model that permits equity issuance. They also observed that the strict version is consistently rejected in real-world finance. Similarly, Chirinko and Singha (2000) define the modified version as “semi-strong,” in which firms with available debt capacity may still choose to issue equity. Leary and Roberts (2010) present a spectrum of compliance, ranging from strict to liberal. In the liberal form, financially unconstrained firms with unused debt capacity may issue equity to meet funding needs, following a looser financing hierarchy.
Empirical evidence of the pecking order under financing deficits is mixed. Shyam-Sunder and Myers (1999) provide early support, showing that firms primarily finance deficits with debt, yielding high pecking order coefficients. However, other studies find deviations from this behavior. Fama and French (2002) and Frank and Goyal (2003) show that many firms issue equity despite having debt capacity, while Lemmon and Zender (2010) attribute such deviations to debt capacity constraints. Huang and Ritter (2009) find that publicly traded U.S. firms finance a significantly larger proportion of their deficits with external equity when the cost of equity capital is low. They also show that these financing decisions have long-lasting effects on capital structure, as historical equity issuance influences current leverage. This evidence suggests that deviations from the pecking order in deficit periods may be driven not only by debt capacity constraints (Lemmon & Zender, 2010) but also by favorable equity market conditions.
While the pecking order provides clear predictions for financing under deficits, its logic operates in reverse under surpluses, when firms face decisions between debt repayment and equity repurchase. Specifically, Shyam-Sunder and Myers (1999) propose that the pecking order also holds in the presence of a financing surplus. The rationale is that highly optimistic managers may wish to repurchase shares, leading to an increase in the stock price ahead of the repurchase. However, once the stock price rises sufficiently, no manager will want to proceed with the repurchase. In such cases, managers prefer to use surplus funds to repay debt rather than repurchase equity (De Jong et al., 2010); even the most optimistic managers prefer debt repayment to share repurchase (Shyam-Sunder & Myers, 1999).
Thus, the rationale behind capital structure decisions differs between firms with financing deficits and those with financing surpluses. For deficit firms, decisions are driven primarily by financing costs, whereas for surplus firms, managerial optimism plays a central role (Myers, 1984; Shyam-Sunder & Myers, 1999; De Jong et al., 2010).
Related literature examines the choice between debt and equity in issue and repurchase transactions. Hovakimian et al. (2001) show that firms adjust toward target debt ratios in a manner consistent with trade-off theory, but that the decision of whether to raise funds through debt or equity is also influenced by the size of the transaction. Larger transactions are more likely to cause deviations from target ratios, a finding that parallels our investigation of how the magnitude of debt and equity issues or repurchases affects adherence to the pecking order. Baker and Wurgler (2002) offer an alternative explanation for equity issuance—market timing—which suggests that managers exploit high market valuations regardless of their debt capacity.
2.2. Hypotheses Development
Building on De Jong et al. (2010), who separate financing states and show that the pecking-order coefficient is highest for surpluses, lower for normal deficits, and lowest for large deficits, we expect stronger adherence to the pecking order when firms have a financing surplus. This asymmetry is consistent with classic pecking-order predictions (Shyam-Sunder & Myers, 1999) and with evidence that debt capacity constraints induce equity financing during deficits (Lemmon & Zender, 2010). Relatedly, research emphasizing information asymmetry and financing frictions supports a “modified” pecking order in which adherence varies with constraints—tighter in surplus states and looser under deficit-driven external financing needs (Leary & Roberts, 2010)1.
Hypothesis 1.
Dividend-paying firms follow a stricter pecking order under financing surpluses and a looser pecking order under financing deficits.
A core prediction of the pecking order theory is that firms—with asymmetric information—prefer debt over equity when external financing is needed (Myers, 1984). This preference is driven by the lower issuance cost and fewer signaling issues associated with debt. Empirical studies support this notion: Fama and French (2002) document that firms issue debt more frequently than equity when facing financing needs, and Frank and Goyal (2009) show that firms with better debt capacity opt for debt rather than diluting equity. Leary and Roberts (2010) extend this argument, showing that firms’ debt issuance behavior aligns with pecking order predictions, particularly when internal funds are insufficient and debt capacity remains. Based on this reasoning, we expect debt-issuing firms to follow the pecking order.
Hypothesis 2a.
Debt-issuing firms follow the pecking order.
A pecking order coefficient below one indicates that firms finance only part of their deficit with debt and meet the remainder through equity issuance (Shyam-Sunder & Myers, 1999). Empirical work shows that in some cases the coefficient is substantially lower, suggesting a breakdown in pecking-order behavior. De Jong et al. (2010) find that such deviations are often linked to firms with unused debt capacity that nevertheless issue equity, a choice attributed to maintaining financial flexibility and avoiding future debt constraints. Frank and Goyal (2003) further report that many firms issue equity despite having access to debt, often driven by market-timing motives. Similarly, Baker and Wurgler (2002) show that equity issuance is more likely when market valuations are high relative to book values, reinforcing the idea that such behavior reflects strategic timing rather than strict adherence to the pecking order. We therefore expect equity-issuing firms to exhibit low pecking order coefficients.
Hypothesis 2b.
Equity—issuing firms do not follow the pecking order.
The pecking order theory predicts that firms with a financing surplus will prioritize debt repayment over equity repurchases, even when managers are optimistic about the firm’s prospects (Shyam-Sunder & Myers, 1999). This is because repurchase announcements typically trigger a rise in the stock price, making buybacks more costly and less attractive. Debt repayment, in contrast, increases unused debt capacity, reduces financial risk, and preserves flexibility for future external financing (De Jong et al., 2010).
Empirical evidence supports this hierarchy. Stephens and Weisbach (1998) find that firms repurchasing equity often do so for signaling or managerial incentive reasons rather than following a cost-minimizing financing sequence. Jagannathan et al. (2000) show that repurchasing firms tend to have abundant cash and profitability, suggesting motivations beyond debt reduction. Dittmar (2000) highlights agency-related drivers, where managers return capital to shareholders to mitigate agency conflicts, even at the expense of debt capacity. Such actions represent a strategic deviation from the strict pecking order, in which debt repayment is expected to take precedence over equity repurchase in surplus situations.
Hypothesis 3a.
Equity—repurchasing firms do not follow the pecking order.
Debt redemption in the presence of a financing surplus aligns closely with the predictions of the pecking order theory. By prioritizing debt repayment over equity repurchases, firms increase unused debt capacity, reduce leverage, and preserve financial flexibility for future investment opportunities (DeAngelo, 2022). This strategy also strengthens relationships with creditors, lowers interest expenses, and may improve credit ratings, thereby reducing the cost of future borrowing (Khieu & Pyles, 2016).
Empirical evidence reinforces this behavior. De Jong et al. (2010) find that firms with surpluses tend to repay debt rather than repurchase equity, regardless of whether they are financially constrained or unconstrained. Fama and French (2002) document that debt reduction in surplus periods is consistent with the preference ordering implied by the pecking order. Furthermore, Denis and McKeon (2012) show that firms often use surplus cash to reduce outstanding debt as part of a broader financial policy aimed at maintaining optimal leverage and reducing the likelihood of future equity issuance. Based on these arguments, we expect debt-redemption firms to follow the pecking order model more closely than equity-repurchasing firms.
Hypothesis 3b.
Debt—redemption firms follow the pecking order.
3. Data and Methodology
3.1. Data
We collect annual balance sheet data for U.S. firms from the Compustat database (The definitions of variables are provided in Appendix A.). Following previous studies, we exclude financial firms (with SIC codes 4900–4999) and utilities (with SIC code 6000–6999) due to their unique regulatory and legal regimes (Fama & French, 2002; De Jong et al., 2010). We focus on dividend-paying firms with more than five consecutive years of dividend payments, in line with prior literature (see, Leary & Roberts, 2010)2.
We exclude firms with a deficit equal to zero, as our analysis focuses on the impact of positive and negative deficits on pecking-order behavior. In addition, we retain only those firms with non-missing observations for equity issuance (or repurchase) and debt issuance (or redemption) for more than five consecutive years.
3.2. Methodology
3.2.1. Basic Model
We follow the model of Shyam-Sunder and Myers (1999) to examine the pecking order behavior in our sample (Equation (1)).
where Deficiti,t is the financial deficit scaled by total assets and bPO is the pecking order coefficient. Firms are considered to follow the pecking order policy, when pecking order coefficient takes values close to one. In the strictest interpretation, a coefficient equal to one implies that firms finance one dollar of deficit entirely with one dollar of debt issuance, without resorting to equity—the case of the strict pecking order theory. However, empirical studies show that the estimated pecking order coefficient (bPO) rarely equals one and instead varies across samples, time periods, and firm characteristics. Shyam-Sunder and Myers (1999) report a value of about 0.75, concluding that the model provides a good first-order description of financing behavior. Using a larger dataset, Frank and Goyal (2003) find substantially lower coefficients—around 0.28 for 1971–1989 and 0.15 for 1990–1998—and also document that larger firms exhibit stronger pecking order behavior than smaller firms, a counterintuitive result also noted by Fama and French (2002). More recent studies refine this interpretation by emphasizing the role of financing conditions. For instance, De Jong et al. (2010) report values close to 0.90 for firms with surpluses, around 0.74 for firms with normal deficits, and only 0.09 for firms with large deficits, highlighting the influence of debt capacity constraints. Likewise, Leary and Roberts (2010) stress that intermediate coefficients may reflect a combination of financing motives—such as information asymmetry, market timing, or agency conflicts—rather than a simple, linear degree of compliance.
3.2.2. Financing Deficit and Financing Surplus
To examine differences in pecking order behavior across firms with financing deficits, large deficits, small deficits, large surpluses, and small surpluses, we adopt the approach of De Jong et al. (2010) and estimate the model shown in Equation (2).
Under this specification, the pecking order coefficient for a given condition is calculated as bPO + b1. The xi,t represents control variables that capture different financing conditions, defined as follows. Deficit (DEF) is a dummy variable equal to one if the firm has a financing deficit. Large deficit (large_DEF) equals one if the firm’s financing deficit, scaled by total assets, is positive and above the 75th percentile. Large surplus (large_SUR) equals one if the firm’s financing surplus, scaled by total assets, is negative and below the 25th percentile. Small deficit (small_DEF) equals one if the financing deficit, scaled by total assets, is positive and below the 25th percentile. Small surplus (small_SUR) equals one if the financing surplus, scaled by total assets, is negative and above the 75th percentile.
3.2.3. Debt and Equity Issuance/Repurchase
To test the impact of large equity and debt issue on pecking order policy, we use the model of Shyam-Sunder and Myers (1999) as in Equation (1), controlling for debt issue and equity issue. An analogous specification is used to examine equity repurchases and debt redemptions.
4. Empirical Results
4.1. Results
4.1.1. Financing Deficit and Financing Surplus
We estimate Equation (1) using multiple econometric techniques, incorporating firm, industry, and year fixed effects. The results remain qualitatively unchanged across specifications.
Table 1 presents the results of the pecking order model. The estimated coefficient from Equation (1) is 0.703, indicating that dividend-paying firms tend to follow the pecking order policy—a finding consistent with Myers (1984) and Fama and French (2002).

Table 1.
Pecking order under financing deficit and financing surplus.
Next, we use Equation (2) to examine the impact of financing deficits and surpluses on pecking-order adherence. The results show an asymmetry: firms with deficits have a lower coefficient (0.671) compared with firms with surpluses (0.702). While the coefficient is statistically significant, the magnitude of the asymmetry is marginal. These results support prior findings (De Jong et al., 2010) that surpluses are associated with stronger adherence to the pecking order, although our narrower focus on dividend-paying firms may explain the smaller gap observed in our sample. Thus, our first hypothesis is supported.
4.1.2. Debt and Equity Issue
We split firms’ external funding decisions into two categories under financing deficit. We assume that firms with financing deficit and funding needs use two external sources of funds: they issue either debt or equity.
Using the approach of Chang and Dasgupta (2009) to define “large” issuance, we examine the impact of debt and equity issues on the pecking order coefficient. The results show that debt-issuing firms follow a tighter pecking order policy, with a coefficient of 0.901, whereas equity-issuing firms deviate significantly from the pecking order, with a coefficient of 0.073 (Table 2). These findings indicate that the type of security issued plays a decisive role in pecking-order adherence: debt issuance is strongly aligned with the theory, while equity issuance is not.
Table 2.
Pecking order under equity issue and debt issue.
This evidence is consistent with Hypothesis 2a, which supports that debt-issuing firms follow the pecking order model, and Hypothesis 2b, which supports that equity-issuing firms do not.
4.1.3. Debt and Equity Repurchase
We split firms’ repurchase decisions into two categories under financing surplus. We assume that firms with financing surplus use the excess cash holdings to pay down debt or repurchase equity. Lambrecht and Myers (2017) support that firms with surpluses and accumulated cash may prefer to lend excess cash, although we test only the debt redemption and equity repurchase under the purview of the pecking order.
The results show that debt-redemption firms follow the pecking order model closely, with a coefficient of 0.851, whereas equity-repurchasing firms do not, with a coefficient of 0.168 (Table 3). These findings align with Hypothesis 3a, which predicts that equity-repurchasing firms deviate from the pecking order, and Hypothesis 3b, which predicts that debt-redemption firms conform to it.
Table 3.
Pecking order under equity repurchase and debt redemption.
4.2. Robustness Checks
4.2.1. Large and Small Deficit/Surplus
We classify financing deficits into large and small categories (Table 4, left column). Firms with large deficits follow a looser pecking order (coefficient = 0.562) than those with small deficits (coefficient = 0.845). This pattern is consistent with the view that firms facing large deficits are more likely to encounter financial constraints, limiting their ability to issue additional debt and prompting greater reliance on equity financing (Shyam-Sunder & Myers, 1999; Chirinko & Singha, 2000; De Jong et al., 2010). Although De Jong et al. (2010) also find an asymmetry between large and small deficits, their estimated coefficient for large deficits is much lower (0.09) than in our study.
Table 4.
Pecking order under large/small financing deficit or surplus.
We split financing surpluses into large and small categories (Table 4, right column). The pecking order coefficients are statistically insignificant, indicating that neither large nor small surpluses affect pecking order behavior. This suggests that, under a financing surplus, managers tend to repay debt rather than repurchase equity. This result is consistent with De Jong et al. (2010), who report that both financially constrained and unconstrained firms prefer debt repayment in surplus situations.
4.2.2. Financing Deficit
Level of Deficit
We analyze how the pecking order coefficient changes across different levels of financing deficit (Figure 1). The results show a clear downward trend: as deficit levels rise, the pecking order coefficient decreases significantly7. This finding supports Hypothesis 1 for lower deficit levels, where firms adhere more closely to the pecking order.
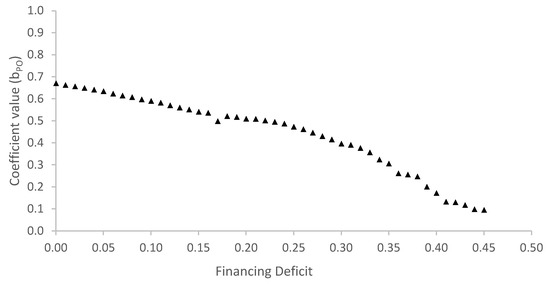
Figure 1.
The pecking order coefficient across different levels of financing deficits. The triangle—shaped dotted line represents the pecking order coefficient across different levels of financing deficit. The coefficient is calculated as bPO + b1 using Equation (2).
The decline in adherence at higher deficit levels is consistent with the argument that firms facing large outstanding debt or financial constraints cannot issue additional debt without exceeding their debt capacity. In such cases, firms resort to equity issuance to cover the remaining deficit, in line with prior evidence from Shyam-Sunder and Myers (1999), Chirinko and Singha (2000), and De Jong et al. (2010).
Level of Debt and Equity Issue
Figure 2 examines how the pecking order coefficient varies with the magnitude of debt and equity issuance8. The results reveal two contrasting patterns. First, the coefficient declines significantly as the level of debt issuance increases (Figure 2, left panel). This suggests that firms issuing very large amounts of debt may approach or exceed their debt capacity, prompting them to consider issuing riskier debt or equity—behavior that departs from strict pecking-order predictions (Chirinko & Singha, 2000; Lemmon & Zender, 2010).
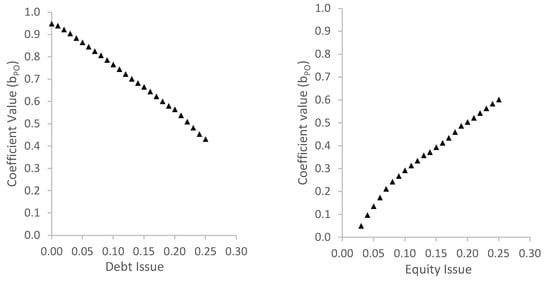
Figure 2.
The pecking order coefficient across different levels of security issues. The left panel shows the pecking order coefficient for debt issuance, based only on observations where firms issued debt. The right panel shows the coefficient for equity issuance, based only on observations where firms issued equity. The triangle-shaped dotted line represents the coefficient across different levels of security issuance. Coefficients are calculated using Equation (2).
Second, the coefficient increases as the level of equity issuance rises (Figure 2, right panel). There is an upward trend in the pecking order coefficient as the level of equity issuance increases, indicating that the theory becomes more relevant for larger equity issues (above 20%). The coefficient reaches its peak—slightly above 0.6—at very high issuance levels (around 25%). This suggests that, while firms issuing large amounts of equity align more closely with the pecking order than those issuing smaller amounts, overall adherence remains modest.
This likely reflects the influence of market timing considerations—firms issue equity when their market value is high relative to book value (Baker & Wurgler, 2002)—and the presence of unused debt capacity, which weakens the strict ordering predicted by the theory. In such cases, firms may retain unused debt capacity but opt for equity issuance to take advantage of favorable market conditions, representing a “semi-strong” form of the pecking order.
4.2.3. Financing Surplus
Level of Surplus
The results show no statistically significant relationship between surplus size and the pecking order coefficient9. This confirms our earlier finding that both small and large surpluses have no meaningful effect on firms’ adherence to the pecking order.
Level of Debt and Equity Repurchase
Figure 3 examines how the pecking order coefficient changes with the magnitude of debt redemption and equity repurchase. The patterns are asymmetric. On the one hand, the coefficient declines significantly as the level of debt redemption increases (Figure 3, left panel). Firms undertaking very large debt repayments are often highly profitable and hold substantial cash reserves, enabling them to retire past debt in large amounts. This behavior may reflect a strategy to maximize future financial slack (Khieu & Pyles, 2016), but the decline in the coefficient suggests a departure from the strict pecking order, in which debt repayment is favored but not to the extent that it crowds out all other uses of surplus funds.
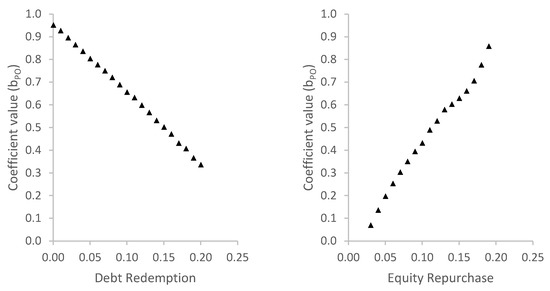
Figure 3.
The pecking order coefficient across different levels of security repurchase. The left panel shows the pecking order coefficient for debt redemption, and the right panel shows the coefficient for equity repurchase. The triangle-shaped dotted line represents the coefficient across different levels of the respective transaction.
We also observe that the pecking order coefficient increase as the amount of equity repurchases significantly increases; see, Figure 3, right panel. Firms with large equity repurchases are very profitable, have low debt-to-equity ratios and exhibit a high ratio of retained earnings to total assets. In that case, firms behave in line with the pecking order theory as they can easily cover any financing needs in the future internally without using their financial slack to repay debt.
5. Conclusions
This study examines whether, and to what extent, dividend-paying firms follow pecking order behavior when altering their capital structure. Using four financing activities—equity and debt issuance under a financing deficit, and equity repurchases and debt redemptions under a financing surplus—we find that firms generally follow the pecking order when issuing or redeeming debt but deviate from it when issuing or repurchasing equity.
Our study contributes to the capital structure and pecking order literature as it provides new insights into how pecking order policy is affected when firms make financing decisions. In particular, we provide novel evidence that firms follow a pecking order when they issue or reduce debt and do not follow a pecking order when they issue or repurchase equity.
We also examine whether pecking order behavior varies with the size of debt and equity issues and repurchases. We find that firms do not follow the pecking order when large amounts of debt are issued, whereas the coefficient increases for large equity issues, although it remains below 0.7. Furthermore, firms undertaking large debt repurchases deviate from the pecking order, while those making large equity repurchases exhibit high pecking order coefficients.
For investors, deviations from the pecking order—particularly in equity issuance or repurchase—can signal managerial views on firm valuation, market conditions, or financial flexibility. Observing whether a dividend-paying firm finances through debt or equity, and whether it redeems debt or repurchases shares, can provide insights into its capital structure constraints and strategic priorities.
Future research could extend this analysis beyond dividend-paying firms to include non-dividend payers, private firms, financial firms, utilities and firms operating in different institutional environments and regions. Additional avenues for exploration include examining the role of macroeconomic conditions (see, for details, Korajczyk and Levy (2003) and Cook and Tang (2010)) in shaping financing hierarchy decisions and assessing how behavioral factors—such as managerial overconfidence—affect compliance with the pecking order. In addition, a comparative analysis using alternative models would be a valuable extension, as it would allow for testing the robustness of the results across different empirical frameworks. Another promising avenue for future work would be to examine how regulatory frameworks—both in terms of stock market pricing rules and risk management requirements—shape firms’ adherence to the pecking order. For instance, disclosure rules, capital market regulations, or systemic risk controls could alter the relative costs of debt versus equity financing, thereby influencing the strength of pecking order behavior. Finally, an important avenue for future work would examine the causal relationship between financing decisions and pecking order behavior; for example, by employing instrumental variables or quasi-experimental designs.
Author Contributions
Conceptualization, K.K. and D.P.; methodology, K.K.; formal analysis, K.K.; investigation, K.K.; data curation, K.K.; writing—original draft preparation, K.K.; visualization, K.K.; supervision, D.P.; project administration, D.P.; funding acquisition, K.K. and D.P. All authors have read and agreed to the published version of the manuscript.
Funding
This research received no external funding.
Data Availability Statement
The original contributions presented in this study are included in the article. Further inquiries can be directed to the corresponding author.
Acknowledgments
This work has been partly supported by the University of Piraeus Research Center.
Conflicts of Interest
The authors declare no conflicts of interest.
Abbreviation
The following abbreviation is used in this manuscript:
| PO | Pecking order |
Appendix A
- Definitions of variables
- Total assets: item 6
- Retained earnings: item 36
- Deficit: change in total assets minus change in retained earnings scaled by total assets
- Surplus: negative values of deficit
- Net equity issue: change in book equity minus change in retained earnings scaled by total assets
- Book equity: total assets minus total liabilities (item 181) and preferred stocks plus deferred taxes and investment tax credit (item 35) plus convertible debt (item 79)
- Preferred stocks: item 10, or item 56 if item 10 is missing, or item 130 if item 10 and item 56 is missing
- Net equity repurchase: negative values of net equity issues
- Net debt issue: change in total assets minus change in retained earnings minus net equity issue scaled by total assets
- Net debt repurchase: negative values of net debt issue
Notes
| 1 | We note that Hypothesis 1 serves primarily as a confirmatory test of prior findings (De Jong et al., 2010), whereas Hypotheses 2a–3b represent our novel contribution by distinguishing between debt issuance, equity issuance, debt redemption, and equity repurchase. To our knowledge, this disaggregation has not been systematically tested in the literature. |
| 2 | We also examine firms with at least 10 and 15 consecutive years. The results remain essentially the same. |
| 3 | As a robustness check, we also re-estimated the models using alternative thresholds (1–99% and 2.5–97.5%). The results are highly consistent with our baseline estimates, suggesting that our findings are not sensitive to the winsorization procedure. For brevity, the detailed results are not reported. |
| 4 | We also examine a different period from 1971 to 2020. The results remain essentially the same. |
| 5 | Controlling for equity issue or debt issue. |
| 6 | Controlling for equity repurchase or debt redemption. |
| 7 | While the overall trend indicates that the pecking order coefficient declines as financing deficits increase, there are atypical points in the pattern. In particular, around deficit levels of 0.15–0.20, there appear to be some irregularities, suggesting that the relationship is not strictly linear. |
| 8 | Very large debt and very large equity issues are defined as transactions exceeding 10% of total assets. |
| 9 | Due to the lack of statistically significant effects, the detailed estimates and figure are omitted for brevity. |
References
- Baker, M. P., & Wurgler, J. A. (2002). Why are dividends disappearing? An empirical analysis (NYU Working Paper No. FIN-02-056). NYU Stern School of Business.
- Chang, X., & Dasgupta, S. (2009). Target behavior and financing: How conclusive is the evidence? The Journal of Finance, 64(4), 1767–1796. [Google Scholar] [CrossRef]
- Chirinko, R. S., & Singha, A. R. (2000). Testing static tradeoff against pecking order models of capital structure: A critical comment. Journal of Financial Economics, 58(3), 417–425. [Google Scholar] [CrossRef]
- Cook, D. O., & Tang, T. (2010). Macroeconomic conditions and capital structure adjustment speed. Journal of Corporate Finance, 16(1), 73–87. [Google Scholar] [CrossRef]
- DeAngelo, H. (2022). The capital structure puzzle: What are we missing? Journal of Financial and Quantitative Analysis, 57(2), 413–454. [Google Scholar] [CrossRef]
- De Jong, A., Verbeek, M., & Verwijmeren, P. (2010). The impact of financing surpluses and large financing deficits on tests of the pecking order theory. Financial Management, 39(2), 733–756. [Google Scholar] [CrossRef]
- Denis, D. J., & McKeon, S. B. (2012). Debt financing and financial flexibility evidence from proactive leverage increases. The Review of Financial Studies, 25(6), 1897–1929. [Google Scholar] [CrossRef]
- Dittmar, A. K. (2000). Why do firms repurchase stock. The Journal of Business, 73(3), 331–355. [Google Scholar] [CrossRef]
- Fama, E. F., & French, K. R. (2002). Testing trade-off and pecking order predictions about dividends and debt. Review of Financial Studies, 15, 1–33. [Google Scholar] [CrossRef]
- Frank, M. Z., & Goyal, V. K. (2003). Testing the pecking order theory of capital structure. Journal of financial economics, 67(2), 217–248. [Google Scholar] [CrossRef]
- Frank, M. Z., & Goyal, V. K. (2009). Capital structure decisions: Which factors are reliably important? Financial Management, 38(1), 1–37. [Google Scholar] [CrossRef]
- Hovakimian, A., Opler, T., & Titman, S. (2001). The debt-equity choice. Journal of Financial and Quantitative Analysis, 36(1), 1–24. [Google Scholar] [CrossRef]
- Huang, R., & Ritter, J. R. (2009). Testing theories of capital structure and estimating the speed of adjustment. Journal of Financial and Quantitative Analysis, 44(2), 237–271. [Google Scholar] [CrossRef]
- Jagannathan, M., Stephens, C. P., & Weisbach, M. S. (2000). Financial flexibility and the choice between dividends and stock repurchases. Journal of Financial Economics, 57(3), 355–384. [Google Scholar] [CrossRef]
- Khieu, H. D., & Pyles, M. K. (2016). The influence of a credit rating change on dividend and investment policy interactions. Financial Review, 51(4), 579–611. [Google Scholar] [CrossRef]
- Korajczyk, R. A., & Levy, A. (2003). Capital structure choice: Macroeconomic conditions and financial constraints. Journal of Financial Economics, 68(1), 75–109. [Google Scholar] [CrossRef]
- Lambrecht, B. M., & Myers, S. C. (2017). The dynamics of investment, payout and debt. The Review of Financial Studies, 30(11), 3759–3800. [Google Scholar] [CrossRef]
- Leary, M. T., & Roberts, M. R. (2010). The pecking order, debt capacity, and information asymmetry. Journal of Financial Economics, 95(3), 332–355. [Google Scholar] [CrossRef]
- Lemmon, M. L., & Zender, J. F. (2010). Debt capacity and tests of capital structure theories. Journal of Financial and Quantitative Analysis, 45(5), 1161–1187. [Google Scholar] [CrossRef]
- Myers, S. C. (1984). The capital structure puzzle. The Journal of Finance, 39, 575–592. [Google Scholar] [CrossRef]
- Myers, S. C., & Majluf, N. S. (1984). Corporate financing and investment decisions when firms have information that investors do not have. Journal of Financial Economics, 13(2), 187–221. [Google Scholar] [CrossRef]
- Shyam-Sunder, L., & Myers, S. C. (1999). Testing static tradeoff against pecking order models of capital structure. Journal of Financial Economics, 51(2), 219–244. [Google Scholar] [CrossRef]
- Stephens, C. P., & Weisbach, M. S. (1998). Actual share reacquisitions in open-market repurchase programs. The Journal of Finance, 53(1), 313–333. [Google Scholar] [CrossRef]


Disclaimer/Publisher’s Note: The statements, opinions and data contained in all publications are solely those of the individual author(s) and contributor(s) and not of MDPI and/or the editor(s). MDPI and/or the editor(s) disclaim responsibility for any injury to people or property resulting from any ideas, methods, instructions or products referred to in the content. |
© 2025 by the authors. Licensee MDPI, Basel, Switzerland. This article is an open access article distributed under the terms and conditions of the Creative Commons Attribution (CC BY) license (https://creativecommons.org/licenses/by/4.0/).