Abstract
We offer a novel explanation for the widespread decline in U.S. firms’ reported book equity. We find that accounting conservatism is negatively associated with book equity, a result that is both economically and statistically significant, as well as robust to a variety of model specifications. Our findings suggest that the rise in accounting conservatism has significantly contributed to the declines in book equity over the decades.
JEL Classification:
G30; G31
1. Introduction
Shareholder’s equity, also known as book equity (BE), represents the amount of a firm’s common equity available for distribution to shareholders. BE is a widely used measure that is found in many financial ratios that are commonly used by investors, analysts, firm managers, and other users of financial statements. BE also plays an important role in equity valuation and portfolio construction. For example, investors and financial analysts use BE to differentiate value stocks from growth stocks by calculating price-to-book ratios. Given the wide application of BE in practice, the stability of this measure over time has significant implications. However, recent evidence in the financial press, as well as in the finance and accounting literature, has raised concerns about an inherent change in levels of BE over time. Anecdotal evidence suggests that a number of major American corporations presently exhibit significantly lower book values in comparison to their market valuations (The Economist, 2019). While this may reflect a relative increase in market values, we also observe an increasing number of firms—such as AutoZone, Inc. and McDonald’s Corporation—reporting negative or declining book equity in absolute terms. A growing body of evidence documents a secular decline in book equity among U.S. firms (e.g., Fama & French, 2008; DeAngelo & Roll, 2015; Luo et al., 2019), motivating renewed interest in its underlying causes.
Given this observed trend of declining book equities among firms over time, it is interesting to examine the contributing factors. Very few studies in the extant accounting and finance literature examine this phenomenon; however, the prior literature on earnings, capital structure, and intangible assets provides us with three plausible explanations.
Our analysis complements existing explanations—such as deteriorating profitability, increasing reliance on debt financing, and the growth of unrecorded intangible assets—by offering a novel empirical investigation of accounting conservatism as an additional contributing factor to the long-run decline in book equity.
To begin with, empirical studies on corporate earnings (Burgstahler & Dichev, 1997; Barth et al., 1998; Collins et al., 1999) have shown a notable rise in the incidence of reported losses over recent decades. This widespread decline in reported earnings slows the growth of—or, when earnings turn negative, directly reduces—retained earnings. When combined with increasing payout ratios, this pattern contributes to the observed level and growth decline in book equity over time.
Secondly, Graham et al. (2015) highlight that, over the past hundred years, the overall leverage of U.S. companies has surged more than threefold, largely due to a significant rise in debt financing among firms not subject to regulatory constraints. Similarly, DeAngelo and Roll (2015) document that, from 1950 to 2008, more firms increased leverage than decreased it, indicating that firm capital structures have not been stable over time and suggesting a trend toward more aggressive borrowing. Philippon (2009) finds that there was an increase in average book leverage over the postwar period for non-financial firms. Taken together, the empirical findings imply that the growing preference for debt over equity in corporate capital structures has naturally contributed to the observed long-term decline in book equity values.
Last, as suggested by Hulten and Hao (2008) and Park (2019), it is possible that the downward trend of BE is a result of an increased prevalence of intangible capital investments. In recent decades, the nature of firm values has changed, with an increased role of intangible assets compared to physical assets. Both studies argue that current conservative accounting rules exclude these hard-to-value intangibles from balance sheets, and consequently, we observe smaller total assets, which results in smaller book equity. In other words, the decreasing trend of BE over time reflects the increasing relative importance of off-balance sheet intangible capital investments. Notably, Hulten and Hao (2008) find that adding omitted intangibles back into the conventional balance sheet will increase book equity by 141 percent for a typical R&D-intensive firm.
While the three plausible explanations above may implicitly explain the cross-sectional variation of book equity amounts, they do not propose any testable hypotheses or perform any tests to formally examine which factors could explain the decreases in BE. In this paper, we propose a direct and new explanation for the systemic decreases in BE. We argue that a significant portion of the decrease in BE over time can be explained by increased accounting conservatism. According to this principle, company accounts are prepared with caution, causing reported earnings to asymmetrically incorporate more economic losses than gains (Basu, 1997). In other words, accounting conservatism reflects firms’ tendencies to require higher degrees of verification when recognizing good news compared to bad news in financial statements. Consequently, probable losses are recorded when they are discovered, while gains are only recognized when they are fully realized, leading to understated financial reports. Accounting conservatism has a significant impact on how firms’ economic values translate to earnings and book values of equity. A few examples of conservative accounting include expensing the cost of internally generated intangible assets immediately, realizing expected losses immediately while realizing expected gains only once recognized, amortizing long-term assets at rates above their expected economic amortization rates, using the lower of the cost or market method when valuing inventory, and impairment accounting for amortizable assets. All of these examples lead to either understated earnings, understated book values, or both. As a result, higher levels of accounting conservatism lead to book values of equity understated relative to their market values.
We conjecture that accounting conservatism is an understated factor that contributes to the decrease in book equity over time. Since BE and accounting policy are contemporaneous, modeling the relationship between the two can be problematic due to endogeneity concerns. Following the previous literature (Harford et al., 2008; Love et al., 2007), we examine whether the lagged level of accounting conservatism is related to a firm’s future BE. Using a sample of U.S. public firms between 1970 and 2017, our panel regression models confirm that accounting conservatism significantly contributes to explaining the decline in BEs over time. Consistent with our predictions, we find that accounting conservatism is negatively associated with book equity. This result is both economically and statistically significant, as well as robust to a variety of model specifications that address the potential endogeneity concerns between accounting conservatism and BE. We also investigate how the effects of accounting conservatism vary over time by estimating regression models separately for each decade. Our results suggest that the impact of accounting conservatism increases in each decade until the 1990s, after which it diminishes and becomes insignificant.
In addition, we employ a conditional quantile regression approach to estimate the coefficients at various levels of BE to further examine the effects of accounting conservatism on firms with different levels of BE.1 It is possible that the effects of accounting conservatism may vary with levels of BE and become significant only for firms that fall within certain portions of the BE distribution. An additional advantage of the quantile regression approach is that it can mitigate any outlier effects that exist in generic regression models and relaxes traditional assumptions on error distributions. Our quantile regression results suggest that although the negative effects of accounting conservatism are persistent across the BE distribution, the effects increase monotonically with the level of BE. In particular, the estimated coefficients are both larger in magnitude and more significant for the upper quantiles compared to the lower quantiles.
Finally, to mitigate any concerns of endogeneity caused by model misspecification, we further address the link between accounting conservatism and decreases in book equity by employing a propensity score matching method (following Stuart & Rubin, 2008). The propensity score matching method offers advantages over more traditional regression methods to control for confounding variables because propensity score matching does not rely on inherently untestable modeling assumptions. Our results are consistent with previous findings and demonstrate that the relationship between accounting conservatism and book equity remains robust after controlling for potential endogeneity concerns.
While we highlight three prominent explanations—rising losses, higher leverage, and the accounting treatment of intangibles—we emphasize that our analysis treats accounting conservatism as a complementary, economy-wide mechanism that depresses the level and growth of book equity, rather than necessarily implying a decrease for every firm-year with positive earnings. We elevate conservatism because it operates as a structural, economy-wide mechanism that accumulates on balance sheets through asymmetric recognition of losses versus gains, thereby persistently depressing retained earnings and equity relative to a counterfactual without conservatism (Basu, 1997; Watts, 2003). Conservatism is demanded by debtholders and reinforced by contracting, which lowers debt costs and encourages greater reliance on debt (Ahmed et al., 2002; Beatty et al., 2008; Haw et al., 2014). It is also shaped by standard-setting and enforcement. Post-2000 developments—heightened SOX enforcement, the mandatory expensing of employee stock options under FAS 123R, and the impairment-only model for goodwill under SFAS 142—tilted recognition further toward timely losses and away from symmetric gains (Lobo & Zhou, 2006; FASB, 2004). At the same time, the economy’s rising intangibles share magnifies these effects because GAAP generally expenses internally generated intangibles and subjects acquired intangibles and goodwill to impairment tests, increasing the incidence and magnitude of charges that flow through to BE (Givoly & Hayn, 2000; Ball & Shivakumar, 2006; Corrado & Hulten, 2010; Peters & Taylor, 2017). Consistent with this rationale, we benchmark conservatism against leverage and profitability in two ways: (i) quantile regressions show that conservatism’s negative association with BE is strongest for high-BE firms, and (ii) a decomposition reveals that, across decades, the changing sensitivity of BE to conservatism contributes more to BE declines on average than the corresponding sensitivity effects of leverage or profitability.
Our study contributes to the empirical literature on book equity by providing a new explanation for the decreasing BE phenomenon among U.S. firms, as well as quantifying the levels of decreases in BE that are attributable to accounting conservatism. We also quantify conservatism’s contribution relative to leverage and profitability, showing that the changing sensitivity of conservatism dominates on average across decades, while conservatism’s negative effect is strongest among high-BE firms. Unlike previous studies that only document the decreasing trend of BE, without explicit tests of potential explanatory factors, the direct tests presented in this paper advance our understanding of how accounting conservatism will affect BE. This effect is systemic and statistically robust. We also show that the effects of accounting conservatism are not constant across firms with different levels of BE, as the effect is more pronounced for high-BE firms. In contrast, accounting conservatism plays a less important role in explaining the decreasing trend of BE for low-BE firms.
Our findings also extend the literature on the effects of accounting conservatism on financial statements and equity valuation. Prior studies have focused more on the effects of accounting conservatism on earnings quality (Dichev & Tang, 2008), accrual quality (Dechow & Dichev, 2002), and earnings management (Jackson & Liu, 2010). Very few studies have investigated how accounting conservatism may affect book equity on the balance sheet, which has important implications for financial analysis and valuations. For example, as BE systematically decreased over time, all BE-based valuation metrics have increased mechanically. Since our results suggest that accounting conservatism is an important factor that contributes to the declines of BE, financial analysts and other users of financial statements can make the necessary adjustments to valuations of companies with varying levels of accounting conservatism and book equity. Our results, therefore, provide additional insights for equity market users of financial statements who rely on BE-based valuation metrics such as the market-to-book ratio to construct portfolios or to forecast information about equity securities.
The remainder of this paper is organized as follows. Section 2 reviews the prior literature and provides a theoretical discussion of possible channels through which accounting conservatism may affect BE. Section 3 offers a comprehensive overview of the long-term trajectories of book equity and accounting conservatism, highlighting their interrelation and linking these patterns to prior research on the increasing incidence of negative book equity. Section 4 details our sample and model construction, as well as presents summary statistics. Section 5 outlines the findings from our panel regression analysis, evaluates the extent to which shifts in book equity are influenced by accounting conservatism, and assesses the robustness of these results using alternative indicators of conservatism. Section 6 addresses potential endogeneity concerns by employing both a conditional quantile regression and a two-stage propensity score matching method. Finally, Section 7 summarizes our findings and concludes the study.
2. Accounting Conservatism’s Role in Decreasing Book Equity
Accounting Conservatism may affect BE through multiple channels. In this section, we discuss these possible channels by surveying the relevant literature on accounting conservatism.
2.1. Earnings Channel
Accounting conservatism has a significant impact on financial reporting. For example, Watts (2003) points out that “conservatism refers to the cumulative financial effects represented in the balance sheet and to income or earnings accumulated since the firm began operation.” Recent research findings and anecdotal evidence suggest that accounting conservatism is becoming more prevalent over time. As stated in Givoly and Hayn (2000), due to the application of numerous FASB pronouncements that require early recognition of expenses and anticipated future losses in income and the deferral of gains until they are realized, earnings recognition has become more conservative in the past several decades. The direct consequence of these accounting standards is that current earnings place more emphasis on potentially adverse than favorable circumstances. As a result, the adoption of an increasing number of conservative accounting standards over time has made earnings less useful (Bandyopadhyay et al., 2010). The asymmetric treatment of gains and losses persistently understates earnings, as well as book equity values (Watts, 2003).
In addition, the effect of accounting conservatism on earnings is likely amplified by the increasingly important role of intangible capital in recent decades. As the world economy has moved towards more knowledge- and service-based industries, company valuations have been shifting from a reliance on tangible to intangible assets. Intangible assets are now key drivers of shareholder value in this knowledge economy. According to an estimation by Corrado and Hulten (2010), intangible capital makes up 34% of firms’ total capital in recent years. As intangible capital increases, relevant expenses soar accordingly (Peters & Taylor, 2017). Because current GAAP requires most internally generated intangibles to be expensed rather than capitalized, financial statements may under-represent the growth in intangible capital, creating a measurement gap between the economic value and reported book value. A few examples of how the principles of accounting conservatism affect the recordkeeping of intangible capital are the requirement of immediate expensing of the costs of internally generated intangible assets, the amortization of long-lived assets, and impairment accounting for long-lived intangible assets. All of these negatively impact current earnings. As a result, an increase in intangible-asset intensity causes an increase in conservatism, which in turn further reduces earnings. We do not advocate unrestricted capitalization of intangibles—doing so could indeed facilitate upward earnings management—but rather point out that conservative recognition rules, while mitigating overstatement risk, also contribute to the structural understatement of book equity.
The rise of accounting conservatism, coupled with an increased prevalence of intangible assets, leads to earnings that have become more dispersed and negatively skewed relative to cash flows (Givoly & Hayn, 2000). Many studies, such as those by Givoly et al. (2007), Bandyopadhyay et al. (2010), and Ball and Shivakumar (2006), have found that earnings over the last few decades have persistently and significantly decreased due to increasing conservatism. This structural decrease in earnings has invariably flowed through to the values of book equity. The asymmetric treatment of gains and losses due to accounting conservatism has persistently understated levels of the book values of firms relative to market values, which are less influenced by accounting conservatism (Basu, 1997; Kabir & Laswad, 2014).
We therefore focus on the fact that conservatism lowers retained earnings relative to a counterfactual without conservatism, increases the likelihood and magnitude of write-offs/impairments, and raises the frequency of losses, which together depress the level and growth of book equity and increase the likelihood of negative book equity, even if some firms still report small positive earnings.
2.2. The Demand for Public Debt Financing Channel
Lenders face agency costs in debt financing due to information asymmetry. As an imperfect solution, debt contracting has evolved to reduce these costs. For example, measures such as debt covenants are used to protect bondholders; however, these contractual mechanisms alone can be ineffective in reducing agency costs due to high renegotiation costs (Diamond, 1984; Fama, 1985; Dichev & Skinner, 2002). Accounting conservatism, on the other hand, can lessen the agency costs of debt by incorporating timely accounting information, especially that related to losses, into financial statements. Faced with asymmetric payoffs (i.e., limited upside benefits but significant downside risk), debt holders welcome an accounting system that recognizes losses rather than gains in a timely manner and are willing to pay for it in the form of reduced costs of debt. In addition, the prevalence of accounting conservatism also facilitates the signaling role of debt covenants on declines in debt value and avoids costly renegotiation. This early warning can help lenders be informed of new information about any economic challenges faced by borrowing firms and enable lenders to take disciplinary actions against borrowers before the value of collaterals drops significantly. As a result, we conjecture that accounting conservatism helps firms reduce the costs of financing and incentivizes firms to use more debt relative to more expensive equity. Supporting this conjecture, Ahmed et al. (2002) find that among firms with severe shareholder–bondholder conflicts, those with more conservative financial reporting have lower costs of debt and higher leverage. Furthermore, Beatty et al. (2008) find that conservative clauses in debt contracting cannot replace conservative reporting on reducing agency problems and that both are demanded by debtholders. Finally, Haw et al. (2014) find that highly leveraged firms and firms perceived as financially risky are more likely to adopt accounting conservatism to attract lenders and increase leverage in their capital structures. The benefits of accounting conservatism to firms result in lower costs of debt and higher leverage, which negatively affect the values of book equity on balance sheets.
2.3. Beyond Intangibles: Broader GAAP Changes and Enforcement
Beyond the accounting for internally generated intangibles, a series of standard-setting and enforcement changes over the last decades—e.g., SFAS 121 and SFAS 142 impairment testing, ASC 450 contingent loss recognition, lower-of-cost-or-market inventory valuation, FAS 123R option expensing, and heightened post-SOX enforcement—have systematically increased the asymmetry in recognizing losses versus gains (Givoly & Hayn, 2000; Watts, 2003; Ball & Shivakumar, 2006; Beatty et al., 2008; Francis et al., 2013). Our results remain robust when we measure conservatism using alternative earnings–returns- and accrual–cash flow-based proxies, indicating that our findings are not solely driven by the intangibles channel. Moreover, the SOX certification regime increased asymmetric loss recognition and reduced managerial discretion, consistent with documented post-SOX rises in conservatism (Lobo & Zhou, 2006). Complementary standard-setting—FAS 123R option expensing and SFAS 142 impairment-only testing—further increased the frequency and volatility of charges that reduce BE, especially in intangible-intensive industries.
3. Intertemporal Trends of Book Equity and Accounting Conservatism
Earlier research on book equity has identified a downward trend in book equity levels over time, alongside a growing prevalence of firms reporting negative book equity. In this paper, we argue that these empirical regularities may be explained by accounting conservatism. The previous section provides some theoretical rationales of how accounting conservatism may affect BE over time. In this section, we present some descriptive evidence that supports our motivation and show how BE and accounting conservatism vary over time. Following the approach of Fama and French (2008), book equity (BE) is computed by summing shareholders’ equity, deferred taxes, and investment tax credits, and subtracting the book value of preferred stock. For consistency and comparability across firms, BE is standardized by total assets.
Our measure of accounting conservatism, C-score, is the firm-year asymmetric timeliness score developed by Khan and Watts (2009) that draws on the model of Basu (1997) in regression Equation (1) and further estimates the timeliness of good news (G-score) and conservatism (C-score) as linear functions of firm-specific characteristics each year in Equations (2) and (3) below:
where NI is net income; RET is returns; D is a dummy variable equal to 1 if RET is negative, and 0 otherwise; SIZE is firm size; MB is the market-to-book ratio; and LEV is the leverage ratio.2 We substitute and from Equations (2) and (3) into regression Equation (1) to obtain the annual cross-sectional regression model used to estimate G-score and C-score in Equation (4):
G-score measures how timely a firm reports good news, while C-score indicates the incremental timeliness to report bad news over good news. In other words, conservatism is increasing in the C-score.
Figure 1 plots the secular trend in BE of high and low accounting conservatism firms. We define high accounting conservatism firms each year as those with the above-median C-score of all firms during the preceding year (and low accounting conservatism firms each year fall below the median). As Figure 1 clearly shows, although we observe the systemic decrease in BE for both groups, the decreasing trend is more pronounced for high accounting conservatism firms with an average yearly decreasing rate of 0.4%, whereas the average annual decreasing rate for low accounting conservatism firms is only 0.17%. Also, the BE is consistently lower for high accounting conservatism firms than low accounting conservatism firms throughout our sample period. The observed evolution of BE for high and low accounting conservatism firms provides the first piece of evidence to support our hypothesis that the decrease in BE has been more significant in more conservative firms. In Figure 2, we further plot the BE of firms according to high- and low-conservative industries. An industry is classified as high accounting conservative if the average C-score for the industry during the preceding year is greater than the median average C-score across all industries, and an industry is classified as low accounting conservative if its average C-score falls below the median (Hirshleifer et al., 2012). We see a similar pattern in Figure 2. The secular decrease in BE is largely present among conservative industries, in sharp contrast to the relatively more stable BE of less conservative industries. We note that time-trend coefficients are statistically significant in both 0.769 figures.
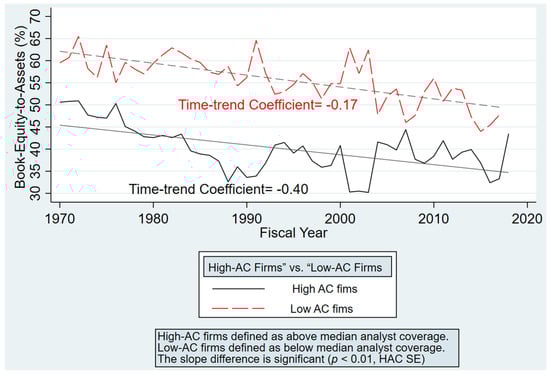
Figure 1.
Book equity by accounting conservative (AC) firms.
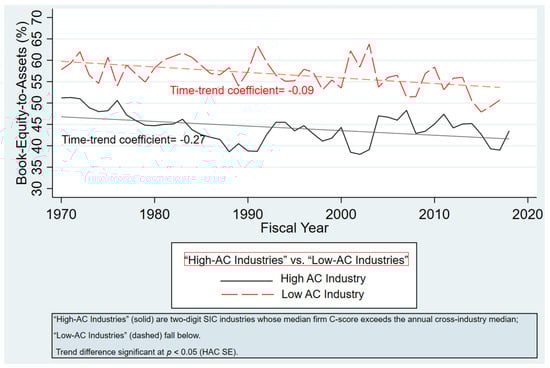
Figure 2.
Book equity by accounting conservative (AC) industries.
According to Luo et al. (2019), the downward trend in book equity may also be influenced by a marked rise in the proportion of firms reporting negative book equity since the 1970s. Figure 3 presents the time series trends in both the annual incidence of such firms and the level of accounting conservatism. The figure shows that the frequency of negative book equity firms has increased from essentially 0 percent of total firms in the 1970s to a peak of almost 10 percent in the early 2000s. In the most recent decade, the percentage of firms with negative book equity has dropped slightly to 8 percent. Figure 3 shows that, although less correlated with the frequency of negative book equity firms before 1985, the time series trend of accounting conservatism is generally consistent with that of the frequency of negative book equity firms in more recent decades. In fact, we find that the correlation coefficient between the two is 64.47 percent and significant at the 1 percent level.
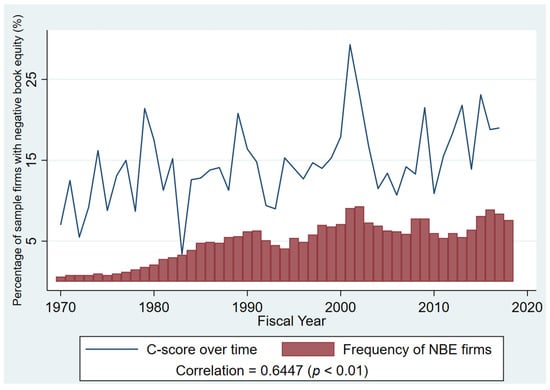
Figure 3.
Accounting conservatism vs. negative book equity (NBE) firms.
4. Data and Methodology
4.1. Model Construction
In order to formally test how accounting conservatism affects book equity, we develop a panel model, utilizing C-score as our independent variable of interest and control for a vector of firm characteristics that are related to BE. Although prior research has not developed a dominant model to explicitly explain BE, several key variables with explanatory power are suggested by previous studies. The following is a brief description of control variables based on the literature:
Following Lev (1983), Dechow et al. (1998), Asthana and Zhang (2006), Bandyopadhyay et al. (2010), and others, firm size is defined as the natural log of a firm’s total assets, and tangibility is defined as the ratio of property, plant, and equipment to book assets.3 Capital expenditure is measured by the level of capital expenditures divided by total assets. Following Ang et al. (2000), we also control for the asset utility ratio, which is calculated as annual sales divided by total assets. This ratio is a measure of how effectively the firm’s management deploys its assets, with lower ratios indicating worse performance due to poor investment decisions by managers or lower revenues due to insufficient effort by managers. Industry sales volatility is measured using the standard deviation of sales relative to total assets over a rolling five-year window for each industry, classified by two-digit SIC codes. The working capital ratio is computed by dividing a firm’s working capital by its total assets. Tobin’s q, which captures the market’s aggregate perception of a firm’s financial condition, is defined as the ratio of the firm’s current market value to the estimated replacement cost of its assets. Following Petersen and Rajan (1997), we also control for age as the natural log of one plus the number of years since firm incorporation.
In addition, we control for factors that directly affect levels of BE on financial statements, such as leverage, profitability, and payout policy decisions. Leverage is calculated as total debt divided by total assets. Profitability is calculated as operating income before depreciation, scaled by total assets. Share repurchase is defined as the ratio of share repurchases to total assets. Dividend dummy takes on the value of 1 if the firm pays a dividend in a given year, and 0 otherwise. Finally, retained earnings is calculated as the level of retained earnings divided by total assets.
We investigate the cross-sectional drivers of book equity (BE) for all firms in our sample by estimating the empirical panel model outlined below, which captures firm-specific characteristics influencing BE over the entire sample period:
In this model, BE denotes the ratio of book equity to total assets for firm i in year t, serving as the dependent variable in our analysis, while C_score denotes the accounting conservatism measure developed by Khan and Watts (2009). The vector X includes the control variables previously defined. To address concerns about reverse causality, all independent variables are lagged by one year. To further reduce endogeneity concerns, Equation (5) also includes industry () and year fixed effects () to eliminate any time-invariant, omitted variables in the error term.
4.2. Sample Construction and Descriptive Statistics
The initial dataset consists of all U.S.-incorporated industrial firms listed in Compustat from 1971 to 2017, excluding companies in the financial sector (SIC codes 6000–6999); the utilities sector (SIC codes 4900–4999); and those categorized under public service, international affairs, or non-operating entities (SIC codes above 9000).4 We exclude firms with incomplete financial data, non-positive values for assets or sales, and duplicate entries. A firm-year is included in the sample only if the firm appears in the panel at least three times in the year preceding the observation. Due to the inclusion of lagged variables in our regression models, firms with fewer than two consecutive years of data are also removed. To minimize the influence of outliers, all regression variables are winsorized at the 1% level. The resulting sample comprises 87,382 firm-year observations representing 8706 distinct firms from 1971 to 2017.
Table 1 presents descriptive statistics for the complete dataset. The average book equity-to-asset ratio stands at 0.53, with a median value of 0.54, with values ranging from −0.77 to 0.94.5 The mean (median) value of C-score is 0.15 (0.14). This number is slightly higher than those computed by Khan and Watts (2009), which uses a sample consisting of 115,516 firm-years between 1963 and 2005. This difference is partially due to sample construction but also suggests that accounting conservatism has become more prevalent in recent years, as argued by other studies (Watts, 2003; Givoly & Hayn, 2000; Bandyopadhyay et al., 2010). For example, using a sample of 6326 firms between 2007 and 2009, Francis et al. (2013) find that the mean (median) C-score is 0.209 (0.188), which is even higher than those of our sample. The summary statistics for the remaining variables are similar to prior studies. The average value of firm size, as measured by the natural log of a firm’s total assets, is 5.35. Sample firms have an average leverage ratio of 0.21, and tangible assets account for approximately 30% of total assets on average. The mean (median) asset utility ratio is 1.32 (1.19), the mean (median) capital expenditure ratio is 0.07 (0.05), and the average profitability is 12% of book assets. The mean (median) Tobin’s q in the sample is 2.75 (2.00), and the average working capital is 29% of total assets. Finally, the average firm age is 15.51 years, and 46% of observations pay a dividend. Only 1% of firms over the sample period make share repurchases.

Table 1.
Summary statistics.
Table 2 reports pairwise correlation coefficients (panel A), as well as variance inflation factor (VIF) information (panel B), for the variables used in this study. As anticipated, C-score exhibits a statistically significant negative correlation with book equity at the 1% level. Conversely, variables positively associated with book equity include share repurchases, capital expenditures, Tobin’s q, retained earnings ratio, working capital ratio, and profitability. Variables found to be negatively associated with book equity include leverage, firm size, the dividend dummy, industry sales volatility, asset tangibility, firm age, and the asset utility ratio. All of these correlation coefficients are significant at the 1% level; however, none of them are of sufficient magnitude to suggest a collinearity problem. Overall, the correlation coefficients are largely consistent with our expectations. In addition, to formally test for multicollinearity, we calculate the VIFs for our variables, and our results show that the average VIF is 1.57 and that none of the variables have a VIF higher than 10. Therefore, we conclude that multicollinearity is not a major concern in our model.
Table 2.
Pearson correlation coefficients and VIFs.
5. Accounting Conservatism and Book Equity: Panel Regression Analysis
5.1. How Accounting Conservatism Affects BE
To assess the impact of accounting conservatism on book equity (BE), we begin by estimating the unbalanced panel data regression outlined in Equation (5). Table 3 reports the results across multiple model specifications. For all regressions, t-statistics are computed using robust standard errors clustered at the firm level, following the approach recommended by Petersen (2008). We perform the Breusch and Pagan (1980) Lagrange Multiplier Test, which rejects the use of pooled OLS with a single intercept. Moreover, the Hausman test (Hausman, 1978) indicates that fixed-effects models are more appropriate for analyzing our dataset.
Table 3.
Cross-sectional relationship between accounting conservatism and book equity.
In column (1) of Table 3, we report results from a panel regression using all firms in the sample period. In this regression, we attempt to control for unobserved, time-invariant factors by incorporating industry fixed effects. We further control for unobserved, year-specific factors by incorporating year fixed effects. The results in column (1) show that accounting conservatism, as measured by C-score, is a significant determinant of firms’ BE. The estimated coefficient is -0.0348 and statistically significant at the 1 percent level. Given that the average BE in our sample is USD 705 million, this result suggests that a 1 unit increase in C-score will result in a USD 25 million decrease in BE. In addition, the estimated coefficient on profit is positive, which is consistent with the prior literature (Fama & French, 2008) that argues that the decrease in BE over time is due to systematically deteriorating profitability across firms. The leverage coefficient is found to be negative and statistically significant at the 1% level, aligning with the findings of Philippon (2009) and Graham et al. (2015), who document a substantial rise in debt reliance among unregulated firms over time. This increase in leverage explains firms’ gradually contracting equity portions on balance sheets due to expanding debt. In column (3), we modify the regression by controlling for firm fixed effects rather than industry fixed effects. The results are qualitatively similar to the results found in column (1), but the absolute value of the coefficient on C-score is smaller.
To address the issue of a change in sample composition over our sample period, a subsample consisting of firms that remain active throughout the entire 1971–2017 period is created, and the regression outcomes for these persistent firms are presented in column (2). Our sample of surviving firms is reduced to 1739 firm-year observations with 37 unique firms. The estimated coefficient on C-score remains negative and statistically significant at the 10% level. When compared to the full sample in column (1), the negative effect of accounting conservatism is more pronounced for surviving firms, as the absolute value on the estimated coefficient on C-score is larger.
In column (4) of Table 3, we modify the model estimated in column (1) by using lagged changes (first-differences) in the variables rather than levels. With this approach, we attempt to eliminate the impact of unobservable firm characteristics on BE. In addition, we also include the lagged changes in BE, as well as the lagged level of BE, to allow for partial adjustment of BE to the equilibrium level. The results are generally consistent with the previous findings. The estimated coefficient on C-score is −0.0117 and is significant at the 1 percent level. Interestingly, the coefficients on lagged changes in BE and the lagged level of BE are negative and significant, suggesting that BE exhibits a pattern of mean reversion. Estimated coefficients on other variables yield slightly different results in sign and significance in comparison to those in previous models. For example, the coefficient on Tobin’s q becomes significantly negative, while age becomes insignificant. These differences may be due to changes in the influence of firm characteristics on BE over time, an issue we will further investigate in Table 4.
Table 4.
The evolving effects of accounting conservatism on book equity.
5.2. The Evolving Effect of Accounting Conservatism and Book Equity over Time
Our findings in the previous analysis reveal an aggregate relationship between book equity and accounting conservatism over the sample period of 1971 to 2017. However, the temporal dynamics of this relationship remain uncertain. In this section, we shift our attention to exploring how the influence of accounting conservatism on book equity has changed over time. To investigate this, we estimate Equation (5) separately for each decade between 1971 and 2017, allowing us to assess how the effect of accounting conservatism on book equity evolves over time. These estimations also control for firm-specific characteristics whose influence on book equity may vary across periods. The corresponding results are presented in Table 4.
These results give us important insight into the evolving effect of accounting conservatism on book equity over time. We find that accounting conservatism was an increasingly important determinant of book equity during the 1970s through the 1990s, as the effect was significantly negative and strengthened during this period. However, the effect became positive and significant during the 2000s and then became insignificant in the 2010s. In contrast, the effects of leverage and profitability are consistently increasing over the decades. This empirical evidence suggests that the negative effect of accounting conservatism documented in Table 3 is mostly driven by sample firms during the early half of the sample period. The effect of accounting conservatism varies over time and diminishes in recent years.
The positive C-score coefficient in the 2000s and the insignificance in the 2010s should be interpreted against contemporaneous shifts in both firm composition and measurement. First, SOX-era enforcement, option-expensing (FAS 123R), and impairment testing (SFAS 142) increased the overall level of conditional conservatism, while the economy simultaneously tilted toward intangible-intensive businesses. These forces heighten the potential for loss-recognition asymmetry but can coexist with weaker-level associations in decade-specific regressions if (i) firm characteristics move in offsetting directions (e.g., leverage and profitability) or (ii) the return-based conservatism proxy (C-score) exhibits changing sensitivity in periods with many loss firms and large one-off impairments (Ball & Shivakumar, 2006). Consistent with this interpretation, our decomposition shows that, averaged across decades, the changing sensitivity of conservatism contributes −3.17% to BE, exceeding leverage (−0.95%) and profitability (+1.76%), even though changes in characteristics sometimes move BE in the opposite direction.
5.3. To What Extent Can Changes in Book Equity Be Explained by Accounting Conservatism?
Our previous results suggest that increasing accounting conservatism has significant impacts on the variation of book equity over the recent decades. However, we recognize that accounting conservatism is not the sole driving force that explains the variation in BE. As outlined in the Introduction Section, various firm-specific factors—such as profitability and leverage—also demonstrate evolving impacts on book equity over time and may play a role in its decline. In this section, we extend our analysis to identify and evaluate these contributing factors, comparing their relative influence on the downward trend in book equity. Specifically, we compare accounting conservatism with two alternative potential driving forces of decreasing BE: profitability and leverage. Our objective is to quantify the extent to which each of these firm-specific characteristics accounts for the observed changes in book equity over time.
There are two possible channels through which changing firm characteristics can explain the aggregate decrease in BE. The first channel is changing firm characteristics over time. Given our extended sample period, firm characteristics of the typical firm, such as accounting conservatism, profit, and leverage, have changed dramatically during the period. As a result, the positive (negative) effects of these characteristics on BE could have increased (decreased) over time. The second channel is that the sensitivity of BE to firm characteristics may have changed over time. In other words, it is possible that BE would still have decreased, even if the firm characteristics had remained the same. While these two explanatory channels are not mutually exclusive, we contend that each contributes equally to accounting for the periodic variation in book equity within our sample.
5.3.1. The Effect of Changing Firm Characteristics
We begin by examining the first channel—shifts in firm characteristics. To isolate their impact, we maintain constant sensitivity coefficients for the firm characteristic variables and attribute changes in book equity solely to the time variation in these characteristics. To trace the progression of this effect over time, we conduct separate calculations for each decade, referred to as the evaluation period. For each evaluation period—defined by decade—we estimate Equation (6) using data from the preceding 10 years, designated as the base period. For instance, to analyze the impact of evolving firm characteristics on book equity during the 1980s, we estimate Equation (6) based on firm data from the 1970s and retain the resulting coefficients under the assumption that their influence remains constant throughout the subsequent decade.
We then compute the percentage change in the average values of C-score, profitability, and leverage between the base period (1970s) and the evaluation period (1980s). These percentage changes are then multiplied by the corresponding estimated coefficients from the base period to determine the contribution of each variable to changes in book equity. This procedure is formally represented by the following equation:
where X is the vector of firm characteristic variables of interest (i.e., C-score, leverage, and profitability). To capture the most up-to-date firm behavior in our coefficient estimates, we adopt a rolling base period strategy for each decade under review. For instance, firm behavior in the 2000s is assessed using data from the 1990–1999 base period, whereas analysis of the 2010s relies on data from 2000 to 2010.
Table 5 reports the results of this analysis. As noted earlier, we first estimate Equation (6) for all firms during each base period to obtain the estimated coefficients, which are reported in column (4) of Table 5. These base period estimates are assumed to be the same for each evaluation period. Then, in columns (1) and (2), we calculate the average of firm characteristics during the evaluation and base periods, respectively. Lastly, we calculate the effects of changing firm characteristics for each evaluation period using Equation (6) and report the result in column (5). As shown, changing accounting conservatism exhibits the highest effect in the 2000s. During the period, the average firm had a C-score of 0.167, which is 21.327 percent higher than the 0.138 of the corresponding base period (i.e., the 1990s). If the estimated coefficient from the base period, −0.1313, remained constant through the 2000s, the change in BE that was due to a change in the typical firm’s accounting conservatism would have been 21.327% ∗ (−0.1313) = −2.8%. In other words, the BE of a typical firm would have been 2.8% lower simply from the result of increased accounting conservatism, assuming the firm’s sensitivity to BE had remained constant at the 1990s level. Given the average total assets of USD 2398 million during the 2000s, it suggests that the BE would decrease by USD 67 million during the 2000s for a typical firm in our sample, solely due to increased accounting conservatism from the 1990s. When evaluating across panels, it appears that the effects of changing accounting conservatism remain negative until the 2000s. In the 2010s, the effect becomes positive, mainly because the base-period coefficient on C-score switched from negative to positive. However, the positive effect appears to be only temporary and reverts to negative in the 2010s. Panel E of Table 5 reports the average effects across all evaluation periods. It shows that, on average, changing accounting conservatism contributes to a 0.769% decrease in BE.
Table 5.
The effect of changing firm characteristics on book equity.
Compared with changing accounting conservatism, changing leverage and profitability have more impact on BE because they are directly related to BE. Therefore, it is expected that the variation of these firm characteristics has more influence on the variation of BE. Consistent with this expectation, Table 5 reveals that changing leverage has the most influential effects on BE in all evaluation periods, but the direction of effects varies over time. Before the 2010s, changing leverage increases, rather than decreases, book equity. However, the effect becomes negative during the 2010s. For profitability, the effect of changing firm characteristics remains negative until the 2000s, after which the effect becomes positive.
5.3.2. The Effect of Changing Sensitivity
We then proceed to assess the contribution of declining book equity attributable to changes in the sensitivity of each firm characteristic variable. In this analysis, the firm characteristic values are held constant, while variations in sensitivity—captured through evolving coefficients—are used to estimate their effect on book equity over time. Similar to the prior analysis, for each evaluation period and corresponding base period, we estimate Equation (7) to obtain coefficients on C-score, leverage, and profit. Then, we calculate the percentage change of each coefficient and multiply it by the average firm characteristics from the base period. Because we are holding firm characteristics constant from the base period, the resulting changes in BE during the evaluation period are solely due to changing sensitivity. The estimating process can be summarized by the following equation:
Column (3) of Table 5 reports the estimated coefficients for each evaluation period, and column (6) presents the estimated effects of changing sensitivities. Unlike changing firm characteristics, the effects of changing sensitivity are more volatile over time. Specifically, the changing sensitivity of accounting conservatism exhibits the largest negative impact on BE in the 1980s. During the period, the coefficient on C-score decreased by 151.19 percent, from −0.0588 in the 1970s to −0.1477. If the sample average of C-score, which was 0.130 in the base period, had remained constant through the 1990s, the change in BE that was due to the changing sensitivity of BE to C-score would have been (−151.19%) ∗ (0.13) = −19.66%. In contrast to the changing firm characteristics shown in column (5), the effect of changing sensitivity for accounting conservatism becomes positive in the 1990s and 2000s. The effect becomes negative again in the 2010s. On average, the changing sensitivity of accounting conservatism contributes 3.17% of the decrease in BE. For leverage, the effects of changing sensitivity are negative in all evaluation periods, except for the 1990s. On average, changing the sensitivity of leverage contributes to a 0.95% decrease in BE. For profitability, the effects of changing sensitivity are negative in the 1980s and 2010s but become positive in the 1990s and 2000s. Overall, our analysis suggests that the changing sensitivity of accounting conservatism dominates other forces in explaining decreasing BE.
5.4. Alternative Measures of Accounting Conservatism
Because accounting conservatism is not observable and must be estimated, various models are used to measure accounting conservatism in the extant literature. In addition to C-score, which is an earnings/stock return relation measure, alternative measures of accounting conservatism include the earnings measure (Basu, 1997) and the accrual/cash flows relation measure (Ball & Shivakumar, 2006). In this section, we employ alternative forms of model-based estimates of conservatism commonly used in the literature and analyze whether our main results are robust for various definitions of accounting conservatism.
5.4.1. Earnings Measure
To measure conditional conservatism, Basu (1997) uses the following model that measures the relationship between net income and returns:
To further validate our main results, we follow extant research (e.g., Goh et al., 2017) and extend Basu’s (1997) regression by incorporating the variable BE defined in Equation (5) in the model as follows:
where NI is net income; RET is returns; is a dummy variable equal to 1 if RET is negative, and 0 otherwise; and BE is the book equity-to-asset ratio. We include SIZE (firm size), MB (market-to-book ratio), and LEV (leverage ratio) to control for firm-specific characteristics that are associated with conservatism. We further control industry and year fixed effects in the model. The main independent variable of interest, , indicates the incremental degree of conservatism associated with the increase in the book equity. We posit that firms with decreasing book equity are timelier in recognizing losses relative to gains; therefore, is expected to be negative.
5.4.2. Accrual/Cash Flows Relation Measures
Ball and Shivakumar (2006) measure conservatism using the relationship between total accruals and operating cash flow in the following equation:
where TA is total accruals, scaled by beginning total assets; CFO is cash flow from operations, scaled by beginning total assets; and DCFO is a dummy variable equal to 1 if CFO is negative (bad news), and equal to 0 otherwise (good news). The coefficient β1 on CFO captures the sensitivity of earnings to good news, and the coefficient β3 on CFOt ∗ DCFOt measures the incremental sensitivity of earnings to bad news compared to good news, thus representing the level of conditional conservatism. If the coefficient β3 is positive, it is regarded as conservative.
We follow the literature (e.g., García Lara et al., 2007) and extend Ball and Shivakumar (2006) model using variable book equity (BE) in the model as follows:
The main independent variable of interest, , indicates the incremental degree of conservatism associated with the increase in the book equity. We posit that firms with decreasing book equity are timelier in recognizing losses relative to gains; therefore, is expected to be negative.
Table 6 reports the estimated coefficients based on the alternative measures of conservatism. For brevity, we only report the estimated coefficients for in Equations (8b) and (9b), respectively, in this table. Column (1) presents results based on Basu (1997) and Goh et al. (2017), while column (2) is estimates based on Ball and Shivakumar (2006) and García Lara et al. (2007). As shown, the coefficients for both alternative measures are negative and significant, which is consistent with our predictions that firms that are more conservative tend to have lower book equity. The negative coefficients are also consistent with the book equity trend documented in Figure 1 and Figure 2. Altogether, these results confirm our results that accounting conservatism is an important factor that explains the changes in BE, regardless of how accounting conservatism is defined.
Table 6.
Alternative measures of accounting conservatism.
6. Endogeneity Controls
In efforts to strengthen our main findings and to mitigate potential endogeneity issues in our study, we conduct two additional analyses to further examine the role of accounting conservatism in the decrease in book equity over time.
6.1. Accounting Conservatism and Book Equity: A Quantile Regression Approach
General regression methods such as the panel regression models used in our previous analyses focus only on the central tendencies of the distribution and assume that the effects of accounting conservatism on BE are constant for firms across the BE distribution. However, it is possible that the effects of accounting conservatism may vary with levels of BE and become significant only for firms that fall within certain segments of the sample’s BE distribution. For example, firms are more likely to be financially distressed within lower quantiles of the BE distribution. For these distressed firms, fundamentals such as solvency, profitability, and efficiency may dominate the effect of accounting conservatism in explaining decreasing BE. In other words, our previous analysis may have overlooked the possibility that the impact of accounting conservatism can be different for different levels of BE. To address this concern, we employ a conditional quantile regression approach to estimate the effects of accounting conservatism at different quantiles of BE. An additional advantage of a quantile regression is that it can mitigate the outlier effects that exist in general regression models, and it relaxes the traditional assumptions on error distributions.
Following the previous literature (Hao & Naiman, 2007; Koenker, 2005), we specify the following quantile regression model:
where is the dependent variable, is a vector of independent variables, is an unknown vector of parameters associated with the pth quantile, and is the error term for the pth quantile.
In this model, the pth quantile regression coefficient can be estimated by solving the following minimization problem:
The problem is usually solved with linear programming. For estimating the standard error in the nonparametric quantile regressions, a bootstrapping procedure is commonly employed to account for heteroskedastic errors. We estimate the coefficients at three quantiles—the 25th, 50th, and 75th quantiles—using the same control variables as before. To make the results from quantile regressions comparable to our panel regression results, we also control for firm and year fixed effects when estimating the coefficients.
Table 7 presents the results of our conditional quantile regressions. Columns (1), (2), and (3) exhibit the results for the 25th, 50th, and 75th quantiles, respectively. As shown, the estimated coefficients on C-score are negative and significant at the 1 percent level for the larger quantiles of BE (which is consistent with our previous findings). However, the negative coefficient for low-BE firms in the 25th quantile is insignificant. Conversely, the negative coefficient for leverage and the positive coefficient for profitability are both statistically significant at the 1% level, indicating robust relationships with book equity. This finding is consistent with the expectation that, for firms that fall within the lower distribution of BE, fundamentals related to financial distress are the dominating force for decreasing BE. The effect of accounting conservatism is less important when compared with fundamentals such as leverage and profitability. When evaluated across these three quantiles, our results indicate that as BE increases across the distribution of firms, the negative effect of accounting conservatism on book equity increases in magnitude and becomes significant. For example, for high-BE firms that fall within the 75th quantile, a one-unit increase in C-score results in a 2.6% decrease in BE—almost two times greater than the effect for low-BE firms within the 25th quantile. In contrast, the effects of fundamentals such as leverage and profitability diminish as the level of BE increases into the higher quantiles of the distribution. This finding suggests that the effect of accounting conservatism is becoming more dominant and is most pronounced for firms that fall within the higher BE distribution. To better visualize the varying effects of accounting conservatism on BE, we re-estimate the quantile regressions at increments of 10 percent (i.e., deciles ranging from the 10th to 90th quantiles) and plot the estimated coefficients on C-score, along with their 95 percent confidence intervals (shaded area), in Figure 4. As shown, the negative effect of accounting conservatism increases with levels of BE. For lower quantiles, the negative coefficients are not significantly different from 0 and, as quantiles increase, the negative coefficients become more significant. Overall, our quantile regression results suggest that although the negative effect of accounting conservatism is persistent across the range of BE quantiles, the effect increases monotonically with the level of BE. In particular, the estimated coefficients are both larger in magnitude and more significant for higher quantiles compared to lower quantiles of BE.
Table 7.
A quantile regression analysis.
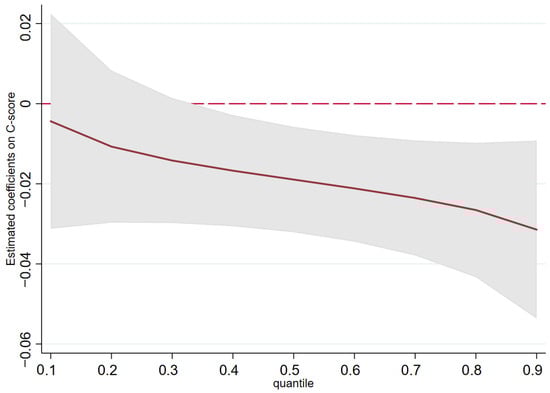
Figure 4.
Plot of estimated coefficients on C-score at each decile.
6.2. Accounting Conservatism and Book Equity: A Propensity Score Matching Approach
Our previous findings suggest that accounting conservatism is an important driving force of decreasing book equity over the last several decades. But like other empirical research in non-experimental settings, endogeneity may bias our estimates and weaken the relationship between accounting conservatism and BE. The previous analyses adopt two commonly used techniques to mitigate concerns that accounting conservatism and BE may be jointly determined. The first is lagging all independent variables in the regression models by one year to attenuate the reverse causality problem. The second is using fixed-effect models to alleviate endogeneity concerns related to unobservable, time-invariant confounding factors. However, an additional and probably more problematic concern is that our models in the previous analyses may suffer a specific type of endogeneity caused by functional form misspecification, where the effects of the proper functional form are related to the error term and may be correlated with our explanatory variables of interest. This may bias the estimated coefficients in our previous models.
In this section, we attempt to further address the link between accounting conservatism and the decrease in book equity and to the biases discussed above by applying a propensity score matching method. As pointed out by Stuart and Rubin (2008), propensity score matching is preferable to the model-based adjustments to address confounding variables because the method does not rely on inherently untestable modeling assumptions. In addition, Shipman et al. (2017) also argue that the advantage of propensity score matching is that it forms treatment and control groups that are similar across covariates (therefore relaxing the assumptions about the functional form of variable relations), thereby reducing bias from misspecification. In our test, we use the following two-staged model to estimate propensity scores, assign firms to matched treatment and control groups, and evaluate the treatment effect of accounting conservatism on book equity:
In the first stage, we assign firms to treatment and control groups based on their levels of accounting conservatism. Each year, we examine the distribution of calculated C-scores for all firms and assign those with C-scores above the 70th percentile to the treatment group and the rest to the control group. This treatment and control group identification allows us to match firms that exhibit high accounting conservatism to similar firms with relatively lower accounting conservatism. These similar firms are matched based on the same firm characteristics that are used as controls in our main regression models.6 Matching firms in this way reduces differences in covariates between the two groups. In Equations (12) and (13), is a dummy variable to indicate if firms are classified as exhibiting high accounting conservatism and takes on the value of 1 if a firm’s C-score is above the 70th percentile of the C-score distribution in a given year, and 0 otherwise. Using this treatment dummy as the dependent variable in the first stage, we estimate a Logit model to calculate the propensity score using the same controls found in Equation (5).7 We then use these propensity scores to similar firms (one-to-one with replacement) from the control group. In addition, we impose the common support restriction to ensure that there is sufficient overlap in the characteristics of treated and untreated units to find adequate matches. Our final sample comprises of 5500 treated firms and 4489 matched firms, with a total of 36,061 firm-year observations.
We evaluate balance using standardized mean differences and variance-ratio metrics for all covariates employed in the Stage-1 logit. Under the common-support restriction, balance improves materially across all covariates, and visual inspection of the propensity-score distributions confirms adequate overlap between treated and control groups. Following the matching step, we estimate the outcome regression with the full control set plus industry and year fixed effects to adjust any residual differences (Lawrence et al., 2011). Across the baseline one-to-one with replacement design and the alternative specifications (1:4, no replacement, 1% caliper), the treatment indicator D_highAC remains negative and statistically significant (−0.0056 to −0.0067), indicating lower BE for more conservative firms after balancing on observables.
In the second stage, we estimate a multivariate regression to evaluate the treatment effect of accounting conservatism on BE. As suggested by prior studies such as Lawrence et al. (2011), it is recommended to use a multivariate regression instead of a simple t-test to estimate an average treatment effect to further control for any remaining characteristic imbalances between the treatment and control groups. Put another way, multivariate analysis can help adjust for any remaining differences in covariates between the matched groups in the second stage. In this model, we also control for industry () and year () fixed effects to eliminate any time-invariant, omitted variables in the error term.
Column (1) of Table 8 reports the results of the second-stage regression. For brevity, only the coefficient on the variable of interest, , is reported. The results suggest that there is a significant difference in book equity between firms with higher levels of accounting conservatism and their matched firms with lower levels of accounting conservatism. On average, firms that are more conservative have significantly less BE than controlled firms. For robustness, we utilize alternative propensity score matching design choices in columns (2), (3), and (4). In column (2), we conduct one-to-four matching, where each treated observation is matched to four observations from the control group. One-to-four matching is recommended by Abadie et al. (2004) to minimize mean-squared errors (MSE). Columns (3) and (4) present the results using a modified matching method. In column (3), we match treated observations without replacement to mitigate the issue that replaced observations with extreme propensity scores are given too much weight in our sample due to multiple successful matches. In column (4), we impose a 1% caliper width to limit the maximum allowable distance between propensity scores during the matching procedure for each observation. The results of the robustness tests are quantitatively similar to the results in column (1). Overall, our results suggest that the relationship between accounting conservatism and BE is robust after controlling for possible endogeneity concerns.
Table 8.
A propensity score matching analysis.
7. Conclusions
Book equity among U.S. firms has experienced a pronounced and sustained decline over time. A few studies in the accounting and finance literature indirectly suggest that there are three plausible explanations of this phenomenon: a decrease in profitability, an increase in leverage, and an increase in intangible capital over time (or some combination of the three). However, these studies do not propose any testable hypotheses or perform any tests to directly examine these factors that could possibly explain the decrease in BE. In this paper, we propose and test a direct and previously unexplored explanation for the systemic decreases in BE over time. We argue that a significant portion of decreases in BE can be explained due to increased accounting conservatism.
Consistent with our predictions, we find that the rise in accounting conservatism significantly contributes to the explanation of the declining trend of BE over time. Using a sample of U.S. public firms between 1970 and 2017, our panel regression models confirm that accounting conservatism is negatively associated with BE, a result that is both economically and statistically significant as well as robust to a variety of model specifications. We also quantify how much of the change in book equity can be attributed to accounting conservatism, as well as test alternative measures of accounting conservatism. Furthermore, our conditional quantile regression results suggest that although the negative effect of accounting conservatism is persistent across firms with different levels of BE, the effect increases monotonically with the level of BE. Put another way, the negative effect of accounting conservatism on BE is stronger for firms with relatively higher levels of BE. Finally, our propensity score matching results confirm the relationship between accounting conservatism and BE remains robust after controlling for possible endogeneity concerns.
Why does the conservatism channel weaken after the 1990s? Three forces likely coincide. First, fair-value accounting expanded in scope over this period (e.g., FAS 115, FAS 157, IFRS 13), introducing more symmetric mark-to-market re-measurements and thereby reducing the asymmetric “loss-first” recognition that defines conditional conservatism. Second, the U.S. corporate landscape shifted toward technology- and platform-oriented firms with balance sheets dominated by non-capitalized intangible assets that generate fewer impairment-driven charges than tangible plant and equipment. Third, heightened disclosure and enforcement after SOX—continuous SEC comment-letter reviews and greater use of non-GAAP reconciliations—have helped investors look through some conservatism-induced accounting noise. The interaction of these factors plausibly explains the post-1990s attenuation we document while leaving our period-average conclusions intact.
Overall, our study contributes to the empirical literature on book equity by providing a new explanation, the rise in accounting conservatism, for the declining trend in BE among U.S. firms over the last several decades. Our findings have important implications for market-based valuation metrics. Because accounting conservatism systematically depresses reported book equity, price-to-book and market-to-book ratios may be inflated for more conservative firms, even when underlying fundamentals are unchanged. This suggests that P/B ratios should be interpreted in conjunction with firm-specific conservatism metrics, particularly when screening for “value” firms. Analysts may consider adjusting book equity estimates using model-implied benchmarks or reporting valuation ratios both with and without conservatism-adjusted BE. These adjustments are especially important in cross-sectional comparisons, where differences in accounting policies, rather than economic fundamentals, may explain variations in valuation multiples. An important avenue for future research is to examine how discretionary earnings management interacts with accounting conservatism in shaping long-run book-equity trends.
Author Contributions
Conceptualization, H.L., B.L., and S.D.P.; Methodology, H.L. and B.L.; Software, H.L.; Validation, H.L., B.L., and S.D.P.; Formal Analysis, H.L.; Investigation, H.L.; Resources, H.L., B.L., and S.D.P.; Data Curation, H.L. and B.L.; Writing—Original Draft Preparation, H.L.; Writing—Review and Editing, H.L. and S.D.P. All authors have read and agreed to the published version of the manuscript.
Funding
This research received no external funding.
Institutional Review Board Statement
Not applicable.
Informed Consent Statement
Not applicable.
Data Availability Statement
Restrictions apply to the availability of these data. Data were obtained from WRDS (Wharton Research Data Services) and are available at https://wrds-www.wharton.upenn.edu/ (accessed on 10 January 2022), with the permission of WRDS (Wharton Research Data Services).
Conflicts of Interest
The authors declare no conflicts of interest.
Appendix A. Variable Definitions
This table provides the definitions and construction methods for all variables used in the regression analyses. All financial data are sourced from Compustat for U.S. industrial firms from 1971 to 2017. All continuous variables are winsorized at the 1% level to mitigate the influence of outliers. The sample excludes financial firms (SIC codes 6000–6999); utility firms (SIC codes 4900–4999); and firms classified as public service, international affairs, or non-operating establishments (SIC codes greater than 9000). All USD amounts are in millions of constant USD.
| Variable | Definition and Construction |
| Book Equity (BE) | The sum of shareholders’ book equity, balance sheet deferred taxes, and investment tax credits, minus the book value of preferred stock, all standardized by total assets. |
| Accounting Conservatism (C-score) | A firm-year measure of the asymmetric timeliness of earnings, reflecting the incremental timeliness of reporting bad news over good news. It is estimated annually from the cross-sectional regression model developed by Khan and Watts (2009). |
| Age | The natural logarithm of one plus the number of years since the firm’s incorporation. |
| Asset Utility | Annual sales divided by total assets. |
| Capital Expenditure | The level of capital expenditures divided by total assets. |
| Dividend Dummy | A dummy variable that equals 1 if the firm pays a cash dividend in a given year, and 0 otherwise. |
| Firm Size | The natural logarithm of a firm’s total assets. |
| Leverage | Total debt divided by total assets. |
| Profitability | Operating income before depreciation, scaled by total assets. |
| Retained Earnings | The level of retained earnings divided by total assets. |
| Share Repurchase | The value of common and preferred stock repurchases divided by total assets. |
| Sales Volatility | The standard deviation of sales-to-total-assets ratio over a 5-year rolling window for each 2-digit SIC industry. |
| Tangibility | The ratio of net property, plant, and equipment to total assets. |
| Tobin’s Q | A firm’s current market value divided by its asset replacement cost. |
| Working Capital | The level of working capital scaled by total assets. |
Appendix B. Table 5 Decomposition Formula and Worked Example
Decomposition formula. For each decade t, we express the change in mean book-equity ratio () as
where X is the vector of decade-average firm characteristics and β the vector of coefficients estimated in the preceding “base” decade 0.
- 1st term (“characteristics effect”): how much BE changes because the average level of a driver—e.g., AC—moves, holding base-period coefficients fixed.
- 2nd term (“sensitivity effect”): how much BE changes because the marginal mapping from that driver to BE shifts, holding characteristics fixed at base values. Summing across drivers yields the total decade change; summing across decades yields the period averages quoted below Table 5.
Worked example (2000s vs. 1990s)
- Base period (1990s) mean C-score = 0.321; coefficient on C-score = −0.108.
- 2000s mean C-score rises to 0.354, so characteristics contribution = (0.354 − 0.321) × (−0.108) = −0.0036 (−0.36 p.p.).
- Coefficient on C-score changes from −0.108 to −0.201, so sensitivity contribution = 0.321 × (–0.201 + 0.108) = −0.0298 (−2.98 p.p.).
- Repeating this for each decade and averaging yields Table 5’s AC totals: −0.769 p.p. (characteristics) and −3.170 p.p. (sensitivity).
Notes
| 1 | Because the estimated results in our traditional panel regression models focus only on central tendencies, are sensitive to the skewness of the underlying data that is examined, and assume a constant effect of accounting conservatism on BE for firms across the distribution, we utilize the conditional quantile regression approach to address econometric concerns. |
| 2 | All variables are defined in detail in the Appendix A. |
| 3 | Many other studies, such as Collins et al. (1997), Chan et al. (2001), Darrough and Ye (2007), and Jan and Ou (2012), control for industries that heavily invest in R&D activities. These industries are sometimes referred to as intangible-intensive industries. Conversely, our study controls for the level of firm tangibility. |
| 4 | Our sample period starts in 1971 because Compustat does not report data on share repurchases (PRSTKC) prior to that year. |
| 5 | The minimum BE is −0.77 because we do not exclude firms with negative book equity from our sample. |
| 6 | Refer to Section 4.1: Model Construction for details about the control variables used to match firms. |
| 7 | We choose the same set of variables as in the multivariate regressions because, as suggested by Shipman et al. (2017), the propensity score matching and multivariate regression methods should use similar variables to avoid internally inconsistent and problematic post hoc research design. |
References
- Abadie, A., Drukker, D. M., Herr, J. L., & Imbens, G. W. (2004). Implementing matching estimators for average treatment effects in Stata. The Stata Journal, 4, 290–311. [Google Scholar] [CrossRef]
- Ahmed, A. S., Billings, B. K., Morton, R. M., & Stanford-Harris, M. (2002). The role of accounting conservatism in mitigating bondholder-shareholder conflicts over dividend policy and in reducing debt costs. The Accounting Review, 77, 867–890. [Google Scholar] [CrossRef]
- Ang, J. S., Cole, R. A., & Lin, J. W. (2000). Agency costs and ownership structure. The Journal of Finance, 55, 81–106. [Google Scholar] [CrossRef]
- Asthana, S. C., & Zhang, Y. (2006). Effect of R&D investments on persistence of abnormal earnings. Review of Accounting & Finance, 5, 124. [Google Scholar]
- Ball, R., & Shivakumar, L. (2006). The role of accruals in asymmetrically timely gain and loss recognition. Journal of Accounting Research, 44, 207–242. [Google Scholar] [CrossRef]
- Bandyopadhyay, S. P., Chen, C., Huang, A. G., & Jha, R. (2010). Accounting conservatism and the temporal trends in current earnings’ ability to predict future cash flows versus future earnings: Evidence on the trade-off between relevance and reliability. Contemporary Accounting Research, 27, 413–460. [Google Scholar] [CrossRef]
- Barth, M. E., Beaver, W. H., & Landsman, W. R. (1998). Relative valuation roles of equity book value and net income as a function of financial health. Journal of Accounting and Economics, 25, 1–34. [Google Scholar] [CrossRef]
- Basu, S. (1997). The conservatism principle and the asymmetric timeliness of earnings. Journal of Accounting and Economics, 24, 3–37. [Google Scholar] [CrossRef]
- Beatty, A., Weber, J., & Yu, J. J. (2008). Conservatism and debt. Journal of Accounting and Economics, 45, 154–174. [Google Scholar] [CrossRef]
- Breusch, T. S., & Pagan, A. R. (1980). The Lagrange multiplier test and its applications to model specification in econometrics. The Review of Economic Studies, 47, 239–253. [Google Scholar] [CrossRef]
- Burgstahler, D., & Dichev, I. (1997). Earnings management to avoid earnings decreases and losses. Journal of Accounting and Economics, 24, 99–126. [Google Scholar] [CrossRef]
- Chan, L. K. C., Lakonishok, J., & Sougiannis, T. (2001). The stock market valuation of research and development expenditures. The Journal of Finance, 56, 2431–2456. [Google Scholar] [CrossRef]
- Collins, D. W., Maydew, E. L., & Weiss, I. F. (1997). Changes in the value-relevance of earnings and book values over the past forty years. Journal of Accounting and Economics, 24, 39–67. [Google Scholar] [CrossRef]
- Collins, D. W., Pincus, M., & Xie, H. (1999). Equity valuation and negative earnings: The role of book value of equity. The Accounting Review, 74, 29–61. [Google Scholar] [CrossRef]
- Corrado, C. A., & Hulten, C. R. (2010). How do you measure a “technological revolution”? American Economic Review, 100, 99–104. [Google Scholar] [CrossRef]
- Darrough, M., & Ye, J. (2007). Valuation of loss firms in a knowledge-based economy. Review of Accounting Studies, 12, 61–92. [Google Scholar] [CrossRef]
- DeAngelo, H., & Roll, R. (2015). How stable are corporate capital structures? The Journal of Finance, 70, 373–418. [Google Scholar] [CrossRef]
- Dechow, P. M., & Dichev, I. D. (2002). The quality of accruals and earnings: The role of accrual estimation errors. The Accounting Review, 77, 35–59. [Google Scholar] [CrossRef]
- Dechow, P. M., Kothari, S. P., & Watts, R. L. (1998). The relation between earnings and cash flows. Journal of Accounting and Economics, 25, 133–168. [Google Scholar] [CrossRef]
- Diamond, D. W. (1984). Financial intermediation and delegated monitoring. The Review of Economic Studies, 51, 393–414. [Google Scholar] [CrossRef]
- Dichev, I. D., & Skinner, D. J. (2002). Large–sample evidence on the debt covenant hypothesis. Journal of Accounting Research, 40, 1091–1123. [Google Scholar] [CrossRef]
- Dichev, I. D., & Tang, V. W. (2008). Matching and the changing properties of accounting earnings over the last 40 years. The Accounting Review, 83, 1425–1460. [Google Scholar] [CrossRef]
- Fama, E. F. (1985). What’s different about banks? Journal of Monetary Economics, 15, 29–39. [Google Scholar] [CrossRef]
- Fama, E. F., & French, K. R. (2008). Average returns, B/M, and share issues. Journal of Finance, 63, 2971–2995. [Google Scholar] [CrossRef]
- Financial Accounting Standards Board (FASB). (2004). Financial accounting standards board. FASB. [Google Scholar]
- Francis, B., Hasan, I., & Wu, Q. (2013). The benefits of conservative accounting to shareholders: Evidence from the financial crisis. Accounting Horizons, 27, 319–346. [Google Scholar] [CrossRef]
- García Lara, J. M., Osma, B. G., & Penalva, F. (2007). Board of directors’ characteristics and conditional accounting conservatism: Spanish evidence. European Accounting Review, 16(4), 727–755. [Google Scholar] [CrossRef]
- Givoly, D., & Hayn, C. (2000). The changing time-series properties of earnings, cash flows and accruals: Has financial reporting become more conservative? Journal of Accounting and Economics, 29, 287–320. [Google Scholar] [CrossRef]
- Givoly, D., Hayn, C. K., & Natarajan, A. (2007). Measuring reporting conservatism. The Accounting Review, 82, 65–106. [Google Scholar] [CrossRef]
- Goh, B. W., Lim, C. Y., Lobo, G. J., & Tong, Y. H. (2017). Conditional conservatism and debt versus equity financing. Contemporary Accounting Research, 34(1), 216–251. [Google Scholar] [CrossRef]
- Graham, J. R., Leary, M. T., & Roberts, M. R. (2015). A century of capital structure: The leveraging of corporate America. Journal of Financial Economics, 118, 658–683. [Google Scholar] [CrossRef]
- Hao, L., & Naiman, D. (2007). Quantile-regression inference. In Quantile Regression. Sage. [Google Scholar]
- Harford, J., Mansi, S. A., & Maxwell, W. F. (2008). Corporate governance and firm cash holdings in the US. Journal of Financial Economics, 87, 535–555. [Google Scholar] [CrossRef]
- Hausman, J. A. (1978). Specification tests in econometrics. Econometrica, 46, 1251–1271. [Google Scholar] [CrossRef]
- Haw, I. M., Lee, J. J., & Lee, W. J. (2014). Debt financing and accounting conservatism in private firms. Contemporary Accounting Research, 31, 1220–1259. [Google Scholar] [CrossRef]
- Hirshleifer, D., Low, A., & Teoh, S. H. (2012). Are overconfident CEOs better innovators? Journal of Finance, 67, 1457–1498. [Google Scholar] [CrossRef]
- Hulten, C. R., & Hao, X. (2008). What is a company really worth? Intangible capital and the ‘market to book value’ puzzles (Working Paper 14548). National Bureau of Economic Research. [Google Scholar]
- Jackson, S. B., & Liu, X. (2010). The allowance for uncollectible accounts, conservatism, and earnings management. Journal of Accounting Research, 48, 565–601. [Google Scholar] [CrossRef]
- Jan, C.-L., & Ou, J. A. (2012). Negative-book-value firms and their valuation. Accounting Horizons, 26, 91–110. [Google Scholar] [CrossRef]
- Kabir, M. H., & Laswad, F. (2014). The behaviour of earnings, accruals and impairment losses of failed New Zealand finance companies. Australian Accounting Review, 24, 262–275. [Google Scholar] [CrossRef]
- Khan, M., & Watts, R. L. (2009). Estimation and empirical properties of a firm-year measure of accounting conservatism. Journal of Accounting and Economics, 48, 132–150. [Google Scholar] [CrossRef]
- Koenker, R. (2005). Quantile regression: Name index. Cambridge University Press. [Google Scholar]
- Lawrence, A., Minutti-Meza, M., & Zhang, P. (2011). Can Big 4 versus non-Big 4 differences in audit-quality proxies be attributed to client characteristics? The Accounting Review, 86, 259–286. [Google Scholar] [CrossRef]
- Lev, B. (1983). Some economic determinants of time-series properties of earnings. Journal of Accounting and Economics, 5, 31–48. [Google Scholar] [CrossRef]
- Lobo, G. J., & Zhou, J. (2006). Did conservatism in financial reporting increase after the Sarbanes-Oxley Act? Initial evidence. Accounting Horizons, 20(1), 57–73. [Google Scholar] [CrossRef]
- Love, I., Preve, L. A., & Sarria-Allende, V. (2007). Trade credit and bank credit: Evidence from recent financial crises. Journal of Financial Economics, 83, 453–469. [Google Scholar] [CrossRef]
- Luo, H., Liu, I., & Tripathy, N. (2019). A study on firms with negative book value of equity. International Review of Finance, 21, 145–182. [Google Scholar] [CrossRef]
- Park, H. (2019). Intangible assets and the book-to-market effect. European Financial Management, 25, 207–236. [Google Scholar] [CrossRef]
- Peters, R. H., & Taylor, L. A. (2017). Intangible capital and the investment-q relation. Journal of Financial Economics, 123, 251–272. [Google Scholar] [CrossRef]
- Petersen, M. A. (2008). Estimating standard errors in finance panel data sets: Comparing approaches. The Review of Financial Studies, 22, 435–480. [Google Scholar] [CrossRef]
- Petersen, M. A., & Rajan, R. G. (1997). Trade credit: Theories and evidence. The Review of Financial Studies, 10, 661–691. [Google Scholar] [CrossRef]
- Philippon, T. (2009). The bond market’s q. The Quarterly Journal of Economics, 124, 1011–1056. [Google Scholar] [CrossRef]
- Shipman, J. E., Swanquist, Q. T., & Whited, R. L. (2017). Propensity score matching in accounting research. The Accounting Review, 92, 213–244. [Google Scholar] [CrossRef]
- Stuart, E. A., & Rubin, D. B. (2008). Best practices in quasi-experimental designs. In Best Practices in Quantitative Methods (pp. 155–176). Sage. [Google Scholar]
- The Economist. (2019, March 23). Why book value has lost its meaning. The Economist. [Google Scholar]
- Watts, R. L. (2003). Conservatism in accounting part I: Explanations and implications. Accounting Horizons, 17, 207–221. [Google Scholar] [CrossRef]
Disclaimer/Publisher’s Note: The statements, opinions and data contained in all publications are solely those of the individual author(s) and contributor(s) and not of MDPI and/or the editor(s). MDPI and/or the editor(s) disclaim responsibility for any injury to people or property resulting from any ideas, methods, instructions or products referred to in the content. |
© 2025 by the authors. Licensee MDPI, Basel, Switzerland. This article is an open access article distributed under the terms and conditions of the Creative Commons Attribution (CC BY) license (https://creativecommons.org/licenses/by/4.0/).