Article

Optimal Portfolio Analysis Using Power and Natural Logarithm Utility Functions with E-Commerce Data

Department of Mathematics, Faculty of Science and Mathematics, Universitas Diponegoro, Semarang 50275, Indonesia
*
Author to whom correspondence should be addressed.
Int. J. Financial Stud. 2025, 13(3), 127; https://doi.org/10.3390/ijfs13030127
Submission received: 14 April 2025 / Revised: 22 May 2025 / Accepted: 26 June 2025 / Published: 4 July 2025

Abstract

Determining the optimal portfolio is important in the investment process because it includes the selection of appropriate fund allocation to manage financial risk effectively. Although risk cannot be entirely eliminated, it is managed through strategic allocation based on investor preferences. Therefore, this research aimed to use mathematical models, including the power utility function, the natural logarithm utility function, and a combination of both, to capture varying degrees of risk aversion. The optimal allocation was obtained by analytically maximizing the expected end-of-period wealth utility under each specification, where the investor level of risk aversion was derived by determining the constant. The utility function that failed to produce closed-form solutions was solved through the use of a numerical method to approximate the optimal portfolio weight. Furthermore, numerical simulations were performed using data from two stocks in the e-commerce sector to prove the impact of parameter changes on investment decisions. The result showed explicit analytical values for each utility function, providing investors with a structured framework for determining optimal portfolio weights consistent with their risk profile.

1. Introduction

The rapid expansion of the e-commerce sector is the cornerstone of digital transformation in the global economy. In January 2025, this sector experienced significant growth globally, with projections showing that e-commerce sales surpassed 6.86 trillion, reflecting an 8.37 % increase from the value obtained in 2024. As a result, e-commerce sales are expected to continue increasing at a compound annual growth rate (CAGR) of 7.8% from 2025 to 2027. Prior research reported that the growth rate is expected to potentially reach 8 trillion by 2027 (SellersCommerce, 2025). Companies such as Amazon, eBay, and Alibaba have produced new economic opportunities, as well as introduced challenges for investors intending to capitalize on the potential of the sector through capital markets.
Apart from its growth potential, the e-commerce sector is characterized by heightened market volatility. Factors such as rapid technological innovation, shifts in consumer behavior, and external shocks such as the COVID-19 pandemic contributed to significant fluctuations in stock prices (Khan et al., 2024; Yang, 2024; Q. Zhang, 2023). For example, H. Zhang (2024) stated that market returns and macroeconomic indicators were the main drivers of Amazon stock volatility. The sensitivity of this sector to macro-level changes increases the risk of substantial financial losses in situations where portfolios are not carefully managed (Burnham, 1999).
In addition, high volatility affects both asset prices and investor behavior. Gopal et al. (2019) conducted research focusing on how emotions such as fear and greed dominate trading activity during uncertain periods. This was supported by Dichev and Zheng (2022), who found that investor returns are more volatile than stock returns. Increased volatility further strengthens investor emotional reactions, potentially leading to inefficient investment decisions in the e-commerce sector.
This dual nature of e-commerce stocks, comprising high growth potential and significant risk, highlights the importance of a structured approach to investment. The research conducted by Dharshan (2024); Manjunath et al. (2023); Zou (2024) reported that effective portfolio construction requires risk–return optimization and also association with investor-specific risk preferences. As Xidonas et al. (2010) stated, understanding investor behavior is critical for designing portfolios that reflect realistic decision-making under uncertainty. Therefore, addressing the challenge of selecting an attractive portfolio requires appropriate techniques.
In this context, portfolio optimization models are essential to systematically manage risk in volatile environments such as e-commerce markets. The classical Markowitz framework (Markowitz, 1952) provides a foundational approach to portfolio optimization by balancing expected return and variance. However, this mean-variance model focuses solely on expected return and risk measured by variance without considering investor risk preferences. Xidonas et al. (2010) analyzed the limitation of selecting a portfolio using this theory, and Touni et al. (2020) raised concerns about the extent to which the mean-variance model considers the preferences and needs of investors.
These limitations have led to the growing adoption of utility-based methods in portfolio optimization. Utility functions provide a mathematical framework to capture investor preferences. This framework suggests that a rational investor would allocate their portfolio to maximize the expected utility over time (Fabozzi and Pachamanova, 2016). Several utility functions have been developed for this purpose, including linear, quadratic, exponential, power, and natural logarithm functions (Ross, 2011).
Based on the descriptions, linear and quadratic utility functions make some unrealistic assumptions, particularly when accounting for risk aversion. Hanoch and Levy (1970) reported that quadratic utility produces positive marginal utility in a limited wealth range, making it unsuitable for capturing investor behavior under high volatility. Nonlinear utility functions, such as power and natural logarithm functions, offer greater flexibility in modeling varying degrees of risk aversion. Meanwhile, Wakker and Yang (2021) investigated how these functions effectively capture both risk-averse and risk-seeking behavior, relevant for portfolio selection in volatile sectors such as e-commerce.
The e-commerce sector is characterized by high volatility, diversity, uncertainty, and virtuality, which collectively contribute to a complex and dynamic investment environment. These risk characteristics manifest in various forms, including market and economic risks, as well as operational instability. Babayev (2024) highlighted that economic risk is a major challenge for e-commerce supply chains. Tan (2024) stated that market risk often arises from rapid shifts in volatile demand and price competition. Based on this perspective, Lin (2024) also reported the need for adaptive risk modeling approaches in volatile sectors, and proposed a model that dynamically adjusts portfolio weights in response to changing market conditions. Therefore, these challenges highlight the importance of portfolio optimization approaches that incorporate nonlinear utility functions, as these are better suited to capturing diverse risk preferences in highly volatile sectors including e-commerce.
The exploration of utility functions and portfolio optimization theory has gained significant attention in the recent literature, particularly in the context of investment strategies under uncertainty. Goli (2024) introduced a multi-objective mathematical model aimed at optimizing Renewable Energy Project Portfolios (REPPs). This model jointly maximizes return and minimizes risks for the renewable energy sector. Furthermore, Phelps (2024) conducted research on classical exponential and power utility frameworks, outlining the importance of skewness and kurtosis in expected utility, particularly in non-Gaussian contexts. These insights have played a crucial role in refining models that aim to reflect real-world decision-making complexity.
Jacob and Levy (2024) focused on the intersections of portfolio insurance, theory, and market simulation, as well as the risks associated with portfolio leverage. The research effectively connected theoretical models and practical investment strategies, particularly by outlining the distinctions between portfolio insurance mechanisms and classical portfolio theory.
In terms of applied research, Yu et al. (2009) compared several utility functions, such as power, logarithmic, exponential, and quadratic functions, to evaluate optimal portfolio outcomes. Bodnar et al. (2018) applied individual utility functions, specifically, exponential and quadratic functions, in a minimum Value-at-Risk (VaR) framework to determine optimal portfolio structures. These studies contributed a better understanding of how different utility preferences influence asset allocation under various risk constraints.
Recent research has continued to refine portfolio optimization using utility-based frameworks. Bodnar et al. (2020) explored portfolio choices using power and logarithmic utility functions assuming that the returns followed an approximate log-normal distribution. The research also derived analytical expressions for optimal portfolio weights for both utility functions. Meanwhile, Munari (2021) used multiple utility functions to capture the inherent incompleteness and ambiguity in investor preferences, particularly when dealing with complex risk measures. Sarantsev (2021) provided an explicit solution for optimal portfolios under the power utility function of absolute and relative wealth and applied it to a Capital Asset Pricing Model (CAPM).
In terms of sector-specific applications, Pandiangan et al. (2021) integrated VaR constraints into a quadratic utility model to optimize portfolios with risk-free assets, targeting the mining and energy sectors. This motivated similar applications in e-commerce, where high volatility introduces unique risk–return dynamics. The research conducted by Lunxemberg and Boyd (2023) addressed portfolio selection under Gaussian mixture (GM) return distributions, although it was not directly focused on e-commerce. The analysis offers a potential direction for future research, particularly when the normality assumption does not hold.
This research focused on the power and natural logarithm functions to maximize the expected utility of the end-of-period wealth. The expected utility of wealth concept was evaluated in previous research (Fabozzi and Pachamanova, 2016; Pennacchi, 2008; Ross, 2011). The power and natural logarithm utility functions are widely used to model investor behavior under non-negative wealth constraints. These utility functions possess desirable properties, such as decreasing absolute risk aversion (ARA) and proportionality of optimal portfolio weights to wealth, resulting in suitability for realistic investment modeling (Bodnar et al., 2023). Although both utility functions have been extensively reviewed in prior research, most existing analyses considered them separately rather than integrated into a unified optimization framework.
In this context, the research has failed to propose a new theoretical model of utility, but has contributed to the applied extension of existing frameworks. From this perspective, power and natural logarithm utility functions were unified through both linear combination and multiplicative forms in a single optimization framework, and closed-form and numerical solutions were derived for two-asset portfolios. No prior research has implemented the combined approach in empirical portfolio construction, particularly for high-volatility e-commerce stocks, showing a genuine gap that this paper needs to address. By incorporating both power and logarithmic utilities, the proposed method offers a more nuanced representation of investors with wealth-dependent and nonlinear risk preferences. This research offers a computationally efficient framework rather than proposing a new theoretical model. The framework further improves the applicability of utility-based portfolio theory in industry-specific contexts, particularly those characterized by rapid market fluctuations.
The optimal portfolio allocation was derived by maximizing the investor expected end-of-period wealth utility, represented as the weighted average of utility values. Furthermore, a Taylor series approximation of the utility function was adopted around the expected wealth value (Fabozzi and Pachamanova, 2016). This approach was inspired by Jean (1971), who first proposed the mean-variance approximation using higher-order moments to capture the shape of the return distribution. Levy and Markowitz (1979) applied a second-order Taylor expansion around the expected return to approximate the utility, while Brandt et al. (2005) extended this by expressing the method as a linear combination of moments.
The approximation method adopted only uses the first two orders of the Taylor series expansion. This simplification was supported by Cremers et al. (2004), who empirically showed that logarithmic and power utility functions are insensitive to higher moments. Similarly, Fahrenwaldt and Sun (2020) stated that increasing the order of approximation does not improve the accuracy for the power utility. The derivative of the expected utility was then taken with respect to each asset weight, setting these derivatives as equal to zero. The final result was obtained using an explicit formula for the optimal weight α * , calculated from known parameters such as the expected returns, variance of returns, correlation between returns, and risk preferences. The optimal weight values were then applied to determine the investment amount in each asset, providing the most favorable solution to the maximization problem. This approach associates portfolio decisions with investor utility, and also provides insight into how each utility function affects asset allocation behavior.
The remaining part of this paper is structured as follows: Section 2 introduces the theoretical foundations of classical utility functions, as well as key propositions related to power and natural logarithm utilities. Section 3 defines the combined utility functions, in both linear and multiplicative forms, and derives the corresponding optimal portfolio allocation formulas. Section 4 presents numerical simulations based on historical return data from two e-commerce stocks, showing how different utility functions affect asset allocation. Section 5 includes sensitivity analyses to evaluate how changes in model parameters influence the optimal allocation. Section 6 includes a cross-validation using data from an alternate sector to assess the robustness and generalizability of the model. Subsequently, Section 7 discusses the comparative performance of the utility approaches, managerial implications, and possible future extensions, with Section 8 focusing on the conclusion.

2. Preliminaries

This section concentrates on the fundamental concepts that form the basis of the proposed portfolio optimization framework. These preliminaries played an essential part in deriving the closed-form solutions presented in the subsequent sections.

2.1. Maximization Model

Supposing an investor has a positive amount w, and decides to select a desired portfolio consisting of n risky assets, then let w = ( w 1 , w n ) be a vector in which w i denotes the weight of the ith asset held in the portfolio and i = 1 n w i = w . If the return from investment w i is X i = 1 + R i , where R i is the rate of return ( 1 R i 1 ), then the end-of-period wealth is W = i = 1 n W i X i or equivalent to W = i = 1 n w + i = 1 n w i R i . Determining the portfolio that maximizes the expected utility of end-of-period wealth is expressed as follows:
max w 1 , w 2 , , w n E u ( W ) satisfying W = w + i = 1 n w i R i , w i = α i * w subject to α i * 0 , i = 1 n α i * = 1 , w i 0 , i = 1 n w i = w for i = 1 , 2 , , n
where u is the investor utility function for the end-of-period wealth. In addition, the random variable W is assumed to be normally distributed (Ross, 2011).
The calculation of the expected utility includes the expectation and variance of the end-of-period wealth W. This is determined using the mean-variance optimization, computed in the following equations:
E [ W ] = w + i = 1 n w i E [ R i ]
V a r [ W ] = i = 1 n w i 2 V a r [ R i ] + i = 1 j i n w i w j C o v [ R i , R j ]
The optimization problem (1) will later be solved to obtain the optimal fund proportion α i * , which determines the optimal investment allocation w i .

2.2. Classical Utility Functions

Proposition 1.
The power function u ( x ) = x a with x > 0 and 0 < a < 1 is a utility function.
Proof. 
See Appendix A for the complete derivation. □
Proposition 2.
The natural logarithm function u ( x ) = ln x with x > 0 is a utility function.
Proof. 
See Appendix B for the complete derivation. □

2.3. Expected Utility of Classical Utility Functions

Before determining the optimal portfolio weights, it is necessary to compute the expected utility for each utility function. The following presents the expected utility formulations for the respective utility functions.

2.3.1. Expected Utility of Power Utility

Suppose the power utility function is given as u ( x ) = x a with x > 0 and 0 < a < 1 . The expected utility of the end-of-period is given by the following:
E [ u ( W ) ] = E [ W a ] = E w + i = 1 n w i R i a
We first approximate u ( W ) using the second-order Taylor series expansion about the point μ = E ( W ) . That is, we use the following approximation:
u ( W ) u ( μ ) + u ( μ ) ( W μ ) + u ( μ ) 2 ( W μ ) 2
Taking expectations yields the following:
E [ u ( W ) ] u ( μ ) + u ( μ ) E ( W μ ) + u ( μ ) 2 E [ ( W μ ) 2 ]
The first central moment, E ( W μ ) , is equivalent with zero because E ( W μ ) = E ( W ) μ = 0 . In addition, the second central moment, E [ ( W μ ) 2 ] , is actually the variance of the random variable W. Hence, we can write Equation (6) as follows:
E [ u ( W ) ] u ( E ( W ) ) + u ( E ( W ) ) 2 V a r ( W )
Equation (7) shows that the expected utility depends not only on the expected wealth at the end of the period, E ( W ) , but also on the variance of wealth at the end of the period V a r ( W ) . Since u ( x ) = a ( a 1 ) x a 2 , we see that the following applies:
E [ u ( W ) ] = u w + i = 1 n w i E [ R i ] + u w + i = 1 n w i E [ R i ] 2 Var ( W ) = w + i = 1 n w i E [ R i ] a + a ( a 1 ) 2 w + i = 1 n w i E [ R i ] a 2 × i = 1 n w i 2 Var ( R i ) + i = 1 n j i w i w j Cov ( R i , R j )
Thus, the optimal portfolio is obtained by maximizing the expected utility u ( x ) = x a in maximization problem (1), which is as follows:
max w 1 , w 2 , , w n { E [ U ( W ) ] = w + i = 1 n w i E [ R i ] a + a ( a 1 ) 2 w + i = 1 n w i E [ R i ] a 2 × i = 1 n w i 2 Var ( R i ) + i = 1 n j i w i w j Cov ( R i , R j ) }
Equation (9) is equivalent with the following:
max w 1 , w 2 , , w n E [ U ( W ) ] = E [ W ] a + a ( a 1 ) E [ W ] a 2 2 Var [ W ]

2.3.2. Expected Utility of Natural Logarithm Utility

Let u ( x ) = ln x with x > 0 be an investor’s utility function. Then, the expected utility of the end-of-period wealth is given by the following:
E u ( W ) = E ln W = E ln w + i = 1 n w i R i = E ln w 1 + 1 w i = 1 n w i R i
We then approximate Equation (10) with the second order of the Taylor series expansion and we obtain the following:
E [ u ( W ) ] = E ln ( w ) + E 1 w i = 1 n w i R i 1 2 1 w i = 1 n w i R i 2 = ln ( w ) + 1 w E i = 1 n w i R i 1 2 w 2 E i = 1 n w i R i 2
By solving the expectations contained in Equation (11) into simpler forms, the optimal portfolio can be obtained by maximizing the expected utility of end-of-period as follows:
max w 1 , w 2 , , w n { E [ U ( W ) ] = ln ( w ) + 1 w i = 1 n w i E [ R i ] 1 2 w 2 ( i = 1 n w i 2 Var ( R i ) + i = 1 n j i w i w j Cov ( R i , R j ) + i = 1 n w i E [ R i ] 2 ) }
Equation (13) is equivalent with the following:
max w 1 , w 2 , , w n { E [ U ( W ) ] = ln ( w ) + 1 w i = 1 n w i E [ R i ] 1 2 w 2 Var [ W ] + i = 1 n w i E [ R i ] 2 }

2.4. Optimal Portfolio Weights Under Classical Utility Functions

After determining the expected utility for each utility function as presented in Section 2.3, we then determined the optimal solution of the maximization problems (10) and (14). This subsection presents the analytical solutions for optimal portfolio allocation derived from maximizing the expected utility under each classical utility function. The results serve as a foundation for later sections that involve combinations of these utility functions.
Theorem 1.
Given two stock investments where the expected return of the first stock equal to a 1 , the variance of the first stock is equal to b 1 , the expected return of the second stock is equal to a 2 , the variance of the second stock is equal to b 2 , and the correlation between the returns of the first and second stocks is equal to c, if an investor’s initial wealth is w and the utility function used is the power utility function with u ( x ) = x a and with x > 0 and 0 < a < 1 , then the optimal portfolio of these two investments is w 1 * = α * w and w 2 * = ( 1 α * ) w , where the following applies:
α * = ϵ γ + δ θ a ϵ γ a δ θ ϵ γ ζ 2 γ 2 θ + σ 1 2 γ 3 2 δ γ + 2 a δ γ + δ γ ζ
or
α * = ϵ γ + δ θ a ϵ γ a δ θ ϵ γ ζ 2 γ 2 θ σ 1 2 γ 3 2 δ γ + 2 a δ γ + δ γ ζ
with the parameters defined as
γ = a 1 a 2 , δ = b 1 + b 2 2 c b 1 b 2 , ϵ = c b 1 b 2 b 2 , ζ = ( a 1 ) ( a 2 ) , θ = 1 + a 2 ,   a n d
σ 1 = ( a 2 δ 2 θ 2 2 a 2 δ ϵ γ θ + a 2 ϵ 2 γ 2 2 a b 2 δ γ 2 ζ 2 a δ 2 θ 2 + 4 a δ ϵ γ θ + 2 a ϵ 2 γ 2 ζ 2 a ϵ 2 γ 2 b 2 δ γ 2 ζ 2 + 2 b 2 δ γ 2 ζ 2 b 2 γ 4 ζ + δ 2 θ 2 2 δ ϵ γ θ 2 δ γ 2 θ 2 ζ + ϵ 2 γ 2 ζ 2 2 ϵ 2 γ 2 ζ + ϵ 2 γ 2 + 4 ϵ γ 3 θ ζ ) 1 / 2
Proof. 
The complete derivation is shown in Appendix C. □
Theorem 2.
Given two stock investments where the expected return of the first stock is equal to a 1 , the variance of the first stock is equal to b 1 , the expected return of the second stock is equal to a 2 , the variance of the second stock is equal to b 2 , and the correlation between the returns of the first and second stocks is equal to c, if an investor’s initial wealth is w and the utility function used is the natural logarithm utility function with u ( x ) = ln x and with x > 0 , then the optimal portfolio of these two investments is w 1 * = α * w and w 2 * = ( 1 α * ) w , where the following applies:
α * = ( a 1 a 2 ) ( 1 a 2 ) c b 1 b 2 + b 2 b 1 + b 2 2 c b 1 b 2 + ( a 1 a 2 ) 2
Proof. 
The complete derivation is shown in Appendix D. □

3. Combined Utility Functions

To address the limitations of single utility functions in capturing complex investor preferences, we considered two combined formulations based on the power and natural logarithm utilities: a linear combination and a multiplicative form.

3.1. Proposition of the Combined Power and Natural Logarithm Utilities

We now present the mathematical propositions for these combined utility forms, building on the individual utility functions introduced in Section 2.
Proposition 3.
The linear combination of power and natural logarithm utilities U ( x ) = λ 1 x a + λ 2 ln x with ( 1 ) 1 a λ 2 a λ 1 1 a x ( 1 ) 1 a λ 2 λ 1 a ( 1 a ) 1 a , where ( 1 ) 1 a R , a = 1 2 m for m N , and 0 λ 1 , λ 2 1 is a utility function.
Proof. 
The complete derivation is shown in Appendix E. □
Proposition 4.
The multiplication of power and natural logarithm utilities U ( x ) = x a ln x where e 1 a x e 1 2 a a ( a 1 ) and 0 < a < 1 is a utility function.
Proof. 
The complete derivation is shown in Appendix F. □

3.2. Expected Utility of Combined Utility Functions

Following the discussion in the previous preliminaries section, the first step before obtaining the optimal portfolio was to determine the expected utility for the combination of the functions. As a result, this research focused on the combination of power and natural logarithm utility functions.

3.2.1. Expected Utility of Linear Combination of Power and Natural Logarithm Utilities

Suppose we have a linear combination utility function as shown in Proposition 3. Since we have calculated the expected utility of the power and natural logarithm utility functions, it is easy to compute that the expected value of the linear combination is given by the following:
E U ( W ) = λ 1 E [ W ] a + a ( a 1 ) E [ W ] a 2 2 Var [ W ] + λ 2 [ ln ( w ) + 1 w i = 1 n w i E [ R i ] 1 2 w 2 Var [ W ] + i = 1 n w i E [ R i ] 2 ]
Therefore, the optimal portfolio is selected by maximizing the expected utility function U ( x ) = λ 1 x a + λ 2 ln x , which can be stated as follows:
max w 1 , w 2 , , w n { E [ U ( W ) ] = λ 1 E [ W ] a + a ( a 1 ) E [ W ] a 2 2 Var [ W ] + λ 2 ln ( w ) + 1 w i = 1 n w i E [ R i ] 1 2 w 2 Var [ W ] + i = 1 n w i E [ R i ] 2 }

3.2.2. Expected Utility of Multiplication of Power and Natural Logarithm Utilities

Suppose we have a linear combination utility function as shown in Proposition 4. We approximate the expected utility by applying the second order of the Taylor series around μ = E ( W ) , such as is presented in Equation (7), and then the expected value is given by the following:
E [ U ( W ) ] = w + i = 1 n w i E [ R i ] a ln w + i = 1 n w i E [ R i ] + 1 2 w + i = 1 n w i E [ R i ] a 2 ( a ( a 1 ) ln w + i = 1 n w i E [ R i ] + 2 a 1 ) i = 1 n w i 2 Var ( R i ) + i = 1 n j i w i w j Cov ( R i , R j )
Therefore, the optimal portfolio is selected by maximizing the expected utility function U ( x ) = x a ln x , which can be stated as follows:
max w 1 , w 2 , , w n { E [ U ( W ) ] = w + i = 1 n w i E [ R i ] a ln w + i = 1 n w i E [ R i ] + 1 2 w + i = 1 n w i E [ R i ] a 2 a ( a 1 ) ln w + i = 1 n w i E [ R i ] + 2 a 1 × i = 1 n w i 2 V a r ( R i ) + i = 1 n j i w i w j C o v ( R i , R j ) }

3.3. Optimal Portfolio Selection

In the preliminaries, specifically in Section 2.4, the optimal portfolio proportions for the classical utility functions were discussed. Furthermore, the subsection focused on the optimal portfolio allocations derived from combining different utility functions.
Theorem 3.
Given two stock investments where the expected return of the first stock is equal to a 1 , the variance of the first stock is equal to b 1 , the expected return of the second stock is equal to a 2 , the variance of the second stock is equal to b 2 , and the correlation between the returns of the first and second stocks is equal to c, if an investor’s initial wealth is w and the utility function used is the linear combination of the power and natural logarithm utility functions with U ( x ) = λ 1 x a + λ 2 ln x with ( 1 ) 1 a λ 2 a λ 1 1 a x ( 1 ) 1 a λ 2 λ 1 a ( 1 a ) 1 a , where ( 1 ) 1 a R , a = 1 2 m for m N , and 0 λ 1 , λ 2 1 , then the optimal portfolio of these two investments is w 1 * = α * w and w 2 * = ( 1 α * ) w , where the following applies:
α * = δ λ 1 θ + δ λ 2 + ϵ γ λ 1 2 γ 2 λ 1 θ γ 2 λ 2 a δ λ 1 θ a ϵ γ λ 1 δ ϵ γ λ 1 + σ 1 γ λ 1 2 a δ + δ ζ 2 δ + 2 γ 2
or
α * = δ λ 1 θ + δ λ 2 + ϵ γ λ 1 2 γ 2 λ 1 θ γ 2 λ 2 a δ λ 1 θ a ϵ γ λ 1 δ ϵ γ λ 1 σ 1 γ λ 1 2 a δ + δ ζ 2 δ + 2 γ 2
with the parameters defined as
γ = a 1 a 2 , δ = b 1 + b 2 2 c b 1 b 2 , ϵ = c b 1 b 2 b 2 , ζ = ( a 1 ) ( a 2 ) , θ = 1 + a 2 ,   a n d
σ 1 = ( a 2 δ 2 λ 1 2 θ 2 2 a 2 δ ϵ γ λ 1 2 θ + a 2 ϵ 2 γ 2 λ 1 2 + 4 a a 2 δ γ 2 λ 1 λ 2 2 a b 2 δ 2 γ 2 λ 1 2 + 2 a δ 2 ϵ γ λ 1 2 θ 2 a δ 2 λ 1 2 θ 2 2 a δ 2 λ 1 λ 2 θ + 2 a δ ϵ 2 γ 2 λ 1 2 2 a δ ϵ γ λ 1 2 θ ζ + 4 a δ ϵ γ λ 1 2 θ + 2 a δ ϵ γ λ 1 λ 2 + 2 a δ γ 2 λ 1 λ 2 θ 4 a δ γ 2 λ 1 λ 2 2 a ϵ 2 γ 2 λ 1 2 + 2 a ϵ γ 3 λ 1 λ 2 + 2 a 2 δ γ 2 λ 1 λ 2 ζ 4 a 2 δ γ 2 λ 1 λ 2 + 4 a 2 γ 4 λ 1 λ 2 b 2 δ 2 γ 2 λ 1 2 ζ + 2 b 2 δ 2 γ 2 λ 1 2 2 b 2 δ γ 4 λ 1 2 + δ 2 ϵ 2 γ 2 λ 1 2 2 δ 2 ϵ γ λ 1 2 θ 2 δ 2 ϵ γ λ 1 λ 2 + δ 2 λ 1 2 θ 2 + 2 δ 2 λ 1 λ 2 θ + δ 2 λ 2 2 2 δ ϵ 2 γ 2 λ 1 2 + 4 δ ϵ γ 3 λ 1 2 θ + 2 δ ϵ γ 3 λ 1 λ 2 + 2 δ ϵ γ λ 1 2 θ ζ 2 δ ϵ γ λ 1 2 θ + 2 δ ϵ γ λ 1 λ 2 ζ 2 δ ϵ γ λ 1 λ 2 2 δ γ 2 λ 1 2 θ 2 ζ 6 δ γ 2 λ 1 λ 2 θ 2 δ γ 2 λ 2 2 + ϵ 2 γ 2 λ 1 2 + 2 ϵ γ 3 λ 1 λ 2 + 4 γ 4 λ 1 λ 2 θ 4 γ 4 λ 1 λ 2 + γ 4 λ 2 2 ) 1 / 2
Proof. 
The complete derivation is shown in Appendix G. □
Compared to the linear combination of both utility functions earlier mentioned, the multiplicative utility function in Proposition 4 does not provide an explicit solution for α * or the allocation weight for the first investment. This complexity arises from the derivative of its expected utility, resulting in the following nontrivial expression:
a γ ( γ α + θ ) 2 ln w + ln ( γ α + θ ) + γ ( γ α + θ ) 2 + { a 2 2 γ ( a ( a 1 ) [ ln w + ln ( γ α + θ ) ] + 2 a 1 ) δ α 2 + 2 ϵ α + b 2 + ( γ α + θ ) ( a ( a 1 ) [ ln w + ln ( γ α + θ ) ] + 2 a 1 ) ( δ α + ϵ ) } = 0
Equation (25), derived from the multiplicative utility function, includes transcendental terms, such as exponential terms, logarithms, and nonlinear combinations of variables, which preclude closed-form analytical solutions. Moreover, such equations cannot be resolved using a finite sequence of algebraic operations and must be approached numerically. These were solved numerically using the Newton–Raphson method to obtain the optimal allocation, as described in Section 4.1.

4. Numerical Simulations

This section focuses on the numerical simulations performed to validate the explicit solutions analyzed in the previous one. The daily closing prices of Chewy Inc. (CHWY, Plantation, FL, USA ) and Alphabet Inc. (GOOG, Mountain View, CA, USA), obtained from Yahoo Finance, were used. The sample period was from 1 October to 31 December 2024, amounting to 63 trading days. The daily return was calculated as the log difference of consecutive closing prices, with the resulting series shown in Figure 1. This implies that the returns of the CHWY and GOOG stocks were volatile.
The validity of the normality assumption for the stock returns was assessed and evaluated by performing two statistical tests, namely, the Shapiro–Wilk and Anderson–Darling tests, on the return series of both CHWY and GOOG. The Shapiro–Wilk test is widely used to assess small and moderate sample sizes due to its general sensitivity to deviations from normality. The Anderson–Darling test is more sensitive to deviations in the tails of the distribution, making it particularly suitable for e-commerce data, where heavy tails are often present. The null hypothesis of this test is reliant on the data following a normal distribution.
Considering the stock return data of both CHWY and GOOG, the results of the Shapiro–Wilk and Anderson–Darling tests did not reject the null hypothesis of normality at the significance level 5%. However, the Anderson–Darling test was used to obtain a p-value of 0.121 and 0.071 for CHWY and GOOG, respectively, suggesting no significant departure from normality. The Shapiro–Wilk test also produced p-values greater than 0.05. The complete results of the tests are summarized in Table 1.
The tests, particularly with a moderate sample size of 63, lacked the power to detect subtle but meaningful deviations, particularly in the tails, which play a relevant role in e-commerce returns as these returns are empirically known to exhibit heavy-tailed behavior. Therefore, the results of the test which supported the assumption of normality at a conventional threshold were interpreted with caution and supplemented with Q–Q plots. Figure 2 shows approximate linearity, including mild deviations at the tails.
These observations support the use of the normality assumption in analysis. Based on the assumption, the subsequent simulation relied on parameter values that appropriately reflected this distributional property.
The parameter values used in the simulation are shown in Table 2, with expected returns, variances, and correlations empirically estimated based on historical data. The utility weights and risk aversion coefficient were set according to reasonable assumptions consistent with the properties of the utility function discussed earlier.
The investor risk preference coefficient was set to a = 0.125 , reflecting a relatively low level of absolute risk aversion. This assumption is consistent with investor profiles that are more tolerant of volatility, which is particularly relevant in the context of high-growth sectors such as e-commerce.
The utility weight parameters were selected as λ 1 = 0.8 and λ 2 = 0.2 for the power and natural logarithm utilities, respectively. This configuration represents an investor whose preferences are mainly captured by the power utility while still incorporating a degree of logarithmic behavior to reflect diminishing marginal utility. The weighted combination enabled the simulation of heterogeneous preferences.

4.1. Optimal Asset Allocation

The optimal allocation proportions for the first and second investments were calculated for the power, natural logarithm, and combined utility functions, derived from the established formulations.
Supposing the investor had an initial wealth and risk preference value of w and 0.125 , respectively, the power utility function was used to resolve the analysis, and, based on Theorem 1, the optimal α * value was found to be α * = 0.946 . This implies that the optimal allocation for the CHWY stock is α * = 0.946 = 94.6 % , while the allocation for the GOOG stock is 1 α * = 0.054 = 5.4 % . Consequently, the optimal portfolio consists of w 1 * = 0.946 w and w 2 * = 0.054 w , allocated to the first and second investments, respectively.
In the case where the utility function adopted is the natural logarithm, the optimal α * value is derived from Theorem 2, giving α * = 0.852 . This shows that the optimal allocation for the CHWY and GOOG stocks is α * = 0.852 = 85.2 % and 1 α * = 0.148 = 14.8 % , respectively. Therefore, the optimal portfolio in this case is w 1 * = 0.852 w and w 2 * = 0.148 w for the first and second investments.
Finally, if the utility function is a linear combination of the two functions mentioned above, then, according to Table 3, the optimal α * value is α * = 0.925 . This suggests that the optimal allocation for the CHWY and GOOG stocks is α * = 0.925 = 92.5 % and 1 α * = 0.075 = 7.5 % , respectively. Therefore, the optimal portfolio result is w 1 * = 0.925 w and w 2 * = 0.075 w , allocated to the first and second investments.
Although the multiplication of the power and natural logarithm utility functions does not have an explicit solution as in Equation (25), a numerical approach can be utilized to determine its optimal portfolio. Setting a = 0.01 , the optimal allocation was found to be α * = 0.868965 and 1 α * = 0.13105 for the first and second investments, respectively. It implies that the investor could allocate w 1 * = 0.868965 w and w 2 * = 0.13105 w to the first and second investments. Additionally, the result was derived using the Newton–Raphson method introduced earlier. The numerical results are shown in Table 3, with convergence achieved in three iterations.

4.2. Behavioral Interpretation of Utility Functions

The observed differences in the optimal portfolio allocations under various utility functions focused on investor heterogeneity. As a result, the investor with low risk aversion, captured through the power utility function, was more aggressive and allocated larger proportions to volatile assets in pursuit of higher expected returns. Risk-averse investors, modeled using natural logarithm utility, exhibit conservative behavior in high-volatility environments such as e-commerce sector.
The linear combination of the power and natural logarithm utility functions reflects a form of investor behavior that integrates multiple risk preferences. This approach portrays an investor who strikes a balance between pursuing profits and avoiding risks. Flexibility can be achieved by adjusting the weights assigned to each of the utility functions. As a result, the investor is able to adopt a more balanced approach, particularly in sectors with uncertain or diverse return profiles, enabling dynamic shifts between aggressive and conservative strategies depending on market conditions and personal preferences.
The multiplicative form of these two utility functions, despite lacking a closed-form solution, offers a different behavioral interpretation. The multiplication of the two causes the resulting utility function to exhibit heightened curvature, particularly at lower levels of wealth. This implies that the investor is highly averse to losses while focused on benefitting from increasing returns. The multiplicative utility function produces more sensitive outcomes that reflect its compound nature, where a dominant factor, such as return expectations, significantly influences the result.

4.3. Three-Dimensional Visualization of Optimal Alpha Values

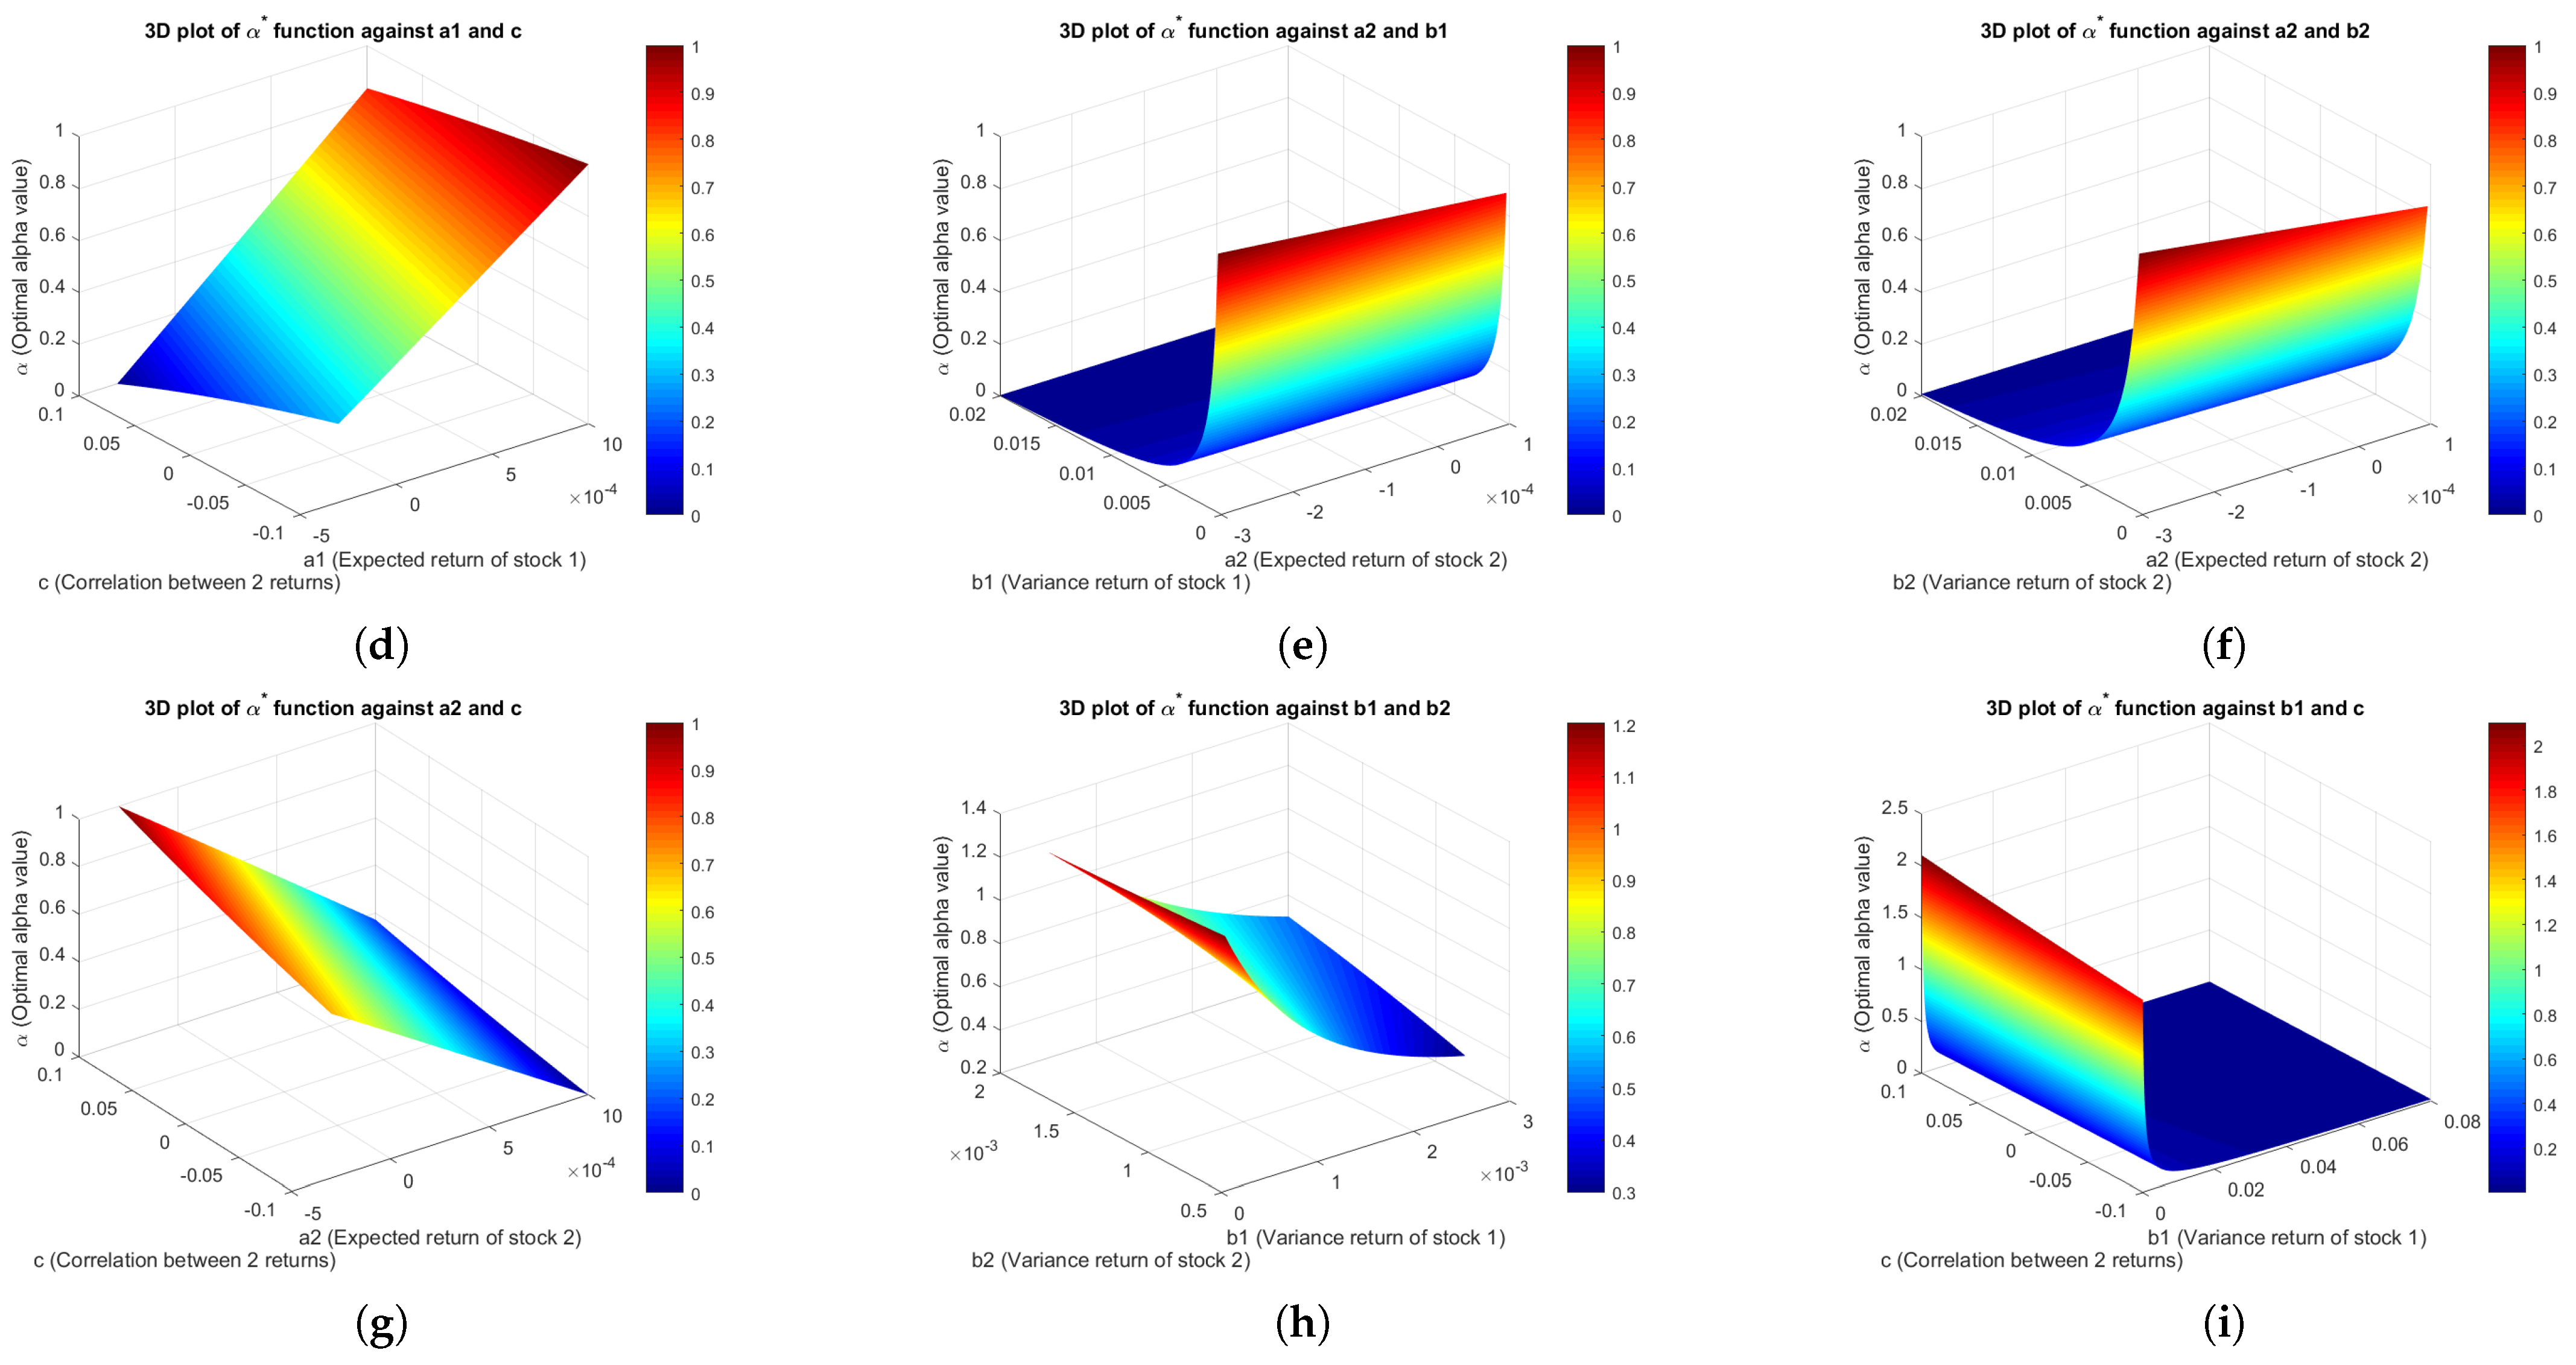
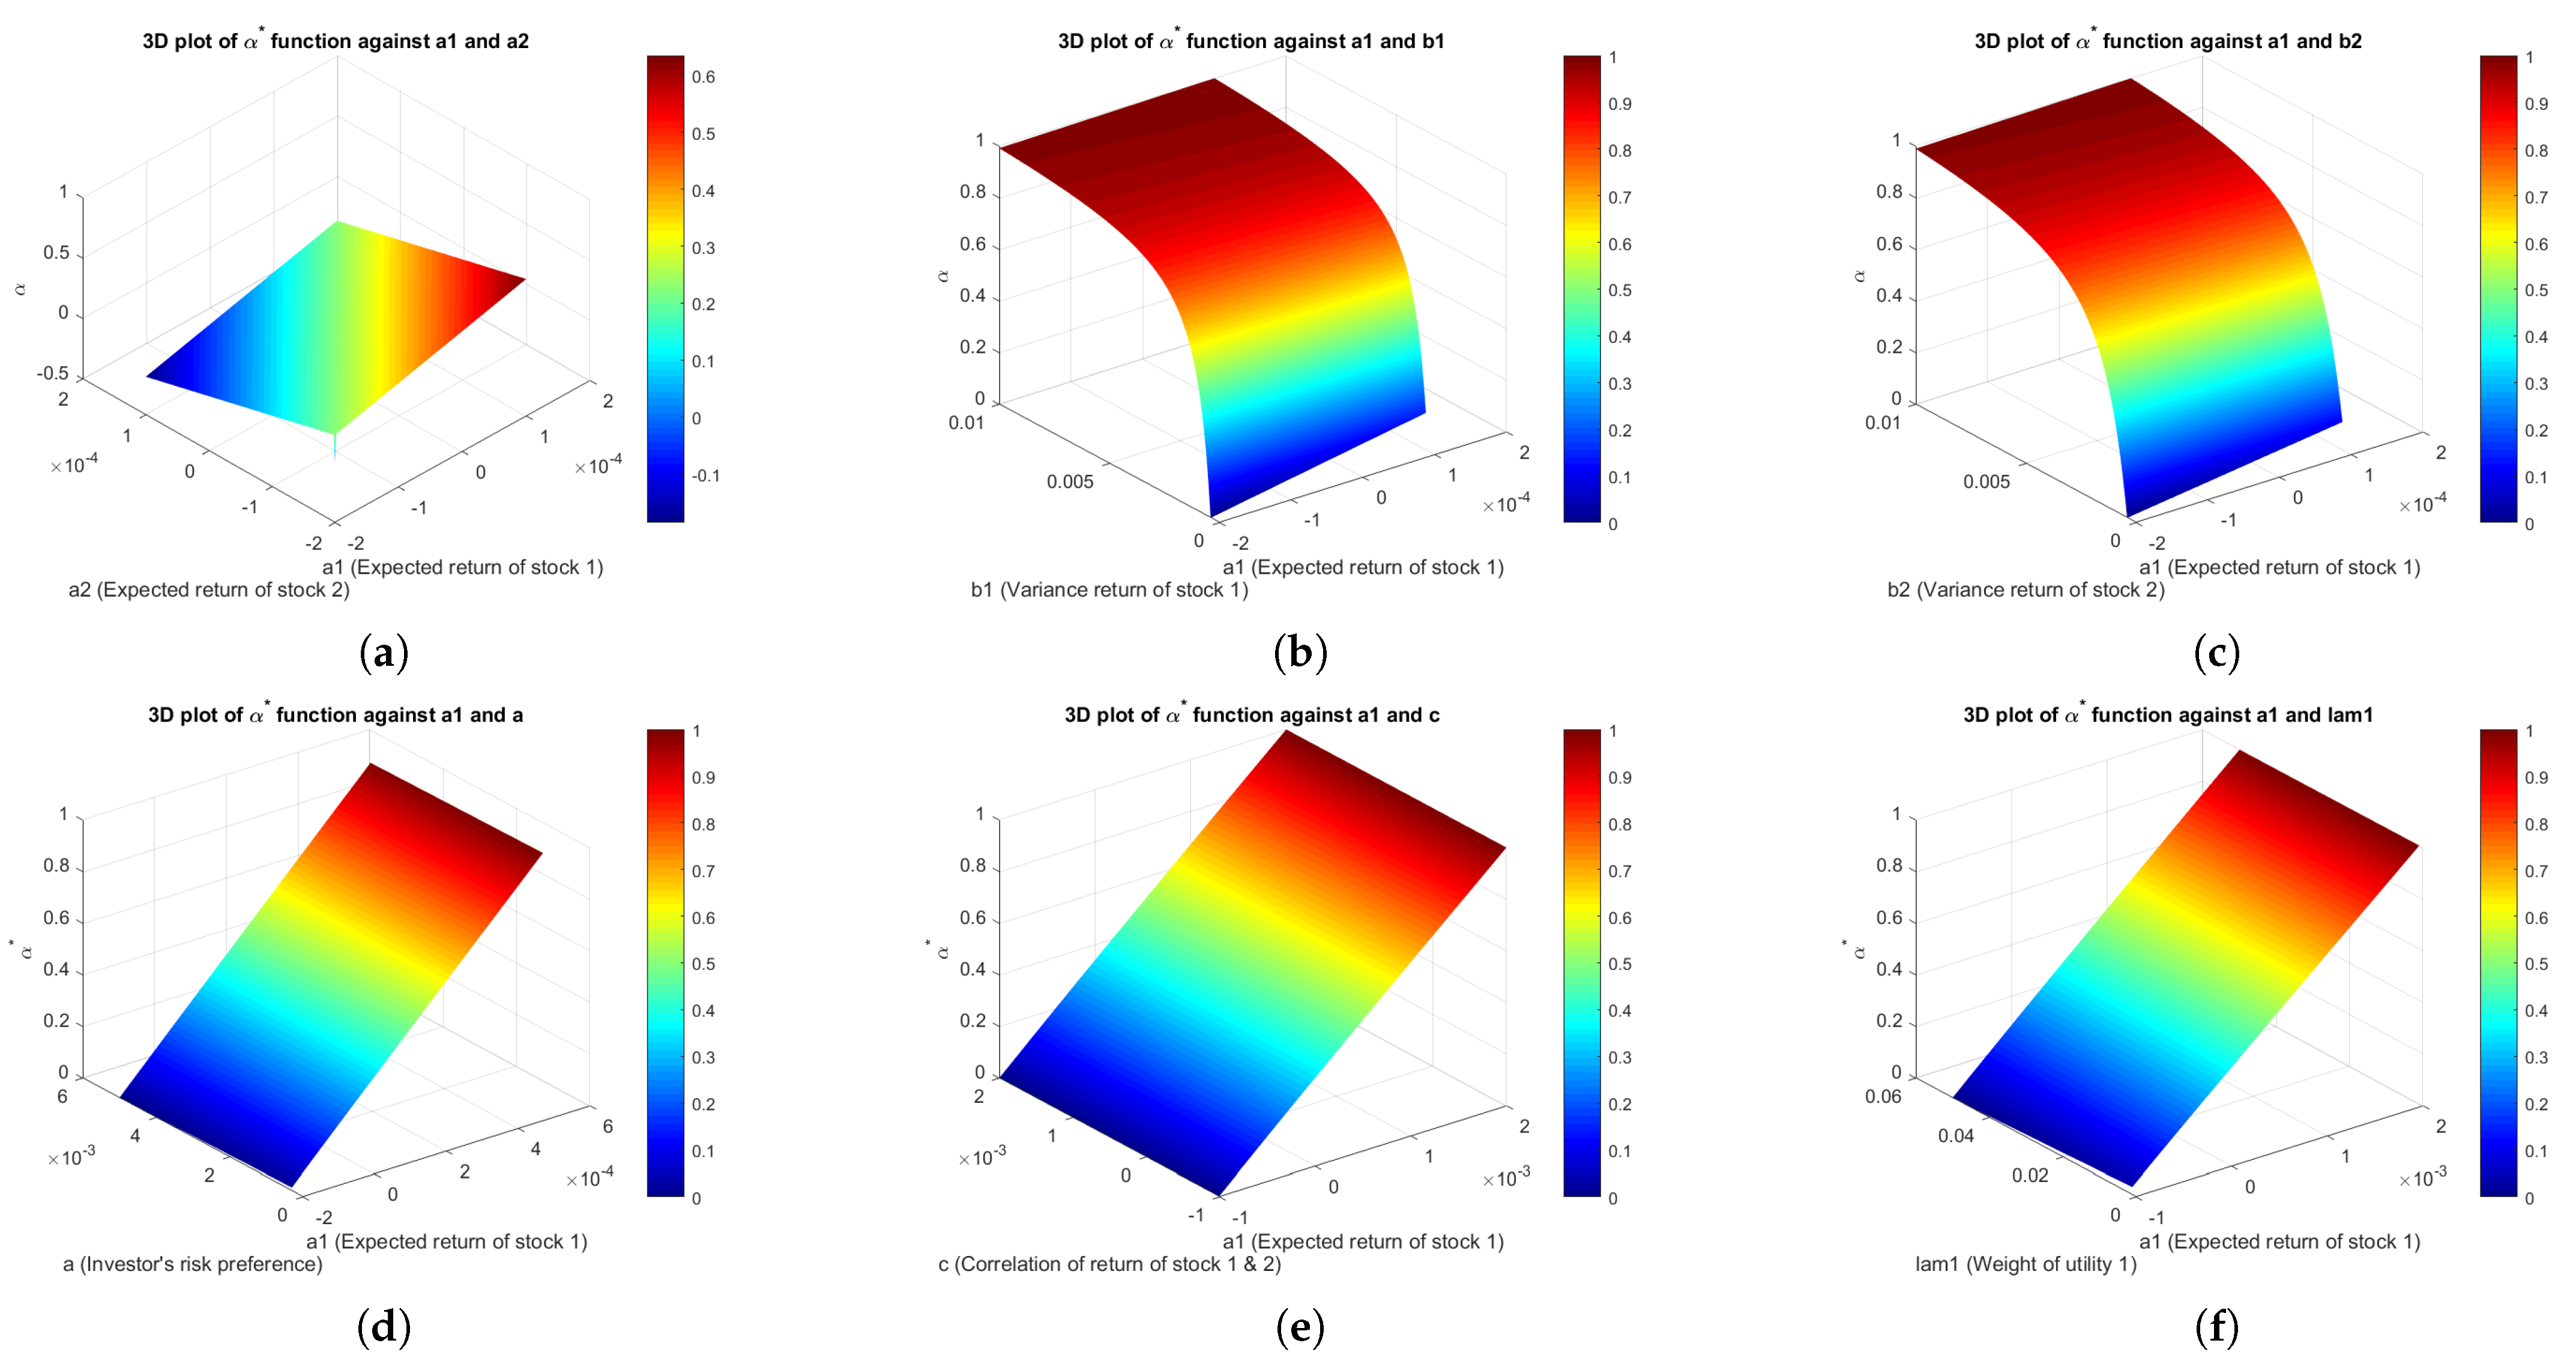
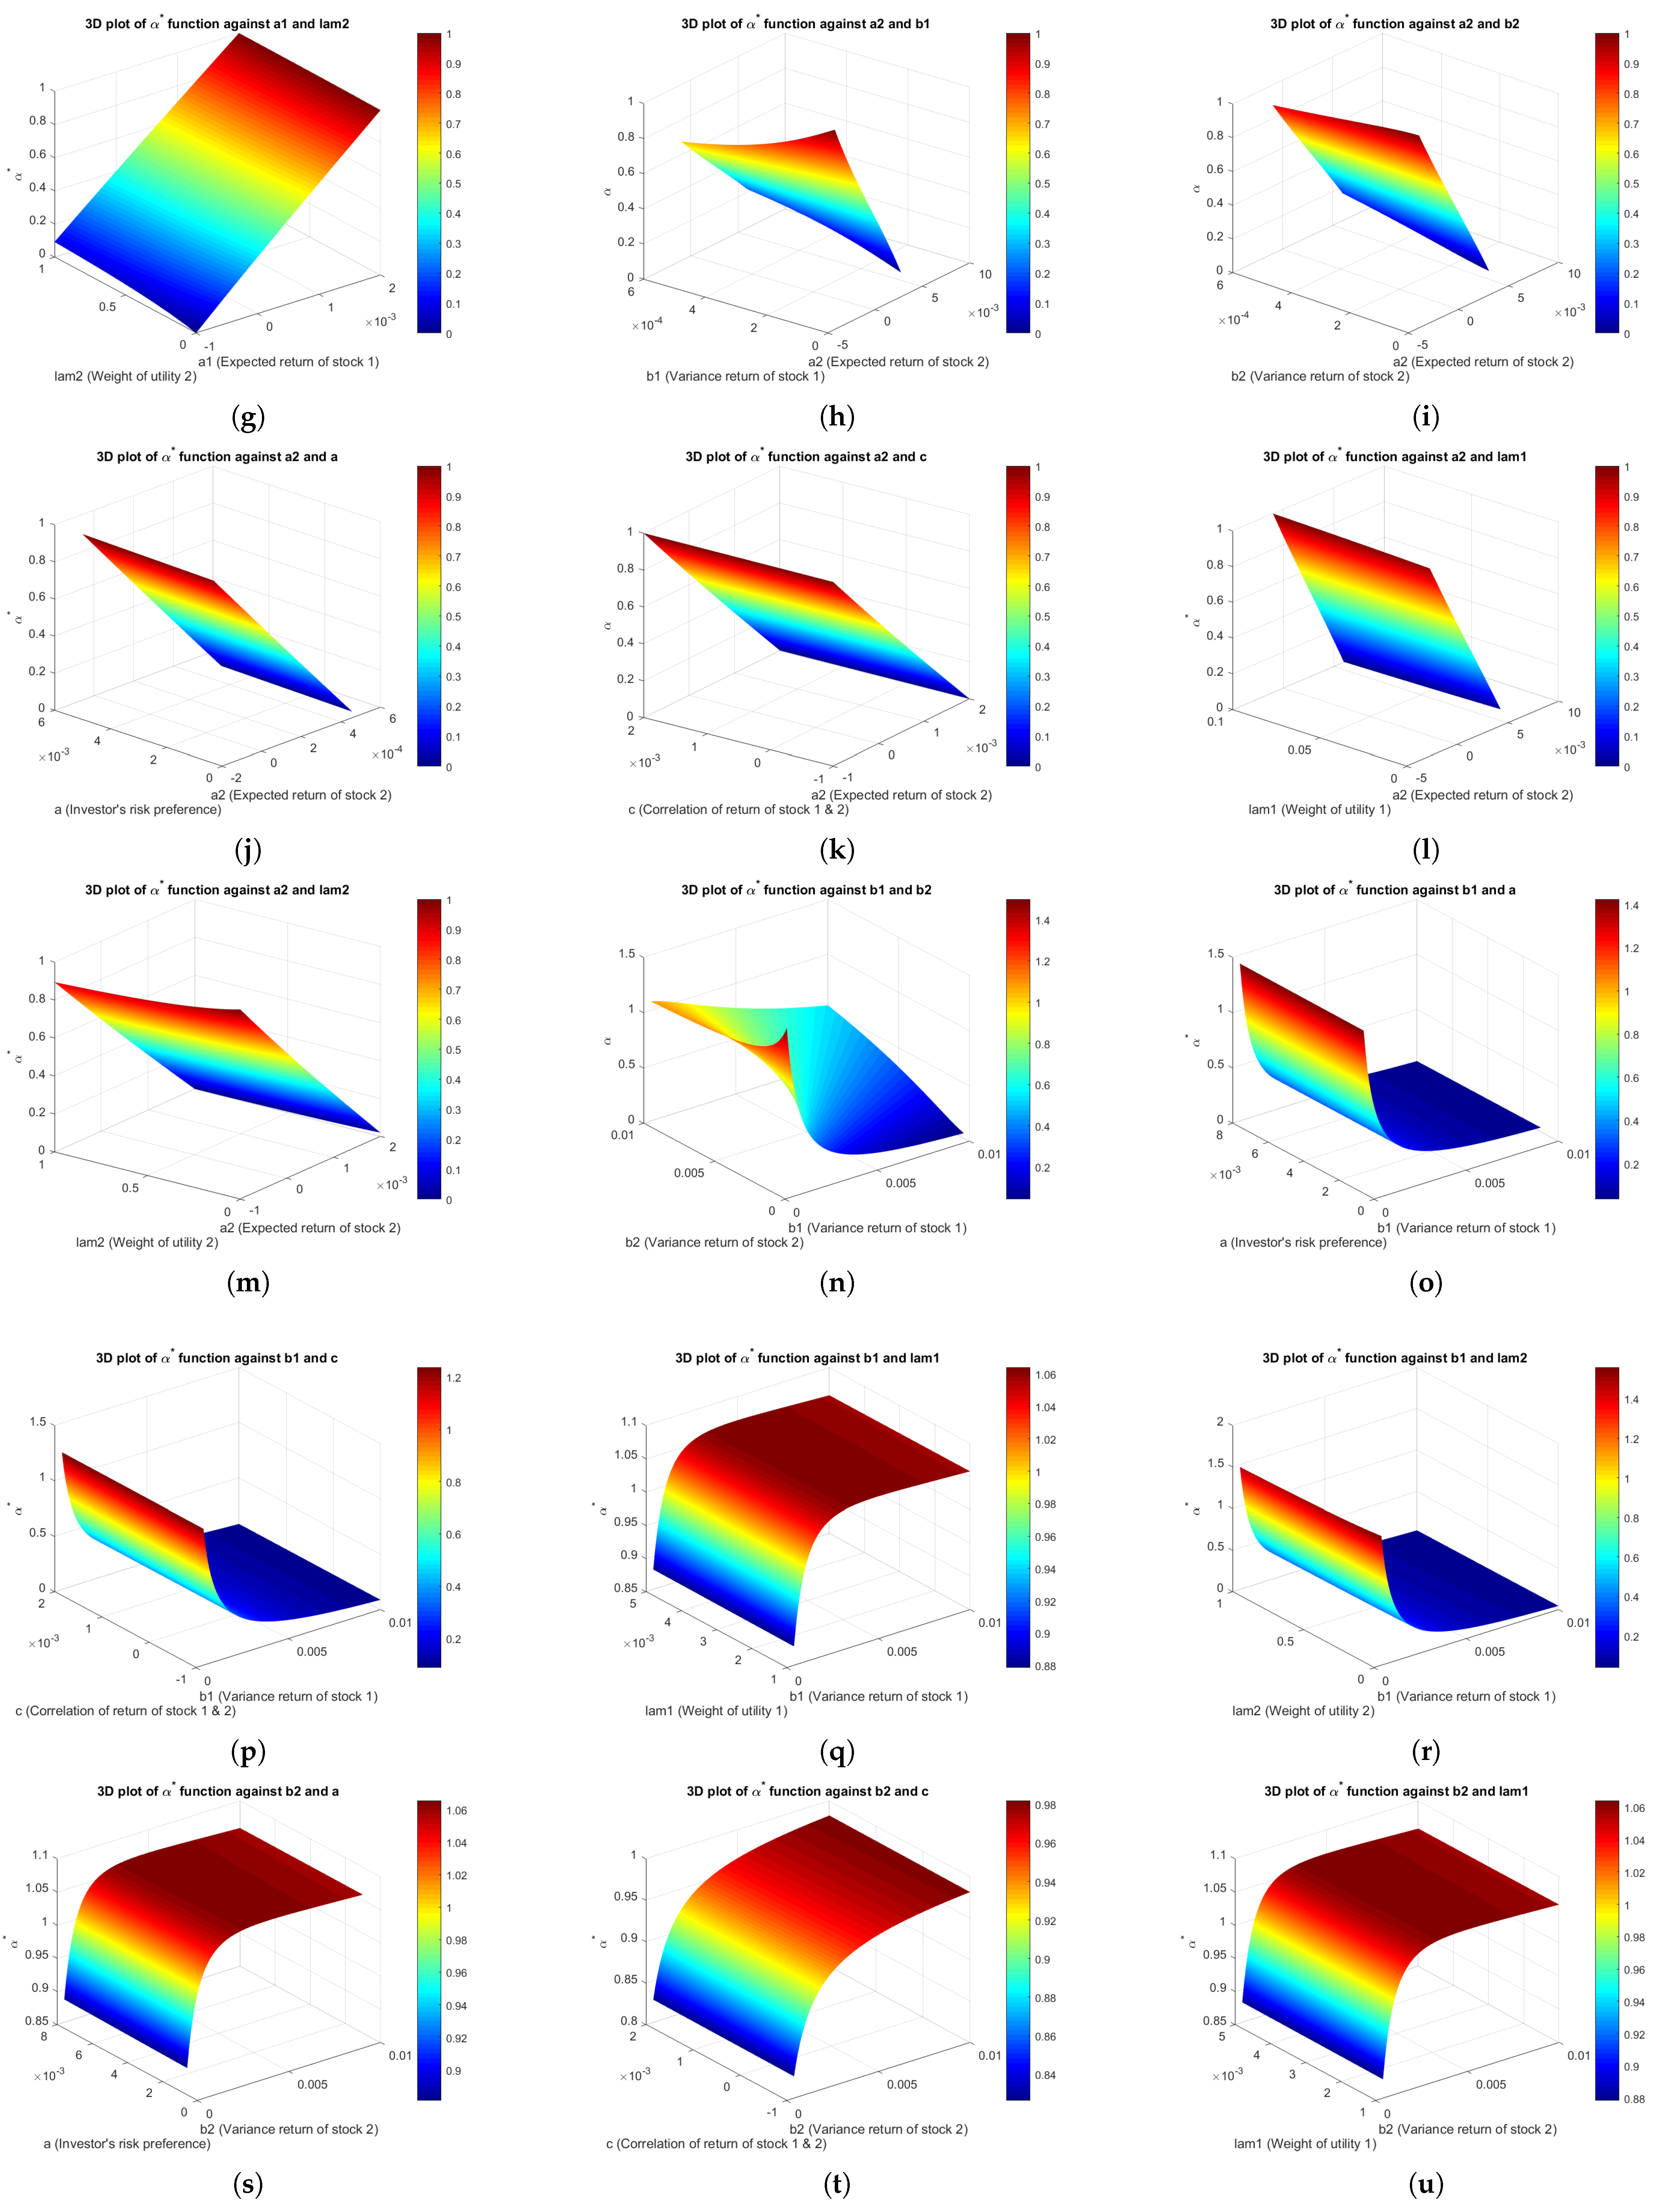
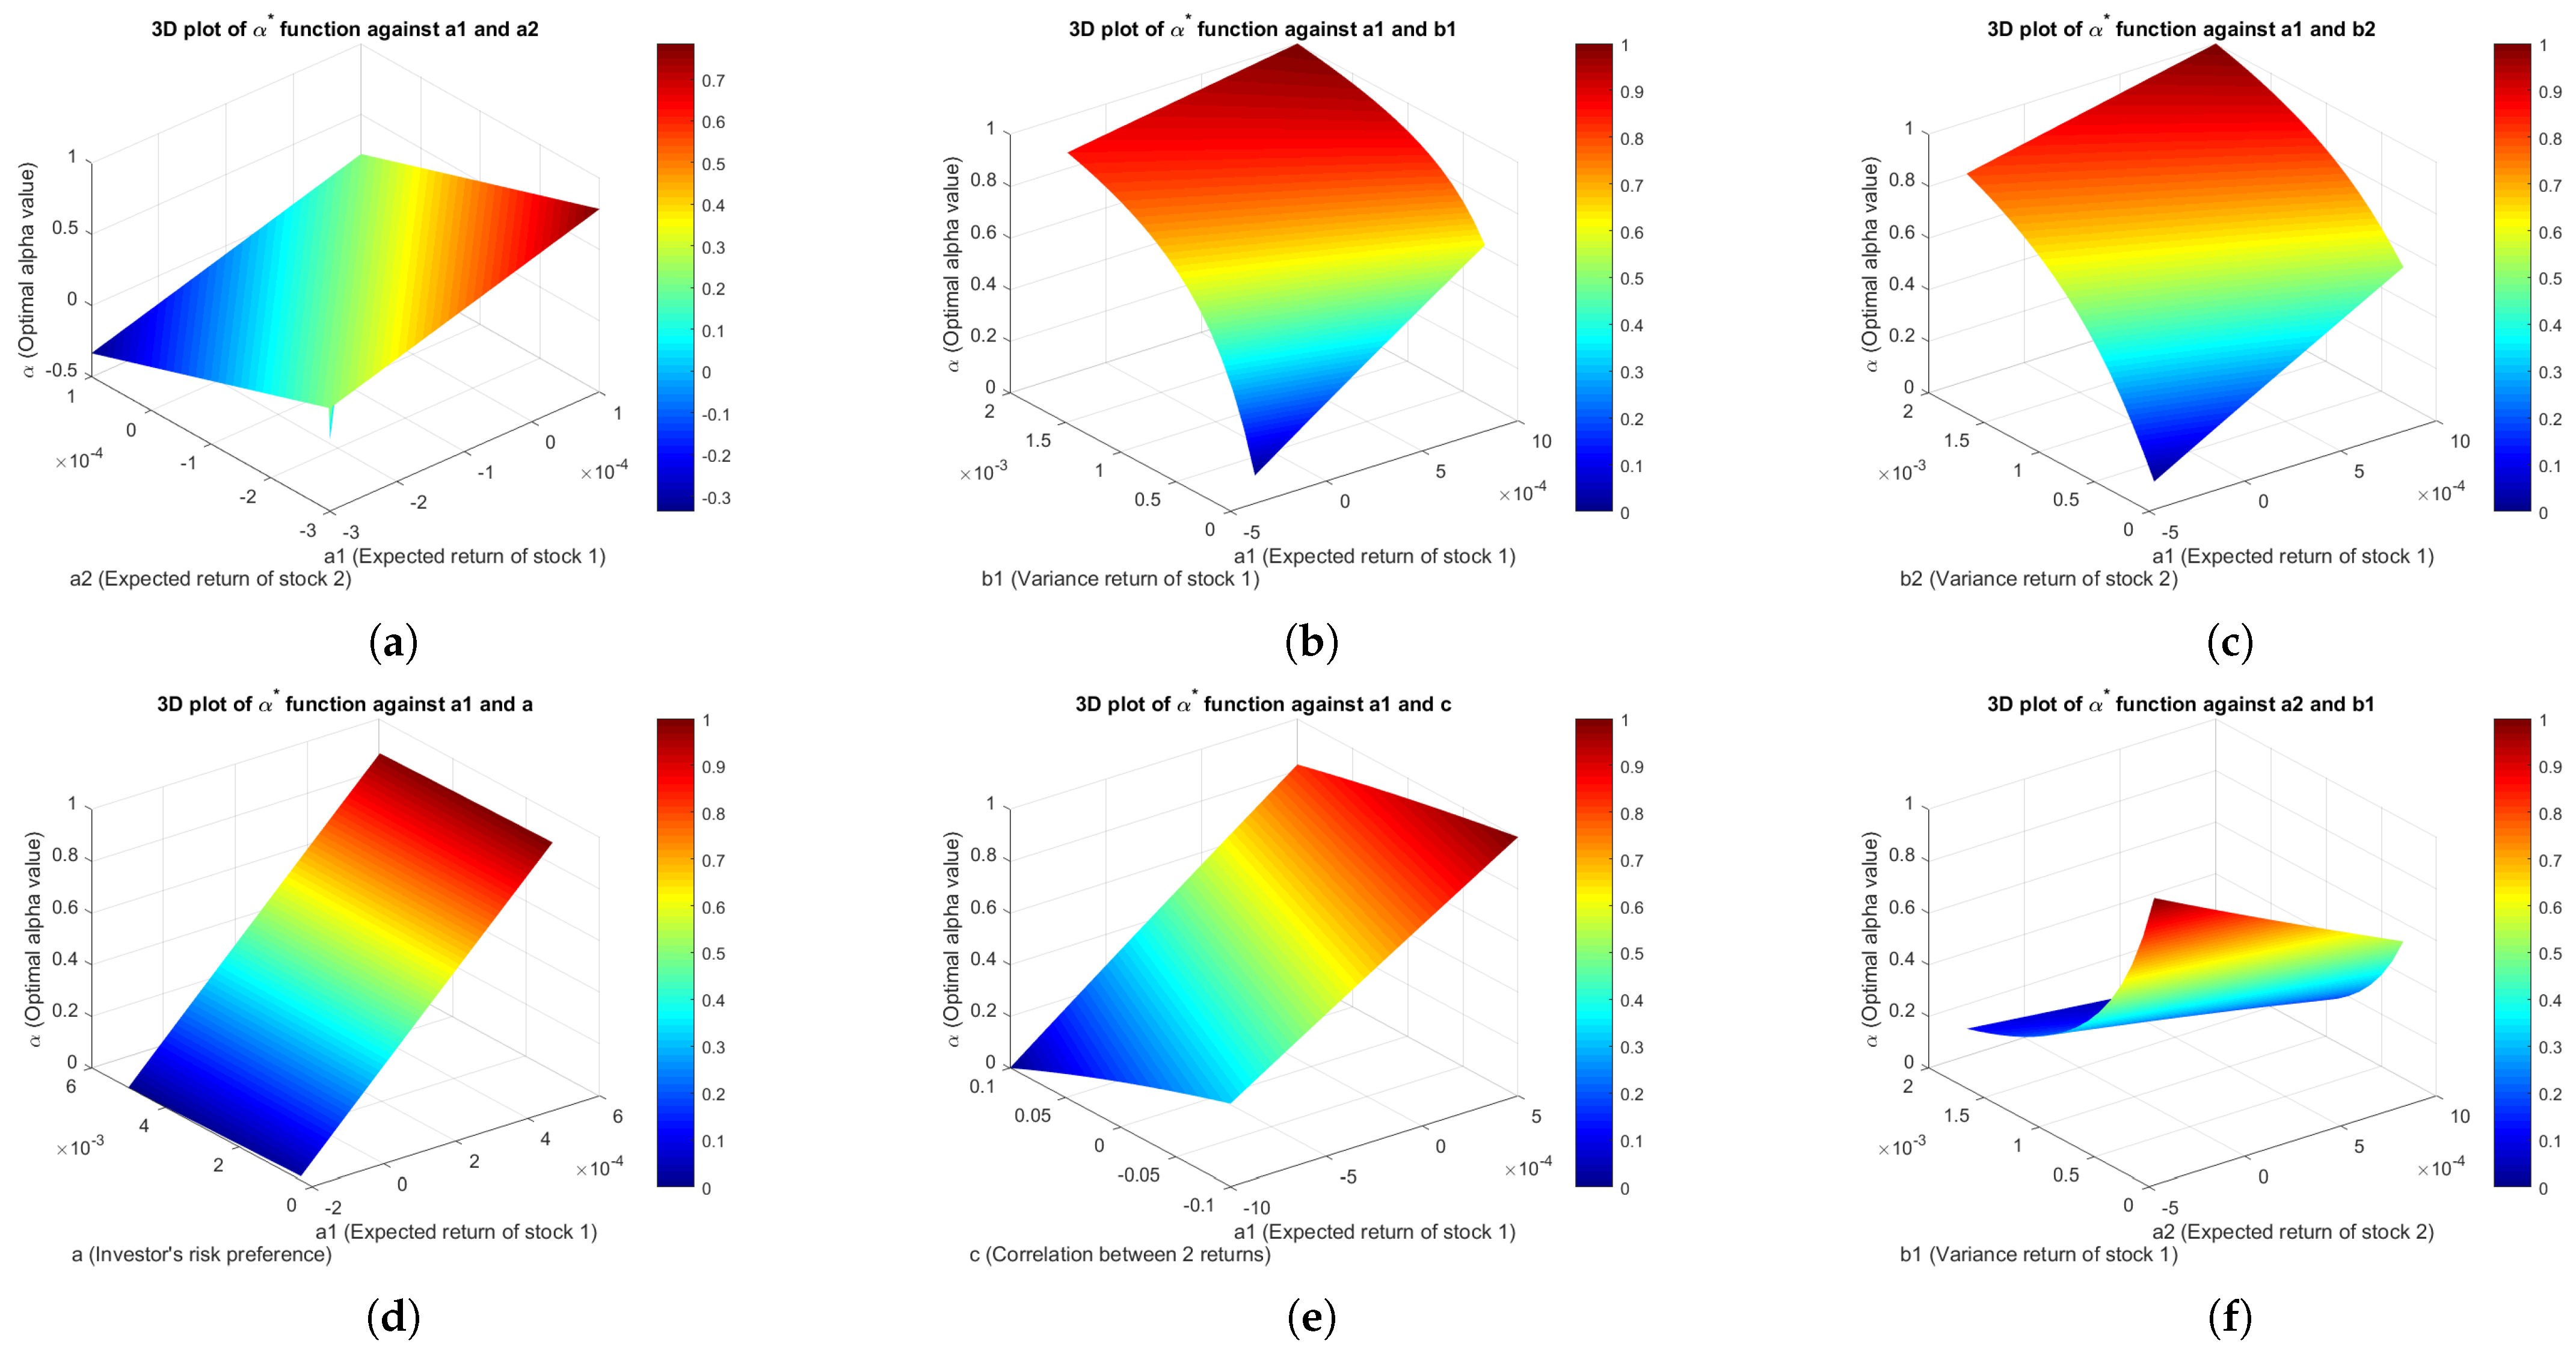
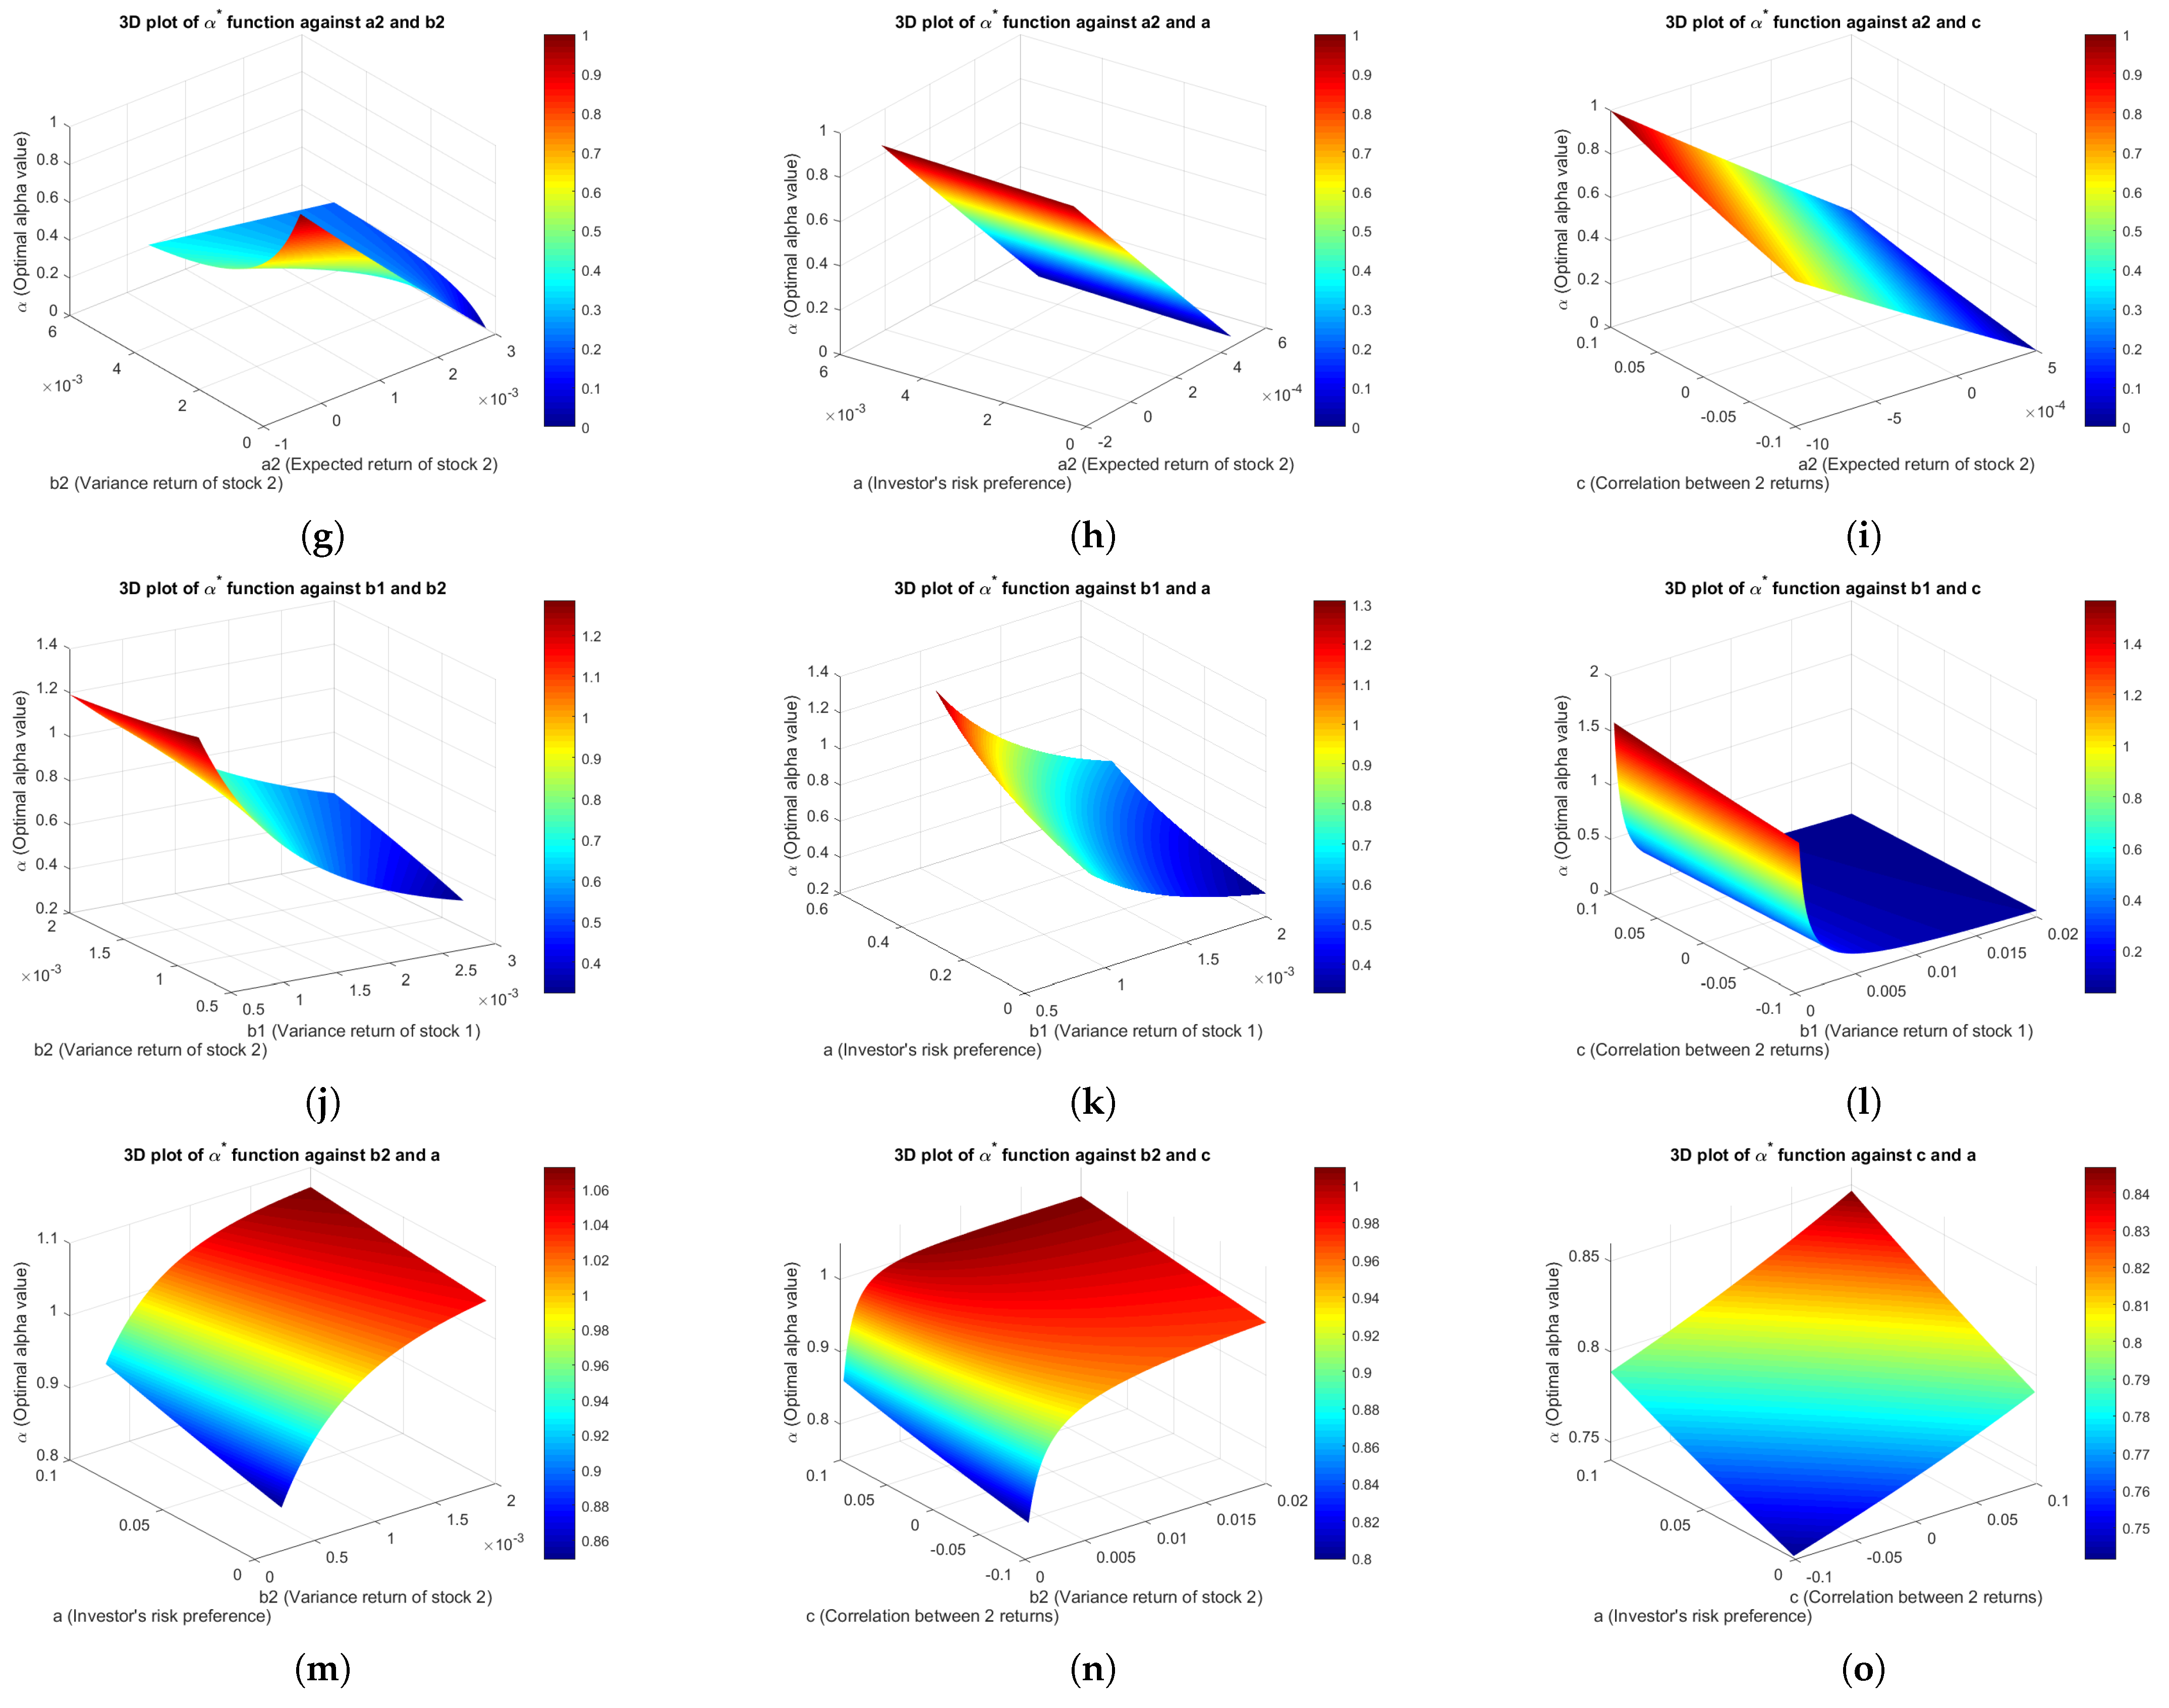
To further explore the effects of parameter combinations on portfolio allocation, a set of 3D plots was generated to visualize the behavior of the optimal allocation α * . The purpose of the visualization was to examine the relationship between the optimal alpha values and the changes in the parameters a 1 , a 2 , b 1 , b 2 , c, a, λ 1 , and λ 2 . Redder hues on the color bar of all plots represent higher values of α * , depicting greater allocation to the first stock.

4.3.1. Three-Dimensional Plots of Power Utility Function

Three-dimensional simulation plots for the power utility function are shown in Appendix H. These plots show how the optimal proportion allocated to stock 1 varies under different parameter combinations.
For example, Figure A1a shows that, as a 1 increases, α * tends to rise, implying a larger proportion of funds is allocated to stock 1. In this scenario, the investor favors stock 1, based on the higher expected return offered compared to the other. As a 2 increases, the value of α * decreases, reflecting a shift in allocation away from stock 1 towards stock 2, whose return is more attractive. In Figure A1h–l, increases in a 2 or b 1 on the x-axis are associated with reductions in α * , and increases in the y-axis parameters correspond to higher allocations to stock 1. This implies that the investor allocates more funds to the first investment, and the remaining plots can be interpreted in a similar way.

4.3.2. Three-Dimensional Plots of Natural Logarithm Utility Function

Appendix I shows 3D plots depicting how the natural logarithm utility function responds to parameter changes.
Figure A2a,d show the relationships between the optimal α * and parameters a 1 , a 2 , and c. As the expected return of stock 1 ( a 1 ) increases, the optimal value of α * also rises, showing that the investor allocates more funds to the first stock. Moreover, as the expected return of stock 2 ( a 2 ) and the correlation between the returns of stocks 1 and 2 (c) increase, the value of α * decreases, implying a shift in preference toward the second stock. Figure A2b,c show that a lower or higher variance in the returns of stocks 1 ( b 1 ) and 2 ( b 2 ) leads to a higher α * , suggesting a greater allocation to stock 1, and the remaining figures can be interpreted accordingly.
Figure A2a,d show the relationships between the optimal α * and parameters a 1 , a 2 , and c. As the expected return of stock 1 ( a 1 ) increases, the optimal value of α * also increases, indicating that investors tend to allocate more funds to the first stock. Conversely, as the expected return of stock 2 ( a 2 ) and the correlation between the returns of stock 1 and stock 2 (c) increase, the value of α * decreases, implying a shift in preference toward the second stock. Figure A2b,c show that a lower variance in the returns of stock 1 ( b 1 ) or a higher variance in the returns of stock 2 ( b 2 ) results in a higher α * , which suggests a greater allocation to stock 1. The remaining figures can be interpreted accordingly.

4.3.3. Three-Dimensional Plots of Linear Combination Utility Function

Several 3D simulation plots of α * for the linear combination of the power and natural logarithm utility functions are shown in Appendix J, implying optimal allocation to the first investment.
Figure A3a provides a similar interpretation to Figure A2a, implying that, as parameter a 1 increases, the optimal value of α * also rises. Meanwhile, Figure A3d–g show that changes in utility weights ( λ 1 and λ 2 ), investor risk preference (a), and return correlation (c) influence α * in varying ways, depending on the values of other parameters.

5. Sensitivity Analysis

A sensitivity analysis was performed to examine how variations in each parameter influence optimal asset allocation. To further quantify sensitivity, the elasticity index of α * was calculated with respect to each parameter. Therefore, the elasticity index can be stated as follows:
I q α * = α * q × q α *
where q { a 1 , a 2 , b 1 , b 2 , a , c , λ 1 , λ 2 } and I q α * measures the proportional change in α * given a proportional change in parameter q.
The calculation of the elasticity index was used to validate the results of the 3D plots regarding the influence of parameters on stability. The value obtained could be either positive or negative. A positive elasticity index ( I > 0 ) showed that an increase in the parameter led to a rise in α * . However, a negative elasticity index ( I < 0 ) showed that a decrease in the parameter led to a decrease in α * .

5.1. Elasticity Index for the Power Utility Function

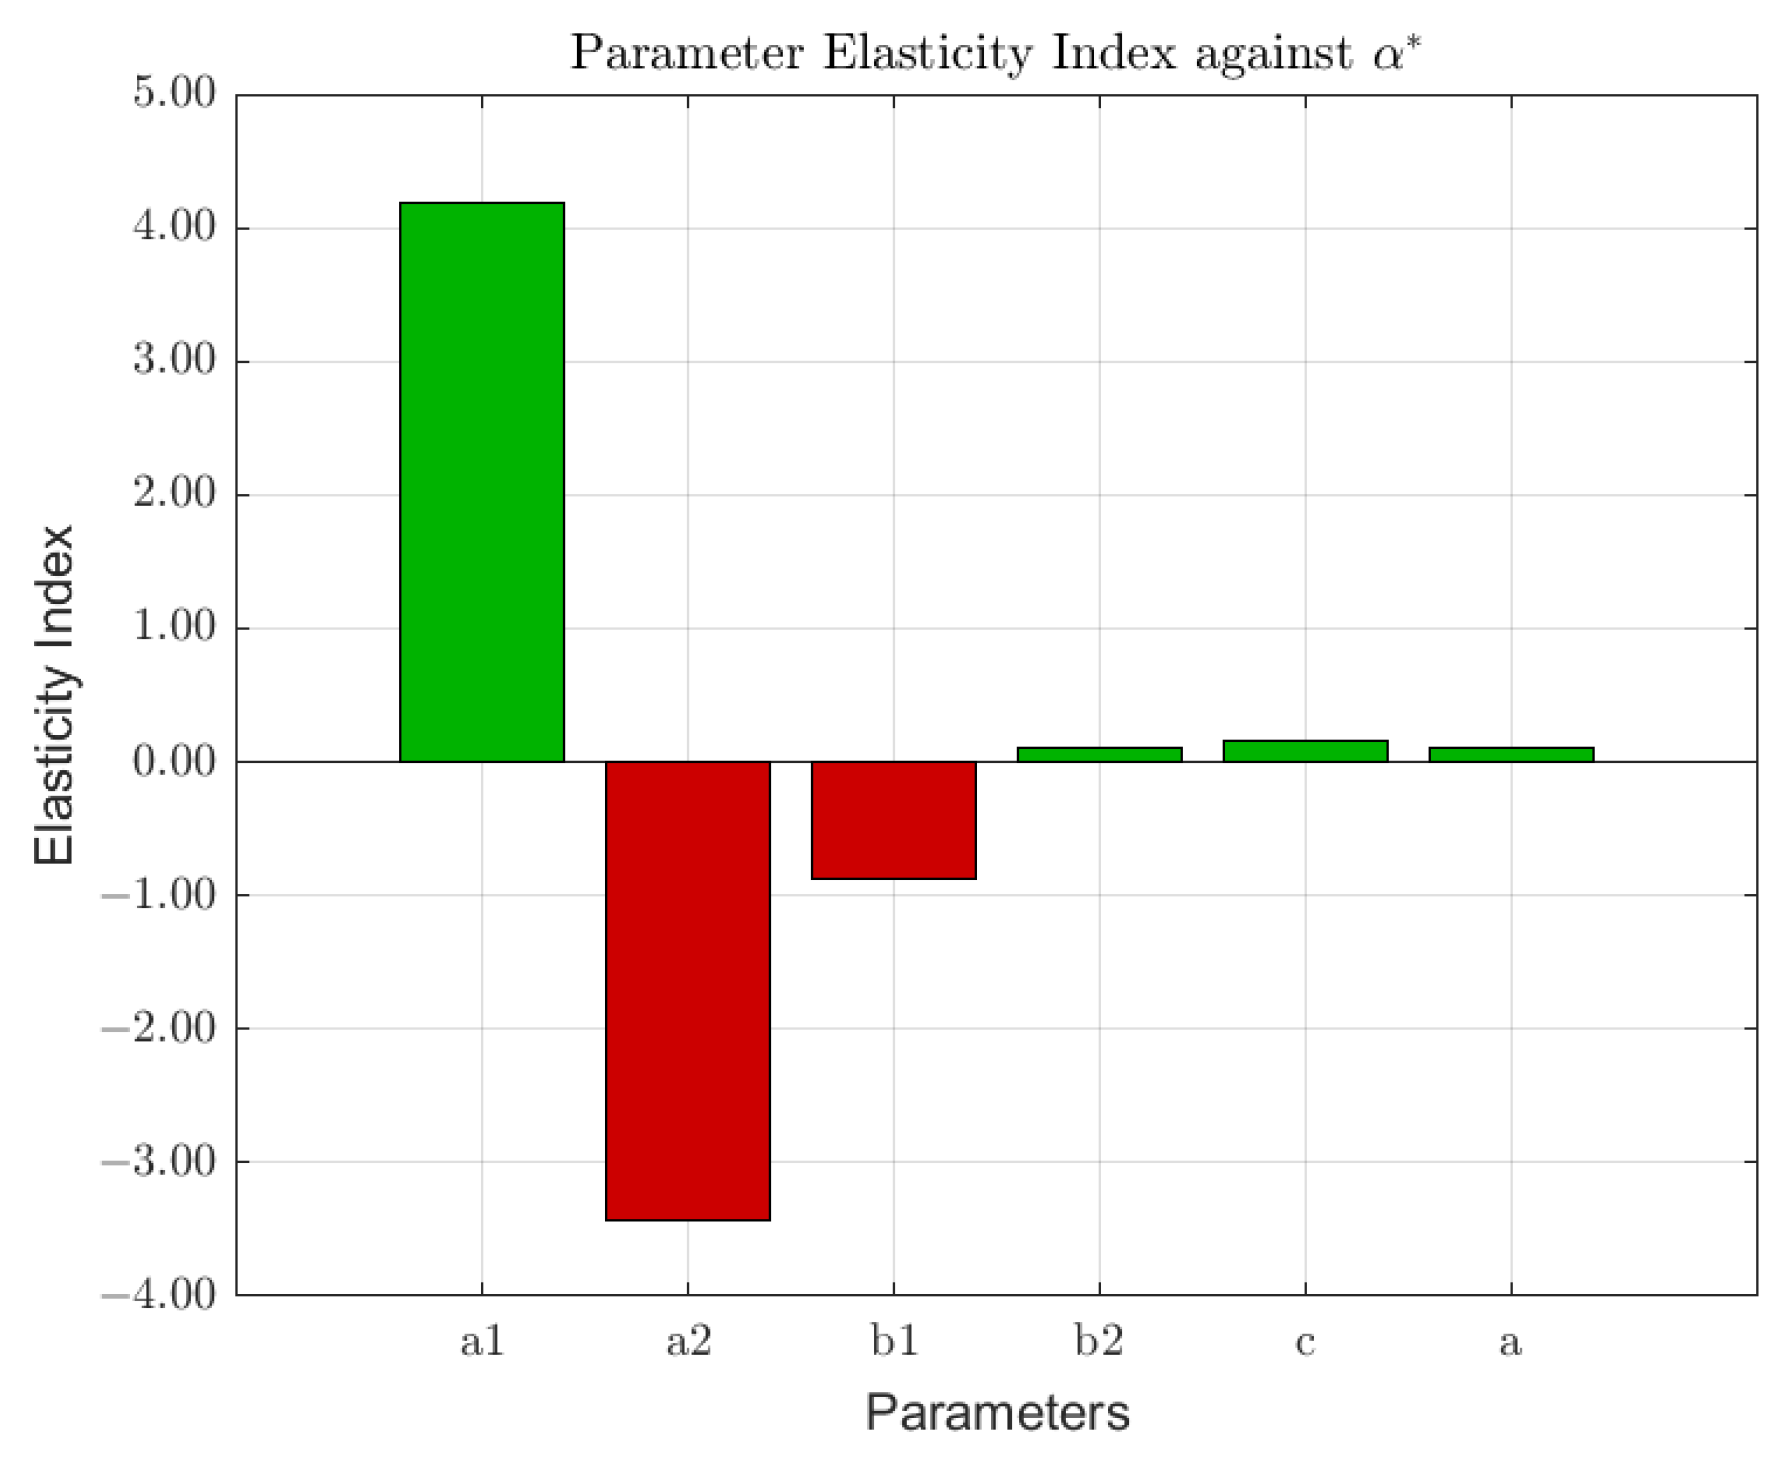
The sensitivity analysis focused on the power utility function, and, as established in the previous evaluation, the optimal value of α * corresponded to the second solution, as stated in Equation (16). Therefore, it was restricted to that case. The resulting elasticity index values are shown in Table 4.
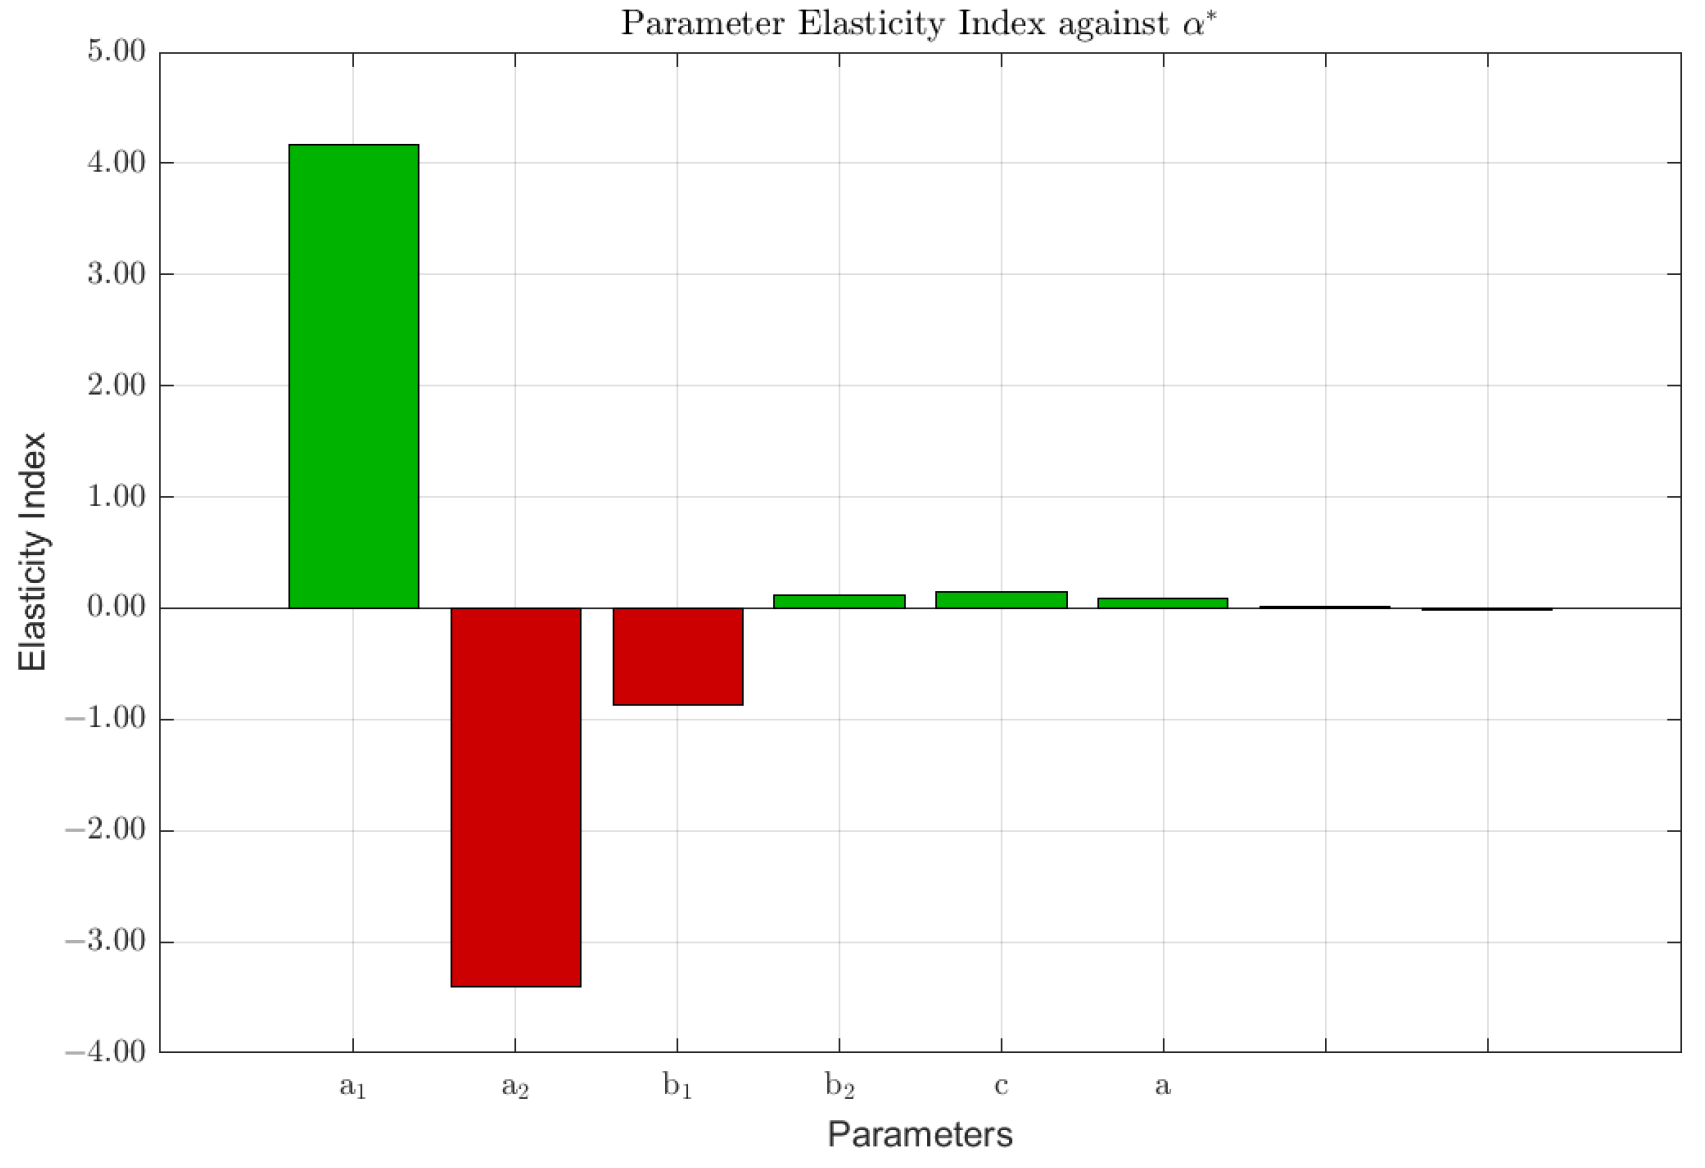
The bar chart in Figure 3 shows elasticity values, with the positive ones represented in green. This implies that an increase in the parameter leads to a rise in α * , while negative elasticity, depicted in red, implies the opposite effect.
Figure 3 shows that the parameter a 1 has the strongest positive effect on α * , depicting that an increase in a 1 significantly raises the optimal allocation. a 2 has the strongest negative effect, leading to a reduction in α * . b 1 influences α * to a lesser extent than a 2 . In this context, b 2 , c , and a show slight positive elasticities, depicting a minor but positive effect on α * .
In terms of elasticity, a 1% increase in a 1 results in an approximate 4.2% rise in α * , outlining its dominant role in the allocation decision. A 1% increase in a 2 leads to a 3.4% decrease in α * . The parameter b 1 also contributes negatively, where a 1% increase leads to a 0.87% reduction in α * . The parameters b 2 , c, and a exhibit relatively slight positive elasticities, with a 1% increase producing minor rises in α * of 0.11%, 0.17%, and 0.11%, respectively. These results show that the expected returns a 1 and a 2 have the most substantial influence on the optimal allocation decision.

5.2. Elasticity Index for Natural Logarithm Utility Function

A sensitivity analysis was performed on the natural logarithm function, which provided an optimal solution, as stated in Equation (17). The values of the elasticity index are shown in Table 5.
Figure 3 and Figure 4 have similar patterns, with the elasticity trends being consistent with the previous utility function. The parameter a 1 has the strongest positive effect, with an increase of 1% leading to a 4% rise in α * . The parameter a 2 has the most significant negative effect, where a 1% increase leads to a 3.3% decrease in α * . In addition, a 1% increase in b 1 leads to a 0.88% decrease in α * . b 2 and c continue to have a minor influence on α * , with a 1% rise in these parameters leading to minor increases of 0.14% and 0.15% in α * , respectively.

5.3. Elasticity Index for Linear Combination Utility Function

A sensitivity analysis for the linear combination utility function was performed focusing on the optimal solution derived in Equation (23). The values of the elasticity index are shown in Table 6.
The bar chart in Figure 5 visualizes the elasticity values, and the interpretation is similar to that of Figure 3. However, the inclusion of λ 1 and λ 2 represents the weights of utilities 1 (power utility) and 2 (natural logarithm utility) in the linear combination of both functions.
In terms of elasticity, a 1% increase in a 1 leads to a 4.2% rise in α * , depicting the strongest positive influence. Meanwhile, a 1% increase in a 2 leads to a 3.4% decrease in α * , representing the most significant negative effect. A similar but slightly negative impact was observed for b 1 , where a 1% increase reduces α * by 0.87%. The remaining parameters, b 2 , c , a , λ 1 , and λ 2 , have positive minor effects. In particular, the elasticity indices of λ 1 and λ 2 are close to zero, suggesting that changes in these utility weights have a negligible impact on α * . This shows that neither weight plays a significant role in influencing the optimal allocation decision.

6. Cross-Validation with Alternate Data

To assess the robustness and generalizability of the optimal portfolio allocations derived earlier, a cross-validation was performed using a different dataset for the combined utility functions. The simulation was repeated using stock return data from a different period and sector. This approach aimed to test whether the utility-based allocation model produces consistent results under varying market conditions.

6.1. Data and Parameter Estimation

The first step in the cross-validation required the adoption of stock return data from a different industry, in this case, the financial sector. The companies MSCI Inc. (MSCI, New York, NY, USA) and Willis Towers Watson Public Limited Company (WTW, London, UK) were selected to contradict the e-commerce stocks (CHWY and GOOG) used in the numerical analysis. Furthermore, daily closing prices from the same period, 1 October to 31 December 2024, were used for consistency, resulting in 63 trading days.
Using the same method, the expected returns of MSCI and WTW were calculated, and the values 0.000721 and 0.000729 were obtained, respectively. The corresponding return variances were 0.000151 and 0.000148 for MSCI and WTW. Additionally, the correlation coefficient between the two stock returns was 0.021895.
To verify the validity of the normality assumption, the Shapiro–Wilk test was applied to the daily return data. The resulting p-values were 0.469 and 0.777 for MSCI and WTW, respectively, with both values being greater than the 0.05 significance level, suggesting that the normality assumption holds for this dataset. Additionally, the rest of the parameters, such as the utility weights and investor risk preference, remained constant.

6.2. Results and Interpretation

In order to clearly prove how the choice of utility function and industry sector influence the optimal allocation, the results from both the original (e-commerce sector) and cross-validation datasets (finance sector) are shown in Table 7. This includes the optimal values of α * for each case, derived from both the linear and multiplicative combinations of the power and natural logarithm utility functions.
As shown in Table 7, the optimal allocation α * varies between both sectors and utility function types. The α * values obtained from the e-commerce stock pair (CHWY–GOOG) are generally higher than those from the finance sector pair (MSCI–WTW). This shows the differences in return characteristics between sectors, where e-commerce stocks are more volatile and growth-oriented and finance stocks are typically more stable. The investor had strong allocation preference towards e-commerce but more balanced allocation to the finance sector.
The difference proves that the combined utility functions are sensitive to the foundational characteristics of the assets, such as return volatility and correlation. When applied to different sectors, the utility functions failed to produce uniform allocation patterns but rather adapted based on the nature of the stock pair. Finally, the cross-validation confirmed that the optimal portfolio allocation is not solely determined by the form of the combined utility functions. The results showed that the characteristics of the sector also play a critical role in influencing the optimal allocation outcomes.

7. Discussion

This section provides an interpretive summary of the results, focusing on the behavioral and practical implications of using different utility functions, particularly in the context of high-volatility sectors such as e-commerce.

7.1. Contrasting Utility Function Approaches

In order to influence optimal portfolio decisions, three types of utility functions, namely, the power utility function, the natural logarithm utility function, and their combination, were compared. Each utility function reflected a different investor profile. For example, the power utility function represented risk-seeking behavior, which typically favors the stock with higher expected returns despite the significant risks. The natural logarithm utility function provided more conservative allocations, implying a risk-averse investor profile. The linear combination balanced these preferences, allowing flexibility depending on the market context. The multiplicative combination produced more polarized outcomes due to its compound nature, where one dominant factor could sensitively influence the result.

7.2. Managerial Implications for E-Commerce Investors

The differences in the utility function options possess significant implications for investors in volatile sectors such as e-commerce. Investors aiming to exploit high-growth opportunities might favor more aggressive utilities, including the power or multiplicative forms. Meanwhile, those searching for stability might prefer the natural logarithm or linear combination utilities to reduce risks by adjusting the utility weights. As shown in the cross-validation results, optimal allocations differ by utility preference and sectoral characteristics, showing that both behavioral and market-specific factors must be considered in portfolio decision-making.

7.3. Future Extensions

Since this research only focused on two assets, this approach could be extended to a multi-asset context to explore more realistic diversification opportunities. It is also possible to incorporate dynamic allocation strategies that are adjusted over time. Additionally, future research may consider alternative models, such as those based on fat-tailed distributions, to effectively capture the behavior of high-volatility assets and overcome the limitations associated with the normality assumption.

8. Conclusions

In conclusion, an analytical framework for optimal portfolio allocation was developed using three types of utility function, namely, the power utility function, the natural logarithm utility function, and their combination. By maximizing the expected end-of period wealth utility, several closed-form solutions that could help investors, particularly in the e-commerce sector, in terms of determining the optimal allocation weights that support their risk preferences and behavioral tendencies were derived.
The proposed framework captured a range of investor profiles, enabling portfolio construction based on utility preferences. Meanwhile, the power, logarithmic, and linear combination utilities produced explicit analytical solutions. The multiplicative form failed to admit a closed-form solution, requiring a numerical approach. In this case, the Newton–Raphson method was applied to obtain the optimal portfolio allocation.
Numerical simulations were performed to examine the sensitivity of the optimal allocation ( α * ) to the input parameters. The results showed that the expected return of stock 1 ( a 1 ) had the strongest positive influence on α * , increasing the allocation towards the first stock. However, the expected return of stock 2 ( a 2 ) had the strongest negative impact, reducing the allocation to stock 1. The variance of the return of stock 1 ( b 1 ) also decreased the allocation to a lesser extent than a 2 . Other parameters, such as the variance of the return of stock 2 ( b 2 ) , investor risk preference ( a ) , and the correlation between returns ( c ) , had minor positive effects. The utility weights λ 1 and λ 2 , while relevant to model behavior, were found to have the least influence on α * .
To assess the robustness of the model, cross-validation was performed using stock data from the financial sector. Despite differences in volatility and return characteristics compared to the e-commerce dataset, the model produced reasonable optimal allocations. This supports the generalizability of the proposed framework across different industries and market conditions.
Overall, the results show that utility-based portfolio optimization offers a flexible and analytically realistic approach to investment decision-making, particularly in volatile sectors such as e-commerce. The framework’s adaptability to various utility preferences and parameter changes provides a strong foundation for further research.
Author Contributions

Conceptualization, A.D. and M.F.A.; methodology, A.D. and M.F.A.; software, A.D.; validation, A.D. and M.F.A.; formal analysis, A.D.; investigation, A.D.; resources, A.D. and M.F.A.; data curation, A.D.; writing—original draft preparation, A.D.; writing—review and editing, A.D., M.F.A., S.H., and R.H.; visualization, A.D.; supervision, M.F.A., S.H., and R.H.; project administration, M.F.A.; funding acquisition, M.F.A. All authors have read and agreed to the published version of the manuscript.

Funding

This research was funded by Selain APBN Universitas Diponegoro through the High Reputable of International Publication (Riset Publikasi Internasional Bereputasi Tinggi—RPIBT) scheme 2025 with grant number 222-684/UN7.D2/PP/IV/2025.

Institutional Review Board Statement

Not applicable.

Informed Consent Statement

Not applicable.

Data Availability Statement

The data were obtained from Yahoo Finance. Data are available in a publicly accessible repository. The data presented in the study are openly available in ResearchGate at DOI http://dx.doi.org/10.13140/RG.2.2.17635.67362 (accessed on 25 June 2025).

Acknowledgments

We thank the anonymous referees for their valuable comments towards improving the quality of this paper.

Conflicts of Interest

The authors declare no conflicts of interest. The funders had no role in the design of the study; in the collection, analyses, or interpretation of data; in the writing of the manuscript; or in the decision to publish the results.

Appendix A

This appendix presents the complete derivation of Proposition 1, which states that the power utility function u ( x ) = x a , with x > 0 and 0 < a < 1 , satisfies the conditions of a valid utility function.
Proof. 
The first and second derivatives of the function u ( x ) = x a are u ( x ) = a x a 1 and u ( x ) = a ( a 1 ) x a 2 , respectively. For the function u ( x ) = x a to be non-decreasing, it must satisfy u ( x ) = a x a 1 0 . This condition is met when 0 < a < 1 , provided u ( x ) is defined for x > 0 . Furthermore, for u ( x ) = x a to be concave, it must satisfy u ( x ) = a ( a 1 ) x a 2 0 . This condition is also satisfied when 0 < a < 1 , with u ( x ) defined for x > 0 . Thus, the power function u ( x ) = x a , with x > 0 and 0 < a < 1 , qualifies as a utility function. □

Appendix B

This appendix presents the complete derivation of Proposition 2, which states that the natural logarithm utility function u ( x ) = ln x , with x > 0 , satisfies the conditions of a valid utility function.
Proof. 
The first and second derivatives of the function u ( x ) = ln x are u ( x ) = 1 x and u ( x ) = 1 x 2 , respectively. For the function u ( x ) = ln x to be non-decreasing, it must satisfy u ( x ) = 1 x 0 . This condition is met if u ( x ) is defined for x > 0 . Furthermore, for u ( x ) = ln x to be concave, it must satisfy u ( x ) = 1 x 2 0 . This condition is also satisfied if u ( x ) is defined for x > 0 . Thus, the natural logarithm function u ( x ) = ln x , with x > 0 , qualifies as a utility function. □

Appendix C

This appendix presents the complete derivation of Theorem 1.
Proof. 
Given the power utility function u ( x ) = x a with x > 0 and 0 < a < 1 , and since we aim to look for the optimal portfolio, then the maximization problem of the expected utility in Equation (10) needs to be solved. We know that
E [ R 1 ] = a 1 , V a r [ R 1 ] = b 1 , E [ R 2 ] = a 2 , V a r [ R 2 ] = b 2 , C o r r [ R 1 , R 2 ] = c
We first calculate the expectation and variance of end-of-period wealth as follows:
E [ W ] = w + i = 1 2 w i E [ R i ] = w ( a 1 a 2 ) α + ( 1 + a 2 )
and
V a r [ W ] = i = 1 2 w i 2 V a r [ R i ] + i = 1 2 j i w i w j C o v [ R i , R j ] = w 2 b 1 + b 2 2 c b 1 b 2 c α 2 + 2 c b 1 b 2 2 b 2 α + b 2
To simplify the writing and calculation, new parameters are defined as follows: Let γ = a 1 a 2 , δ = b 1 + b 2 2 c b 1 b 2 , ϵ = c b 1 b 1 b 2 , ζ = ( a 1 ) ( a 2 ) , and θ = 1 + a 2 . Then, we can rewrite Equation (A1) as E [ u ( W ) ] = w ( γ α + θ ) and Equation (A2) as V a r ( W ) = w 2 ( δ α 2 + 2 ϵ α + b 2 ) . Next, the optimal alpha value as the weight of the first investment will be examined as the optimal solution of Equation (10). We obtain the following:
E [ u ( W ) ] = w ( γ α + θ ) a + a ( a 1 ) 2 w ( γ α + θ ) a 2 w 2 ( δ α 2 + 2 ϵ α + b 2 )
Differentiating the previous equation and setting the result to zero yields the following:
γ 3 + ζ γ δ 2 + ( a 1 ) γ δ α 2 + 2 γ 2 θ + ζ γ ϵ + ( a 1 ) ( θ δ + γ ϵ ) α + γ θ 2 + b 2 ζ γ 2 + ( a 1 ) θ ϵ = 0
Solving Equation (A4) yields that the optimal value of α * is given by the following:
α * = ϵ γ + δ θ a ϵ γ a δ θ ϵ γ ζ 2 γ 2 θ + σ 1 2 γ 3 2 δ γ + 2 a δ γ + δ γ ζ
or
α * = ϵ γ + δ θ a ϵ γ a δ θ ϵ γ ζ 2 γ 2 θ σ 1 2 γ 3 2 δ γ + 2 a δ γ + δ γ ζ
with the parameters defined as
γ = a 1 a 2 , δ = b 1 + b 2 2 c b 1 b 2 , ϵ = c b 1 b 2 b 2 , ζ = ( a 1 ) ( a 2 ) , θ = 1 + a 2
σ 1 = ( a 2 δ 2 θ 2 2 a 2 δ ϵ γ θ + a 2 ϵ 2 γ 2 2 a b 2 δ γ 2 ζ 2 a δ 2 θ 2 + 4 a δ ϵ γ θ + 2 a ϵ 2 γ 2 ζ 2 a ϵ 2 γ 2 b 2 δ γ 2 ζ 2 + 2 b 2 δ γ 2 ζ 2 b 2 γ 4 ζ + δ 2 θ 2 2 δ ϵ γ θ 2 δ γ 2 θ 2 ζ + ϵ 2 γ 2 ζ 2 2 ϵ 2 γ 2 ζ + ϵ 2 γ 2 + 4 ϵ γ 3 θ ζ ) 1 / 2
The value of α * chosen is the value of alpha that lies within the interval 0 < α * < 1 . Thus, the optimal portfolio is obtained by allocating funds such that w 1 * = α * w to the first investment and w 2 * = ( 1 α * ) w to the second investment. □

Appendix D

This appendix presents the complete derivation of Theorem 2.
Proof. 
Given the natural logarithm utility function u ( x ) = ln x with x > 0 , we know that
E [ R 1 ] = a 1 , V a r [ R 1 ] = b 1 , E [ R 2 ] = a 2 , V a r [ R 2 ] = b 2 , C o r r [ R 1 , R 2 ] = c
The expected variance of the end-of-period wealth has been calculated in the previous proof, as shown in Equations (A1) and (A2). We obtain the expected utility as follows:
E [ u ( W ) ] = ln ( w ) + ( ( a 1 a 2 ) α + a 2 ) 1 2 [ b 1 + b 2 2 b 1 b 2 c α 2 + 2 c b 1 b 2 2 b 2 α + b 2 + ( a 1 a 2 ) 2 α 2 + 2 ( a 1 a 2 ) a 2 α + a 2 2 ]
Differentiating Equation (A5) yields the following:
d ( E [ u ( W ) ] ) d α = b 1 + b 2 2 c b 1 b 2 + ( a 1 a 2 ) 2 α + ( a 1 a 2 ) c b 1 b 2 + b 2 ( a 1 a 2 ) a 2
Setting this as equal to zero and solving yields that the optimal value of α * is given by the following:
α * = ( a 1 a 2 ) ( 1 a 2 ) c b 1 b 2 + b 2 b 1 + b 2 2 c b 1 b 2 + ( a 1 a 2 ) 2
The optimal α * is obtained as the proportion of funds to be allocated to the first investment or α 1 * = α * . This leads to α 2 * = 1 α * as the weight of the second investment. Therefore, the optimal portfolio is obtained by allocating funds such that w 1 * = α * w to the first investment and w 2 * = ( 1 α * ) w to the second investment. □

Appendix E

This appendix presents the complete derivation of Proposition 3, which states that the linear combination of the power and natural logarithm utility functions U ( x ) = λ 1 x a + λ 2 ln x with ( 1 ) 1 a λ 2 a λ 1 1 a x ( 1 ) 1 a λ 2 λ 1 a ( 1 a ) 1 a , where ( 1 ) 1 a R , a = 1 2 m for m N , and 0 λ 1 , λ 2 1 , satisfies the conditions of a valid utility function.
Proof. 
The first and second derivatives of U ( x ) = λ 1 x a + λ 2 ln x function are U ( x ) = a λ 1 x a 1 + λ 2 x and U ( x ) = λ 1 a ( a 1 ) x a 2 λ 2 x 2 . The function U ( x ) is non-decreasing because U ( x ) = a λ 1 x a 1 + λ 2 x 0 , which results in x ( 1 ) 1 a λ 2 a λ 1 1 a , which cannot be imaginary because for a = 1 2 m with m N , ( 1 ) 1 a > 0 , and for a = 1 2 m with m N , 1 a > 1 . Next, the function U ( x ) is concave because U ( x ) = λ 1 a ( a 1 ) x a 2 λ 2 x 2 0 , which results in x ( 1 ) 1 a λ 2 λ 1 a ( 1 a ) 1 a , which cannot be imaginary because, for a = 1 2 m with m N , ( 1 ) 1 a > 0 , and for a = 1 2 m with m N , 1 a > 1 . Thus, the linear combination of power and utility functions is a utility function. □

Appendix F

This appendix presents the complete derivation of Proposition 4, which states that the multiplication of power and natural logarithm utilities U ( x ) = x a ln x with e 1 a x e 1 2 a a ( a 1 ) and 0 < a < 1 , satisfies the conditions of a valid utility function.
Proof. 
The first and second derivatives of the multiplication of both power and natural logarithm utilities U ( x ) = x a ln x are U ( x ) = x a 1 ( a ln x + 1 ) and U ( x ) = x a 2 ( a ( a 1 ) ln x + 2 a 1 ) , respectively. The function U ( x ) = x a ln x is non-decreasing because U ( x ) = x a 1 ( a ln x + 1 ) 0 , which results in x e 1 a for 0 < a < 1 . Next, the function U ( x ) = x a ln x is concave because U ( x ) = x a 2 ( a ( a 1 ) ln x + 2 a 1 ) 0 , which results in x e 1 2 a a ( a 1 ) for 0 < a < 1 . Thus, the function U ( x ) = x a ln x with e 1 a x e 1 2 a a ( a 1 ) and 0 < a < 1 is a utility function. □

Appendix G

This appendix presents the complete derivation of Theorem 3.
Proof. 
Given the linear combination of the power and natural logarithm utility functions as shown in Proposition 3, we know that
E [ R 1 ] = a 1 , V a r [ R 1 ] = b 1 , E [ R 2 ] = a 2 , V a r [ R 2 ] = b 2 , C o r r [ R 1 , R 2 ] = c
The expected variance of the end-of-period wealth has been calculated in the previous proof, as shown in Equations (A1) and (A2). We obtain the expected utility as follows:
E [ U ( W ) ] = λ 1 w ( γ α + θ ) a + a ( a 1 ) 2 w ( γ α + θ ) a 2 w 2 ( δ α 2 + 2 ϵ α + b 2 ) + λ 2 [ ln ( w ) + 1 w w γ α + a 2 1 2 w 2 w 2 ( δ α 2 + 2 ϵ α + b 2 + w γ α + a 2 2 ) ]
Note that
E [ U ( W ) ] = λ 1 E [ U ( W ) ] + λ 2 E [ U ( W ) ] d [ E [ U ( W ) ] ] d α = λ 1 d [ E [ u 1 ( W ) ] ] d α + λ 2 d [ E [ u 2 ( W ) ] ] d α
We have derived the results for the power utility function and the natural logarithm function as shown in Equations (A4) and (A5). By substituting them into Equation (A8) and setting this equal to zero, we obtain the following:
λ 1 γ 3 + ζ γ ζ 2 + ( a 1 ) γ δ α 2 + [ λ 1 2 γ 2 θ + ζ γ ϵ + ( a 1 ) ( θ δ + γ ϵ ) + λ 2 δ + γ 2 ] α + λ 1 γ θ 2 + b 2 ζ γ 2 + ( a 1 ) θ ϵ + λ 2 ( γ ϵ γ a 2 ) = 0
Solving Equation (A9) yields the following:
α * = δ λ 1 θ + δ λ 2 + ϵ γ λ 1 2 γ 2 λ 1 θ γ 2 λ 2 a δ λ 1 θ a ϵ γ λ 1 δ ϵ γ λ 1 + σ 1 γ λ 1 2 a δ + δ ζ 2 δ + 2 γ 2
or
α * = δ λ 1 θ + δ λ 2 + ϵ γ λ 1 2 γ 2 λ 1 θ γ 2 λ 2 a δ λ 1 θ a ϵ γ λ 1 δ ϵ γ λ 1 σ 1 γ λ 1 2 a δ + δ ζ 2 δ + 2 γ 2
with the parameters defined as
γ = a 1 a 2 , δ = b 1 + b 2 2 c b 1 b 2 , ϵ = c b 1 b 2 b 2 , ζ = ( a 1 ) ( a 2 ) , θ = 1 + a 2 , and
σ 1 = ( a 2 δ 2 λ 1 2 θ 2 2 a 2 δ ϵ γ λ 1 2 θ + a 2 ϵ 2 γ 2 λ 1 2 + 4 a a 2 δ γ 2 λ 1 λ 2 2 a b 2 δ 2 γ 2 λ 1 2 + 2 a δ 2 ϵ γ λ 1 2 θ 2 a δ 2 λ 1 2 θ 2 2 a δ 2 λ 1 λ 2 θ + 2 a δ ϵ 2 γ 2 λ 1 2 2 a δ ϵ γ λ 1 2 θ ζ + 4 a δ ϵ γ λ 1 2 θ + 2 a δ ϵ γ λ 1 λ 2 + 2 a δ γ 2 λ 1 λ 2 θ 4 a δ γ 2 λ 1 λ 2 2 a ϵ 2 γ 2 λ 1 2 + 2 a ϵ γ 3 λ 1 λ 2 + 2 a 2 δ γ 2 λ 1 λ 2 ζ 4 a 2 δ γ 2 λ 1 λ 2 + 4 a 2 γ 4 λ 1 λ 2 b 2 δ 2 γ 2 λ 1 2 ζ + 2 b 2 δ 2 γ 2 λ 1 2 2 b 2 δ γ 4 λ 1 2 + δ 2 ϵ 2 γ 2 λ 1 2 2 δ 2 ϵ γ λ 1 2 θ 2 δ 2 ϵ γ λ 1 λ 2 + δ 2 λ 1 2 θ 2 + 2 δ 2 λ 1 λ 2 θ + δ 2 λ 2 2 2 δ ϵ 2 γ 2 λ 1 2 + 4 δ ϵ γ 3 λ 1 2 θ + 2 δ ϵ γ 3 λ 1 λ 2 + 2 δ ϵ γ λ 1 2 θ ζ 2 δ ϵ γ λ 1 2 θ + 2 δ ϵ γ λ 1 λ 2 ζ 2 δ ϵ γ λ 1 λ 2 2 δ γ 2 λ 1 2 θ 2 ζ 6 δ γ 2 λ 1 λ 2 θ 2 δ γ 2 λ 2 2 + ϵ 2 γ 2 λ 1 2 + 2 ϵ γ 3 λ 1 λ 2 + 4 γ 4 λ 1 λ 2 θ 4 γ 4 λ 1 λ 2 + γ 4 λ 2 2 ) 1 / 2
The value of α * chosen is the value of alpha that lies within the interval 0 < α * < 1 . Thus, the optimal portfolio is obtained by allocating funds such that w 1 * = α * w to the first investment and w 2 * = ( 1 α * ) w to the second investment. □

Appendix H

This appendix presents the result of a 3D plot simulation of the power utility function.
Figure A1. Simulation plots showing the effect of parameters a 1 , a 2 , b 1 , b 2 , a , c on the optimal alpha value ( α * ) for the power utility function. Each subfigure (ao) represents a different parameter pair combination and its influence on optimal portfolio allocation.
Ijfs 13 00127 g0a1aIjfs 13 00127 g0a1b

Appendix I

This appendix presents the result of a 3D plot simulation of the natural logarithm utility function.
Figure A2. Simulation plots showing the effect of parameters a 1 , a 2 , b 1 , b 2 , c on the optimal alpha value ( α * ) for the natural logarithm utility function. Each subfigure (ai) represents a different parameter pair combination and its influence on optimal portfolio allocation.
Ijfs 13 00127 g0a2aIjfs 13 00127 g0a2b

Appendix J

This appendix presents the result of a 3D plot simulation of the linear combination of the power and natural logarithm utility functions.
Figure A3. Simulation plots showing the effect of parameters a 1 , a 2 , b 1 , b 2 , a , c , λ 1 , λ 2 on the optimal alpha value ( α * ) for the linear combination of utility function. Each subfigure (az,aa) represents a different parameter pair combination and its influence on optimal portfolio allocation.
Ijfs 13 00127 g0a3aIjfs 13 00127 g0a3bIjfs 13 00127 g0a3c

References

  1. Babayev, A. (2024). Supply chain resilience for e-commerce: Strategies for managing uncertainty and ensuring continuity. British Journal of Management and Marketing Studies, 4, 121–125. [Google Scholar] [CrossRef]
  2. Bodnar, T., Ivasiuk, D., Parolya, N., & Schmid, W. (2020). Mean-variance efficiency of optimal power and logarithmic utility portfolios. Mathematics and Financial Economics, 14, 675–698. [Google Scholar] [CrossRef]
  3. Bodnar, T., Ivasiuk, D., Parolya, N., & Schmid, W. (2023). Multi-period power utility optimization under stock return predictability. Computational Management Science, 20, 4. [Google Scholar] [CrossRef]
  4. Bodnar, T., Okhrin, Y., Vitlinskyy, V., & Zabolotskyy, T. (2018). Determination and estimation of risk aversion coefficients. Computational Management Science, 15, 297–317. [Google Scholar] [CrossRef]
  5. Brandt, M., Goyal, A., Santa-Clara, P., & Stroud, J. (2005). A simulation approach to dynamic portfolio choice with an application to learning about return predictability. Review of Financial Studies, 18, 831–873. [Google Scholar] [CrossRef]
  6. Burnham, B. (1999). How to invest in e-commerce stocks. McGraw-Hill. [Google Scholar]
  7. Cremers, J., Kritzman, M., & Page, S. (2004). Optimal hedge fund allocations: Do higher moments matter? SSRN Electronic Journal, 31. [Google Scholar] [CrossRef]
  8. Dharshan, R. (2024). Optimizing portfolio construction using nifty India manufacturing index: A risk-return analysis with Python. Indian Scientific Journal of Research in Engineering and Management, 8, 1–5. [Google Scholar]
  9. Dichev, I., & Zheng, X. (2022). The volatility of stock investor returns. Journal of Financial Markets, 70, 100927. [Google Scholar] [CrossRef]
  10. Fabozzi, F., & Pachamanova, D. (2016). Portfolio construction and analytics. John Wiley & Sons, Ltd. [Google Scholar]
  11. Fahrenwaldt, M., & Sun, C. (2020). Expected utility approximation and portfolio optimisation. Insurance Mathematics & Economics, 93, 301–314. [Google Scholar] [CrossRef]
  12. Goli, A. (2024). Optimization of renewable energy project portfolio selection using hybrid AIS-AFS algorithm in an international case study. Scientific Reports, 14, 17388. [Google Scholar] [CrossRef]
  13. Gopal, N., Mahalakshmi, S., & Thiyagarajan, S. (2019). The consequence of volatility index on stock market returns. Journal of Stock & Forex Trading, 7, 1–2. [Google Scholar]
  14. Hanoch, G., & Levy, H. (1970). Efficient portfolio selection with quadratic and cubic utility. The Journal of Business, 43, 181–189. [Google Scholar] [CrossRef]
  15. Jacob, B., & Levy, K. (2024). Portfolio insurance, portfolio theory, market simulation, and risks of portfolio leverage. Annals of Operations Research, 346, 67–97. [Google Scholar] [CrossRef]
  16. Jean, W. (1971). The extension of portfolio analysis to three or more parameters. Journal of Financial and Quantitative Analysis, 6, 505–515. [Google Scholar] [CrossRef]
  17. Khan, M., Fifield, S., & Power, D. (2024). The impact of the COVID-19 pandemic on stock market volatility: Evidence from a selection of developed and emerging stock markets. SN Business & Economics, 4, 63. [Google Scholar] [CrossRef]
  18. Levy, H., & Markowitz, H. (1979). Approximating expected utility by a function of mean and variance. The American Economic Review, 69, 308–317. [Google Scholar]
  19. Lin, G. (2024). Adaptive risk parity strategies for managing portfolio risk in volatile markets. Mathematical Modeling and Alogorithm Application, 3, 1–8. [Google Scholar] [CrossRef]
  20. Lunxemberg, E., & Boyd, S. (2023). Portfolio construction with Gaussian mixture returns and exponential utility via convex optimization. Optimization and Engineering, 25, 555–574. [Google Scholar] [CrossRef]
  21. Manjunath, M., Kyal, R., Chinnaswamy, G., & Selvaraj, V. (2023). Strategies for creating value: Portfolio optimization in the Indian automotive sector. International Journal for Science Technology and Engineering, 11, 1699–1703. [Google Scholar] [CrossRef]
  22. Markowitz, H. (1952). Portfolio selection. Journal of Finance, 7, 77–91. [Google Scholar] [CrossRef]
  23. Munari, C. (2021). Multi-utility representations of incomplete preferences induced by set-valued risk measures. Finance and Stochastics, 25, 77–99. [Google Scholar] [CrossRef]
  24. Pandiangan, N., Sukono, S., & Hasbullah, E. (2021). Quadratic investment portfolio based on value-at-risk with risk-free assets: For stocks of the mining and energy sector. International Journal of Energy Economics and Policy, 11, 175–184. [Google Scholar] [CrossRef]
  25. Pennacchi, G. (2008). Theory of asset pricing. Pearson/Addison-Wesley Boston. [Google Scholar]
  26. Phelps, C. (2024). A user’s guide to economic utility functions. Journal of Risk and Uncertainty, 69, 235–280. [Google Scholar] [CrossRef]
  27. Ross, S. (2011). An elementary introduction to mathematical finance. Cambridge University Press. [Google Scholar]
  28. Sarantsev, A. (2021). Optimal portfolio with power utility of absolute and relative wealth. Statistics & Probability Letters, 179, 109–225. [Google Scholar] [CrossRef]
  29. SellersCommerce. (2025). Ecommerce statistics: Trends and insights. SellersCommerce Blog. Available online: https://www.sellerscommerce.com/blog/ecommerce-statistics/ (accessed on 18 January 2025).
  30. Tan, Y. (2024). Financing risks and preventive measures for e-commerce corporates. Highlights in Business, Economics and Management, 40, 759–763. [Google Scholar] [CrossRef]
  31. Touni, Z., Makui, A., & Mohammadi, E. (2020). A more human-like portfolio optimization approach: Using utility function to find an individualized portfolio. Advances in Industrial Engineering, 54, 293–310. [Google Scholar] [CrossRef]
  32. Wakker, P., & Yang, J. (2021). Concave/convex weighting and utility functions for risk: A new light on classical theorems. Insurance: Mathematics & Economics, 100, 429–435. [Google Scholar] [CrossRef]
  33. Xidonas, P., Mavrotas, G., & Psarras, J. (2010). A multiple criteria decision-making approach for the selection of stocks. The Journal of the Operational Research Society, 61, 1273–1287. [Google Scholar] [CrossRef]
  34. Yang, Y. (2024). Stock market volatility during and after the COVID-19 pandemic: Academic perspectives. Springer Nature. [Google Scholar] [CrossRef]
  35. Yu, B., Pang, W., Troutt, M., & Hou, S. (2009). Objective comparisons of the optimal portfolios corresponding to different utility functions. European Journal of Operational Research, 199, 604–610. [Google Scholar] [CrossRef]
  36. Zhang, H. (2024). Analyzing Amazon stock volatility: Market returns and macroeconomic factors. Advances in Economics, Management and Political Sciences, 112, 120–125. [Google Scholar] [CrossRef]
  37. Zhang, Q. (2023). The impact of COVID-19 pandemic on stock markets. Highlights in Business, Economics and Management, 22, 132–139. [Google Scholar] [CrossRef]
  38. Zou, Z. (2024). Optimal portfolio strategies in Chinese equity market. Highlights in Business, Economics and Management, 40, 840–845. [Google Scholar] [CrossRef]
Figure 1. Return values of CHWY and GOOG stocks.
Ijfs 13 00127 g001
Figure 2. Normal Q−Q plots of daily returns of (a) CHWY and (b) GOOG.
Ijfs 13 00127 g002
Figure 3. Bar chart of the elasticity index for the power utility function. Green bars indicate positive elasticity, while red bars represent negative elasticity.
Ijfs 13 00127 g003
Figure 4. Bar chart of the elasticity index for the natural logarithm utility function. Green bars indicate positive elasticity, while red bars represent negative elasticity.
Ijfs 13 00127 g004
Figure 5. Bar chart of the elasticity index for the linear combination utility function. Green bars indicate positive elasticity, while red bars represent negative elasticity.
Ijfs 13 00127 g005
Table 1. Results of normality tests on stock returns.
StockShapiro–Wilk Test Anderson–Darling Test
Statisticp-Value Statisticp-Value
CHWY0.9750.229 0.5870.121
GOOG0.9640.060 0.6840.071
Table 2. Parameter values.
DescriptionParameterValue
Expected return of stock 1 a 1 0.00281
Expected return of stock 2 a 2 0.00230
Variance of stock 1’s return b 1 0.00078
Variance of stock 2’s return b 2 0.00033
Correlation between 2 returnsc0.28445
Investor’s risk preferencea0.125
Power utility weight λ 1 0.8
Natural logarithm utility weight λ 2 0.2
Table 3. Convergence of Newton–Raphson method for optimal α * .
Iteration α n * f ( α n * )
10.8689660.000295
20.868965−0.000000
30.8689650.000000
Table 4. Elasticity index for the power utility function.
ParameterI Value
a 1 4.19018
a 2 −3.42455
b 1 −0.86862
b 2 0.10555
c0.16565
a0.10898
Table 5. EI for the natural logarithm utility function.
ParameterI Value
a 1 4.04186
a 2 −3.30332
b 1 −0.87773
b 2 0.140563
c0.145657
Table 6. EI for the linear combination utility function.
ParameterI Value
a 1 4.16095
a 2 −3.40131
b 1 −0.87086
b 2 0.11302
c0.14565
a0.08422
λ 1 0.01744
λ 2 −0.01745
Table 7. Cross-validation of optimal portfolio allocation.
SectorStock PairUtility Function α *
E-commerceCHWY–GOOGLinear Combination0.925
E-commerceCHWY–GOOGMultiplicative Combination0.869
FinanceMSCI–WTWLinear Combination0.536
FinanceMSCI–WTWMultiplicative Combination0.478
Disclaimer/Publisher’s Note: The statements, opinions and data contained in all publications are solely those of the individual author(s) and contributor(s) and not of MDPI and/or the editor(s). MDPI and/or the editor(s) disclaim responsibility for any injury to people or property resulting from any ideas, methods, instructions or products referred to in the content.