1. Introduction
Derivative financial instruments are increasingly being used by firms to manage the financial risks associated with foreign exchange movements, interest rate fluctuations, and commodity price volatility. Although these instruments are designed to reduce earnings variability and improve financial stability (
Bartram et al., 2011;
Smith & Stulz, 1985), they are also characterized by substantial complexity and opacity, particularly in emerging markets, where disclosure regulations are still developing. Derivatives often require managerial judgment in recognition, measurement, and reporting, which increases the potential for discretionary behavior and information asymmetry (
Peterson, 2008;
Kilic et al., 2013). The 2008 CITIC Pacific case vividly illustrates the downside of derivative opacity. The firm incurred losses of approximately HKD 18.6 billion due to speculative positions in foreign exchange derivatives yet offered little preemptive disclosure in its financial reports. This event heightened concerns that derivative use, especially when complex or poorly disclosed, may obscure firm-level risks and lead to large, abrupt market corrections.
Recent studies have advanced our understanding of the stock price crash risk by linking it to litigation exposure (
Cheng et al., 2025), economic policy uncertainty (
Du et al., 2023), hedge accounting quality (
Jiang et al., 2025), and disclosure comparability (
K. Yang et al., 2023). Within the derivative literature, however, most empirical works continue to adopt a binary framework—classifying firms simply as users or non-users (e.g.,
Guay & Kothari, 2003;
Allayannis & Weston, 2001)—without accounting for the scale, diversity, or structural complexity of derivative positions. Such simplifications fail to reflect the economic intensity and disclosure quality of derivative usage, limiting our understanding of how complexity interacts with governance environments and affects investors’ risk perception, especially in emerging markets with uneven enforcement. To address these limitations, this study develops a multidimensional framework that captures derivative complexity in both economic and accounting terms. Specifically, we construct five firm-year indicators to measure economic complexity and accounting complexity. These measures allow us to move beyond binary classifications and to examine how variations in the structure and disclosure of derivative usage relates to stock price crash risk. By embedding these dimensions within the context of China’s evolving regulatory environment and heterogeneous institutional quality, we provide a richer, more granular empirical assessment than prior studies.
The theoretical literature presents two contrasting perspectives on the consequences of derivative complexity. According to the transparency hypothesis, derivatives—when clearly disclosed—can signal active risk management and reduce the information asymmetry between managers and external investors (
Guay & Kothari, 2003;
Allayannis & Weston, 2001). In contrast, the opacity hypothesis argues that complexity may obscure true firm performance and facilitate the concealment of bad news, thereby heightening the crash risk (
Jin & Myers, 2006;
Chang et al., 2016). Prior studies have shown that analysts often struggle to interpret derivative disclosures and that forecast accuracy deteriorates as complexity increases (
Campbell et al., 2023). When financial reporting is ambiguous or dispersed, investors may misprice firm-specific risks, contributing to sudden market corrections (
Ertugrul et al., 2017;
Steffen, 2022). Recent work further suggests that regulatory enforcement can moderate these risks. For instance,
Bhattacharya et al. (
2023) find that firms facing sanctions for derivative-disclosure violations subsequently improve their transparency and reduce their perceived market risk.
Despite these developments, the literature still lacks an integrated approach that captures the multifaceted nature of derivative usage, particularly in non-U.S. settings. Existing studies rarely consider how complexity may serve as either a risk amplifier or a risk mitigator depending on firm-specific factors. Our study addresses this gap by testing whether the effects of complexity vary by internal governance strength, ownership structure, and external transparency, thereby reframing the transparency–opacity debate as a question of conditional informativeness rather than inherent risk.
This paper examines whether and how derivative complexity affects the stock price crash risk in the context of Chinese A-share-listed firms. Drawing on a hand-collected dataset of annual reports from 2010 to 2023, we develop two distinct measures of complexity: economic complexity, which reflects the diversity and size of derivative positions; and accounting complexity, which captures the reporting dispersion and fair-value hierarchy of derivative-related disclosures. The full sample period enables a comprehensive view of how derivative practices have evolved over time. Moreover, in 2017, China revised its Accounting Standard for Business Enterprises No. 22, which introduced substantial changes in the classification, measurement, and disclosure of derivatives. While our baseline analysis uses the full sample, we conduct robustness tests on pre- and post-reform subperiods, respectively, to examine whether our findings are sensitive to changes in reporting practices.
Our findings indicate that firms engaging in derivative use are significantly less likely to experience stock price crashes than non-users, consistent with the view that derivatives serve both risk management and an informative functions. More importantly, this negative association strengthens with increases in both economic and accounting complexity. Firms that use a wider range of derivative instruments or hold larger derivative positions are less prone to crash risk. Similarly, firms that disclose derivative information across multiple financial statement locations or that report fair-value hierarchy levels exhibit reduced downside risk. We further find that the crash-mitigating effect of economic complexity is amplified when accompanied by more detailed and dispersed accounting disclosures. That is, the interaction between economic and accounting complexity plays a critical role in shaping investor interpretation. These effects are especially pronounced among non-state-owned enterprises, firms with weaker internal-control systems, and those operating in more transparent information environments. The results remain robust to alternative empirical strategies, including propensity-score matching and treatment-effects models. Overall, our findings support the conditional informativeness view: derivative complexity enhances, rather than impairs, the informativeness of financial reports when supported by adequate disclosure quality.
This study contributes to the literature in several important ways. First, we introduce a multidimensional framework to measure derivative complexity, incorporating both economic and accounting dimensions. This approach allows for a more granular assessment than prior studies that rely on binary indicators of usage (e.g.,
Guay & Kothari, 2003;
Allayannis & Weston, 2001). Second, we extend the literature on stock price crash risk by identifying derivative complexity and disclosure quality as key determinants of firm-specific downside risk, particularly in emerging markets, where institutional enforcement and reporting standards are still evolving (
Kim et al., 2011;
Andreou et al., 2016). Third, and most importantly, we examine not only the separate effects of economic and accounting complexity but also their interactive influence. By doing so, we show that the informativeness of derivative use depends critically on how such activities are communicated, and that complexity is not inherently detrimental but conditional upon the broader disclosure environment. This joint perspective refines existing theories of opacity and information asymmetry and underscores the importance of coordinated financial reporting practices.
Beyond its theoretical contributions, this research offers practical implications for market participants and policymakers. For investors, the results suggest that derivative complexity should not automatically be interpreted as a signal of risk manipulation. When derivative use is accompanied by detailed and consistent disclosure, it may reflect superior financial sophistication and managerial intent to hedge risk. For corporate managers, the findings highlight the importance of not only engaging in prudent derivative use but also enhancing the clarity and breadth of related disclosures. For regulators, the evidence points to the limitations of blanket restrictions on derivative instruments. Instead, policy efforts should focus on improving disclosure frameworks, particularly in emerging markets, where derivative use is rising but the reporting quality remains inconsistent. Clear guidelines on the classification of derivative positions, the mandatory disclosure of fair-value hierarchy levels, and the purpose of derivative use would improve market transparency and reduce the likelihood of sudden repricing due to misinterpreted risk. As China continues to deepen its capital market reforms, aligning financial innovation with robust disclosure standards will be critical to ensuring investor protection and market stability.
2. Literature Review
The use of derivative financial instruments has long been associated with firms’ efforts to manage their exposure to financial risks, enhance the quality of financial reporting, and improve the transparency of firm operations. Early studies suggest that derivatives—when used for hedging purposes and accompanied by adequate disclosure—can reduce the information asymmetry between managers and external investors (
Guay & Kothari, 2003;
Allayannis & Weston, 2001;
Cheng et al., 2025). This view, known as the transparency hypothesis, posits that derivative usage sends credible signals of risk management intent and leads to improved market confidence and valuation.
However, contrasting views highlight the opacity hypothesis, which argues that derivatives, especially when complex or poorly disclosed, offer managerial discretion that can be exploited to conceal adverse news, manipulate earnings, or delay the recognition of bad outcomes (
Jin & Myers, 2006;
Chang et al., 2016). In such cases, rather than reducing risk, derivative complexity may exacerbate it by allowing bad news to accumulate and, ultimately, contribute to stock price crashes (
Park & Park, 2020).
Su et al. (
2022) found that the economic complexity and accounting complexity of financial derivatives increase stock price synchronization (SPS), which increases the risk of a stock price collapse.
Campbell et al. (
2023) provide recent evidence that while derivative usage increases the frequency of management forecasts, the informativeness of these forecasts declines with disclosure complexity, suggesting limits to the investor processing capacity.
Empirical findings on this issue remain mixed. On one hand, several recent studies support the risk-reducing role of derivatives.
Zhang (
2009),
Park and Park (
2020), and
Jiang et al. (
2025) find that hedge accounting increases earnings informativeness, while
Bhattacharya et al. (
2023) show that the regulatory enforcement of disclosure rules significantly improves transparency and reduces the perceived firm-level risk. At the same time, standard-setting bodies and regulators have improved the readability of financial reports through the revision of existing auditing standards and enhanced auditing controls, reducing the risk of stock price crashes associated with opaque information and the complexity of derivatives (
Yin et al., 2022). In the Chinese context,
A. Yang et al. (
2023) document that derivative usage enhances a firm’s value, especially when management characteristics—such as tenure and equity incentives—align managerial incentives with shareholders.
K. Yang et al. (
2023) show that increasing the level of comparability of accounting information on derivatives can maintain market stability and enhance investor confidence, thereby reducing the risk of future stock price crashes in China. Similarly, in a multi-country setting,
Kim et al. (
2022) find that derivative use is associated with lower stock price crash risk, particularly in environments with weaker regulatory institutions.
On the other hand, investors often face challenges in interpreting derivative-related disclosures.
Chang et al. (
2016) show that increased complexity reduces analyst forecast accuracy. In emerging markets like China,
F. Guo (
2012) and
Huang and Wang (
2016) observe that derivative disclosures lack standardization, with fragmented information scattered across footnotes, financial statements, and MD&A sections, while derivative disclosures also suffer from accounting update guidelines not being applied consistently (
Troyer et al., 2023).
Monteiro and Santos (
2020) suggest that derivative valuation remains difficult in practice, and improving models such as risk-neutral density estimation may help investors to interpret embedded exposures more accurately. Previous work by
Chung et al. (
2012) reinforces this concern by showing that poor disclosure quality in emerging markets diminishes the informative value of derivative use and may contribute to greater risk mispricing. In addition, economic policy uncertainty, international tensions, and increased deterioration of the economic situation could also hamper disclosure and lead to the risk of future stock price crashes (
Garškaitė-Milvydienė, 2021;
Du et al., 2023).
A number of contextual factors influence the informativeness and consequences of derivative usage.
B. Q. Guo (
2022) shows that firms with stronger internal controls are more likely to voluntarily disclose derivative activity.
Makrychoriti and Pyrgiotakis’s (
2024) study shows that stronger internal and external corporate governance mechanisms moderate the positive correlation between political risk and a stock price plunge, while
Chang et al. (
2016) find that the risk-mitigating effect of derivative use is stronger in firms with greater analyst coverage.
Kim et al. (
2022) further show that the negative association between derivative use and stock price crash risk is more pronounced among firms with weaker information environments, suggesting that derivatives are particularly effective in mitigating crash risk when opacity is high and managerial incentives for bad news hoarding are stronger. Similarly, corporate strategy is the main way of moderating the relationship between derivative use and crash risk, with a more aggressive corporate strategy being more likely to increase the risk of a stock price crash (
Zhao et al., 2024). These studies suggest that derivative effectiveness is not uniform but conditional on firm-level governance and the broader information environment.
Despite these insights, important gaps remain. Many studies rely on binary indicators of derivative usage without capturing differences in the economic complexity (e.g., number and type of contracts) or accounting complexity (e.g., location and granularity of disclosure). Binary classifications, while convenient, overlook meaningful variations in the scale, structure, and disclosure quality of derivative use. This may introduce measurement errors or omitted-variable bias, particularly in emerging markets, where the firm behavior is heterogeneous and regulatory enforcement is uneven. Moreover, such simplifications prevent the analysis of more nuanced hypotheses—for example, whether the informativeness of derivatives depends on how well they are disclosed.
To address these limitations, several recent studies have explored alternative measurement strategies.
Fengler and Phan (
2025) apply topic modeling to extract textual complexity signals from U.S. 10-K filings, while
Agapova et al. (
2025) use deep learning-based embeddings to quantify the narrative disclosure opacity. These approaches allow for the scalable processing of unstructured data and have proven useful in identifying latent features that influence investor behavior. However, their application remains limited in the context of Chinese derivative disclosures. First, derivative information in Chinese annual reports tends to be highly unstandardized and is often fragmented across tables and narrative sections, making automated parsing inconsistent without human verification. Second, machine learning models prioritize prediction over interpretation, which can compromise theoretical validity. Third, training such models requires labeled datasets that are unavailable for derivative-specific content in China. Therefore, our study adopts a hand-collected, structure-based approach that captures both the economic and reporting complexity of derivative strategies with greater transparency and construct validity.
Another shortcoming of the existing literature is the relative lack of institutional framing, especially for studies focused on emerging markets. Most of the empirical works examine U.S. or European settings, where derivatives are used under well-defined regulatory regimes and investor sophistication is high. In contrast, Chinese firms operate in a more dynamic institutional environment, with weaker investor protection and more varied disclosure practices. Recent China-specific studies, such as that by
Lu et al. (
2023), highlight how regulatory enforcement shapes financial reporting credibility and market responses to disclosure. These studies emphasize the importance of context-aware measurement tools that account for local reporting constraints. Importantly, China’s 2017 revision of
Accounting Standard for Business Enterprises No. 22 brought significant changes in the classification and fair-value reporting of derivatives, aligning local practices with IFRS 9. However, few studies have examined whether derivative complexity—either in usage or in reporting—interacts with such institutional changes to influence crash risk.
Taken together, prior research studies have identified the relevance of derivative use but have yet to systematically explore how complexity in both the economic structure and disclosure format jointly influence investor behavior. This study addresses these limitations by developing five structured indicators of derivative complexity and examining their separate and interactive effects on the stock price crash risk in China. In doing so, we contribute to a growing body of literature that emphasizes the conditional informativeness of financial disclosures and the role of transparency in mitigating extreme downside risk.
3. Hypotheses Development
3.1. Derivative Economic Complexity and the Stock Price Crash Risk
From an agency perspective, derivative use creates a tension between transparency and opacity. On the one hand, derivatives can be employed for legitimate risk management purposes, reducing cash-flow volatility and signaling financial discipline. On the other hand, economically complex strategies—such as expanding the range or scale of derivative instruments—may obscure firm-level risks and provide cover for opportunistic behavior.
This ambiguity is particularly relevant in emerging markets, where investor protections are weaker and institutional enforcement is less robust. Under such conditions, greater economic complexity in derivative use may either be interpreted as a sign of financial sophistication or as an attempt to mask risk exposure.
Empirical findings are similarly mixed.
Guay and Kothari (
2003) and
Allayannis and Weston (
2001) report that derivative usage enhances a firm’s value and reduces information asymmetry when driven by hedging motives. In contrast,
Dewally and Shao (
2013) find that firms with greater derivative exposure face a heightened crash risk, indicating that economic complexity may impair investor monitoring.
Su et al. (
2022) show that derivative complexity increases stock price synchronicity, further suggesting reduced informativeness.
Yet
Campbell et al. (
2023) and
Manconi et al. (
2017) argue that complex derivative activities, when accompanied by transparent reporting, can actually improve information environments and mitigate managerial opportunism. These contrasting findings imply that the effect of economic complexity on crash risk is conditional and depends on how market participants interpret complexity and the firm’s broader disclosure context. We therefore propose the following competing hypotheses:
H1a: The economic complexity of derivative use is positively associated with the stock price crash risk.
H1b: The economic complexity of derivative use is negatively associated with the stock price crash risk.
3.2. Derivative Accounting Complexity and the Stock Price Crash Risk
Apart from economic structure, the way derivative activities are reported—what we refer to as accounting complexity—also plays a crucial role in shaping the crash risk. According to the opacity hypothesis (
Jin & Myers, 2006), complex or fragmented disclosures can obscure firm performance, delay the release of negative information, and increase the likelihood of abrupt stock price corrections.
Derivative-related accounting complexity typically manifests in two dimensions: (1) the dispersion of disclosure across various financial statement sections, and (2) the use of fair-value measurements, particularly Level 3 inputs, which rely on unverifiable assumptions. These features elevate the interpretive burden on investors and reduce the clarity of firm-specific risk exposure. Empirical studies offer support for this view.
Chang et al. (
2016) and
Campbell et al. (
2023) document that analysts’ forecast accuracy deteriorates when faced with more complex derivative disclosures.
Su et al. (
2022) show that accounting complexity is linked to increased return synchronicity, suggesting reduced firm-specific information in prices.
However, the evidence also points to potential benefits.
Bhattacharya et al. (
2023) find that regulatory enforcement improves the derivative disclosure quality and lowers the perceived risk, indicating that complexity may be informative rather than obfuscating when appropriately structured. In light of these competing theoretical and empirical perspectives, we propose the following alternative hypotheses:
H2a: Accounting complexity in derivative disclosures is positively associated with the stock price crash risk.
H2b: Accounting complexity in derivative disclosures is negatively associated with the stock price crash risk.
3.3. Joint Effects of Economic and Accounting Complexity on the Stock Price Crash Risk
The prior sections consider economic and accounting complexity as distinct channels through which derivative activity may affect the crash risk. However, in practice, these dimensions often co-occur. Firms that employ more economically complex derivative strategies (e.g., multiple instruments or greater exposure) may also face more complicated reporting requirements due to measurement constraints, regulatory rules, or valuation practices. As such, the joint effect of economic and accounting complexity may be more than the sum of its parts.
From an agency theory perspective, this interaction can have opposing implications. If economic and accounting complexity are both accompanied by structured and transparent disclosures, they may complement each other in reducing information asymmetry and deterring opportunistic behavior. In this case, investors are able to interpret sophisticated hedging strategies effectively because the accounting clarity mitigates the interpretive burden. Conversely, when both dimensions are large but disclosure is fragmented or opaque, complexity may compound, exacerbating uncertainty and amplifying the bad-news hoarding risk.
While direct empirical evidence on this interaction is limited, existing studies offer partial insights.
Campbell et al. (
2023) and
Chang et al. (
2016) find that accounting complexity reduces the analyst forecast accuracy, particularly when disclosures relate to valuation-sensitive items.
Su et al. (
2022) provide evidence that complexity in derivative-related disclosures reduces price informativeness. While their study emphasizes disclosure quality, it implies that the interpretability of both economic positions and accounting presentations may jointly shape investor understanding. These findings suggest that interactions between the two forms of complexity can influence how investors respond to derivative activity, depending on whether the complexity is accompanied by clear reporting.
Accordingly, we extend our framework by formulating a third hypothesis on the joint effect of derivative complexity dimensions:
H3: The effect of economic complexity on the stock price crash risk is moderated by the accounting complexity.
4. Research Methodology
4.1. Sample
In this paper, the sample includes Chinese A-share-listed companies from 2010 to 2023. The sample period begins in 2010 to avoid the confounding effects of the Global Financial Crisis and to ensure the consistency and comparability of the financial data. We end the sample in 2023, the most recent year for which a complete set of annual reports and stock return data was available at the time of data collection.
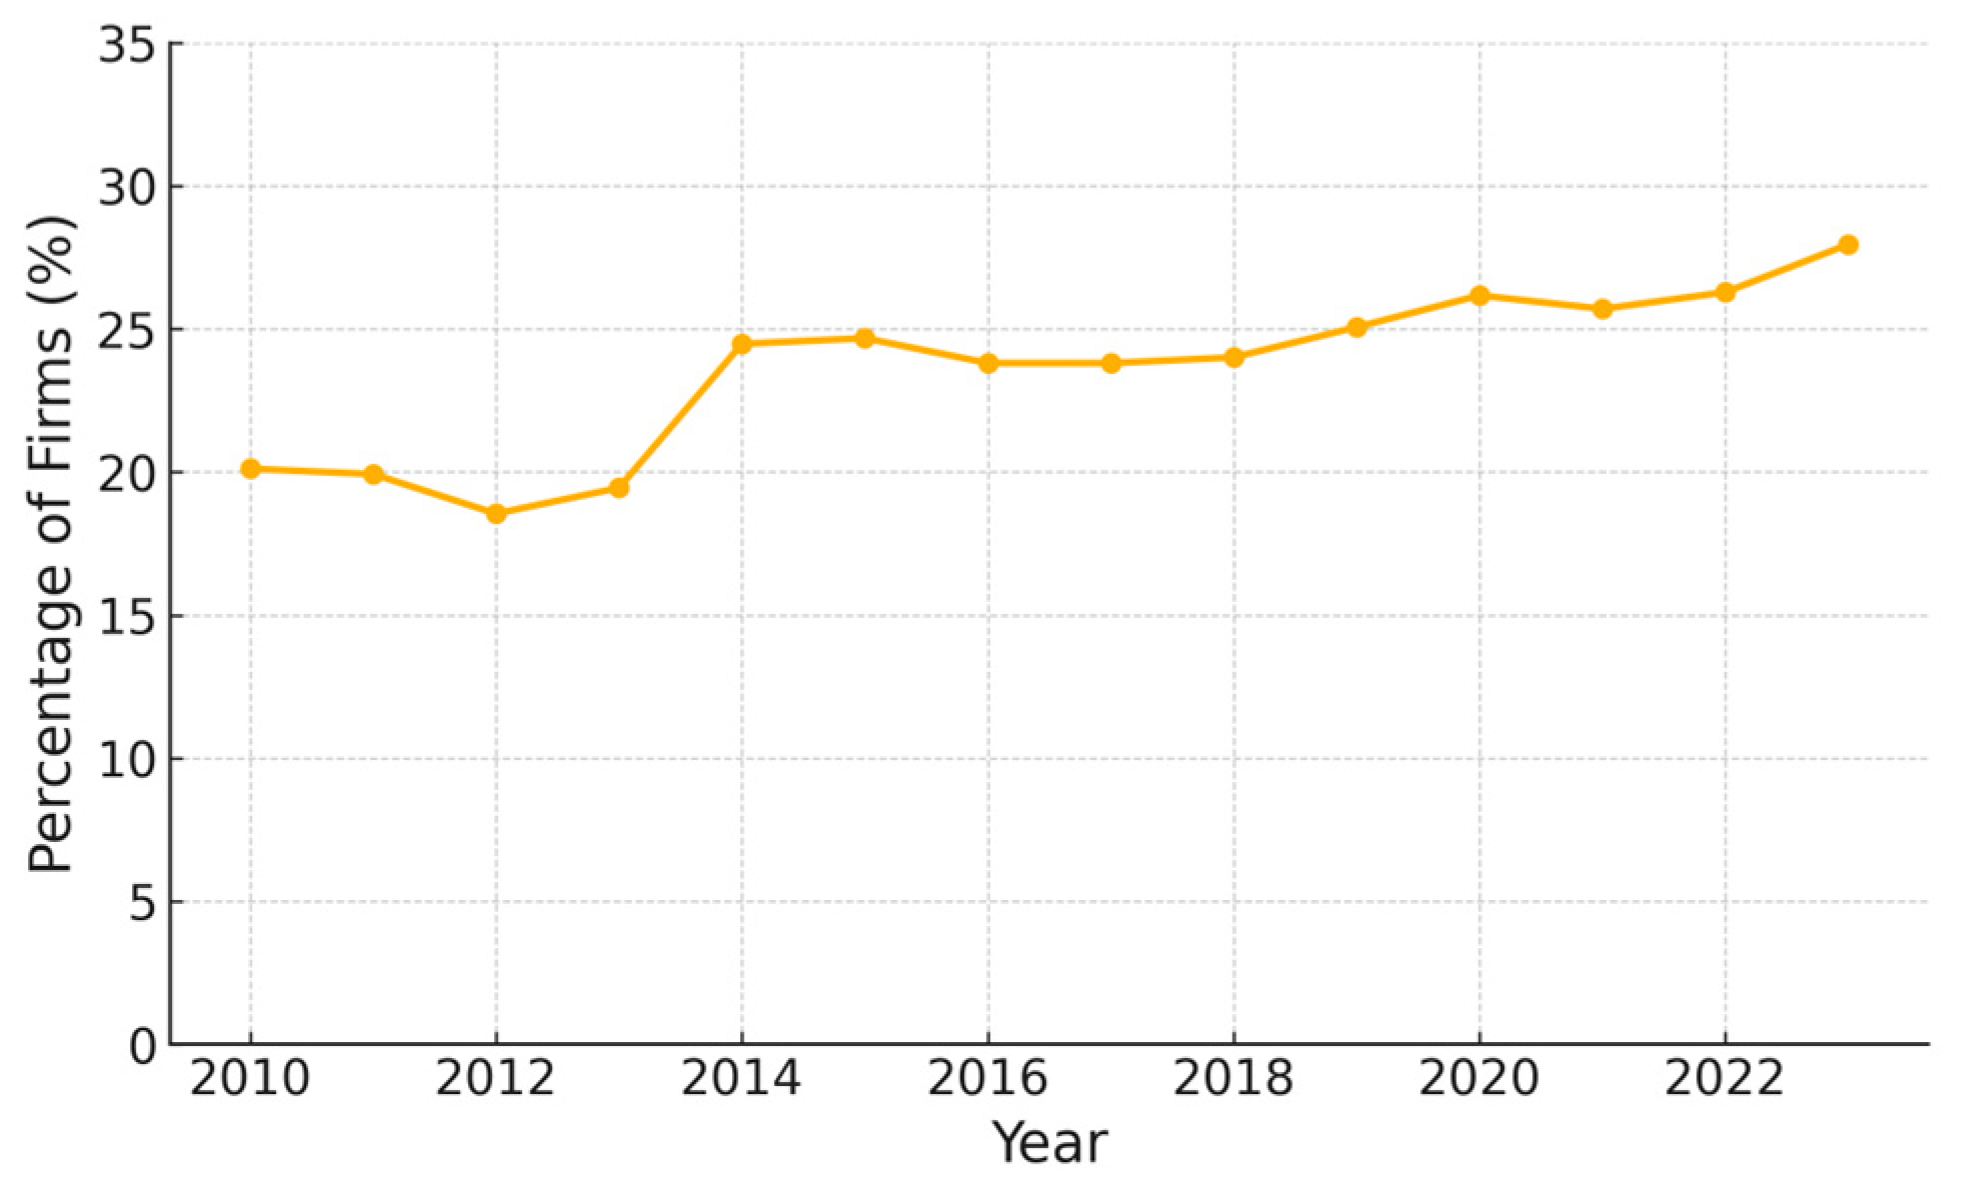
Figure 1 presents the proportion of firms using derivatives from 2010 to 2023. While the overall usage remains modest, a gradual upward trend is observed, particularly after 2014, reflecting the growing awareness and adoption of financial risk management tools among Chinese listed firms. Following
Huang and Wang (
2016) and
F. Guo (
2012), the paper restricts the sample to listed companies with risk exposure. For the types of risks to which firms are exposed, we consider the foreign exchange risk, interest rate risk, and commodity price risk, taking into account both previous research and the subject of this paper. In this paper, two criteria are used to determine whether a sample is exposed to foreign exchange risk. The first is the foreign currency translation difference. If the foreign currency translation difference in the sample’s balance sheet is not zero, the sample is considered to have had foreign exchange risk exposure that year. The second is the foreign business income. If the sample’s foreign business income is not zero, the sample is considered to have had foreign exchange risk exposure that year. If either of the two criteria is met, the sample could be included in the study. We use the industry level to determine the commodity price risk. First, we calculate the percentage of use of commodity derivatives in each industry. If the percentage exceeds 10%, that is, if more than 10% of the listed companies in the industry use commodity derivatives, then all other listed companies in the industry are considered to be exposed to commodity price risk. For the interest rate risk, if the firm uses interest rate derivatives during the year, it is determined to have had interest rate exposure. If the sample has at least one of these three risk types, the firm is considered to have had exposure.
In addition, we exclude financial firms (e.g., banks, insurance companies, and securities firms) due to their distinct regulatory regimes, capital structures, and mandatory risk management practices, which make their use and disclosure of derivatives fundamentally different from that of non-financial firms. We also exclude firms with missing data on key control variables or with abnormal fiscal year ends to maintain consistency in the construction of the crash risk measures and financial covariates.
The data related to the use of derivatives are obtained from the manual screening of company annual reports, searching, crawling and sorting for keywords related to derivatives, including derivatives, forwards, swaps, futures, options, and hedges. The information content of annual reports mainly includes the type of derivative, the fair value, the notional amount, the related profit and loss, and the corresponding disclosure location. The solid data collection set provides an adequate and reliable source of derivative complexity indicators for this study, while other sample indicators are obtained from the CSMAR database.
4.2. Measurement of Key Variables
4.2.1. Stock Price Crash Risk
First, the weekly specific returns of individual stocks are calculated based on Equation (1):
where
Ri,t is the yield of individual stock
i in week
t, considering the reinvestment of cash dividends; and
Rm,t is the average yield of all shares of A stock, weighted by the market value outstanding in week
t. Similarly, the remaining control variables include
Rm,t for the two periods before and after. The formula for the weekly specific return is
Wi,t = ln(1+
εi,t), where
εi,t is the residual of the regression equation.
Second, the following two variables can be constructed based on the weekly specific returns.
NCSKEW is the degree of negative bias in the weekly returns and is calculated as follows: the greater the
NCSKEW, i.e., the greater the degree of negative skew, the higher the risk of a stock price crash.
where
n represents the number of trading weeks per year for an individual stock.
DUVOL is the ratio of weekly returns to upside and downside volatility. It is calculated by first dividing all the samples into two groups that are either above or below the average based on the weekly specific returns. The larger the
DUVOL, i.e., the more leftward-skewed the yield distribution, the greater the risk of a stock price crash.
where
nu and
nd are the number of weeks in which the weekly specific earnings of an individual stock are greater than or less than the average annual earnings, respectively.
4.2.2. The Complexity of Derivatives
Derivatives are complex, diverse, and obscure, which make many companies shy away from them or use them inappropriately, resulting in huge losses.
Chang et al. (
2016) first proposed classifying the complexity of derivatives into economic complexity and reporting complexity, but such classification criteria are not applicable to China. In order to investigate whether and how the use of derivatives affects the risk of a stock price collapse, this paper decomposes the high-complexity characteristics of derivatives into economic complexity and accounting complexity.
Economic Complexity
The economic complexity of derivatives is reflected not only in the derivatives themselves but also at the firm level using conditions of derivatives. The structure of derivatives by their economic nature alone can be varied and complex, as derivatives can be associated with the value of almost any type of underlying assets and liabilities, including the derivatives themselves (
Stulz, 2004). Moreover, even the most common derivative contracts contain a great deal of ambiguous and ever-changing terminology (
Koonce et al., 2005). In the case of listed companies as a whole, the more complex and larger the amount of derivatives used, the more economic complexity is added for each additional derivative used. Due to the data limitations of Chinese non-financial enterprises, this paper is unable to obtain detailed information about each derivative contract entered into by listed companies from public data and, thus, cannot describe the complexity of derivatives from the individual derivative contracts themselves. Therefore, the economic complexity of derivatives in this study refers to the overall usage at the firm level.
First, the economic complexity is significantly higher after the use of derivatives compared with before the use of derivatives. In this paper, the dummy variable USER is used. The USER variable for the sample is assigned a value of 1 if the firm uses derivatives during the year and 0 otherwise. Second, we set the TYPE variable, which is the logarithmic value obtained by adding 1 to the types of derivatives in each sample. A higher value indicates higher economic complexity. First, this paper classifies derivatives into forward, swap, futures, options, and other types. Using this indicator, the economic complexity is zero for a sample that has exposure but does not use derivatives, indicating the lowest economic complexity. This paper does not take dummy variables to indicate the type of complexity because the sample in this paper is 20% of the sample that uses derivatives, and a measure that takes dummy variables based on the median would likely be indistinguishable from USER’s results rather than reflecting the impact of type complexity.
Also, the logarithmic value of the fair value of derivatives plus 1 is AMOUNT, with higher values indicating a greater economic complexity of derivatives. The derivative amount for each sample is the sum of the fair value of the derivative assets and derivative liabilities. In this paper, we have carefully and completely collected and organized the derivative disclosures in the annual reports of all A-share-listed companies from 2010 to 2023 by hand, and in the process, we concluded that listed companies mainly categorize derivative amounts in the following items in their balance sheets: financial assets at fair value through profit or loss, financial liabilities at fair value through profit or loss, derivative financial assets, derivative financial liabilities, financial assets held for trading, financial liabilities held for trading, other current assets, and other current liabilities. This indicator is based on the sum of all the above items for each sample year.
Accounting Complexity
Accounting complexity is usually caused by uncertainties related to the formation of transactions, potential transactions, and financial reporting standards (
Peterson, 2008). First, according to Chinese hedge-accounting standards, the effective portion of cash-flow hedges and net investments in foreign operations are recognized in other comprehensive income and are used to offset gains and losses arising from the hedged item only upon settlement of the derivative, while the other effective and ineffective portions are immediately recognized in the profit or loss in the current period (
Choi et al., 2015). Second, derivative assets and liabilities are measured at fair value, but most other types of derivatives, with the exception of futures, do not have a spot delivery market. As a result, they lack first-level parameters, and their fair values are mostly at the second level and the third level.
We use POSITIONS firstly to measure the accounting complexity. The POSITIONS parameter is equal to the logarithm of the number of key disclosure positions of the derivatives plus 1. This paper reports, for the first time, the accounting disclosure of derivatives by Chinese A-share-listed companies and determines the accounting complexity of each sample of investors from publicly available information at the following key locations, which include, but are not limited to, the derivative investment statement, assets and liabilities measured at fair value, the disclosure of derivatives on the consolidated balance sheet, the location of derivatives on the balance sheet, the financial assets/liabilities position, the disclosure of trading financial assets/liabilities position in the consolidated balance sheets, the disclosure of other current assets/liabilities position in the consolidated balance sheets, gains/losses (income) from the fair-value changes position, the investment income position, the risk analysis position, the three levels of fair-value accounting position, and the hedge-accounting position. All of the above positions are related to the derivatives’ accounting treatment; therefore, this indicator contains information not only on derivative disclosures but also about derivative accounting treatments; the more positions a company discloses, the more complex the company’s derivative accounting treatment will be. Another indicator is LEVEL, which is 1 if the fair-value hierarchy of derivatives is disclosed and 0 otherwise. Accounting derivatives are complex for firms that disclose all three levels of information.
4.3. Empirical Model
To empirically test the impact of derivative complexity on the stock price crash risk, we adopt the multivariate linear regression framework presented in Equation (4), following prior literature (e.g.,
Kim et al., 2011;
Xu et al., 2012;
Q. Meng et al., 2017). The dependent variable
CRASHRISK is measured using two proxies: the negative skewness of firm-specific weekly returns (
NCSKEW) and the down-to-up volatility (
DUVOL). These proxies capture the asymmetry and volatility structure of firm returns, commonly used to identify crash risk in financial studies.
The key independent variables, collectively denoted as DERIVATIVE in Equation (4), are the five complexity indicators discussed earlier—three reflecting the economic complexity (USER, TYPE, AMOUNT) and two representing the accounting complexity (POSITIONS, LEVEL). These variables are lagged by one year to mitigate simultaneity concerns.
All the models control for firm size, leverage, firm age, return on assets (
ROA), book-to-market ratio, stock-return volatility (
Sigma), annual return (
Ret), and turnover. Details on the definitions of our control variables are shown in
Appendix A. Industry and year fixed effects are included to absorb sectoral and macroeconomic influences. All continuous variables are winsorized at the 1% tails to reduce the influence of outliers. The baseline model is specified as follows:
Further, to examine H3, we extend the baseline model by including an interaction term between the economic complexity and accounting complexity measures. This specification allows us to test whether the impact of derivative complexity on the crash risk is conditional upon the joint structure of derivative usage and disclosure practices.
4.4. Descriptive Statistics
4.4.1. Sample Distribution
This study is based on 20,971 firm-year observations of Chinese A-share-listed companies from 2010 to 2023. We find that while the number of firms engaging in derivative use began to increase more noticeably after 2014, the overall penetration rate remained relatively modest throughout the sample period. This trend may reflect a general lack of familiarity with, or a cautious attitude toward, derivative products, particularly those that are complex and perceived as high-risk. These patterns highlight the need for further research on derivative use and complexity, not only to help current users enhance their internal risk management and governance but also to assist non-users in better understanding the value and challenges associated with such financial instruments.
Table 1 presents the distribution of the sample. Panel A classifies derivatives into five product-based categories: forwards, swaps, futures, options, and other types. This classification reflects one of the most widely used standards for identifying derivative instruments. In the notes of the financial statements of listed companies in China, disclosures regarding these categories are generally complete, which allows this study to construct the economic complexity indicator
TYPE. This indicator is based on the number of different derivative categories that a firm uses. As shown in Panel A, although a small number of firms use up to four types of derivatives, the majority of derivative users rely on one or two categories. Specifically, 17.83% of the observations involve one type of derivative, and 5.25 percent involve two types.
Panel B categorizes derivatives by the underlying asset into commodity derivatives, foreign exchange derivatives, and interest rate derivatives. This classification helps capture the primary risk exposure each derivative type is intended to address. The panel shows that foreign exchange derivatives are the most commonly used, appearing in 13.93 percent of the observations. This aligns with the composition of the sample, where foreign exchange exposure is the most prevalent form of risk. Commodity derivatives are the second most common, used in 9.21 percent of the observations. Interest rate derivatives are the least frequently used, with a usage rate of only 2.25 percent. This distribution suggests that firms are more likely to use derivatives to manage exposure to foreign exchange risks than to commodity or interest rate fluctuations.
4.4.2. Summary Statistics of the Main Variables
Table 2 presents the minimum, median, maximum, mean, and standard deviation of all the variables used in the main regression analysis. To reduce the influence of outliers, all continuous variables—except for the derivative complexity indicators—are winsorized at the 1st and 99th percentiles. The two dependent variables,
NCSKEW and
DUVOL, are used to measure the firm-level stock price crash risk. Their mean values are −0.22 and −0.15, respectively, and their standard deviations are 1.03 and 0.86. These statistics are consistent with prior literature and indicate that the crash risk varies substantially across firm-year observations.
Derivative complexity is captured through five indicators. USER, with a mean of 0.21, is a binary variable indicating whether a firm uses derivatives. TYPE, measuring the number of derivative categories used, has a mean of 0.15 and a standard deviation of 0.36. AMOUNT, which captures the notional size of derivative positions, has a mean of 2.34 and a standard deviation of 5.66. The accounting-based indicators include POSITIONS (mean = 0.37, SD = 0.75) and LEVEL (mean = 0.07, SD = 0.28). These indicators are constructed based on hand-collected information from financial statement disclosures, reflecting both the scale and reporting complexity of derivative usage among Chinese listed firms.
The control variables also display considerable variation. For example, Turnover ranges from −191.61 to 87.76, with a mean of −15.17, indicating high dispersion in trading activity. Firm size (Size) has a mean of 22.16, and firm age (Age) has a mean of 2.05. Other variables, including Ret, Sigma, BM, Leverage, and ROA, fall within expected ranges and exhibit reasonable dispersion.
The last three variables in
Table 2 are used to construct subsamples for further analysis in
Section 7.
STATE equals one if a firm is state-owned and has a mean of 0.392, suggesting that approximately 39.2 percent of the observations pertain to SOEs.
INNER indicates the internal-control quality, where one denotes low quality. Its mean of 0.58 implies that 58 percent of firm-year observations fall into the low-control category.
INFORMATION reflects the information transparency and is coded as one for a firm with lower transparency based on the number of analysts following the firm. Its mean value of 0.51 suggests a nearly even split between firms with high and low transparency.
4.4.3. Correlation Analysis
Table 3 presents the Pearson correlation coefficients among the key variables. All the derivative complexity indicators are significantly and negatively correlated with the two crash risk measures (
NCSKEW and
DUVOL), suggesting that greater use of derivatives and higher reporting complexity are associated with a lower crash risk. Conversely, firms that do not use derivatives or that engage in less-complex derivative activities tend to exhibit a higher likelihood of price crashes. These results provide preliminary support for hypotheses H1b and H2b.
The two crash risk measures are highly correlated, with a coefficient of 0.932, indicating a strong degree of consistency between them. This is in line with
Kim et al. (
2011) and confirms that both measures capture similar aspects of downside risk. The correlation matrix also reveals strong positive correlations among the five derivative complexity indicators, which are all significant at the 1 percent level. In particular,
USER is strongly correlated with
TYPE,
AMOUNT, and
POSITIONS, reflecting the inherent design logic that these indicators are defined conditionally on the use of derivatives. Although each complexity indicator captures a different dimension—such as product variety, notional exposure, or disclosure structure—their internal consistency is evident.
While the correlation analysis aligns with theoretical expectations, it does not account for the influence of confounding variables. Therefore, multiple regression analysis and robustness tests are conducted in subsequent sections to verify the findings in a more controlled setting. To further assess potential multicollinearity, variance inflation factors (VIFs) are computed for all independent variables prior to regression analysis. All VIF values are below 5, indicating no serious multicollinearity concerns in the multivariate models.
5. Baseline Results and Robustness Checks
5.1. The Role of Derivative Economic Complexity
The effect of derivative economic complexity on the stock price crash risk is reported in
Table 4. The results provide consistent support for hypothesis H1b, which posits that increased economic complexity in derivative use is associated with a lower crash risk.
Columns (1) and (2) show that the dummy variable USER, indicating whether a firm uses derivatives, is significantly negatively associated with both crash risk proxies—NCSKEW (−0.057, t = −2.38) and DUVOL (−0.053, t = −2.12)—which are both significant at the 5 percent level. This finding suggests that, conditional upon comparable risk exposure, derivative users are significantly less likely to experience stock price crashes than non-users. Columns (3) and (4) incorporate TYPE, the number of derivative categories used, and the coefficients are even more negative and significant (NCSKEW = −0.079, t = −2.54; DUVOL = −0.070, t = −2.47). These results reinforce the conclusion that a broader variety of derivative instruments enhances information transparency and reduces the probability of bad-news hoarding. Columns (5) and (6) examine AMOUNT, the notional scale of derivative positions. Although the statistical significance is weaker, the coefficients remain negative and significant at the 10 percent level (NCSKEW = −0.005, t = −1.76; DUVOL = −0.004, t = −1.89), suggesting that the crash risk declines as firms take on larger derivative positions, possibly due to the improved credibility of their risk management intent. Beyond statistical significance, the estimated effects are also economically meaningful. For instance, a one-unit increase in TYPE is associated with a reduction in NCSKEW of approximately 0.079, which corresponds to more than 25% of the interquartile range for the crash risk observed in the sample. These effect sizes suggest that even marginal improvements in the structure or disclosure of derivatives may substantially reduce the likelihood of extreme downside events.
Together, the three complexity indicators confirm that both the decision to use derivatives and the extent of economic engagement with these instruments contribute to mitigating the crash risk. These results align with the transparency hypothesis (
Manconi et al., 2017), which argues that derivatives, when properly disclosed and managed, can reduce information asymmetry and the managerial incentive to withhold negative information. Notably, these findings contrast with those of
Dewally and Shao (
2013), who report positive associations between derivatives and crash risk in U.S. markets, highlighting potential institutional or regulatory differences between developed and emerging economies.
Regarding control variables, firm size and listing age are significantly positively associated with the crash risk across all specifications, suggesting that older and larger firms may be more vulnerable to delayed market corrections. In contrast, higher book-to-market ratios and profitability (ROA) are negatively related to crash risk, consistent with prior studies. Return (Ret) and stock-return volatility (Sigma) are positively and significantly correlated with the crash risk at the 1 percent level, reflecting the inherent downside risk in firms with higher upside volatility.
Overall, the evidence in
Table 4 supports H1b and provides robust empirical confirmation that greater economic complexity in derivative use plays a risk-mitigating role in stock price crashes.
5.2. The Role of Derivative Accounting Complexity
The regression results for H2 are reported in
Table 5. Consistent with H2b, the complexity of derivative accounting disclosures is significantly negatively associated with the stock price crash risk, indicating that more detailed and structured disclosure reduces the likelihood of bad-news hoarding and market disruptions.
Columns (1) and (2) examine
POSITIONS, the number of separate locations in the financial statements where derivative-related information is disclosed. The coefficients are negative and statistically significant for both
NCSKEW (−0.041, t = −2.45) and
DUVOL (−0.038, t = −2.67). This finding suggests that a greater dispersion of derivative information across financial statement sections reflects more comprehensive disclosure practices, which, in turn, enhance investor understanding of firms’ risk exposure. Such detailed disclosures are likely to improve transparency and reduce information asymmetry, thereby limiting opportunities for management to withhold negative information—a mechanism consistent with the bad-news hoarding theory of
Jin and Myers (
2006) and the transparency perspective in
Hutton et al. (
2009).
Columns (3) and (4) introduce
LEVEL, a dummy variable indicating whether firms disclose the fair-value hierarchy of derivatives. The coefficients for
LEVEL are again significantly negative (
NCSKEW = −0.106, t = −2.24;
DUVOL = −0.087, t = −2.20), reinforcing the idea that the disclosure of valuation inputs improves the informativeness of financial statements. Fair-value hierarchy information, especially concerning Level 2 and Level 3 inputs, allows investors to better assess the subjectivity embedded in valuations and the quality of underlying models. Firms that disclose such information may be perceived as more transparent and less prone to hiding bad news, reducing the crash risk, which is in line with findings by
Kim et al. (
2011).
Taken together, the findings in
Table 5 suggest that accounting complexity, when structured and disclosed effectively, does not increase opacity. Instead, it plays a complementary monitoring role by enhancing the credibility and precision of derivative-related financial disclosures. This is particularly relevant in markets like China, where investor protections are weaker and financial reporting practices are more heterogeneous. The economic magnitude of the effect is also substantial. A one-unit increase in
LEVEL, which captures whether a firm discloses fair-value hierarchy levels in its derivative reporting, is associated with a reduction in
NCSKEW of 0.106. This represents more than 35% of the interquartile range of the crash risk in the sample, highlighting the material role of structured accounting disclosure in mitigating downside risk.
The performance of control variables is consistent with prior studies. Firm size and age are positively associated with the crash risk, while profitability (ROA) and book-to-market ratio are negatively associated. The robustness of these patterns across both the economic and accounting complexity models strengthens the internal validity of the results.
Overall, the evidence supports H2b and indicates that firms with more sophisticated and transparent derivative accounting practices are less likely to experience stock price crashes. While this study establishes a clear association, it does not explicitly test the channels through which these effects operate. Future research may explore whether derivative complexity mitigates the crash risk via improved earnings quality (a “governance effect”) or enhanced disclosure credibility (an “information effect”). In addition, although endogeneity is addressed in the subsequent robustness tests, it remains a relevant concern for interpreting the causal relationship.
5.3. The Interaction Between Economic Complexity and Accounting Complexity
To examine the joint effect of economic and accounting complexity on crash risk (H3), we estimate separate regression models that include interaction terms for each pairing of the three economic complexity measures (USER, TYPE, AMOUNT) and the two accounting complexity indicators (POSITIONS and LEVEL). Across all six specifications, we find that the interaction terms are consistently negative, with varying levels of statistical significance.
In particular, the interaction between TYPE and POSITIONS yields the most robust results. The coefficient on the interaction term is −0.019 (t = −2.39) in the NCSKEW regression and −0.017 (t = −2.12) in the DUVOL regression, with both significant at the 5% level. This suggests that the crash-reducing effect of having more diverse derivative instruments is more pronounced when such usage is accompanied by more dispersed and detailed accounting disclosures. That is, when firms disclose derivative-related information across multiple sections of their financial reports, the market appears better able to interpret the underlying economic complexity, reducing the likelihood of extreme downside events.
The interaction between TYPE and LEVEL, while also negative, is slightly weaker in magnitude and only marginally significant (NCSKEW: −0.014, t = −1.78; DUVOL: −0.012, t = −1.67). This indicates that the valuation complexity, though important, may not amplify informativeness as strongly as the structural breadth of disclosure.
For the other economic measures, the interaction between AMOUNT and POSITIONS yields a negative coefficient of −0.008 (t = −1.95) for NCSKEW and −0.007 (t = −1.84) for DUVOL, with both significant at the 10% level. This implies that even the scale of derivative exposure, when paired with strong disclosure dispersion, can contribute to a lower crash risk. However, the interaction between USER and either accounting variable produces smaller, statistically insignificant coefficients, suggesting that the binary indicator alone may not capture the nuance needed for interactive informativeness.
Taken together, these results reinforce the view that derivative complexity is not inherently risky. Instead, the informational consequences of complexity are conditional upon the quality and structure of the accompanying disclosures. In particular, the pairing of TYPE and POSITIONS—capturing the instrument diversity and reporting dispersion—appears especially effective in reducing the crash risk. This finding supports the conditional informativeness perspective, wherein complex financial strategies become more credible and transparent when clearly reported.
5.4. Robustness Test
One potential concern is that the baseline regressions do not explicitly match derivative users with non-users, which may leave out important confounding factors and lead to biased estimates due to the unbalanced sample structure. To address this issue, we follow the propensity-score matching (PSM) approach of
Bartram et al. (
2011) and match each derivative user with two, three, or four non-user firms (i.e., 1:2, 1:3, and 1:4 matching). After re-estimating the regressions using the matched samples, the results remain consistent: the derivative-related economic and accounting complexities are still associated with a reduced likelihood of stock price crashes. This suggests that our main findings are not driven by sample-selection bias.
As an additional robustness check, we account for the fact that the Ministry of Finance of China introduced a major revision to the Accounting Standard for Business Enterprises No. 22 in 2017, aligning it more closely with IFRS 9. This reform brought significant changes to the classification, measurement, and disclosure of financial instruments, including derivatives, which may affect the comparability of data before and after the reform. To eliminate potential confounding effects arising from this regulatory change, we re-estimate our baseline models using a restricted sample from 2010 to 2016 and post-2016 respectively. The results using the two sub-samples remain qualitatively unchanged, further reinforcing the robustness of our findings.
The paper also transforms and re-regresses the data using a fixed-effects model. The correlation coefficients of the derivative indicator are still significantly negative. We take into account the fact that
Xie et al. (
2016) found that equity pledges by major shareholders in China may have some impact on the risk of derivative crashes. Thus, we also input whether the major shareholders’ pledge equity and the proportion of the major shareholders’ equity pledge as control variables into the equation for regression. The results show that derivatives’ complexity indicator is still significantly negative, and the significance is not affected. Therefore, the results of this paper are relatively robust.
6. Mitigating Endogeneity Concerns
A key concern in the baseline analysis is that the decision to use derivatives may not be exogenous. Firms with certain unobservable characteristics—such as stronger governance frameworks, greater financial sophistication, or more risk-averse management—may be more likely to adopt derivatives and, simultaneously, exhibit a lower stock price crash risk. If so, simple OLS estimates may suffer from selection bias or omitted-variable bias, and the observed negative association between derivative usage and the crash risk may not reflect a causal relationship.
To mitigate this concern, we implement a Heckman two-stage treatment-effects model. In the first stage, we estimate a Probit model to predict the likelihood of derivative use (
USER), using factors that plausibly affect hedging decisions but are less likely to directly influence the crash risk. These include the firm’s exposure to interest rate, exchange rate, or commodity price fluctuations, the probability of bankruptcy, the cash effective tax rate, director salary sensitivity, cash liquidity, and profit volatility. These variables reflect financial risk levels and hedging incentives and have been used in prior studies examining derivative adoption (
Choi et al. 2015;
Pincus & Rajgopal, 2002). As shown in
Table 6, the Probit regression suggests that firms with a higher bankruptcy probability and stronger incentive alignment mechanisms (e.g., greater sensitivity of director compensation to firm performance) are significantly more likely to use derivatives. The Probit model shows reasonable explanatory power, with a pseudo R
2 of 0.172 and a significant Wald χ
2 statistic (χ
2 = 81.47,
p < 0.01), indicating that the instruments jointly explain a meaningful portion of the variation in derivative usage.
In the second stage, we regress the two crash risk measures (
NCSKEW and
DUVOL) on
USER, the inverse Mills ratio (λ) derived from the first-stage model, and the full set of firm-level controls used in the baseline regressions. The results, reported in
Table 6, show that the coefficient on
USER remains significantly negative in both specifications (
NCSKEW = −0.060, t = −2.38;
DUVOL = −0.055, t = −2.12), even after adjusting for potential selection bias. To ensure coefficient stability, we test for multicollinearity among the second-stage regressors. All VIFs are below 5, suggesting that multicollinearity is not a concern in our specification. Furthermore, the inverse Mills ratio is significantly positive (λ = 0.193 for
NCSKEW and 0.198 for
DUVOL), suggesting that selection of derivative use is non-random and that accounting for this bias is necessary.
These findings strengthen the credibility of our baseline conclusions. The persistence of a negative relationship between derivative usage and the crash risk after correcting for endogeneity suggests that this relationship is not solely due to correlated firm traits. Instead, it reflects a potential causal mechanism, whereby the use of derivatives improves information environments or deters bad-news hoarding. This interpretation is consistent with the transparency hypothesis proposed by
Manconi et al. (
2017), who argue that derivative activities, when properly disclosed, can signal managerial discipline and reduce information asymmetry. It is also consistent with
Jin and Myers (
2006), who show that the crash risk arises when firm-specific bad news is withheld from the market, and greater disclosure or monitoring mechanisms reduce this hoarding behavior.
To further address potential concerns about the validity of the instruments used in the first-stage model, we test whether these variables have a direct impact on the crash risk by including interaction terms between the key instruments (e.g., volatility, director salary sensitivity) and the derivative usage indicator in the second-stage regression. The interaction coefficients are statistically insignificant in both the NCSKEW and DUVOL regressions, suggesting that these variables do not exert an independent influence on the crash risk and primarily affect outcomes through their role in predicting derivative use. These results lend additional support to the exclusion restriction assumption and strengthen the internal validity of the two-stage model.
In sum, the treatment-effects model confirms that the observed risk-reducing role of derivative usage is robust in the face of endogeneity concerns and likely reflects a substantive economic effect rather than a spurious correlation.
7. Channel Analysis: The Mediating Role of Disclosure Quality
While the preceding analyses demonstrate that derivative complexity is negatively associated with the stock price crash risk, the mechanism through which this relationship operates remains theoretically and empirically underexplored. One plausible channel is that complex but structured derivative disclosures improve the quality of financial reporting, which, in turn, reduces the likelihood of bad-news hoarding and abrupt price crashes. This logic is grounded in the information opacity framework (
Jin & Myers, 2006), where managers withhold unfavorable information under conditions of poor transparency. If complexity enhances disclosure rather than obscuring it, it may serve as a signal of credible financial communication that deters opportunistic behavior.
To test this mechanism, we conduct a mediation analysis, examining whether the impact of derivative complexity on crash risk operates through improvements in the disclosure quality. Following the procedure of
Baron and Kenny (
1986), we adopt a two-step approach. First, we assess whether derivative complexity predicts a higher disclosure quality, proxied by the absolute value of discretionary accruals (
AbAcc). The prior literature views
AbAcc as an inverse proxy for reporting quality—higher values indicate greater managerial discretion and lower transparency (
Hutton et al., 2009). In the second step, we test whether
AbAcc mediates the relationship between complexity and crash risk by including it in the baseline crash risk regressions.
Given the potential multicollinearity among the five complexity indicators—
USER,
TYPE,
AMOUNT,
POSITIONS, and
LEVEL—we estimate separate mediation models to preserve interpretability and to isolate the indirect effect.
Table 7 reports two representative models using
TYPE and
LEVEL, respectively, which exhibit the strongest associations with disclosure quality. In Panel A, both
TYPE and
LEVEL are significantly negatively associated with
AbAcc (−0.012 and −0.014; t = −2.18 and −2.48, respectively), suggesting that firms using a wider variety of derivatives or reporting fair-value hierarchy levels tend to provide higher-quality financial statements. These results are consistent with the notion that complexity, when accompanied by structured disclosures, reduces managerial discretion in earnings reporting.
In Panel B, we include AbAcc in the NCSKEW regressions alongside TYPE and LEVEL, respectively. The coefficients for AbAcc are positive and significant, indicating that poor disclosure quality increases the crash risk. Importantly, the inclusion of AbAcc reduces the magnitude and significance of TYPE and LEVEL, suggesting a partial mediation effect. This pattern supports the hypothesis that complexity reduces the crash risk, in part, by enhancing the disclosure quality. Although we only report results for TYPE and LEVEL, untabulated analyses for the remaining complexity indicators (USER, AMOUNT, POSITIONS) yield qualitatively similar findings. The magnitude of the mediation is weaker in those cases, but the direction and significance of the indirect path remain consistent.
These findings provide empirical support for a disclosure-based explanation of the effect of derivative complexity on crash risk. When complexity is accompanied by consistent and detailed reporting, it functions not as a source of opacity but as a mechanism for increasing transparency. This reinforces the broader argument that the informativeness of financial complexity is conditional upon its presentation and accessibility, especially in emerging markets, where disclosure norms and monitoring environments vary widely (
Bushman et al., 2004;
Kim et al., 2011).
8. Additional Tests
Despite obtaining robust main regression results, the underlying mechanisms remain unclear: What are the characteristics of the companies where the mitigating effects of derivatives play a greater role? Or which types of firms are more able to favor the positive effects of derivatives? In order to investigate this question, this paper selects different firm characteristics for more detailed observation to determine in which type of firms the relationship between derivative complexity and the stock price crash risk is more significant. In this paper, three grouping variables, namely, the nature of equity, the level of internal control, and the degree of information asymmetry, are selected for group regression.
8.1. The Role of Ownership
Ownership structure, particularly the distinction between state-owned enterprises (SOEs) and non-SOEs, plays a crucial role in shaping managerial incentives and financial decision-making. SOEs are often subject to more political objectives and softer budget constraints, which can distort managerial behavior and reduce the responsiveness to market signals. In contrast, non-SOEs typically face greater external scrutiny, more performance-based pressure, and stronger alignment between ownership and control. These differences may lead to varying motivations and consequences for derivative use.
Prior studies suggest that the effectiveness of financial tools like derivatives may depend on governance characteristics that are tied to ownership.
Huang and Wang (
2016) find that SOEs are generally more risk-averse in financial innovations due to regulatory constraints and past losses, such as those resulting from the 2008 derivative losses in centralized enterprises. Non-SOEs, on the other hand, may adopt derivatives more strategically for hedging or signaling purposes, which could enhance the informativeness of their derivative disclosures.
To empirically investigate this issue, we divide the sample into SOEs and non-SOEs based on firm ownership classification in the CSMAR database. Panel A of
Table 8 shows that the negative relationship between derivative complexity and the stock price crash risk is more pronounced in non-SOEs. Specifically, in the non-SOE group, the derivative usage variable (
USER) is negatively associated with both
NCSKEW (−0.051) and
DUVOL (−0.058), with the latter being significant at the 5% level. Likewise,
TYPE and
AMOUNT also exhibit stronger and more statistically significant negative coefficients (e.g.,
TYPE = −0.077 on
NCSKEW, −0.083 on
DUVOL;
AMOUNT = −0.006 and −0.005; both
p < 0.05).
In contrast, for SOEs, the estimated coefficients are generally smaller in magnitude and statistically insignificant. This divergence suggests that the market responds more favorably to derivative use and complexity in firms where managerial behavior is more market-oriented and less politically constrained.
These results underscore that the impact of derivative complexity is not uniform across ownership types. For non-SOEs, derivative disclosures may signal risk management sophistication and enhance transparency, thereby mitigating the crash risk. However, in SOEs, such disclosures may carry less informational content due to their weaker performance incentives and limited flexibility in financial strategy. These findings emphasize the importance of considering institutional ownership differences when interpreting the informativeness of derivative complexity.
8.2. The Impact of Internal-Control Quality
Internal-control systems are essential in constraining managerial discretion, ensuring information integrity, and maintaining investor confidence. Firms with robust internal governance are more likely to detect and deter opportunistic behavior, whereas firms with weak controls are more vulnerable to managerial misconduct, including the concealment of negative information. The CITIC Pacific case provides a notable example of governance failure, where unauthorized speculative derivative activities led to substantial losses and a stock price collapse due to ineffective oversight.
Theoretical and empirical research supports the idea that internal-control quality moderates the relationship between disclosure and market outcomes.
Ye et al. (
2015) suggest that stronger internal control enhances transparency and reduces the likelihood of bad-news hoarding by limiting managerial discretion. Similarly,
Jin and Myers (
2006) argue that in weak governance environments, managers are more prone to conceal negative information, particularly when financial disclosures are complex or opaque. This dynamic implies that derivative complexity may be more easily exploited in such firms, thereby increasing the risk of abrupt stock price crashes when suppressed bad news is eventually revealed.
To examine whether the effects of derivative complexity vary with internal-control strength, we follow the example of
Q. Chen and Liu (
2025) and divide the sample based on the Dibo internal-control index. Firms above the median are classified as having high internal-control quality and those below as having low quality.
Panel B of
Table 8 reveals that the negative association between derivative complexity and the stock price crash risk is concentrated among firms with low internal-control quality. Specifically,
USER is significantly and negatively related to
NCSKEW (−0.096,
p < 0.05) and
DUVOL (−0.094,
p < 0.01) in this group.
TYPE and
AMOUNT also show strong effects, with
TYPE coefficients of −0.126 and −0.114 and
AMOUNT coefficients of −0.010 and −0.009 (all significant at 5% or better). Similarly, accounting complexity indicators such as
POSITIONS and
LEVEL are negatively associated with crash risk only among low-control firms.
In contrast, in the high-control subgroup, all the coefficients are smaller and statistically insignificant, suggesting that formal governance structures already perform the monitoring function that derivative complexity might otherwise provide.
These findings highlight a critical boundary condition: the informativeness of derivative complexity is enhanced when internal oversight is weak. In such firms, detailed and multidimensional derivative disclosures may substitute for missing internal checks, limiting the ability of managers to hoard bad news. This underscores the role of disclosure as an external governance mechanism, especially in poorly monitored firms, and suggests that regulators and investors should pay particular attention to derivative disclosures in firms with weak internal controls.
8.3. The Impact of Information Transparency
The level of information transparency plays a central role in determining how external investors interpret and react to derivative-related disclosures. When firms operate in low-transparency environments, complex financial instruments may amplify the information asymmetry and obscure firm-specific risks, potentially increasing the likelihood of crash events. In contrast, when financial information is readily available and subject to external scrutiny, pessimistic signals are more likely to be incorporated gradually into prices, thereby reducing the risk of abrupt market corrections (
Jin & Myers, 2006;
Hutton et al., 2009).
To proxy the firm-level transparency, we use the number of analysts issuing earnings forecasts, retrieved from the CSMAR Analyst Forecast Database. This measure is widely employed in the Chinese context as a proxy for the quantity and quality of external information processing (
Y. Meng et al., 2024). Analyst coverage is associated with enhanced market efficiency (
Yu, 2008), reduced information asymmetry (
Lang & Lundholm, 1996), and greater price informativeness (
Chan & Hameed, 2006). In the Chinese context, the role of analyst coverage in improving corporate information transparency and reducing managerial opportunism has been increasingly supported by recent evidence.
Y. Meng et al. (
2024) find that skilled analysts—identified based on their ability to generate abnormal returns—effectively constrain both accrual-based and real earnings management. Their presence reduces agency costs and enhances the monitoring environment, especially in firms with weak internal or external governance.
We divide the sample into high-transparency and low-transparency firms based on the annual median analyst coverage. Firms with below-median coverage are classified as low-transparency. Panel C of
Table 8 reveals that the negative association between derivative complexity and crash risk is significantly more pronounced in the low-transparency group. Specifically,
USER is significantly negatively associated with both
NCSKEW and
DUVOL (e.g.,
USER = −0.083,
p < 0.05;
DUVOL = −0.078,
p < 0.05). Likewise,
TYPE and
LEVEL exhibit larger and more significant coefficients in the low-coverage group. In contrast, most coefficients in the high-coverage group are smaller and statistically insignificant. The two accounting complexity measures (
POSITIONS and
LEVEL) show similar patterns, with significant negative relationships with crash risk only among firms with low transparency.
These results suggest that in firms where external information production is limited, complex derivative disclosures play a more critical role in mitigating the crash risk. In such environments, investors may rely more heavily on the content and structure of derivative reporting to assess firms’ risk exposure. Conversely, in firms with more comprehensive analyst coverage, analysts may already serve as the interpreters of financial complexity, thus reducing the marginal informativeness of derivative disclosures.
Overall, these findings reinforce the interpretation that derivative complexity operates as a conditional signal of transparency, whose effect on crash risk depends on the surrounding information environment.
8.4. Interaction Effects Between Derivative Complexity and Firm Context
While the prior sections document that the association between derivative complexity and crash risk varies across observable firm characteristics, those analyses rely primarily on subsample splits. To formally evaluate whether these contextual factors statistically moderate the effect of complexity, we estimate a series of interaction regressions that incorporate cross-product terms between complexity measures and firm-level variables. This framework allows us to test whether the marginal effect of derivative complexity is conditional upon structural or informational features of the firm.
We focus on three moderators: (1) ownership structure, proxied by NonSOE, a dummy variable that is equal to one for non-state-owned enterprises; (2) internal-control quality, proxied by LowControl, an indicator for firms below the median value of the Dibo internal-control index; and (3) external transparency, proxied by LowAnalystCoverage, which is equal to one if the firm is below the annual median number of analysts issuing forecasts (as reported in CSMAR).
Each of these firm-level attributes is interacted with the five primary complexity indicators used in our baseline analysis—namely USER, TYPE, and AMOUNT (reflecting the economic complexity), as well as POSITIONS and LEVEL (reflecting the accounting complexity). The estimation framework includes all the main effects and controls as specified in Equation (1), with standard errors clustered at the firm level.
The results provide consistent and significant evidence of moderation effects. For instance, in the ownership dimension, the interaction term TYPE × NonSOE yields a coefficient of −0.045 (t = −2.41) in the NCSKEW regression, while the main effect of TYPE is attenuated to −0.021 (t = −1.34). This suggests that derivative diversity is more informative in non-SOEs, possibly due to their greater responsiveness to market incentives and less political influence. A similar pattern is observed in the governance context: LEVEL × LowControl is negative and statistically significant (coefficient = −0.063, t = −2.57), while LEVEL alone becomes insignificant, indicating that the informativeness of complex valuation disclosures increases when internal governance mechanisms are weaker.
In the transparency dimension, AMOUNT × LowAnalystCoverage enters with a coefficient of −0.009 (t = −2.05), and the main effect of AMOUNT is no longer significant. This implies that derivative exposure amounts are more informative and impactful when alternative information channels, such as analyst interpretation, are limited. In contrast, among firms with high analyst coverage, derivative disclosures may provide less incremental value, as external monitoring substitutes for financial complexity as a source of information.
Collectively, these results indicate that firm context conditions the strength of the relationship between derivative complexity and crash risk. The mitigating effect of complexity is not uniform; rather, it is amplified in environments where traditional governance or informational safeguards are weaker. These findings support a conditional informativeness perspective in which complex disclosures reduce the crash risk primarily when they fill existing gaps in internal or external monitoring.
9. Conclusions
This study provides the first systematic empirical analysis of the complexity of derivative use among Chinese A-share-listed firms and its relation to the stock price crash risk. Using hand-collected data from 2010 to 2023, we construct multidimensional measures of both the economic and accounting complexity. The findings show that firms using derivatives are less likely to experience stock price crashes, and that this mitigating effect strengthens as the complexity of derivative use increases. The effect is particularly significant in non-state-owned firms, firms with weaker internal controls, and firms operating in more transparent information environments. Robustness checks, including propensity-score matching and treatment-effects modeling, support the validity of these results.
This research contributes to the literature by extending prior work on crash risk, corporate disclosure, and the information content of derivatives. It highlights that complexity—both in substance and in disclosure—does not necessarily imply greater risk. Instead, when accompanied by transparent and comprehensive reporting, derivative complexity may enhance investor understanding and reduce uncertainty, particularly in institutional settings where other governance mechanisms are weak.
In practical terms, the findings offer valuable insights for investors, firm managers, and regulators. Investors should consider not only whether a firm uses derivatives but also how it discloses them. For managers, the results reinforce the importance of adopting consistent, informative derivative disclosure. For regulators, the findings suggest that improving the structure and enforcement of derivative disclosure standards is more effective than limiting complexity itself.
Based on the results and our international regulatory experience, we recommend three key directions. First, greater attention should be paid to complex derivatives, including those involving Level 2 and 3 fair-value estimations and hedge accounting, to prevent arbitrage and misuse. Second, disclosure requirements should be enhanced to ensure that firms clearly communicate the purpose of their derivative use, valuation methods, and associated risk—information that is more relevant than simple notional amounts or contract types. Third, consistent and unified accounting and auditing standards should be developed across firm types and trading venues to reduce regulatory arbitrage. While risks associated with derivatives should not be ignored, firms should be encouraged to use them responsibly as effective risk management tools that contribute to long-term market stability.
Despite its contributions, this study is not without limitations. First, the analysis focuses exclusively on Chinese A-share-listed firms, which limits the generalizability of the findings to other institutional contexts. The unique regulatory, governance, and disclosure environment in China—particularly the prevalence of state ownership and evolving financial reporting standards—may moderate the informativeness of derivative complexity differently to that in developed markets. Future research could extend the analysis to cross-country settings or emerging markets with varying institutional characteristics to examine whether the effects observed here hold more broadly.
Second, while we use hand-collected data from annual reports to construct detailed complexity measures, our approach is constrained by the quality and consistency of textual disclosures. Certain aspects of complexity—such as counterparty risk, off-balance-sheet exposure, or the notional-versus-fair value distinction—are either unobservable or disclosed inconsistently. Further studies may leverage machine learning or natural-language processing techniques to extract additional latent features from narrative disclosures or derivative footnotes.
Lastly, although we provide evidence of the mediating role of disclosure quality, other channels may also be at play. For example, the role of earnings smoothing, analyst behavior, or managerial compensation design in shaping the effects of derivative complexity remains underexplored. Future research may pursue multi-layered mediation models or incorporate external monitoring data—such as investor call transcripts or enforcement actions—to better disentangle the information and governance pathways through which complexity affects capital market outcomes.


