Abstract
This study examines whether Chief Executive Officers (CEOs) exercise a greater proportion of their exercisable options in response to firm-specific stock price bubbles. For a sample of U.S. firms from 1992 to 2021, the study identifies stock price bubble periods using the Generalized Sup Augmented Dickey-Fuller (GSADF) method. A bubble is a statistical measure that detects an ex-post firm-specific stock price exuberance that creates abnormally high variation in stock prices arising from changes in discount rates, R&D and market liquidity. If executives have private information and can infer firm-specific bubbles, they are likely to exercise a greater proportion of their exercisable stock options during bubbles to benefit from their firms’ stock price exuberance. Using data aggregated at the CEO-year level, we find that executives are prone to exercising a larger portion of their vested stock options during market bubbles, with the aim of monetizing on the exuberance in the firm’s stock price. They leverage their expertise and their acquired price-sensitive private information to identify these bubbles. We also find that CEOs’ option exercise activity increases as the duration of the bubble increases to capture the price momentum.
1. Introduction
Firms use employee stock options (ESOs) to attract, motivate and retain talented employees that add to their competitive and strategic advantage. While designed to reduce agency problems for the firm, substantial amounts of options can result in executives holding undiversified portfolios with idiosyncratic risks borne by the option recipients. The risk tolerance attitudes of executives influence when such options are exercised. The Black–Scholes Model asserts that the option value is monotonically increasing with time to maturity and volatility (Black & Scholes, 1973). However, many executives receiving options as part of their compensation often exercise them earlier than maturity to diversify their portfolios, or to act upon price-sensitive private information that insider executives possess, or for reasons such as liquidity or consumption needs.
Executives (insiders) have an advantage over other investors when trading their shares since they have access to firm-specific information as well as non-firm related information through their private networks (Elliott et al., 1984; Goergen et al., 2019). Alldredge and Blank (2024) document that information advantages may be higher at the top of the corporate ladder.
We assert that CEOs’ access to forward-looking private information enables them to produce superior estimates of future firm value and thereby enhance their ability to infer the existence of firm-specific bubbles or market exuberance of their employer. Hence, CEOs have private information that enables them to effectively identify overpricing in their firms’ stock (i.e., bubbles), and they consequently capitalize and benefit from timing the exercise of their exercisable stock options during bubbles. Executives can successfully anticipate or infer firm-specific bubbles and therefore exercise a greater proportion of their exercisable options during the bubbles to benefit from market exuberance. This builds on Aboody et al. (2008) who also found evidence that CEOs hold private information that helps them time their stock option exercises. The primary contribution of this study is the identification and presentation of a new empirical construct to measure executives’ private information concerning overvalued stock, with a focus on empirical insights rather than theoretical constructs.
Firm characteristics such as size, operating volatility and investments in innovation, and CEO characteristics such as age may lead to variation in executives’ ability to identify bubbles. We therefore examine such hypothesized variation in executives’ ability to identify bubbles to predictable variation in option exercise during bubbles.
This paper extends the literature on bubble identification and the literature on the timing of stock option exercises by examining whether option exercises are associated with the existence of firm-specific stock price bubbles that are presumed to be inferred by insider option recipients. We examine the association between ESO exercises and firm-specific stock price bubbles since it has implications for employee compensation and retention, investor decisions, financial reporting, corporate governance, market stability and regulatory considerations. Understanding these dynamics is relevant for upholding transparency, fairness and efficiency in financial markets. We examine executive compensation data for the 1992–2021 period and find that 42.63% of CEOs exercised their options during bubble periods. Our results show that CEOs exercise a greater proportion of their exercisable stock options during bubbles at statistically significant levels for the overall period as well as for the post dot-com period. Robustness tests confirm that the association between CEOs’ stock option exercises and firm-specific stock price bubbles is positive, with estimated results remaining qualitatively similar.
While there is considerable support for the Phillips et al. (2015) bubble identification method, the incremental impact of bubbles on option exercises can be difficult to isolate. This is because the statistical method used to identify bubbles (GSDAF) uses the time-series of the stock price, and identified bubbles necessarily coincide with increases in stock prices. We therefore control for firms’ own stock returns and the ratio of stock price over exercise price to highlight the incremental effect of bubbles on CEO option exercises. This allows us to identify whether option exercises by CEOs differ when stock price increases deviate from fundamentals versus stock price increases that do not deviate from fundamentals.
We also find that CEOs exercise a higher proportion of their exercisable options during later years of the bubble episode within a timeframe of 3–4 years of the bubble episode. The proportion of option exercises also increases with the duration of the bubble.
Robustness tests, after addressing endogeneity issues and controlling for the effects of other variables such as firm size, leverage, stock return, stock return volatility, return on assets, investor’s sentiment, option maturity and the CEO’s age, document a statistically significant association between firm-specific bubbles and CEOs’ option exercise behavior.
The remainder of the paper is organized as follows. Section 2 reviews the option exercise and the bubble literatures followed by our hypotheses development. Section 3 and Section 4 describe our data and regression models, respectively, while Section 5 reports our results. Section 6 presents concluding remarks.
2. Literature Review and Hypotheses Development
2.1. Exercise of ESOs
The exercise of ESOs has been shown to be associated with executives’ levels of risk aversion and hence, the need for diversification, their need for liquidity and their heuristic benchmarks or anchoring. The timing of exercise has also been shown to be associated with the magnitude of ESOs granted and the remaining time to maturity.
Huddart (1994) developed an analytical framework based on the binomial model to compare the exercise decisions of risk-neutral and risk-averse employees and found that the risk-averse employees exercise earlier than the option maturity date. Such employees tend to be at a less senior level and have lower compensation in other forms, and therefore earlier exercise is also consistent with their liquidity needs.
Huddart and Lang (1996) analyze the ESO exercise behavior from detailed option grant and exercise records of 50,000 employees at eight companies and find employee exercise behavior to be statistically associated with recent stock price movements, volatility, the ratio of stock price to exercise price, the time to maturity and the seniority of the employees within the company. More junior employees tended to exercise earlier and were more guided by the stock price in relation to its recent trajectory. Both Huddart (1994) and Huddart and Lang (1996) find that senior insiders have more and better insider information to guide them to make better decisions on when to exercise their exercisable ESOs. This is confirmed by Aboody et al. (2008).
Heath et al.’s (1999) analysis of 50,000 employees at seven publicly traded firms shows employees’ exercise timing to be associated with an anchoring bias based on a psychological reference point developed in Kahneman and Tversky’s (1979) prospect theory.1 One such anchor was employees exercising their ESOs when the stock price reached or just exceeded the previous year’s highest price.
Sautner and Weber (2009) examined the option exercise behavior of 70 senior managers in a German company and found that managers with lower expectations for volatility of stock price exercised earlier, while managers with a larger number of ESOs exercised later than their cohorts who received fewer ESOs. Managers with shorter horizons exercised earlier, but no association was found between exercise behavior and risk aversion or diversification. Qu et al. (2018) show how corporate governance and CEO attributes influence vesting periods and other ESO design characteristics, and which eventually influence option exercise behavior. Bhattacharyya et al. (2008) show that higher quality managers retain a higher proportion of their earnings for which they are rewarded with higher compensation. Bova and Vance (2019) do find that exercise behavior by executives is associated with their inclination to avoid uncertainty. Carpenter et al. (2019) find that CEOs with large number of options tended to delay their exercise, presumably due to overconfidence (see also Gong, 2023). Furthermore, they document that employees with a large quantity of options tended to exercise slowly, with postponement of exercises enabling employees to extract 2–7% more value than if they had exercised earlier. Carpenter et al. (2019) also show that higher-ranked employees and wealthier employees delayed their option exercise compared to lower ranked employees and less wealthier employees. The latter result is consistent with executives’ risk aversion to holding undiversified portfolios as explained by Lambert et al. (1991), Guay (1999), Hall and Murphy (2002) and Miao and Wang (2011). Finally, Wu et al. (2012) document the statistically positive association between backdating and firms’ stock price momentum (a variation or proxy of a bubble during its early stages). More recently, Ongsakul et al. (2022) show that board gender diversity plays an effective governance role and deters the opportunistic timing of option grants. Nanda et al. (2023) also offer evidence that higher proportions of independent female directors are associated with lower CEO option compensation, even though the amount remains a substantial part of the compensation package, and with more intensive use of restricted stock grants. Kim and Oh (2024) find evidence of informed trading by outside directors prior to board meetings. During the days prior to board meetings, when outside directors possess private information, they make more profitable and larger purchases than they do during other periods.
In this paper, we assert that exercise of stock options by CEOs may increase during bubbles. If the bubble is stock-specific, the diversification incentive may grow stronger as the bubble stock becomes a larger component of the CEO’s portfolio. Income taxes may also play a role since CEOs qualify for a lower tax rate on capital gains by holding the stocks for at least a year before selling them.
This study extends the literature with a novel empirical construct (in the ESO literature) by examining whether exercise behavior of ESOs is associated with the existence of firm-specific stock price bubbles. Such bubbles are not easily observable in real time since they are not driven by rational quantitative expectations of future cash flows. Instead, Shiller (2015, p. 2) describes a speculative bubble as a “situation in which news of price increases spurs investor enthusiasm, which spreads, goes viral and brings in more speculative investors.” In such a setting, investors could infer the existence of a bubble from the CEOs’ option trading behavior which, in turn, could serve as an early warning system for bubble formation. In the presence of a bubble (presumed to be known by insiders), CEOs may exercise a greater proportion of their exercisable ESOs to benefit from the firm-specific stock price exuberance that may or may not have a long duration. In this context, CEOs that trade their options during bubbles may be similar to arbitrageurs in Abreu and Brunnermeier (2003). Inference of a bubble from significant option trading by a CEO could help end the bubble. But disagreements about the timing of the price correction could extend the duration of the bubble if rational arbitrageurs ride the bubble.
2.2. Bubbles, Crashes and Their Identification
A bubble is a statistical measure that detects an ex-post firm-specific stock price exuberance that creates abnormally high variation in stock prices arising from a variety of factors such as changes in discount rates, liquidity, and speculation. Empirical evidence of the causes of bubbles has been elusive. Shiller (1981) explains that the cause of the explosive behavior in firm-specific stock prices cannot be rationalized by market fundamentals. As a result, common proxies of observable fundamentals may not be sufficient in determining the presence of bubbles.
Several studies have developed statistical methods to identify stock market bubbles and crashes (see Sarkar & Tuomala, 2021, for details). The statistical procedure of Generalized Sup Augmented Dickey-Fuller (GSADF) of Phillips et al. (2015) successfully identifies the origin and collapse of explosive episodes compared to other bubble-detecting models proposed in the literature, despite limitations identified in Monschang and Wilfling (2021). Some scholars use daily data to identify explosive episodes instead of monthly price data, but monthly real stock prices seem to be much more appropriate for identifying explosive episodes (Sarkar & Tuomala, 2021; Zeren & Yilanci, 2019; Corbeta et al., 2018).
The statistical procedure of GSADF is applied to identify statistical firm-specific bubbles (hereafter bubbles) in the monthly real stock market price data. The GSADF procedure assumes that a bubble injects an explosive component into a firm’s stock price that triggers the stock price to deviate from a random walk to an explosive regime. During a bubble, buyers are willing to pay increasingly higher prices for the firm compared to the fundamentals-based prices because they expect future stock prices to continue their upward trajectory. These increasing prices constitute a deviation from random walk to an explosive regime.
A sequence of Backward Sup Augmented Dickey-Fuller (BSADF) values estimated for the monthly real stock market price data of a firm, and Sup Augmented Dickey-Fuller (SADF) critical values along with the real stock prices are required to plot these series together to identify the origin and collapse of the explosive episodes.
Figure 1 visually illustrates the time series for six individual firms with their date-stamping for real stock price index with lag order k = 1, showing their identified start and end of a bubble or crash. These examples illustrate the time series of firms’ real stock prices (drawn in black), the backward SADF sequence (drawn in blue) and the 95% critical value sequence (drawn in red) relative to each other. The backward SADF sequence and the 95% critical value sequence start 36 months later, from 1992. A bubble is denoted by the period (shaded in grey) where the blue line exceeds the red line. The duration of bubbles ranges from one year (2004 for MGP Ingredients Inc and 2016 for WD-40 Company) to five years (2015–2019 for Abiomed Inc., Danvers, MA, USA).
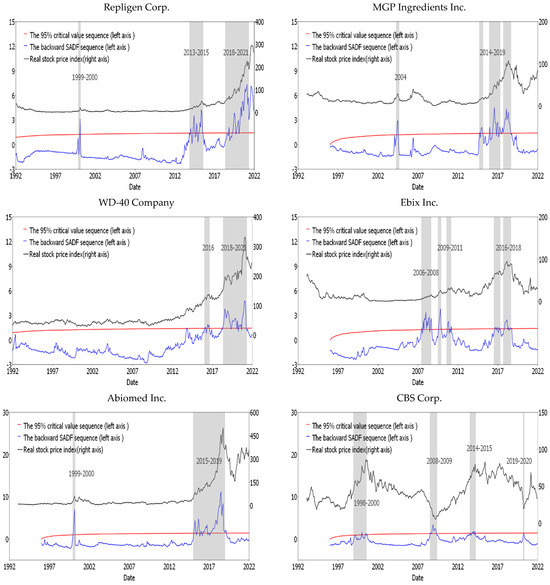
Figure 1.
Examples of date-stamping for real stock prices with lag order k = 1.
The first five charts of Figure 1 illustrate bubbles, while the last chart illustrates a crash in 2008–2009 for CBS Corp. A crash is denoted by the real stock prices (black line) going down while the backward SADF sequence (blue line) is going up. Graphically, the starting point of a bubble (crash) episode is the date at which the backward SADF sequence crosses the corresponding critical value from below. Symmetrically, the end point of a bubble (crash) episode is the date at which the backward SADF sequence crosses the corresponding critical value from above. This implies that the explosive episode will have stock prices for which the backward SADF (BSADF) values will always exceed the 95% SADF critical values. The date-stamping procedure recognizes the start and end dates of explosive episodes in monthly real stock prices, but plotting the real stock prices is also necessary to identify whether the explosive episodes are bubbles or crashes, as shown in Figure 1.
A crash episode for a firm is coded with a binary variable that takes on the value of 1 during an explosive episode based on the GSADF statistical procedure with the cumulative real return of that episode showing a negative return, and 0 otherwise. The cumulative real return is estimated using the peak-to-trough cumulative return procedure following Barro and Ursúa (2017). We also redefine the crash variable as a firm experiencing cumulative returns ≤ −25% as estimated from peak-to-trough stock price changes, following Barro and Ursúa (2017). We found 118 crash episodes with this definition. The effect of the redefined crash variable remains qualitatively the same (statistically insignificant) for the entire period as well as the post dot-com bubble period after correcting for unknown heteroskedasticity and autocorrelation in the error terms.
One more reason for executives to refrain from exercising their options during a crash is the potential for litigation under insider trading rules if an executive is perceived to have divested his or her equity holdings just prior to any significant decline in the employer’s stock price.
The date-stamping procedure recognizes the start and end dates of explosive episodes in monthly real stock prices. However, in the absence of monthly financial statement and CEO compensation data, we use annual financial statements and CEO compensation data and convert estimated monthly bubbles and crashes to yearly bubbles and crashes. This reduces the limitation of the GSADF statistical procedure suggested by Monschang and Wilfling (2021). A firm-year is in a bubble or crash (coded 1) if at least one month in that year statistically exhibits an explosive episode based on the GSADF statistical procedure.
In our sample, the GSADF procedure reveals an estimated 3275 firm-specific bubbles and 43 firm-specific crashes that occurred during the 1992–2021 period, including 35 firm-specific crash episodes that took place during the global financial crisis period of 2007–2009. A market-wide crash does not imply that all firms experience a firm-specific crash. According to our estimates, only 1 firm, 21 firms and 13 firms experienced SADF-determined firm-specific crashes in 2007, 2008 and 2009, respectively. Our independent variable, the bubble proxy, is a reasonable exogenous variable given that it is presumably impacted by market exuberance that is not necessarily linked to firm outcomes.
Sarkar and Tuomala (2021) show evidence that top income shares around the globe are associated with stock and housing market bubbles. Our study extends the literature by examining whether executive stock option exercises are associated with the existence of firm-specific stock price bubbles.
Our hypotheses (in alternate forms) are as follows:
H1.
Ceteris paribus, executives will exercise a higher proportion of their exercisable ESOs after an onset of a bubble.
H2.
Ceteris paribus, executives will exercise a higher proportion of their exercisable ESOs as the duration of a bubble is longer.
3. Data
This section describes the data with the variable definitions reported in Table A1, Appendix A. Data on ESOs is retrieved from ExecuComp, annual accounting data from Compustat and monthly stock prices from CRSP databases. The nominal stock prices obtained from CRSP are deflated by the U.S. Consumer Price Index (CPI). Investor sentiment data is retrieved from the Michigan consumer sentiment annual index.
Figure 2 examines the average value of the option ratio as mapped across bubble and non-bubble periods. The average value of the option ratio is the number of options exercised divided by the sum of the number of options exercised and the number of options exercisable. The number of options exercisable are options that have been vested, unexpired and in-the-money. If a CEO exercises options over several days, the daily stock price is used to calculate the intrinsic value of the unexercised and exercisable options. We consider the option ratio (OptRatio) to be a sound measure of CEOs’ propensity to exercise since it reflects the number of options granted as well as the number of options exercisable.
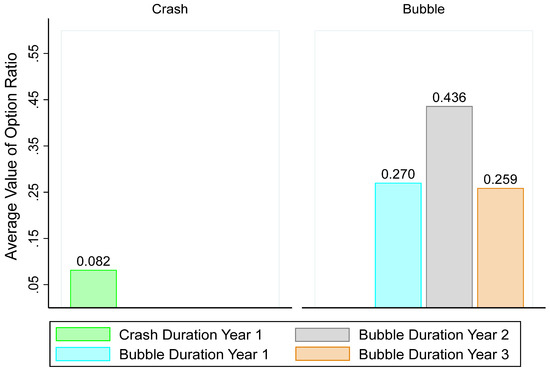
Figure 2.
CEOs’ option ratio during bubbles and crashes.
Figure 2 shows CEOs exercising a greater proportion of their exercisable options in the first year of the crash (consistent with a stop loss strategy) followed by fewer option exercises in subsequent years of the multi-period crash. It shows that executives exercise more of their exercisable options in the second year of the bubble’s duration, but less in the third year of the bubble’s duration. While suggestive, Figure 2 does not allow one to draw firm conclusions about the relationship between bubbles and option ratio.
Figure 3 maps the frequency of bubble periods with option exercises and shows a positive correlation between option exercises and bubble periods. More specifically, it shows that when the frequency of firm- and year-specific bubble increases, the average proportion of options exercised also increases. However, this association is not monotonic.
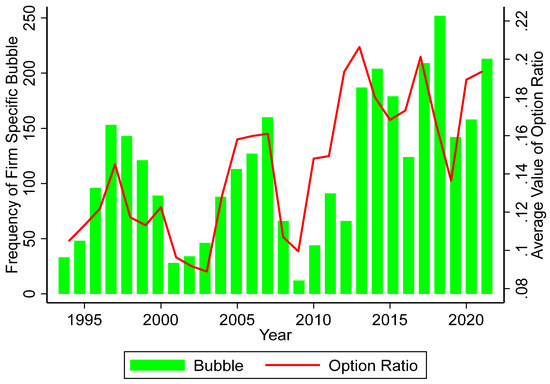
Figure 3.
Relationship between Option ratio and Bubble Frequency over Time.
There is also an exception at the beginning of the financial crisis in 2008. The 2008 option exercises may be explained by CEOs’ stop-loss behavior since they may have anticipated that 2009 would bring about an even bigger crash. The ambiguity of a crash duration likely increases the tendency for executives to exercise early, as shown in Izhakian and Yermack (2017).
Panel A of Table 1 reports the descriptive statistics of all dependent and independent variables. On average, executives exercised 15% of their exercisable options in any given year, with values ranging from 0 to 100%. Of the 19,276 firm-year observations that met our criteria, 17% exhibited a bubble and 0.2% exhibited a crash. The average bubble duration was 0.39 years, and the average crash duration was 0.002 years.

Table 1.
(A) Descriptive statistics of dependent and independent variables. (B) Correlation matrix.
Panel B of Table 1 reports the correlation matrix, with most variables showing statistical significance at the 5% level. The highest correlation of 0.932 is for the existence of crashes and crash duration, followed by the correlation of 0.785 between bubble and bubble duration. This high correlation dictates why we do not include both the existence of bubbles and duration of bubbles in the same regression model. The next highest correlation is that between Leverage and Size (0.388). Table 2 provides details of the number of firms meeting our inclusion criteria across years, the number of bubbles and crashes detected by year, and the average duration of the bubbles and crashes detected each year. Over the 30-year sample period, we found 19,276 firm-years that met the following criteria:
Table 2.
Frequency and duration of exuberance behavior of firm-specific stock returns.
- had less than 24 months of missing stock prices for which the missing values were replaced with previous values and therefore had monthly real stock prices to calculate bubble and crash variables.
- book value of assets ≥ $10 million
- not financial or utility firms (as explained by Faulkender et al., 2012).
Table 3 shows the distribution of option exercises by the CEOs in our sample. It shows that 56.2% of CEOs exercised their options during periods that were neither bubbles nor crashes, while 42.6% of CEOs exercised their options during bubble periods and only 1.1% exercised during crash periods. Only 12 CEOs (0.4%) traded during both bubble and crash periods.
Table 3.
Distribution of option CEOs by executives in our sample.
4. The Model
Standard panel model analysis based on annual data can offer insight into the role of firm-specific stock bubbles in explaining option exercise behavior by CEOs of publicly traded firms. The fixed effect panel regression models we estimate are as follows:
where
OptRatio is the number of options exercised divided by the sum of the number of options exercised and the number of exercisable options.
Bubble is a binary variable which takes the value of 1 during a firm’s bubble episodes and zero otherwise.
Crash is a binary variable which takes on the value of 1 during an explosive episode based on the GSADF statistical procedure with the cumulative real return of that episode showing a negative return, and 0 otherwise.
Bubble/crash duration is the origin-to-burst time in years of the explosive episodes in real stock prices.
Size is the log of total assets.
Leverage is the ratio of long-term debt to book value of equity.
Stock Return is the yearly total return of the firm.
Return Volatility is the annual standard deviation of returns calculated from monthly real stock returns.
MVE/BVE is the market value of equity at year-end divided by the book value of equity at year-end.
∆Trading volume is the year-over-year change in the log of annual stock trading volume.
ROA is earning before interest, tax and depreciation divided by total assets.
D is an indicator variable taking the value of 1 when either stock returns or change in earnings are negative, and otherwise zero.
Sentiment is the investor and consumer sentiment as captured in the Michigan consumer sentiment annual index.
Maturity refers to the time to maturity of the options as of the fiscal year-end. We exclude firms with less than one year of maturity and winsorize the upper bound of maturity to 10, even if the estimated maturity exceeds 10 years.
Age is the CEO’s age.
SFAS 123 is an indicator variable taking the value of 1 for the post-SFAS 123 period, and 0 otherwise.
Effective 2006, the Financial Accounting Standards Board (FASB) introduced Statement SFAS 123(R) that required companies to expense the Black-Scholes value of options granted in their annual income statements. This could arguably make stock options less popular. We code SFAS 123 (R) as an indicator variable of 1 for the post SFAS-123 period, and 0 otherwise.
Following Leone et al. (2006), we introduce D as an indicator variable that equals 1 if the market-adjusted return or change in earnings is negative, and 0 otherwise (where market return is defined as CRSP-value-weighted index). Prior research has appropriately asked whether CEOs’ decisions to exercise their options differ when stock price changes reflect fundamentals versus when they do not reflect fundamentals. Exercising more options when stock prices change due to non-fundamentals would make the executives appear as noise traders. We therefore introduce stock returns (ROA) and the interaction of ROA with D (i.e., ) as control variables.
We also estimate the impact of bubble duration on CEO option exercise behavior by replacing Bubble with Bubble-Duration in Model 2. Bubble and BubbleDuration are not both included simultaneously because of their high correlation as reported in Panel B of Table 1.
5. Empirical Results
The empirical results consists of three parts. The first part describes the main research results, the second part discusses the robustness of the results and the third part elaborates on the analysis and relevance of the results.
5.1. Results
Table 4 reports the main results of our Model 1 that examines the association between CEOs’ option exercises and firm-specific bubbles. Since the frequency of firm-specific bubbles may be influenced by the dot-com bubble for technology firms during the late 1990s and early 2000s, we test our models separately for the entire 30-year period (1992–2021) in columns 1 and 2, and for the 21-year post dot-com period (2001–2021) in columns 3 and 4.
Table 4.
The impact of bubbles and crashes and duration on option ratio.
The coefficient for Bubbles is positive and statistically significant at the 1% level for the entire 30-year period (1992–2021), as well as for the post dot-com bubble period (2001–2021). This confirms that our H1 is not rejected at statistically conventional levels.
CEOs generally exercised a larger proportion of their exercisable options when their employers were larger in size (as measured by log of total assets). This may reflect that large firms have more formally established ESO programs where new options are granted at a predictable frequency (often annually), thereby nudging executives to exercise a larger proportion of the outstanding ESOs each year. Larger option grants by larger firms may also make executives more likely to exercise more of their exercisable options each year to keep themselves diversified as investors.
The coefficient on the change in trading volume is also positive and statistically significant for the overall period. This suggests that CEOs exercising a larger proportion of their exercisable options may face less scrutiny in firms with larger trading volumes and larger changes in trading volume. Furthermore, a larger trading volume may allow larger levels of option exercise without insider trades influencing stock prices. However, the effect of trading volume on the proportion of (exercisable) options exercised is also statistically significant for the post dot-com bubble period.
Profitability, as measured by ROA, is positively associated with option exercises, suggesting that such profits are likely to be reflected in a higher stock price that makes option exercises more profitable. However, stock returns and the associated interaction terms——offer no explanatory power for CEOs’ option exercise decisions. This suggests an asymmetric tendency for CEOs to exercise their options during bubbles but avoid exercising their options (or exercising a negligible portion of exercisable options) during bear markets—consistent with Leone et al. (2006).
Similar to Klein and Maug (2020), we find that investor sentiment is negatively associated with option exercises in all periods, reflecting CEOs’ beliefs that high sentiment indicates higher future stock prices, and therefore, a reason to delay option exercises.2 This is consistent with Huang et al. (2022) who find that boards give new options with shorter vesting periods in years of high consumer sentiment. Prior research also shows that executive option exercises are related to stock returns and stock price levels that exceed past highs and lows (see Heath et al., 1999). Huang et al. (2022) also find that executive option exercises are associated with investor sentiment.
The maturity of an option is positively associated with the option ratio for both the entire period as well as the post-bubble period. This indicates that executives delay the exercise of their vested options because they are aware that option values increase monotonically with time to maturity. CEO Age is positively associated with option exercises, suggesting that older CEOs may have lower risk aversion, perhaps due to having built more wealth and more diversified portfolios over time.3 We also find that option exercises increased in the post-SFAS 123 period, indicating that executives increased their option exercises once their employers had to expense the economic cost of the options at grant date. Most other independent variables are statistically insignificant or only marginally significant in some time periods (columns).
Columns 2 and 4 of Table 4 report the main results of Model 2 where Bubble Duration replaces Bubble existence. The main result shows that CEOs exercise a larger proportion of their exercisable options as the duration of a bubble increases, thereby confirming that our H2 is not rejected at statistically conventional levels. However, it is not clear at what stage of the bubble the CEOs exercise their options. CEOs may exercise early to take advantage of stock price momentum, not knowing when it may end. To test for the timing of exercise within the bubble period, we introduce eight indicator variables for the nine stages of duration in our Model 2.
Table 5 reports only seven stages of the bubble duration after we exclude stage 8 for reasons of multicollinearity. The coefficient on Bubble Duration of 1–4 years is positive and statistically significant at the 1% level for the entire 30-year sample period as well as for the post dot-com period (2001–2021). The coefficients on bubble duration in later years of bubble episodes are slightly larger compared to earlier years of bubble episodes, although the variation in these coefficients is small. This suggests that CEOs may exercise a larger share of their exercisable options to capitalize on price momentum, while robustness tests (shown later) indicate that their exercise behavior typically falls within a 3 to 4-year timeframe of the bubble episode. This is consistent with the finding of Izhakian and Yermack (2017) who show that “ambiguity increases the tendency for executives to exercise early”.
Table 5.
The impact of bubble duration on option ratio.
Both Model 1 (with Bubble) and Model 2 (with Bubble Duration) have the same independent variables that are found to be statistically significant at conventional levels. Overall, our results confirm that CEOs seem to be aware of stock bubbles for their organization and exercise a greater proportion of their exercisable stock options in the bubble years. CEOs are likely to exercise early to take advantage of stock price momentum, not knowing when it may end.
5.2. Robustness Tests
We conduct a set of robustness tests based on sample restrictions and alternative measures used. First, we replace our proposed option ratio measure with an intrinsic value approach. The intrinsic value of ESOs is denoted by $n ( – X) where n is the number of options, is the stock price at exercise date, and X is the exercise price. Following Klassen and Mawani (2000), the intrinsic value of the option ratio is determined as follows:
The results of this alternate dependent variable are reported in Table 6 and examine the timing of exercise within the bubble period based on the duration of the bubble. The results in Table 6 are qualitatively similar to those reported in Table 5. The coefficients for Bubble Duration of 1 year, 2 years and 3 years are all positive and statistically significant, either at or below the 5% level, for the entire 30-year sample period as well as the post-dot-com period (2001–2021).
Table 6.
The impact of bubble duration on intrinsic value of option ratio.
The results of Table 7 shows the association between the intrinsic value of the option ratio and bubbles/crashes. The results show CEOs exercising a larger proportion of their exercisable options during bubble periods, while the proportion of exercisable options exercised during a firm-specific crash does not seem to be associated with the existence of a firm-specific crash.
Table 7.
The impact of bubbles and crashes on intrinsic value of option ratio.
Following Izhakian and Yermack (2017), we also include Log (stock price/exercise price) as a robustness test in our model as a control variable and re-estimate the model. The reported results in Table 8 show that the effect of this variable on the option ratio is positive and significant at the 1% level, consistent with the estimates of Izhakian and Yermack (2017). Most importantly, the association between the bubble and the option ratio is still positive and statistically significant at the 1% level, while the association between crash and the option ratio is negative and significant at the 5% level.
Table 8.
The ratio of stock price to exercise price as the mediating variable.
Our third robustness test focuses on earnings management as a means to inflate earnings, and therefore the stock price, prior to exercising options. Bartov and Mohanram (2004) and Brockman et al. (2010) suggest that CEOs are more likely to strategically manage earnings prior to exercising their options. This practice relies on information asymmetry between management and shareholders and may be implemented by controlling information disclosures before stock option exercises. Kadan and Yang (2016) confirm that in-the-moneyness of newly granted stock options and cumulative stock returns are strongly correlated with both earnings management and insider trading in vesting years. However, Dai et al. (2024) suggest that the options markets promote price efficiency not only by incorporating private information from informed traders, but also by incentivizing managers to disseminate less manipulated information. Lee et al. (2011) examine companies listed on the Korean stock exchange to document that higher values and price incentives for executive stock options are associated with higher earnings management. Their results imply that executives manage firms’ reported earnings to maximize their own gains around stock option exercises. We therefore employ earnings management as an additional control variable to validate our findings in the robustness checks.
Typically, earnings management is achieved via accrual-based manipulation, defined as the difference between net income and cash from operations. However, using total accruals as a proxy for earnings management is problematic because firms can have high accruals for other reasons such as growth in sales (an increase in receivables) or additions to property, plant and equipment (an increase in depreciation). We use the discretionary accruals measure of earnings management developed by Jones (1991) and reinforced as a valid measure by Dechow et al. (1995) and Bartov et al. (2000).
The results of our estimates are reported in Table 9, showing that the association between the option ratio and the bubble remains positive and statistically significant at the 1% level for the whole period as well as for the post dot-com period. The effect of the bubble diminishes but remains significant at the 10% level for the alternate option valuation ratio during the post dot-com period. Our unreported results show that the effect of earnings management on the option ratio is significant at the 1% level for the whole period when we exclude the bubble from the regression equation. However, the positive association between the option ratio and earnings management becomes statistically insignificant at the 10% level when we include the bubble variable in the regression model. This suggests that existence of bubbles inferable by CEOs offers an alternative explanation to earnings management as a factor associated with CEO option exercise.
Table 9.
Option ratio not impacted by earnings management.
We also consider whether CEOs may engage in releasing optimistic earnings forecasts that could contribute to creating bubbles. This could create a two-way relationship between bubbles and option exercises. However, our 2SLS regressions offer the same qualitative results, suggesting that our results are robust to endogeneity concerns.
5.3. Analysis
Our findings suggest that CEOs are able to recognize when their firm’s stock is overvalued and deviating from its fundamental value, and they act opportunistically by exercising more of their stock options during such inflationary periods. Furthermore, our results show that CEOs exercise a larger proportion of their exercisable options as the duration of a bubble increases. Additional evidence suggesting that CEOs exercise a larger share of their exercisable options early to capitalize on price momentum, given the inherent uncertainty surrounding bubbles.
CEO actions, such as managing earnings, may contribute to the formation of bubbles. Therefore, we estimate a 2SLS regression to confirm the empirical findings after addressing endogeneity issues. CEOs may react to rising stock prices not related to bubbles or other coinciding factors. Thus, an alternative measure of the option ratio, along with several other control variables such as size, leverage, stock return, stock return volatility, return on assets, sentiment, maturity and CEO’s age are included in estimating the proposed model. After accounting for these factors, the empirical findings do not reject a statistically significant positive association between firm-specific bubbles and CEOs’ option exercise behavior.
6. Concluding Remarks
This study examines whether asset pricing bubbles and their durations impact CEO stock option exercises. While stock options received by executives are optimally exercised at maturity, executives receiving options as part of their compensation often exercise them earlier for reasons such as liquidity or consumption needs, or risk aversion and diversification motives.
This paper extends the literature by examining whether option exercise behavior is associated with the existence of firm-specific stock bubbles. A bubble is a statistical measure that detects an ex-post market exuberance episode arising from a variety of factors such as changes in discount factors, R&D, liquidity of stocks and speculation motives. However, associations between the existence of bubbles and determining factors have been elusive. Shiller’s (1981) analysis leads him to conclude that explosive behavior in stock prices cannot be explained by market fundamentals.
In the presence of a firm-specific bubble, CEOs may exercise a greater proportion of their exercisable ESOs to benefit from the market exuberance that may or may not have a long duration. Our results do not reject our hypothesis that CEOs exercise a higher proportion of their exercisable options in the presence of a firm-specific stock bubble, and that this proportion increases as the duration of the bubble increases. Our results remain robust regardless of how we define the option ratio, and the estimated results remain qualitatively the same under different controls.
In contrast, the proportion of exercisable options exercised during a firm-specific crash seems to have little or no association with the occurrence of a firm-specific crash. This may suggest that other motives such as signaling confidence in their employer may explain why CEOs exercise their options at no (significant) lower level during a crash.
Future research could examine whether investors can infer firm-specific bubbles by examining CEOs’ option exercise behavior, or to test CEOs’ ability to forecast bubbles and bubble durations. It would be interesting to understand when executives are able to anticipate or forecast their firm-specific bubbles.
The analysis presented in this paper could be enhanced by incorporating bubble data estimated from monthly real stock prices along with monthly financial fundamentals. However, due to a lack of monthly data availability, we need to rely on annual financial information in our analysis. While we acknowledge these limitations, we do not anticipate a significant alteration in the conclusions drawn from our findings.
The analysis conducted in this paper can be extended in a number of ways. First, current research could be extended by examining a CEO’s overconfidence, often reflected in a more optimistic tone in press releases regarding the firm’s strategies and future prospects. This, in turn, can lead to a surge in the stock price, and during such inflationary periods, CEOs may exercise a higher proportion of their granted options.
Author Contributions
Conceptualization, S.S. and A.M.; methodology, S.S. and A.M.; software, S.S.; validation, S.S.; formal analysis, S.S. and A.M.; investigation, S.S. and A.M.; resources S.S. and A.M.; data curation, S.S.; writing, A.M. and S.S.; visualization, S.S.; project administration, S.S. and A.M.; funding acquisition, A.M. All authors have read and agreed to the published version of the manuscript.
Funding
This research was funded by the Social Sciences & Humanities Research Council of Canada grant number 511762.
Institutional Review Board Statement
Not applicable.
Informed Consent Statement
Not applicable.
Data Availability Statement
Data available in a publicly accessible repositories.
Acknowledgments
Financial assistance from the Social Sciences & Humanities Research Council (SSHRC) of Canada is gratefully acknowledged.
Conflicts of Interest
The authors declare no conflict of interest.
Appendix A
Table A1.
Definitions of variables and data sources.
Table A1.
Definitions of variables and data sources.
| Variable | Definition | Source |
|---|---|---|
| Dependent Variable | ||
| Option ratio | The number of options exercised is divided by the sum of the number of options exercised and the number of options exercisable. | ExecuComp |
| Independent Variables | ||
| Bubble | A firm-specific indicator variable which takes the value of 1 for bubble episodes and zero otherwise. | |
| Bubble/crash duration | The origin-to-burst time in years of the explosive episodes in real stock prices. | |
| Leverage | Ratio of long-term debt to total assets | Compustat |
| Crash | A firm-specific indicator variable that takes the value of 1 during an explosive episode based on the GSADF statistical procedure with the cumulative real return of that episode showing a negative return, and 0 otherwise. | |
| MVE/BVE | Ratio of market value of equity to book value of equity. | Compustat |
| ROA | Return on assets, calculated as ratio of earnings, before interest tax, and depreciation to total assets at end of year. | Compustat |
| Size | Log of total assets. | Compustat |
| Stock Return | Annualized real stock return for current period. | CRSP |
| Return Volatility | Annual standard deviation of returns is calculated from monthly real stock returns. | CRSP |
| Stock price | Monthly real stock prices used for bubble computation. | CRSP |
| ∆Trading volume | Year-over-year change in the log of annual stock trading volume. | CRSP |
| ROA | Earnings before interest, tax, and depreciation divided by total assets. | Compustat |
| Sentiment | The Michigan consumer sentiment yearly index | http://www.sca.isr.umich.edu/ accessed on 30 June 2024 |
| Maturity | Time to maturity of the options as of the fiscal year end. | ExecuComp |
| Exercise price | Exercise price of the option | ExecuComp |
| Age | Age of CEO | ExecuComp |
| SFAS (R) | An indicator variable taking the value of 1 for the post-SFAS 123 period, and 0 otherwise | |
| D | Indicator variable coded 1 when either stock returns or change in earnings is negative, and zero otherwise (where market return is defined as CRSP-value-weighted index) |
Notes
| 1 | While a potential anchor is the price paid for the option, it does not apply to ESOs since employees do not pay for their ESOs. |
| 2 | Qiu and Welch (2006) find a strong positive correlation between the MCSI and the Survey of Investor Sentiment conducted by UBS/Gallup and show that changes in the MCSI explain excess returns on small stocks. |
| 3 | CEOTenure was also included as a control variable in the model, with results qualitatively similar to CEOAge. However, CEOTenure was later excluded due to multicollinearity with other control variables. |
References
- Aboody, D., Hughes, J., Liu, J., & Su, W. (2008). Are executive stock option exercises driven by private information? Review of Accounting Studies, 13, 551–570. [Google Scholar] [CrossRef]
- Abreu, D., & Brunnermeier, M. K. (2003). Bubbles and crashes. Econometrica, 71, 173–204. [Google Scholar] [CrossRef]
- Alldredge, D. M., & Blank, D. B. (2024). Insider trading in multinational firms. European Financial Management, 30, 314–345. [Google Scholar] [CrossRef]
- Barro, R. J., & Ursúa, J. F. (2017). Stock-market crashes and depressions. Research in Economics, 71, 384–398. [Google Scholar] [CrossRef]
- Bartov, E., Gul, F. A., & Tsui, J. S. L. (2000). Discretionary accruals models and audit qualifications. Journal of Accounting and Economics, 30, 421–452. [Google Scholar] [CrossRef]
- Bartov, E., & Mohanram, P. (2004). Private information, earnings manipulations, and executive stock-option exercises. The Accounting Review, 79, 889–920. [Google Scholar] [CrossRef]
- Bhattacharyya, N., Mawani, A., & Morrill, C. (2008). Dividend payout and executive compensation: Theory and evidence. Accounting and Finance, 48, 521–541. [Google Scholar] [CrossRef]
- Black, F., & Scholes, M. (1973). The pricing of options and corporate liabilities. Journal of Political Economy, 8, 637–654. [Google Scholar] [CrossRef]
- Bova, F., & Vance, M. (2019). Uncertainty avoidance and the timing of employee stock option exercise. Journal of International Business Studies, 50, 740–757. [Google Scholar] [CrossRef]
- Brockman, P., Martin, X., & Puckett, A. (2010). Voluntary disclosures and the exercise of CEO stock options. Journal of Corporate Finance, 16, 120–136. [Google Scholar] [CrossRef]
- Carpenter, J. N., Stanton, R., & Wallace, N. (2019). Employee stock option exercise and firm cost. Journal of Finance, 74, 1175–1216. [Google Scholar] [CrossRef]
- Corbeta, S., Lucey, B., & Yarovaya, L. (2018). Date stamping the Bitcoin and Ethereum bubbles. Finance Research Letters, 26, 81–88. [Google Scholar] [CrossRef]
- Dai, X., Qiao, Z., & Xia, C. (2024). Options trading and earnings management. Accounting Horizons, 38, 13–34. [Google Scholar] [CrossRef]
- Dechow, P., Sloan, R., & Sweeney, A. (1995). Detecting earnings management. The Accounting Review, 70, 193–225. [Google Scholar]
- Elliott, J., Morse, D., & Richardson, G. (1984). The association between insider trading and information announcements. RAND Journal of Economics, 15, 521–536. [Google Scholar] [CrossRef]
- Faulkender, M., Flannery, M. J., Hankin, K. W., & Smith, J. M. (2012). Cash flows and leverage adjustments. Journal of Financial Economics, 103, 632–646. [Google Scholar] [CrossRef]
- Goergen, M., Renneboog, L., & Zhao, Y. (2019). Insider trading and networked directors. Journal of Corporate Finance, 56, 152–175. [Google Scholar] [CrossRef]
- Gong, R. (2023). CEO overconfidence and the tone of press release. Accounting and Finance, 63, 2081–2108. [Google Scholar]
- Guay, W. (1999). The sensitivity of CEO wealth to equity risk: An analysis of the magnitude and determinants. Journal of Financial Economics, 53, 43–71. [Google Scholar] [CrossRef]
- Hall, B. J., & Murphy, K. J. (2002). Stock options for undiversified executives. Journal of Accounting and Economics, 33, 3–42. [Google Scholar] [CrossRef]
- Heath, C., Huddart, S., & Lang, M. (1999). Psychological factors and stock option exercise. The Quarterly Journal of Economics, 114, 601–627. [Google Scholar] [CrossRef]
- Huang, S. X., Keskek, S., & Sanchez, J. M. (2022). Investor sentiment and stock option vesting terms. Management Science, 68, 773–795. [Google Scholar] [CrossRef]
- Huddart, S. (1994). Employee stock options. Journal of Accounting and Economics, 18, 207–231. [Google Scholar] [CrossRef]
- Huddart, S., & Lang, M. (1996). Employee stock option exercises: An empirical analysis. Journal of Accounting and Economics, 21, 5–43. [Google Scholar] [CrossRef]
- Izhakian, Y., & Yermack, D. (2017). Risk ambiguity and the exercise of employee stock options. Journal of Financial Economics, 124, 65–85. [Google Scholar] [CrossRef]
- Jones, J. (1991). Earnings management during import relief investigation. Journal of Accounting Research, 29, 193–228. [Google Scholar] [CrossRef]
- Kadan, O., & Yang, J. (2016). Executive stock options and earnings management: A theoretical and empirical analysis. Quarterly Journal of Finance, 6, 1650003-39. [Google Scholar] [CrossRef]
- Kahneman, D., & Tversky, A. (1979). Prospect theory: An analysis of decision under risk. Econometrica, 47, 263–292. [Google Scholar] [CrossRef]
- Kim, A., & Oh, S. (2024). Outside directors’ insider trading around board meetings. Review of Accounting Studies, 29, 2617–2649. [Google Scholar] [CrossRef]
- Klassen, K., & Mawani, A. (2000). The impact of financial and tax reporting incentives on option grants to Canadian CEOs. Contemporary Accounting Research, 17, 227–262. [Google Scholar] [CrossRef]
- Klein, D., & Maug, E. (2020). How do executives exercise their stock options? The Review of Corporate Finance Studies, 9, 302–339. [Google Scholar] [CrossRef]
- Lambert, R., Larcker, D., & Verrecchia, R. (1991). Portfolio considerations in valuing executive compensation. Journal of Accounting Research, 29, 129–149. [Google Scholar] [CrossRef]
- Lee, K. T., Lee, S. C., & Choi, S. (2011). Relationship between executive stock option exercises and earnings management. Asia-Pacific Journal of Financial Studies, 40, 856–888. [Google Scholar] [CrossRef]
- Leone, A. J., Wu, J. S., & Zimmerman, J. L. (2006). Asymmetric sensitivity of CEO cash compensation to stock return. Journal of Accounting and Economics, 42, 167–192. [Google Scholar] [CrossRef]
- Miao, J., & Wang, N. (2011). Risk, uncertainty, and option exercise. Journal of Economic Dynamics and Control, 35, 442–461. [Google Scholar] [CrossRef]
- Monschang, V., & Wilfling, B. (2021). Sup-ADF-style bubble-detection methods under test. Empirical Economics, 61, 145–172. [Google Scholar] [CrossRef]
- Nanda, V., Prevost, A., & Upadhyay, A. (2023). Risk preferences of gender-diverse boards: Evidence from CEO debt-like compensation. British Journal of Management, 34, 2263–2289. [Google Scholar] [CrossRef]
- Ongsakul, V., Jaroenjitrkam, A., Treepongkaruna, S., & Jiraporn, P. (2022). Does board gender diversity reduce ‘CEO luck’? Accounting and Finance, 62, 243–260. [Google Scholar] [CrossRef]
- Phillips, P. C., Shi, S., & Yu, J. (2015). Testing for multiple bubbles: Historical episodes of exuberance and collapse in the S&P 500. International Economic Review, 56, 1043–1077. [Google Scholar]
- Qiu, L., & Welch, I. (2006). Investor sentiment measures. Working paper. Brown University. [Google Scholar]
- Qu, X., Percy, M., Stewart, J., & Hu, F. (2018). Executive stock option vesting conditions, corporate governance and CEO attributes: Evidence from Australia. Accounting and Finance, 58, 503–533. [Google Scholar] [CrossRef]
- Sarkar, S., & Tuomala, M. (2021). Asset bubbles in explaining top income shares. The Journal of Economic Inequality, 19, 707–726. [Google Scholar] [CrossRef]
- Sautner, Z., & Weber, M. (2009). How do managers behave in stock option plans? Clinical evidence from exercise and survey data. Journal of Financial Research, 32, 123–155. [Google Scholar] [CrossRef]
- Shiller, R. J. (1981). Do stock prices move too much to be justified by subsequent changes in dividends? American Economic Review, 71, 421–436. [Google Scholar]
- Shiller, R. J. (2015). Irrational exuberance. Princeton University Press. [Google Scholar]
- Wu, M. C., Fung, H. G., & Huang, Y. T. (2012). What drives the dating game of executive options exercise? Evidence from Taiwan. Accounting and Finance, 52, 605–625. [Google Scholar] [CrossRef]
- Zeren, F., & Yilanci, V. (2019). Are there multiple bubbles in the stock markets? Further evidence from selected countries. Ekonomika, 98, 81–95. [Google Scholar] [CrossRef]
Disclaimer/Publisher’s Note: The statements, opinions and data contained in all publications are solely those of the individual author(s) and contributor(s) and not of MDPI and/or the editor(s). MDPI and/or the editor(s) disclaim responsibility for any injury to people or property resulting from any ideas, methods, instructions or products referred to in the content. |
© 2025 by the authors. Licensee MDPI, Basel, Switzerland. This article is an open access article distributed under the terms and conditions of the Creative Commons Attribution (CC BY) license (https://creativecommons.org/licenses/by/4.0/).