Abstract
This study explores the impact of environmental, social, and governance (ESG) factors on profitability and market capitalization within the European automotive industry. Since the industry is confronted with environmental and regulatory challenges, ESG contributions are valuable to know for strategic decision making and investor attitude. With panel data from 60 automotive firms listed on the Eurostoxx 600 index from 2011 to 2022, the research utilizes panel regression techniques, such as the generalized method of moments, to control for possible endogeneity. The findings show that the social aspect of ESG has a positive effect on return on assets (ROA), illustrating that socially responsible efforts can strengthen operating performance. In contrast, environmental performance weakly negatively affects ROA, probably because substantial sustainability-related expenses are incurred. Governance has no significant impact on profitability. For market valuation, as captured by Tobin’s Q, social factors are negatively correlated, indicating investor doubt regarding quick returns on social investments, while governance is positively but weakly correlated. These results highlight the multifaceted nature of ESG integration in the automotive industry, with the implication that firms need to delicately trade off between sustainability initiatives and profitability and investor expectations.
1. Introduction
Recent societal, regulatory, and investment trends have solidified the role of environmental, social, and governance (ESG) factors as a crucial aspect of corporate decision making and mainstream investing. ESG is no longer just a buzzword; it has become an integral part of how stakeholders (from consumers to investors) evaluate companies. Recent developments, such as consumers’ growing preference for sustainable products, employees’ demand for ethical workplaces, the European Union’s taxonomy for sustainable activities, and the rising proportion of sustainable investments in asset managers’ portfolios worldwide, illustrate this widespread adoption of ESG principles (Cornell et al., 2021; PRI, 2021). Companies are now expected to create not only shareholder value but for all the stakeholders, including customers, employees, the environment, and society at large (Brockett, 2012). Investors increasingly view strong ESG performance as a key driver of long-term profitability, using it to inform their investment decisions (BlackRock Inc., 2018; Vidovic, 2022). As a result, companies are compelled to assess and report on ESG factors that are financially material to investors, prioritizing those issues that are most relevant to society, the company, and its investors. This materiality assessment draws significant scrutiny from organizations and regulatory bodies, necessitating shareholder disclosure and efficient resource allocation to manage these issues effectively. Providing clear and compelling ESG data helps investors make informed decisions based on long-term value creation.
However, a critical question remains: How does a company’s ESG performance impact its financial performance (FP)? To what extent is a company’s commitment to ESG reflected in its market performance, and does it ultimately lead to financial returns? In other words, does “doing good” translate into “doing well” financially? Investors increasingly use ESG performance to benchmark companies, identifying leaders and laggards within their respective sectors and regions. This benchmarking provides investors with insights into the long-term risks and opportunities associated with a company’s ESG practices (Saberi, 2018).
This study focuses on the automotive industry, specifically examining the sixty largest publicly traded automotive companies, which are part of the Eurostoxx 600 index. The automotive industry is of particular interest due to its significant contribution to global carbon emissions and the increased public and legislative awareness following the Dieselgate scandal and the Paris Climate Agreement in 2015. In 2019, the transportation sector accounted for 14.2% of the global CO2 emissions, with road transportation alone responsible for 12.5%. Despite growing environmental concerns, the number of vehicles on the road is expected to continue increasing. Germany and other European nations, as key producers within the Eurostoxx 600 index, are home to many major automotive manufacturers, underscoring the importance of the sector to the European economy (Barman, 2020). While focusing on a specific industry like automotive may introduce potential data distortions due to sectoral differences, it remains a valuable context to explore ESG performance and its financial implications. The sample of 60 publicly traded automotive companies in the Eurostoxx 600 index ensures the inclusion of large listed players with material ESG reporting obligations and financial disclosure, representative of the European automobile sector. The 2011–2022 time frame was selected to include the run-up to and after inflection points such as the 2015 Dieselgate crisis and the Paris Climate Accord, encompassing the years of growing ESG awareness and regulatory evolution for the sector.
A substantial body of research has examined the relationship between ESG performance and financial outcomes, but studies focused specifically on the automotive sector are scarce, particularly regarding data after 2016. This study aims to contribute to the existing literature by analyzing the latest available data from 2011 to 2022, under the assumption that attention to ESG factors has increased significantly in recent years. Using Refinitiv data on the 60 largest publicly traded automotive companies, the study will assess the relationship between ESG performance, financial performance, and market performance (MP) through a regression analysis model. This region-specific analysis is particularly relevant for the automotive industry, which is a major contributor to both national economies and greenhouse gas emissions within Europe. The year 2015, marked by the Dieselgate scandal and the Paris Climate Agreement, was pivotal in triggering discussions about ESG disclosures in the automotive sector, making post-2015 data particularly relevant for analyzing trends in the environmental sphere.
By examining these data, the study will confirm or challenge assumptions from previous non-sector-specific studies and offer insights into best practices within the automotive sector. Differences between companies in the sector may also yield valuable recommendations for the future, providing a clearer understanding of how the automotive industry is adapting to the growing importance of ESG factors.
This study offers several contributions to the literature through a series of novel directions: Firstly, whilst a great deal of ESG research has been undertaken across numerous industries, this paper offers a concentrated examination of the European auto sector, which is one of the sectors most extensively examined with respect to environmental regulation and social pressure. Second, the study uses a longer time series of 2011–2022, which allows us to test for ESG impacts in the context of evolving regulatory and investor pressures, such as post-Dieselgate. Third, with a twin econometric approach—panel regressions and the generalized method of moments (GMM)—the study enhances methodological robustness and addresses endogeneity concerns more completely than previous sector-specific research. Lastly, this research disaggregates ESG into its individual sub-dimensions (environmental, social, and governance), allowing for a more detailed exploration of the particular effects of each dimension on financial and market outcomes. These aspects separate the current research from the broader literature on ESG and finance and offer valuable insight for corporate managers and investors in the auto industry.
2. Theoretical Background
Collecting environmental, social, and governance data has become a crucial aspect of corporate analysis, investment decision making, and regulatory compliance. As global markets increasingly recognize the long-term impact of sustainability factors on financial performance, ESG data have transitioned from a niche concern to a fundamental component of business strategy and risk management. In response to this growing importance, the development of ESG datasets has evolved significantly, driven by investor demand for standardized, transparent, and comprehensive sustainability data. A key trend in this evolution is the increasing standardization and regulatory alignment of ESG metrics with international frameworks such as the Global Reporting Initiative (GRI), Sustainability Accounting Standards Board (SASB), Task Force on Climate-related Financial Disclosures (TCFD), and the EU Taxonomy for Sustainable Activities. This ensures that ESG datasets comply with regulatory requirements and global best practices, making them more relevant for investment decision making.
A key trend in ESG data development is the shift toward greater transparency and the use of alternative data sources to enhance corporate sustainability assessments. While self-reported ESG disclosures remain central, datasets now incorporate satellite imagery, media sentiment analysis, AI-driven risk assessments, and supply chain data to provide a more accurate representation of corporate performance across the three ESG pillars outlined in Table 1.

Table 1.
Key material factors in ESG assessment.
For the environmental (E) category, alternative data sources help verify corporate claims on resource use, emissions, and environmental innovation. For example, satellite imagery can track deforestation or pollution levels, while AI-powered analysis can detect discrepancies in reported carbon emissions.
In the social (S) category, controversy and sentiment analyses play an increasing role in evaluating workforce practices, human rights policies, community engagement, and product responsibility. Monitoring media reports and legal actions allows ESG datasets to adjust company scores dynamically, reflecting reputational risks that may not be captured in official disclosures.
Within the governance (G) category, the integration of ESG factors with financial metrics has become crucial for investors. Risk-adjusted ESG scores now influence credit risk models, portfolio strategies, and corporate valuations, linking governance quality—such as board structure, shareholder rights, corporate ethics, and risk management—to financial performance.
Among ESG data providers, Thomson Reuters Refinitiv ESG holds a dominant position due to its global coverage, rigorous methodology, and integration with financial analytics platforms. Offering absolute ESG scores and controversy-adjusted ratings, it serves as a vital tool for institutional investors, asset managers, and regulators. With seamless integration into platforms like Refinitiv Eikon, it remains one of the most comprehensive datasets for assessing corporate sustainability performance across all E, S, and G dimensions.
ESG factors can present risks and opportunities that influence a company’s risk profile, financial performance, reputation, long-term valuation, consumer satisfaction, and product sustainability. Recent high-profile incidents of ESG misconduct, such as the Volkswagen Diesel scandal and the Deepwater Horizon oil spill, illustrate the severe financial and environmental repercussions these issues can have (Barman, 2020). Conversely, engaging in ESG activities can generate significant value. In an era where human capital is a crucial competitive advantage, companies that build a reputation based on strong working conditions, high ethical standards, and diversity are better positioned to attract skilled employees. These activities enhance brand loyalty and customer retention and contribute to employee satisfaction, reducing turnover and making the company more attractive to top talent (GSIA et al., 2020).
The Global Sustainable Investment Alliance reports that the integration of ESG factors into financial analysis is the most common sustainable investing strategy used today (PRI, 2021). However, challenges remain, such as limited access to non-financial metrics and inconsistency in data across sectors and regions. Unlike financial reporting, where standardized frameworks like the International Financial Reporting Standards (IFRS) are widely adopted, there is no global set of standards for ESG reporting. As a result, ESG score providers have become increasingly important, bridging the gap between complex non-financial data and stakeholders, such as investors, who are committed to sustainable investing.
In Europe, the legislative landscape for sustainability reporting has moved towards mandatory ESG disclosures, making it essential for companies to align their practices with regulatory requirements. This regulatory push has led to increased transparency in ESG reporting, fostering greater accountability and improving the comparability of data across companies and industries.
Theoretical Foundations of ESG and Corporate Performance
There are several theoretical frameworks that offer conceptual underpinnings for explaining the connection between ESG performance and firm outcomes. The stakeholder theory (Deng, 2025) posits that firms generate long-term value by acting in the interests of all stakeholders, rather than solely shareholders. ESG practices, for instance, lowering emissions, investing in employee wellness, or promoting ethical management, are viewed as actions that establish trust, legitimacy, and stakeholder satisfaction—eventually leading to financial performance improvement. The agency theory (Jensen & Meckling, 1976; Zahid et al., 2023) portrays the contrary view with emphasis laid on the managers possibly engaging in ESG initiatives with a view to satisfying personal or reputational agendas at the expense of shareholder value. In this setting, good corporate governance ensures managerial behavior alignment with shareholder wants, hence value maximization in the firm. The legitimacy theory contends that companies implement ESG practices to conform to changing societal expectations and secure their legitimacy in the eyes of stakeholders, regulators, and investors (Darsono et al., 2024). In this perspective, ESG reporting and performance are means to show adherence to societal norms and control reputational risks.
These theoretical foundations offer explanatory support on the anticipated effect of ESG dimensions on financial performance and market performance, hence constituting the conceptual basis of our hypotheses and empirical models.
3. Literature Review
The link between environmental, social, and governance (ESG) performance and corporate financial performance (CFP) has been well researched, especially in the European setting characterized by more developed sustainability legislation, greater investor activism, and greater corporate transparency compared to other regions of the globe (Friede et al., 2015; Amel-Zadeh & Serafeim, 2018). The other widely utilized financial ratio in ESG field studies is Tobin’s Q (TQ), which measures a company’s market value relative to its book value, thus being an indicator of future growth potential and investors’ confidence.
Theoretically, improved ESG performance is anticipated to lead to higher Tobin’s Q by enhancing corporate reputation, reducing risk, and promoting operational efficiency (Clark et al., 2015). However, according to other views, over-investment in ESG initiatives can increase expenses and reduce short-run profitability, which can be detrimental to firm value (Jensen & Meckling, 1976; Bebchuk & Weisbach, 2010). Empirical studies across Europe have investigated these divergent perspectives using panel regression models that control for firm-specific heterogeneity, omitted variable bias, and time-invariant characteristics (Baltagi, 2021; Wooldridge, 2010). This study synthesizes important empirical findings on the association between ESG and Tobin’s Q for European firms and critically examines the methodological approaches used in these studies.
Environmental, as one of the dimensions of environmental, social, and governance (ESG) factors, is particularly crucial for those businesses whose activities directly affect natural resources and ecosystems. Those firms with good environmental performance expose themselves to lower regulatory risks and environmental expenses, which can enhance their financial performance and market capitalization (Zeng & Jiang, 2023). In the agribusiness industry, environmental considerations are extremely important due to the long-term impact of agriculture on soil fertility, water supply, and biodiversity (Velten et al., 2015). The use of sustainable agricultural practices, i.e., precision agriculture, organic farming, and climate-smart agriculture (CSA), can mitigate the environmental footprint of businesses while simultaneously increasing their market value by building greater confidence among investors and consumers (Isakhanyan, 2024). Yet, their implementation is quite limited owing to budgetary limitations and regulatory hurdles (Gemtou et al., 2024). Wang and Sun (2022) stipulate that green law and ESG performance positively influence corporate sustainability innovations. Companies that effectively adopt the ESG principles are considered investment alternatives with minimal risks and enjoy decreased capital expenses (Alareeni, 2020). Further, the disclosure and transparency of ESG promote higher corporate capital valuations in capital markets (Gerber, 2024).
The social aspect of environmental, social, and governance (ESG) metrics includes considerations like labor practices, diversity, stakeholder relations, and general corporate social responsibility. Companies with high social ESG scores are typically linked with better reputations, reduced turnover, and increased productivity, all of which can contribute to enhancing Tobin’s Q (Amaral et al., 2023). Studies have shown that firms integrating social responsibility principles into their business models are considered more stable and less risky investments (El Ghoul et al., 2011). Furthermore, the diversity of the board and executives plays a significant role in ESG performance and financial performance. Companies with more diverse management boards are more capable of addressing social concerns and making decisions that fully consider ESG aspects (Alsayegh et al., 2020).
Governance (G) is the most relevant ESG pillar in terms of Tobin’s Q impact (Fatemi et al., 2018). Those firms with good governance structures, transparent decision-making processes, and good ethical standards achieve better market valuations and resilience during crises (Giese et al., 2019). ESG reporting quality also plays a significant role in ESG performance. Firms that frequently and extensively report their ESG outcomes are perceived as less risky investments, which translates into lower capital costs (Au et al., 2023). ESG reporting also allows corporations to recognize areas that need improvement and establish strategic goals that are aligned with compliance standards. Previous research emphasizes that the composition and structure of corporate boards are important determinants of the quality of governance, with direct consequences for corporate decision making and investor sentiment (Farinós et al., 2022; Khan et al., 2024). Board diversity, particularly gender diversity, has been linked to improved decision making, stronger stakeholder relations, and better ESG performance, leading to improved long-term market valuation (Alsayegh et al., 2020; Farinós et al., 2022). Our results offer partial evidence in support of this assertion with a positive, though modest, effect of governance quality on Tobin’s Q. Companies in the auto industry can, therefore, reap benefits by tactically streamlining their board arrangements to enhance value creation.
Two main theoretical frameworks explain the impact of environmental, social, and governance (ESG) considerations on Tobin’s Q. The stakeholder theory, in its formulation by Freeman and McVea (2001), contends that firms with superior ESG performance reap the advantages of more solid stakeholder relations, adherence to regulatory stipulations, and reduced vulnerability to threats, all of which are reflected in higher firm value and Tobin’s Q (Eccles et al., 2014; Fatemi et al., 2018). The agency theory, as formulated by Jensen and Meckling (1976), contends that expenditure on ESG initiatives gives rise to higher costs and more managerial discretion, which can diminish profitability and therefore, cause Tobin’s Q to be lower (Bebchuk & Weisbach, 2010; Liang & Renneboog, 2017).
Empirical studies seek to reconcile these perspectives by investigating the possible effect of high ESG scores on the increase in Tobin’s Q, particularly in the European market, where sustainability is increasingly integrated into financial decision making (Giese et al., 2019). There is a substantial body of literature that suggests high ESG scores are linked to an increase in Tobin’s Q, particularly in industries exposed to more stringent regulatory oversight and with strong ESG investor preferences. Fatemi et al. (2018) illustrated that corporate governance (G) has a direct positive effect on Tobin’s Q, while environmental (E) and social (S) aspects have an indirect effect through supporting corporate stability and risk management practices. The authors used the generalized method of moments (GMM) model to address potential endogeneity issues. Furthermore, Giese et al. (2019) investigated MSCI Europe-listed firms and determined that better ESG ratings are connected with more valuable companies and lower costs of capital, giving proof for the hypothesis that investors perceive ESG to be value-adding. The results show that companies with good ESG performance are more highly regarded by investors because they are seen as more sustainable, better governed, and less exposed to regulatory and reputational risk (Friede et al., 2015).
Though most research corroborates a positive ESG-Tobin’s Q relationship, there are others that report mixed or insignificant results and observe that ESG’s impact is contingent on industry composition, firm size, and market conditions. Friede et al. (2015) investigated the ESG performance of European companies and confirmed that the ESG-Tobin’s Q relationship is stronger in times of economic stability but deteriorates in financial crises. They showed through a quantile regression model that high-valued firms benefit more from ESG than lower-valued firms. Eccles and Stroehle (2018) found that ESG acted more as a risk-reduction mechanism than a value-enhancing mechanism. This implies that while ESG can help stabilize firms and build investor confidence, its effect on Tobin’s Q is heterogeneous among firms and in the economy.
The study uses several econometric models to analyze the impact of ESG factors on corporate performance, represented by a firm’s market value, Tobin’s Q (TQ), and the financial profitability measure return on assets (ROA). The explanatory variables include the particular subindices or ESG factors (E, S, and G); financial indicators such as leverage and debt (Leverage, DEBT); firm size (SIZE); capital expenditure (CAPEX); and risk exposure in a form of the total levered Beta (BETA).
Environmental, social, and governance (ESG) metrics have emerged as a key factor in the automobile sector, shaping company strategies, financial performance, and stakeholder relations. Since the late 20th century, the industry has undergone a massive transformation with the accelerated proliferation of electrification, autonomous driving technologies, and shared mobility solutions. This kind of revolution has accelerated the need for sustainable business models, thus rendering ESG an essential building block to facilitate competitive advantage and the long-term sustainability of businesses.
The relationship between ESG performance and corporate financial performance has been explored widely in the academic literature, primarily using the stakeholder theory. Originated by Freeman et al. (2007), the stakeholder theory contends that a firm must consider the interests of all the stakeholders—i.e., customers, suppliers, employees, communities, and investors—to attain stability and long-term value creation (Freeman et al., 2007). The firms that engage in ESG activities demonstrate an intent to meet stakeholder expectations, thereby mitigating the risk of regulatory breaches and reputational harm (Li et al., 2018). Stakeholder theorists argue that stakeholder relations need to be cultivated if profit maximization is to take place successfully in a globalized economy, and this will ultimately generate a competitive advantage for firms (Porter & Kramer, 2006; van Beurden & Gössling, 2008).
Empirical studies mostly validate the proposition that holistic ESG scores have a positive impact on financial performance, especially in the long run (Xie et al., 2019; López-Arceiz et al., 2018). It has consistently been evidenced that good corporate governance, as a component of ESG, is well regarded by stakeholders. Clear and transparent disclosures of ESG—which include profit statements, annual reports, and sustainability reports—help improve company credibility, thereby fostering capital market access along with improved financial performance metrics (Alareeni & Hamdan, 2020). The influence of environmental and social concerns on profitability, however, has greater variability, with some research suggesting that the costs linked with efforts in sustainability in the short run could lead to short-run declines in profitability (Kazakakou Powaski et al., 2022).
Building on this conceptual foundation, the current literature emphasizes the growing significance of ESG integration as a strategic driver in the automotive industry. Sustainability is no longer a mere compliance imperative but also a promoter of corporate resilience, supply chain productivity, and investor trust.
The literature on environmental, social, and governance (ESG) in the automotive sector recognizes the growing significance being accorded to sustainability as a key determinant of business performance, governance structures, and supply chain resilience. ESG factors influence financial performance, adherence to legislation, and stakeholder expectations, and businesses are increasingly incorporating concepts of sustainability into their decision making.
Sustainability, as articulated in environmental, social, and governance (ESG) terms, is a significant factor to quantify in ascertaining organizational performance, and the automotive sector is not any different. ESG influences financial performance, regulatory compliance, and stakeholder expectations, prompting corporations to embody these principles within their strategic decision making.
The role of stakeholders and their engagement take a key position in defining ESG and influencing corporate responsibility, decision making, and revelation within reporting practice. Yeh et al. (2024) analyze the extent to which various stakeholder constituencies—including customers, suppliers, employees, regulators, and investors—influence management control systems designed to align executive incentives with ESG goals. Their findings are that metrics of emissions reduction, human rights compliance, and employee empowerment feature most prominently in supplier retention and executive compensation programs. Board composition and ESG performance have also entered the frame, with particular attention to gender diversity. Khan et al. (2024) discovered positive dependence, considering female manager presence and improved overall ESG performance, focusing on the auto industry. However, the transparency and coherence of ESG reporting remain a problem. Kaminska-Witkowska and Matuszak-Flejszman (2023) argue that the integration of the EMAS environmental reporting system into ESG reporting systems can increase comparability and reduce the administrative burden of scattered regulatory demands.
The particular difficulty with ESG management is the development of stable and standardized key performance indicators (KPIs) that can effectively assess the impact on environmental, social, and governance aspects. Vijaya et al. (2025) suggest applying Fuzzy DEMATEL and Fuzzy TOPSIS approaches to identify the most impactful ESG KPIs for the automotive sector. Dinca et al. (2022) investigate the relationship between ESG scores and company valuation and point out the great impact of governance structures on financial stability.
Other than the governance component, adherence to ESG notions has far-reaching effects on supply chain management because sustainability pledges are being directed towards this component more and more. According to Yang et al. (2024), firms with robust ESG connections exert a positive effect on the productivity of their downstream supply chain partners, thereby confirming the existence of the sustainability spillover theory. Qiu et al. (2024) find that companies embedded in highly networked supply chains experience reduced ESG controversies, while centralized firms are exposed to higher reputational and operational risks. Another connected dimension is the role of insurance companies in enabling ESG compliance in supply chains. A study conducted by Gong et al. (2024) shows that insurance firms have started adopting sustainability-linked approaches, including ESG-weighted tendering and improved cooperation along supply chains, in favor of carbon emission abatement.
Investment choices and company value valuation in the automotive sector have progressively integrated environmental, social, and governance (ESG) performance indicators. Rossi et al. (2020) report significant positive correlations between environmental and governance dimensions and companies’ market value, with social dimensions having a comparatively lower effect. Stefanoni and Voltes-Dorta (2021) adopt a more quantitative stance. They apply Data Envelopment Analysis (DEA) to analyze efficiency models that also consider sustainability dimensions pertaining to ESG. Their findings are that efficiency measurements considering such a factor outperform traditional financial metrics. Similarly, Glova and Slyvkanyc (2024) confirm that governance dimensions add value to the long-term market valuation compared to the short-term financial drawback of environmental performance.
Corporate communication plans regarding environmental, social, and governance (ESG) achievements are necessary to shape public opinion and build brand equity. Lee et al. (2022) examine how automotive companies communicate their ESG commitments. They mainly employ advertisement, social media engagement, and research and development investment. The researchers reveal that these efforts significantly enhance brand equity. Moreover, Choi and Cho (2021) examine CEO communications, finding that the use of sustainability-themed vocabulary in executive messaging is an important distinguishing factor between successful automotive firms.
Sustainability accounting, emissions reduction, and the responsible management of resources are at the core of ESG reporting. Tóth et al. (2024) analyze the application of life cycle assessment (LCA) methodologies such as the GREET model in approximating the greenhouse gas (GHG) emissions, revealing substantial disclosure gaps in sustainability communications of companies. Securing a stable supply of raw materials for electric vehicle (EV) production. Petavratzi and Gunn (2023) refer to the lengthy lead times in acquiring raw materials such as lithium and cobalt, which are supply chain vulnerability issues. Martins et al. (2024) speak about incorporating sustainable materials into the production of automotive parts. They also talk about potential developments despite Brazil’s current technological and logistical constraints.
Becoming carbon neutral in the automobile sector needs deep structural and regulatory changes, as noted by Srivastava et al. (2025). They also suggest the adoption of a strategic framework to facilitate the incorporation of ESG principles in the Indian automobile aftermarket sector to smooth transitions toward sustainability. Furthermore, Maehara et al. (2022) note the need to recognize the contribution of intellectual property to advancements in ESG. They also look at patent trends related to decarbonization and summarize the automotive sector as a trendsetter in innovation driven by sustainability. Förster and Mischo (2022), in their study, emphasize the necessity of standardized systems of sustainability certification in fulfilling ESG commitments across worldwide operations.
The shifting nature of environmental, social, and governance (ESG) reporting, along with the investment trends within green technology, highlights the changing face of sustainability reporting. When examining green investment by companies, Tóth et al. (2024) highlight that companies mostly report such endeavors as a way of mitigating reputational risks. In addition, Molnár et al. (2024) look into how energy consumption correlates with adherence to ESG reporting standards. Based on this study, they identify that higher energy consumption is linked to lower adherence to Global Reporting Initiative (GRI) standards. The tone of linguistic reporting in ESG reports is also important, as shown by Beretta et al. (2021). As can be seen, firms with more ESG involvement utilize more positive and engaging language in their sustainability reporting. Along with traditional ESG reporting, digital innovation and man–machine interactions also constantly influence sustainability strategies.
Based on recent societal, regulatory, and investment trends, as well as findings from the existing literature, the following hypotheses are formulated and examined:
Ha:
Environmental, social, and governance performance positively affects the financial performance of firms active in the European automotive industry as measured by return on assets (ROA).
Hb:
Environmental, social, and governance performance positively affects the market value of firms active in the European automotive industry represented by Tobin’s Q (TQ).
The recent evolution within the area of ESG investing in Europe, along with the revolutionary trends within the automotive sector in the wake of the Diesel scandal, reflects that there has been a noteworthy shift in stakeholders’ and investors’ attention towards ESG issues. This shift is characterized by stakeholders utilizing ESG information to enhance their analytical framework for additional research and for greater engagement with companies. This hypothesis aligns with the struggles currently faced by the automobile sector in the midst of climate change and more stringent emissions policies. In addition, the PRI (2021) report infers that climate change risks are the foremost environmental, social, and governance (ESG) concern that must be addressed by investors in a bid to identify and manage a variety of risks—be they organization-specific, industry-specific, or systemic—while facilitating stock valuation and monitoring. Thus, as proposed, the literature needs to examine the separate influence of levels of ESG sub-categories on a firm’s (financial) performance.
The environmental score is intended to serve as an indicator of a company’s involvement in environmental initiatives, such as greenhouse gas emissions reduction, a matter of pivotal concern in the motor vehicle industry, as noted in the introduction section. Research by Alareeni and Hamdan (2020) indicates that the environmental score contributes most to financial performance in the automobile industry (Velte, 2017).
4. Data and Research Method
The main aim of this paper is to examine the influence of the ESG performance of car companies on financial performance and market value. There are numerous companies in the automobile industry; however, according to the paper’s scope, we are relying on our dataset, which comprises sixty of the largest European publicly traded firms and members of the Eurostoxx 600 stock index. In order to enable assessment, multiple regression analysis is performed using the R statistical software, focusing specifically on the plm package.
4.1. Data
The study analyzes the European context using data from sixty publicly traded European companies active in the automotive industry, constituents of the Eurostoxx 600 index, a broad measure of the European equity market. The data were extracted from 2011 to 2022 to conduct a panel data analysis of twelve years, in total 720 observations for each of the variables. The data of all the dependent variables, independent variables, and control variables are collected from the Refinitiv Eikon DataStream database. The chosen time frame allows the research to illustrate long-term ESG development during both stability and instability in the markets, and major policy reforms and reputation issues. The Eurostoxx 600 companies were chosen based on size, quality of information disclosed, and extensive impact in developing ESG strategies for the European automotive sector.
Before conducting panel regression, the dataset was prepared by addressing missing values and measuring corporate risk. The missing values were handled using the Multiple Imputation (MI) method, applied separately for each sector to account for sector-specific characteristics and reduce bias (Little & Rubin, 2019). Fifteen imputations per sector were performed in R Studio 2024.04.1 Build 748 using the mice package, exceeding the standard five imputations for improved accuracy (Schafer & Graham, 2002). The missing data, primarily affecting ESG variables and financial indicators, were assumed to be “missing at random” (MAR) and imputed using Bayesian regression models (Rubin, 1987). This sector-specific approach preserved variable relationships and minimized systematic bias, ensuring robust and reliable estimates (Friede et al., 2015). We also utilized beta coefficients (total levered beta) from the Damodaran sectoral dataset.
4.2. Variables
The dependent variables in this regression were return on assets (ROA) and Tobin’s Q (TQ), commonly used as proxies to measure financial performance and market performance. ROA is calculated as net income divided by the average total assets of a fiscal year and is expressed in percentage. In line with prior studies, Tobin’s Q is calculated as the ratio between the market value of equity and total liabilities on the one hand and total assets on the other hand (Abdi et al., 2020). As the effects might not be noticeable immediately, one-year lagged variables of ROA and Tobin’s Q were also used and tested to evaluate the impact of ESG performance. Unfortunately, the results do not seem to be significant using one-year lagged data.
The main independent variables were the ESG score and sub-scores, which are a proxy for a company’s ESG performance. The main independent variable was the combined ESG score sourced from the Refinitiv Eikon dataset which is a leading global provider of ESG metrics and data services. Their ESG score resulted from a sector-specific and data-driven analysis of corporate performance on financially material ESG issues. Information was sourced from publicly available data like sustainability or integrated group reports, news-based controversies, and activities of non-governmental organizations, which were then translated into over 250 non-financial metrics that refer to three spheres of ESG: The environmental sphere covers topics like emissions, environmental stewardship, resource use, environmental solutions, waste, water, and environmental management by business activities. The social topics are diversity, occupational health and safety, training and development, product and or service access for disadvantaged communities, community relations, product quality and safety, human rights, labor rights, compensation, and employment quality. The governance topics include business ethics, corporate governance, disclosure transparency, forensic accounting, and capital structure (GSIA et al., 2020). These data were finally aggregated into an overall ESG score (also considering controversies), which was used as a proxy for a company’s ESG performance. In addition, Refinitiv offers E scores, S scores, and G scores for the sub-categories, which are useful as the ESG score is a multidimensional index combining the three dimensions of ESG. Thus, another opposing dimension might eliminate the impact of one dimension. To identify the main driver for ESG impact in the regression analysis and test, it was also necessary to have separate sub-category data available. The scores were scaled between 0 and 100, with higher scores indicating better performance. Data from Refinitiv offers historical scores dating back to 2011.
Financial and market performance variances can be attributed not just to the ESG score, thus, control variables should be added. Control variables might not be the focus of the study, but their effect on the dependent variables cannot be ignored. They, thus, play a role in the rise in explained variance in a regression model. The existing body of literature indicates the presence of multiple control variables. Initially, control variables associated with both systematic and unsystematic risk were incorporated, as they are anticipated to influence financial performance. Systematic risk was quantified by a firm’s beta coefficient (BETA), which serves to regulate an equity’s price fluctuations in relation to market movements. Unsystematic risk was captured by the debt ratio (DEBT), which equals total liabilities over total shareholders’ equity and is a measure of the leverage of a firm. It is anticipated that firms with excessive financial leverage are more prone to financial distress and a decrease in profitability (Li et al., 2018). But, Abdi et al. (2020) contend that low-growth firms with stable cash flows and tangible assets such as automobile manufacturers tend to carry high financial leverage, which may not be detrimental.
A company’s size (SIZE) should be controlled by the natural log of its total assets. The noted positive effect can be explained by the fact that larger companies have more resources to devote to ESG initiatives and non-financial reporting. Moreover, it is expected to benefit from economies of scale or scope that are difficult to imitate. On the other hand, a negative effect related to size can be linked with costly structural adjustments and complex decision-making procedures. Capital expenditure (CAPEX) was also one of the possible control variables and was calculated by dividing net capital expenditure by revenue.
4.3. Models
A multiple regression analysis was executed in the statistical software R (primarily with the plm package) to investigate the relationship between a company’s ESG performance and its corporate performance. The multiple regression design aimed to find the best-fitting model to explain the behavior of dependent variables in response to changes in the independent variable based on the observed data. A Pooled Ordinary Least Squares or pooled OLS (POLS) model was used as a base model. In addition, panel regression in the form of a fixed or random effect panel was conducted as well as provided in the following text.
Before applying the POLS model, five assumptions regarding the model’s specification should be tested to ensure the coefficient estimates are unbiased (Han et al., 2016). Firstly, the linearity of the coefficients and error terms of the regression were tested. For this, a Ramsey Reset test was conducted with the null hypothesis claiming that there is no omitted nonlinearity. This hypothesis was rejected, as the resulting p-value was smaller than 0.0000, which implied that the model was indeed suffering from some omitted variables or misspecification. However, scatter plot diagrams of ROA and Tobin’s against the total ESG indicated a slight positive linear relationship in the case of the market value and slightly negative in the case of the profitability variable ROA (Figure 1).
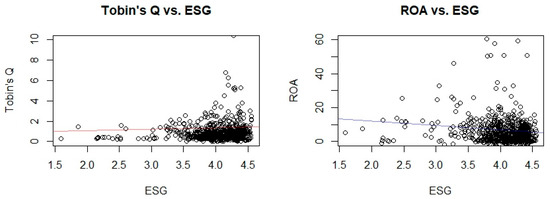
Figure 1.
Scatterplot of Tobin’s Q versus ESG (left) and ROA versus ESG (right). Source: own elaboration.
Furthermore, the error term should have a population mean of zero. This can be tested by using a histogram of the model’s residuals and comparing it with the famous normal distribution. We see in Figure 2 the residual distribution of the model, which should center around zero. We also extended the visual aspect with the Shapiro–Wilk and Anderson–Darling normality tests, which are two very reliable tests for normality. The low p-values of both models’ residuals indicated that the null hypothesis of a normal distribution was not rejected, and the assumption regarding normality was fulfilled. We also applied the Jarque–Bera normality test, where the low p-values of the Jarque–Bera test indicated that the skewness and kurtosis of the test were not significantly different from their expected values for normal distribution. Thus, the distribution of the model residuals of both models seems statistically not different from a normal distribution.
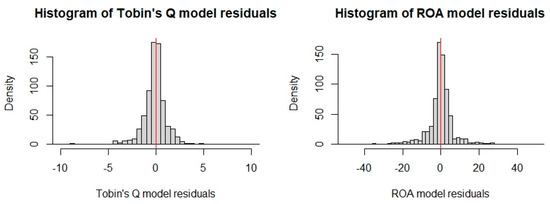
Figure 2.
Histogram of residuals of Tobin’s Q (left) and ROA (right). Source: own elaboration.
Next, endogeneity concerns should be addressed by looking at the correlation between the residuals and all the explanatory variables. No significant correlation between the residuals and any variable was identified for these models. This is a sign of homogeneity, meaning that disturbances have the same variance and are unrelated to any independent variable.
An OLS model should demonstrate a constant variance instead of an escalating variance. This can be tested by White’s test with the null hypothesis that there is no heteroscedasticity. We found a p-value of 0.3859 for the ROA model, which gave us a reason to reject the null hypothesis and confirm homoscedasticity. In contrast, a p-value at 0.03947 was found for Tobin’s Q model, thus confirming heteroscedasticity and reducing the precision of the estimates in the OLS regression.
Finally, multicollinearity should be addressed. The results of the Pearson correlation matrix are visualized below in Table 2. The results have not revealed any significant multicollinearity concern among the ESG sub-scores. However, we also decided to use a variance inflation factor test for multicollinearity issues.
Table 2.
Pearson’s correlation matrix of all the variables in the regression analysis.
VIF values higher than 10 may indicate a collinearity problem. However, our test results in Table 3 revealed that E score, S score, and G score, as well as control variables, do not bear a collinearity problem.
Table 3.
VIF values of variables used in TQ and ROA models.
Unfortunately, we were not able to use the total ESG score due to higher multicollinearity with E, S, and G scores. So, we replaced the total ESG score. This adjustment was also justified by the assumption that the individual sublevel scores might have opposing effects which might be offset by each other and neutralize the impact of the total ESG score. Apart from that, no multicollinearity issues should arise.
To empirically assess the hypotheses regarding the relationship between environmental, social, and governance (ESG) factors and financial performance, the following regression models were proposed. To test Ha and examine the relationship between ESG and financial performance, the following regression model were applied:
where ROA represents return on assets; E, S, and G denote the environmental, social, and governance dimensions of ESG performance; and the control variables include Tobin’s Q (TQ), firm size (SIZE), financial leverage (Leverage), debt ratio (DEBT), capital expenditure (CAPEX), and market risk (BETA).
ROAi,t+1 = α + β1Ei,t + β2Si,t + β3Gi,t + β4TQi,t + β5Leveragei,t + β6SIZEi,t + β7DEBTi,t + β8CAPEXi,t + β9BETAi,t + εi,t,
To test Hb and analyze the relationship between ESG performance and market-based performance, the return on assets (ROA) was incorporated as an independent variable, while Tobin’s Q (TQ) was introduced as the dependent variable:
TQi,t+1 = α + β1Ei,t + β2Si,t + β3Gi,t + β4ROAi,t + β5Leveragei,t + β6SIZEi,t + β7DEBTi,t + β8CAPEXi,t + β9BETAi,t + εi,t.
Here, Tobin’s Q (TQ) is used as a proxy for market-based performance, while the ESG dimensions and financial control variables remain consistent with the first model. The inclusion of ROA as an explanatory variable allowed for examining the influence of accounting-based financial performance on market valuation.
These regression models facilitated a comprehensive analysis of the potential impact of ESG factors on both accounting-based and market-based performance measures.
5. Results
5.1. Descriptive Statistics
Summarizing statistics of the variables are presented in Table 4, Tobin’s Q shows a mean value of 1.352, indicating that on average, the market value is slightly greater than the opposed asset value. The companies in this sample yield an ROA of 6.855% on average with a minimum of −23.02% and a maximum of 335.96%.
Table 4.
Summary statistics of all the variables included in the regression analysis.
The explanatory variables employed in this research are the aggregate ESG score and its three constituent sub-dimensions: environmental (E), social (S), and governance (G). The average overall ESG score is 59.115, with a standard deviation of 18.18, a low of 3.91, and a high of 94.16. Among the ESG sub-scores, the social (S) score has the largest mean (68.484), followed by the environmental (E) score (66.015) and the governance (G) score (60.834). Nevertheless, the E score is the most volatile with a standard deviation of 26.35, whereas the G score has the narrowest range.
The control variable SIZE, as proxied by the natural logarithm of total assets, is relatively stable with a mean of 2.802 and a standard deviation of 0.19. The BETA variable has a mean figure of 4.209, which reflects that the sample companies are riskier or more volatile than the market mean. Most of the BETA values are within a relatively narrower range, reflecting differences in market exposure of different firms.
In terms of financial risk metrics, the leverage ratio has an average of 2.488, with high variability, implying a high degree of heterogeneity in firms’ financial structures. The DEBT ratio averages 13.772, with observations between 0.00 and 19.22, indicating high differences in corporate capital structures. Likewise, capital expenditures (CAPEXs) are highly volatile, ranging between 3.66% and 11.89%, with an average of 8.947%, pointing to differences in firms’ investment policies.
As far as performance measures are concerned, the average return on assets (ROA) is 6.855 with a standard deviation of 21.05 and a range of −23.02 to 335.96, thereby highlighting the disparity in profitability levels of firms. Tobin’s Q (TQ), the market measure of performance, has an average value of 1.352 and a broad range of 0.00 to 71.82, indicating very wide variations in the market value of firms.
5.2. Regression Results
Several models have been considered and tested considering the first hypothesis that the environmental, social, and governance performance positively affects the market value of firms active in the automotive industry. The most significant models and their coefficients are presented in Table 5 and Table 6 below. The pooled OLS regression analysis model explores the connection between several independent variables and Tobin’s Q, which is a market valuation measure, based on data from publicly traded European automobile firms spanning twelve years. The overall explanatory power of the model is represented by an R-squared figure of 0.542, indicating that around 54.2% of the variation in Tobin’s Q is accounted for by the independent variables that were chosen.
Table 5.
Panel regressions with TQ (note: ***, **, and * denote a significance level of 1, 5, and 10 percent, respectively).
Table 6.
Regressions with ROA (note: ***, **, and * denote a significance level of 1, 5, and 10 percent, respectively).
Ha:
Environmental, social, and governance performance positively affects the financial performance of firms active in the European automotive industry as measured by return on assets (ROA).
Hb:
Environmental, social, and governance performance positively affects the market value of firms active in the European automotive industry represented by Tobin’s Q (TQ).
The environmental (E) dimension has a significant negative impact on Tobin’s Q, indicating that firms with superior environmental performance are likely to have lower market value, possibly due to the large expenses of environmental initiatives. The social (S) factor, however, has a positive and significant influence, indicating that firms with higher social responsibility scores are viewed more favorably by the market. Governance (G) is not seen to have a significant effect on Tobin’s Q, indicating that governance problems may not be the driving force in valuation in this sector.
Leverage has a positive impact, which implies that companies with greater leverage ratios possess greater Tobin’s Q, and this could suggest that the market views debt financing favorably in this sector. Firm size (SIZE), conversely, is of considerable negative effect, suggesting that larger companies are associated with lower market valuation, possibly due to inefficiencies or because the market thinks that they have growth potential. Debt (DEBT) is considerably positively correlated with market valuation, suggesting that the amount of total debt contributes to greater market valuation. Capital expenditure (CAPEX) is positively correlated with Tobin’s Q, although only marginally significant.
The systematic risk factor (BETA) is not significant in Tobin’s Q, indicating that market risk is not a strong influence on firm valuation in this case.
The results highlight the relevance of social responsibility and financial paradigms to impact market value, while environmental performance and company size appear related to negative market views in the context of the European automobile sector.
The fixed-effects model estimates are more consistent by not allowing unobserved heterogeneity among firms. The method eliminates the effects of firms over time and thus, is more stable than the pooled OLS model to analyze panel data, as indicated by the F-test of individual effects. It is also more consistent and significant than the random-effects model, as indicated by the Hausman test.
The model captures about 49.38% of the variability in return on assets (ROA), which is marginally lower than the pooled model but offers a more accurate estimate after firm-specific heterogeneity is controlled for. The combined model is still notably high, showing that independent variables chosen separately influence profitability.
Tobin’s Q (TQ) still has a positive and highly significant effect on ROA, supporting the reality that firms with higher values in the market are more profitable. Leverage and total debt continue to have their highly significant negative effects on ROA, supporting the reality that higher debt burdens lower profitability, most likely due to higher interest costs and financial risks.
Opposite to the previous model, the environmental dimension (E) is positively and significantly related to ROA. This implies that environmental investments can increase profitability when controlling for firm-specific characteristics. The social dimension (S) keeps its negative and highly significant impact, implying that investing in social issues can be a cost for the firm. Governance (G) has a more positive and significant impact, implying that firms with more developed governance structures have better financial performance.
Firm size (SIZE) is still positively related to profitability but with a lesser impact and only marginally significant. Capital expenditure (CAPEX) and systematic risk (BETA) are still not significant, indicating that neither capital expenditure nor market risk exposure has any discernible impact on profitability in this sector.
This model produces better explanations of firm performance and ESG factor relationships in the European automotive sector. It confirms the positive effects of market valuation, size, and governance, whereas it supports the negative effects of leverage and social spending. That environmental factors emerge as significant suggests that firm profitability can increase through sustainability initiatives while keeping firm-specific characteristics constant.
5.3. Summary of the Results
The pooled OLS model for Tobin’s Q (TQ) appears to outperform other models, such as the Fixed Effects (FE) and Random Effects (RE) models, suggesting that individual-specific or time-specific effects do not significantly influence the relationship between ESG factors, financial indicators, and firm valuation. This means that treating the dataset as a simple cross-sectional regression rather than accounting for firm-specific heterogeneity provides a more effective estimation. The expected effects and real effects based on the pooled OLS model are shown in Table 7, below.
Table 7.
A comparison of expected and real effects for market valuation model TQ (note: ***, **, and * denote a significance level of 1, 5, and 10 percent, respectively).
The coefficient estimates indicate that the social ESG score (S) has a strong positive and highly significant effect on Tobin’s Q (p < 0.001). This suggests that firms with stronger social responsibility initiatives are more highly valued by the market, potentially due to investor preferences for socially responsible companies, improved brand reputation, and stronger customer loyalty. In contrast, the environmental ESG score (E) has a negative and significant effect (p = 0.0028), indicating that firms with higher environmental scores tend to have lower Tobin’s Q values. This could be due to the costs associated with sustainability initiatives, which may not be immediately recognized as value-enhancing by investors. The governance ESG score (G), however, does not have a significant impact on Tobin’s Q (p = 0.48), implying that governance structures alone are not a key determinant of market valuation in this sample.
Among the financial variables, leverage is positively and highly significant (p < 0.001), indicating that firms with higher leverage tend to have higher Tobin’s Q values. This may suggest that moderate levels of debt are perceived as a sign of efficient capital management. However, total debt (DEBT) has a negative and significant effect (p = 0.0022), meaning that excessive debt levels are viewed negatively by investors, possibly due to concerns over financial risk and solvency. Return on assets (ROA) is the strongest predictor of Tobin’s Q, with an extremely high significance level (p < 0.001), reinforcing the idea that profitability remains a key driver of firm valuation. Finally, market risk (BETA) does not have a significant effect on Tobin’s Q (p = 0.23), indicating that systematic risk is not a major determinant of firm value in this dataset.
The overall model fit is strong, with an R-squared value of 0.529 and an adjusted R-squared of 0.524, meaning that approximately 52.9% of the variation in Tobin’s Q is explained by the independent variables. The F-statistic is highly significant (p < 0.001), confirming the overall significance of the model.
The pooled OLS model suggests that social responsibility and financial factors play a crucial role in firm valuation, while environmental initiatives and excessive debt levels may negatively impact Tobin’s Q. Profitability remains the strongest driver of market value, and governance factors do not appear to have a significant direct effect. The results indicate that ESG considerations are relevant in determining firm value, but their impact varies across different dimensions.
The regression results of the ROA model shown in Table 8 reveal significant information about the relationships between ESG metrics, financial ratios, and profitability of companies. Unlike Tobin’s Q model, which focuses on market value, this study demonstrates more insight into the influence of financial structure and sustainability performance on a company’s return on assets.
Table 8.
A comparison of expected and real effects for financial performance model ROA (note: *** and ** denote a significance level of 1 and 5 percent, respectively).
Among the ESG dimensions, environmental performance (E) positively affects ROA (p < 0.05), which implies that firms with more environmental policies tend to have better financial performance. This could be a reflection that sustainability initiatives lead to greater operational efficiency, cost-saving, or better stakeholder relationships which translate to profitability. Nevertheless, social performance (S) statistically significantly (p < 0.001) negatively affects return on assets (ROA), contrary to the expected notion that firm performance is fostered through social responsibility. That may imply that investing in social programs puts pressure on finances not resulting in immediate profit returns. Conversely, governance quality (G) is positively and strongly significant on ROA (p < 0.001), supporting the notion that effective governance frameworks are a determinant of financial stability and better decision making.
Financially, Tobin’s Q (TQ), being a measure of market valuation, shows a positive and statistically significant correlation (p < 0.001) with return on assets (ROA), indicating that firms with higher market valuations will tend to exhibit improved financial performance.
Leverage has a negative and highly significant effect (p < 0.001), indicating that higher debt levels can reduce profitability by means of increased interest expenses and financial strains. Similarly, total debt (DEBT) also exerts a negative and highly significant effect (p < 0.001) on ROA, corroborating the view that high debt destroys financial performance by increasing financial risk and decreasing operating flexibility. Firm size (SIZE) positively and significantly (p < 0.05) impacts return on assets (ROA), indicating that larger firms enjoy the advantages of economies of scale and improved market positioning, thus resulting in improved profitability. Capital expenditure (CAPEX) has a negative yet statistically insignificant influence, indicating that investment in fixed assets does not have an immediate effect on profitability.
This can be attributed to the long-term nature of capital investments where the returns are in terms of long periods rather than quick returns. Further, systematic risk (BETA) appears to have a negligible effect on ROA, which implies that a firm’s exposure to market volatility does not affect its financial performance according to this particular dataset. The findings indicate that environmental initiatives and governance quality positively affect financial performance, and debt levels and leverage negatively affect profitability. Social responsibility practices have the potential to generate long-term value but negatively affect financial performance in the short term according to this model. Firm size and market capitalization, proxied by TQ, are still positive determinants of ROA, and systematic risk and capital expenditure have negligible or no significant effect. These findings highlight the complex and multidimensional nature of the impact of ESG on financial performance.
5.4. Discussion
The empirical results provide evidence in favor of the majority of the hypothesized relationships. Specifically, the social (S) and governance (G) dimensions prove to have significant effects under both financial and market performance contexts. Both governance and social performance positively influence return on assets (ROA), while Tobin’s Q shows a positive relationship with social measures and, to a lesser extent, the quality of governance. The results reported here are in line with the stakeholder theory that assumes that those companies that resolve social and governance issues are better placed to establish stakeholder trust and achieve superior financial performance. Despite the environmental (E) dimension showing varied or even adverse effects—most notably on market valuation—the results are in accordance with earlier studies that document the short-term financial expense of environmental investment.
The results of the regression runs offer important insights into the link between environmental, social, and governance (ESG) performance and market valuation of companies in the European automobile sector. The results show that the environmental (E) dimension has a highly negative impact on Tobin’s Q, indicating that those companies with good environmental performance are associated with lower market valuations. This is because there is a tremendous cost involved in sustainability programs, which may not be directly economically rewarding or are just not well recognized by investors.
Several of the findings are contrary to common assumptions in the ESG literature and require closer scrutiny. For example, the negative effect of environmental performance on Tobin’s Q contradicts the popular assumption that sustainability investments lead to an increase in firm value. A plausible explanation is that sustainability initiatives in the automotive sector have a high up-front cost (e.g., R&D on emissions reduction or electrification) that is not necessarily compensated by investors in the short run—a finding consistent with Bebchuk and Weisbach (2010). Similarly, the negative effect of social performance on ROA suggests that investments in workforce welfare, diversity, or community programs may reduce short-term profitability, even if they foster long-term stakeholder trust. This aligns with the literature noting delayed financial returns from social initiatives (Liang & Renneboog, 2017). The weak or variable contribution of governance (G) variables to the determination of Tobin’s Q could imply that governance practices are more directly applicable to internal control and risk management that are not always immediately captured by market valuations. The implications are that ESG effects are subtle and dimension-specific, and investors and managers need to approach ESG scores with extreme caution and adjust for time horizons in assessing ESG-related strategies.
In contrast, however, the social (S) dimension exhibits a positive and statistically significant effect on Tobin’s Q. This indicates that companies with good social responsibility practices—including better labor policies, active community involvement, and business ethics—are viewed more positively by the market.
These efforts are likely to be perceived by investors as value-adding, considering the growing emphasis on corporate social responsibility on the part of regulators and consumers. Yet, governance (G) does not show a notable impact on market valuation, and the suggestion is that governance-related issues may not be a key driver of firm value in the auto industry. Financial leverage is positively related to Tobin’s Q, i.e., companies with higher debt ratios are expected to have better market valuations. It implies that for the automobile sector, debt capital is considered positively, maybe reflecting growth prospects and good capital management. The firm size (SIZE) has a negative significant impact on Tobin’s Q; i.e., large firms are expected to experience lower market valuation.
This could be due to perceived inefficiencies or the perception that smaller firms have more room for growth.
The results also indicate that capital expenditure (CAPEX) has a mildly positive impact on market valuation, indicating that investment in fixed assets enhances firm value, albeit marginally. Systematic risk (BETA), however, is not a driver of market value, therefore corroborating the fact that market risk exposure is not a critical determinant of firm valuation for the industry.
The fixed-effects model provides more stable estimates by adjusting for firm-specific characteristics and lowering unobserved heterogeneity. Although the model has slightly weaker explanatory power than that of the pooled OLS model, it offers a better reflection of firm behavior over time periods. Furthermore, the findings identify the powerful contribution of market valuation (Tobin’s Q) to financial performance, whereas high leverage and high debt levels have a negative impact on profitability.
Although environmental sustainability efforts are crucial to ensuring long-term feasibility and regulatory compliance, the results show that their short-term financial impact may be zero or even be perceived as negative by investors, primarily because of their high implementation costs. This result does not contradict the underlying theoretical foundations but is consistent with the existing literature that contends that the payoffs from environmental investments take long periods to emerge. Conversely, the social (S) dimension has a strong positive effect on return on assets (ROA) and market valuation, thereby emphasizing its dual significance in stakeholder engagement and brand reputation. These findings support the stakeholder theory, which suggests that firms that respond to social expectations can establish trust and legitimacy among investors, employees, and customers. Governance (G), though more stable and inward-looking, has a stronger correlation with financial performance as compared to market capitalization, possibly because of its influence on organizational effectiveness, accountability, and risk mitigation. Collectively, these findings underscore the differentiated roles of ESG dimensions in value creation and the necessity of implementing ESG strategies across firm-specific priorities and stakeholder expectations.
5.5. Limitations and Future Research
Among the limitations of the study is the quality and extent of data from Refinitiv Eikon DataStream that may not capture the full range of ESG-related activity, particularly qualitative aspects such as corporate culture, ethical leadership, and stakeholder perceptions. Furthermore, the study is performed on publicly traded European automotive companies from the Eurostoxx 600 index, which limits generalizability to private companies or companies in other markets. The findings may be partial reflections of ESG dynamics within emerging markets, where regulatory environments and investor needs vary considerably. A further limitation is the measurement of ESG performance using composite scores, which may obscure the efforts of specific ESG initiatives.
Moreover, environmental, social, and governance (ESG) scores can be prone to biases and inconsistencies between rating agencies, which can affect the validity of the findings. Panel regression models employing the generalized method of moments (GMM) are used in the study to deal with endogeneity but do not adequately control for the possibility of omitted variable bias or nonlinear relations that might exist between ESG variables and firm performance. Future studies can adopt more sophisticated econometric methods, like machine learning models or dynamic panel estimators, to account for complicated interactions and causal impacts. Another direction of future studies is to examine the significance of industry-specific ESG factors. While this paper investigates the automotive sector, ESG drivers and financial consequences may be different in industries such as energy, finance, or technology. Comparative cross-industry analysis can add depth to the understanding of the impact of ESG in different business environments. Furthermore, this study primarily tests the short- and mid-term implications of ESG factors for financial performance and market value. Future research can examine long-term ESG commitments and their implications for corporate resilience, innovation, and stakeholder trust in longer time frames.
Finally, with increasing regulatory pressure and evolving regimes for sustainability in Europe, future studies could quantify the impact of specific policies, such as the EU taxonomy or the Corporate Sustainability Reporting Directive (CSRD), on ESG performance and company value. Policy-focused studies could provide valuable insights for regulators, investors, and company decision-makers to align financial objectives with sustainability goals.
6. Conclusions
This study analyzes the influence of environmental, social, and governance (ESG) aspects on financial performance and market capitalization in the European auto industry. It employs data from sixty publicly traded companies in the industry, all of which are part of the Eurostoxx 600 index. The analysis considers a twelve-year timeframe, from 2011 to 2022, creating 720 data points for every variable considered in the research. Information on the dependent, independent, and control variables was retrieved from the Refinitiv Eikon DataStream database. The panel regression models were estimated with robustness tests through the generalized method of moments (GMM) to control for endogeneity problems given the observed heteroskedasticity, serial correlation, and cross-dependency.
Two main hypotheses were tested: (i) the ESG performance positively affects companies’ financial performance in the form of return on assets (ROA); (ii) the ESG performance positively affects companies’ market value, as represented by Tobin’s Q (TQ).
The result of the first model, for firms in the automotive industry, that calculates the impact of ESG on financial performance is that the social (S) component has a positive significant impact on ROA, indicating that firms with better social governance, such as employees’ welfare and community involvement, are financially better off. The environmental factor (E) has a slightly negative effect, which is probably caused by the expensive nature of sustainability efforts. The governance factor (G) does not have a significant effect on return on assets (ROA), indicating that governance does not directly affect financial performance in the short term. Furthermore, leverage is extremely significant, indicating that companies with greater leverage perform financially better.
The second model evaluates the connection between the ESG factors and Tobin’s Q, which is a metric of market value. The findings show that the social (S) factor has a negative impact on Tobin’s Q, which implies that companies that invest a lot in social causes might not see their market value appreciated immediately. This may indicate investors’ skepticism regarding the financial returns of social investments. The governance (G) dimension is of borderline significance, implying that good governance can lead to market valuation in the long term. The environmental (E) dimension does not have a significant effect on Tobin’s Q, with leverage once more being negatively linked to market valuation. In order to provide assurance on the validity of these results, a generalized method of moments (GMM) approach was employed utilizing White’s robust standard errors to alleviate the problems of heteroskedasticity and endogeneity. Robustness checks confirmed that the social (S) dimension remains significant in both models, maintaining its positive impact on ROA and negative impact on Tobin’s Q. The environmental (E) dimension remains insignificant, further confirming that it has no direct impact on financial performance or market value. The governance (G) dimension remains mildly significant in market value, but remains insignificant for financial performance. Leverage is also a highly significant variable in both models, confirming its strong impact on firm performance.
The results provide partial support for both hypotheses. The first hypothesis is partially supported, in that the social (S) dimension enhances financial performance but the environmental (E) and governance (G) dimensions fail to demonstrate a definitive positive effect. Similarly, the second hypothesis is partially supported, with governance (G) having a positive effect on market value, the social (S) dimension having a negative influence on Tobin’s Q, and the environmental (E) dimension not being statistically significant.
The implications of these findings are significant to management practice. Companies need to understand that initiatives for greater social responsibility can lead to improved financial performance; however, such initiatives will not see an immediate rise in market value. Robust governance structures seem to underpin long-term market value, and expenditure on environmental initiatives does not yield short-term financial returns, likely due to exorbitant implementation costs.
The study’s novelty is threefold in being sector-specific, data-intensive, and methodologically rigorous. In contrast to more general cross-sector studies, this article concentrates on the European automotive industry, providing findings that are cognizant of its special regulatory, environmental, and market concerns. The extended study duration and the utilization of detailed ESG scores allow an in-depth investigation of the impact of ESG factors on firm performance in the short term and medium term. With both accounting- and market-based ESG metrics employed together, and with endogeneity controls in place by using panel data methods, this study provides a comprehensive and robust assessment of the fiscal implications of ESG.
In conclusion, while ESG factors are an important driver of corporate sustainability, their impact on financial and market performance is mixed. Corporates and investors should systematically match their commitment to ESG and ensure governance structures enhance long-term valuation while also addressing the short-term trade-offs associated with social and environmental investments.
Author Contributions
Conceptualization, J.G.; methodology, M.P. and J.G.; software, J.G.; validation, J.G.; formal analysis, M.P. and J.G.; investigation, J.G.; resources, M.P.; data curation, M.P.; writing—original draft preparation, J.G.; writing—review and editing, M.P. and J.G.; visualization, J.G.; supervision, J.G. and M.P.; project administration, M.P. and J.G.; funding acquisition, M.P. All authors have read and agreed to the published version of the manuscript.
Funding
We gratefully acknowledge the funding of this paper by the Technical University of Košice scientific grant No. 02/TUKE/2025: The Impact of ESG Strategies on Company Financial Performance: A Bibliometric Analysis.
Institutional Review Board Statement
Not applicable.
Informed Consent Statement
Not applicable.
Data Availability Statement
The original contributions presented in this study are included in the article. Further inquiries can be directed to the corresponding author.
Conflicts of Interest
The authors declare no conflicts of interest.
References
- Abdi, Y., Li, X., & Càmara-Turull, X. (2020). Impact of sustainability on firm value and financial performance in the air transport industry. Sustainability, 12, 9957. [Google Scholar] [CrossRef]
- Alareeni, B. A. (2020). The impact of environmental, social and governance disclosure on firm value: The moderating role of audit committee. Journal of Financial Reporting and Accounting, 18(3), 423–444. [Google Scholar]
- Alareeni, B. A., & Hamdan, A. (2020). ESG impact on performance of US S&P 500-listed firms. CG, 20(7), 1409–1428. [Google Scholar] [CrossRef]
- Alsayegh, M. F., Rahman, R. A., & Homayoun, S. (2020). Corporate economic, environmental, and social sustainability performance transformation through ESG disclosure. Sustainable Development, 28(6), 1670–1683. [Google Scholar] [CrossRef]
- Amaral, H. F., da Silva, A. L. C., & de Souza, F. J. (2023). Social ESG factors and firm performance: Evidence from Latin America. Journal of Business Research, 150, 456–468. [Google Scholar]
- Amel-Zadeh, A., & Serafeim, G. (2018). Why and how investors use ESG information: Evidence from a global survey. Financial Analysts Journal, 74(3), 87–103. [Google Scholar] [CrossRef]
- Au, A. K., Chan, K. C., & Wang, Y. (2023). ESG reporting and firm value: Evidence from Asia-Pacific markets. Pacific-Basin Finance Journal, 74, 101832. [Google Scholar]
- Baltagi, B. H. (2021). Econometric analysis of panel data (6th ed.). Springer. [Google Scholar]
- Barman, E. (2020). Doing well by doing good: A comparative analysis of ESG standards for responsible investment. In G. Cattani, S. Ferriani, F. Godart, & S. V. Sgourev (Eds.), Aesthetics and style in strategy 2020 (Vol. 38, pp. 289–311). Advances in Strategic Management. Emerald Publishing Limited. [Google Scholar]
- Bebchuk, L. A., & Weisbach, M. S. (2010). The state of corporate governance research. Review of Financial Studies, 23(3), 939–961. [Google Scholar] [CrossRef]
- Beretta, V., Demartini, M. C., Lico, L., & Trucco, S. (2021). A tone analysis of the non-financial disclosure in the automotive industry. Sustainability, 13(4), 2132. [Google Scholar] [CrossRef]
- BlackRock Inc. (2018). A sense of purpose. Larry Fink 2018 letter to CEOs. Available online: https://www.blackrock.com/corporate/investor-relations/2018-larry-fink-ceo-letter (accessed on 1 November 2020).
- Brockett, A. (2012). Corporate sustainability. Integrating performance and reporting. Wiley Corporate F&A. Wiley. [Google Scholar]
- Choi, Y., & Cho, K. T. (2021). Analysis of environmental management characteristics using network analysis of CEO com-munication in the automotive industry. Sustainability, 13(21), 11987. [Google Scholar] [CrossRef]
- Clark, G. L., Feiner, A., & Viehs, M. (2015). From the stockholder to the stakeholder: How sustainability can drive financial outperformance. University of Oxford. Available online: https://papers.ssrn.com/sol3/papers.cfm?abstract_id=2508281 (accessed on 27 February 2025).
- Cornell, T., Shin, E., Puthiyamadam, T., & Palmer, M. (2021). How can consumer-facing companies weave social justice into their DNA? ESG metrics influence buying decisions. PriceWaterhouseCoopers 2021. Available online: https://www.pwc.com/us/en/industries/consumer-markets/library/esg-metrics-influence-buying.html (accessed on 18 October 2021).
- Darsono, D., Ratmono, D., Tujori, A., & Clarisa, T. Y. (2024). The relationship between ESG, financial performance, and cost of debt: The role of independent assurance. Cogent Business & Management, 12(1). [Google Scholar] [CrossRef]
- Deng, J. (2025). Exploring the heterogeneous effects of environmental, social, and governance performance on idiosyncratic risk: Do political ties matter? Humanities and Social Sciences Communications 12, 422. [Google Scholar] [CrossRef]
- Dinca, M. S., Vezeteu, C. D., & Dinca, D. (2022). The relationship between ESG and firm value: Case study of the automotive industry. Frontiers in Environmental Science, 10, 1059906. [Google Scholar] [CrossRef]
- Eccles, R. G., Ioannou, I., & Serafeim, G. (2014). The impact of corporate sustainability on organizational processes and performance. Management Science, 60(11), 2835–2857. [Google Scholar] [CrossRef]
- Eccles, R. G., & Stroehle, J. C. (2018). Exploring social origins in the construction of ESG measures. SSRN Electronic Journal. [Google Scholar] [CrossRef]
- El Ghoul, S., Guedhami, O., Kwok, C. C. Y., & Mishra, D. R. (2011). Does corporate social responsibility affect the cost of capital? Journal of Banking & Finance, 35(9), 2388–2406. [Google Scholar] [CrossRef]
- Farinós, J. E., Herrero, B., & Latorre, M. Á. (2022). Board gender diversity and the acquisition announcement on Friday: Evidence from Spain. Academia Revista Latinoamericana de Administración, 36(1), 39–62. [Google Scholar] [CrossRef]
- Fatemi, A., Glaum, M., & Kaiser, S. (2018). ESG performance and firm value: The moderating role of disclosure. Global Finance Journal, 38, 45–64. [Google Scholar] [CrossRef]
- Förster, L., & Mischo, H. (2022). Excursus into the certification of mineral raw materials: Development and implementation of a sustainability standard. International Journal of Mining Reclamation and Environment, 36(9), 642–650. [Google Scholar] [CrossRef]
- Freeman, R. E., Harrison, J. S., & Wicks, A. C. (2007). Managing for stakeholders: Survival, reputation, and success. The Business Roundtable Institute for Corporate Ethics series in ethics and leadership. Yale University Press. [Google Scholar]
- Freeman, R. E., & McVea, J. (2001). A stakeholder approach to strategic management. SSRN Electronic Journal. [Google Scholar] [CrossRef]
- Friede, G., Busch, T., & Bassen, A. (2015). ESG and financial performance: Aggregated evidence from more than 2000 empirical studies. Journal of Sustainable Finance & Investment, 5(4), 210–233. [Google Scholar] [CrossRef]
- Gemtou, E., Papadopoulou, E., & Tsakou, E. (2024). Barriers to the adoption of sustainable agricultural practices in Greece. Sustainability, 16(2), 1234. [Google Scholar]
- Gerber, C. (2024). ESG transparency and its effect on firm valuation: Evidence from European markets. European Financial Management, 30(1), 89–112. [Google Scholar] [CrossRef]
- Giese, G., Lee, L. E., Melas, D., Nagy, Z., & Nishikawa, L. (2019). Foundations of ESG investing: How ESG affects equity valuation, risk, and performance. The Journal of Portfolio Management, 45(5), 69–83. [Google Scholar] [CrossRef]
- Global Sustainability Investment Alliance (GSIA), Adler, E., Haysler, N., & Dayeh, A. (2020). Global sustainable investment review 2020. Available online: https://www.gsi-alliance.org/wp-content/uploads/2021/08/GSIR-20201.pdf (accessed on 16 October 2021).
- Glova, J., & Slyvkanyc, N. (2024). Impact of ESG subset performance on financial and market outcomes. Ad Alta-Journal of Interdisciplinary Research, 14(1), 56–58. [Google Scholar]
- Gong, Y., Stanley, J., Wang, B., & Alharithi, M. (2024). Examining strategies developed by insurance companies for address-ing carbon emissions in the automotive supply chain in the UK. Sustainability, 16(22), 9895. [Google Scholar] [CrossRef]
- Han, J.-J., Kim, H. J., & Yu, J. (2016). Empirical study on relationship between corporate social responsibility and financial perfor-mance in Korea. AJSSR, 1(1), 61–76. [Google Scholar] [CrossRef]
- Isakhanyan, G. (2024). Climate-smart agriculture and its impact on food security in developing countries. Agricultural Economics, 55(1), 45–58. [Google Scholar] [CrossRef]
- Jensen, M. C., & Meckling, W. H. (1976). Theory of the firm: Managerial behavior, agency costs and ownership structure. Journal of Financial Economics, 3(4), 305–360. [Google Scholar] [CrossRef]
- Kaminska-Witkowska, A., & Matuszak-Flejszman, A. (2023). Possibility of using EMAS environmental reporting require-ments for ESG reporting in selected automotive corporations. Economics and Environment, 85(2), 347–368. [Google Scholar] [CrossRef]
- Kazakakou Powaski, M. C., Daza Ordoñez, C., & Jáuregui Sánchez, L. (2022). ESG impact on financial corporate performance and port-folio returns: Evidence of Australia and Japan. Vinculatégica, 7(1), 53–78. [Google Scholar] [CrossRef]
- Khan, K. U., Ali, W., Atlas, F., & Khan, F. (2024). Driving change: The influence of female directors on ESG performance in the automotive industry. Discover Sustainability, 5(1), 523. [Google Scholar] [CrossRef]
- Lee, M. T., Raschke, R. L., & Krishen, A. S. (2022). Signaling green! Firm ESG signals in an interconnected environment that promote brand valuation. Journal of Business Research, 138, 1–11. [Google Scholar] [CrossRef]
- Li, Y., Gong, M., Zhang, X.-Y., & Koh, L. (2018). The impact of environmental, social, and governance disclosure on firm value: The role of CEO power. The British Accounting Review, 50, 60–75. [Google Scholar] [CrossRef]
- Liang, H., & Renneboog, L. (2017). On the foundations of corporate social responsibility. Journal of Finance, 72(2), 853–910. [Google Scholar] [CrossRef]
- Little, R. J. A., & Rubin, D. B. (2019). Statistical analysis with missing data (3rd ed.). Wiley. [Google Scholar] [CrossRef]
- López-Arceiz, F. J., Bellostas, A. J., & Rivera, P. (2018). Twenty years of research on the relationship Between economic and social performance: A meta-analysis approach. Social Indicators Research, 140, 453–484. [Google Scholar] [CrossRef]
- Maehara, Y., Kuku, A., & Osabe, Y. (2022). Macro analysis of decarbonization-related patent technologies by patent domain-specific BERT. World Patent Information, 69, 102112. [Google Scholar] [CrossRef]
- Martins, G. D., de Carvalho, S. A. D., Fernandes, L. G. L., Cesarino, I., & Leao, A. L. (2024). Market research and SWOT analy-sis for fibers composite materials usage in the vehicular components supply chain. Journal of Natural Fibers, 21(1), 2334409. [Google Scholar] [CrossRef]
- Molnár, P., Suta, A., & Tóth, A. (2024). Sustainability accounting for greenhouse gas emissions measurement using the GREET LCA model: Practical review of automotive ESG reporting. Clean Technologies and Environmental Policy, 26(5), 1631–1642. [Google Scholar] [CrossRef]
- Petavratzi, E., & Gunn, G. (2023). Decarbonising the automotive sector: A primary raw material perspective on targets and timescales. Mineral Economics, 36(4), 545–561. [Google Scholar] [CrossRef]
- Porter, M. E., & Kramer, M. R. (2006). Strategy and society: The link between competitive advantage and corporate social responsibility. Harvard Business Review. Available online: https://hbr.org/2006/12/strategy-and-society-the-link-between-competitive-advantage-and-corporate-social-responsibility (accessed on 27 February 2025).
- PRI. (2021). Annual report 2021. principles of responsible investing (PRI) 2021. Available online: https://dwtyzx6upklss.cloudfront.net/Uploads/y/o/i/pri_annualreport_2021_web_346706.pdf (accessed on 24 December 2021).
- Qiu, J. L., Alinaghian, L., & Brintrup, A. (2024). The influence of neighbours’ supply network structure on firms’ environ-mental, social, and governance controversies. International Journal of Production Research, 1–20. [Google Scholar] [CrossRef]
- Rossi, M., Minicozzi, G., Pascarella, G., & Capasso, A. (2020, September 9–10). ESG, competitive advantage and financial performances: A preliminary research [Conference paper]. 13th Annual Conference of the EuroMed Academy of Business (pp. 1016–1034), Rome, Italy. [Google Scholar]
- Rubin, D. B. (1987). Multiple imputation for nonresponse in surveys. Wiley. [Google Scholar] [CrossRef]
- Saberi, B. (2018). The role of the automobile industry in the economy of developed countries. International Robotics & Automation Journal, 4, 179–180. [Google Scholar] [CrossRef]
- Schafer, J. L., & Graham, J. W. (2002). Missing data: Our view of the state of the art. Psychological Methods, 7(2), 147–177. [Google Scholar] [CrossRef] [PubMed]
- Srivastava, R., Dasgupta, M., & Prashar, A. (2025). Business model transition towards carbon neutrality in automotive ancil-laries: An emerging market perspective from India. Sustainable Futures, 9, 100481. [Google Scholar] [CrossRef]
- Stefanoni, S., & Voltes-Dorta, A. (2021). Technical efficiency of car manufacturers under environmental and sustainability pressures: A data envelopment analysis approach. Journal of Cleaner Production, 311, 127589. [Google Scholar] [CrossRef]
- Tóth, A., Suta, A., Lukács, E., & Szauter, F. (2024). Quantitative analysis of green investments in European automotive companies: A digital reporting analysis. Clean Technologies and Environmental Policy. [Google Scholar] [CrossRef]
- van Beurden, P., & Gössling, T. (2008). The worth of values—A literature review on the relation between corporate social and financial performance. Journal of Business Ethics, 82, 407–424. [Google Scholar] [CrossRef]
- Velte, P. (2017). Does ESG performance have an impact on financial performance? Evidence from Germany. Journal of Global Responsibility, 8(2), 169–178. [Google Scholar] [CrossRef]
- Velten, S., Leventon, J., Jager, N. W., & Newig, J. (2015). What is sustainable agriculture? A systematic review. Sustainability, 7(6), 7833–7865. [Google Scholar] [CrossRef]
- Vidovic, L. (2022). Climate change reshapes the automobile sector. Available online: https://www.spglobal.com/marketintelligence/en/news-insights/blog/climate-change-reshapes-the-automobile-sector (accessed on 12 July 2022).
- Vijaya, A., Meisterknecht, J. P. S., Angreani, L. S., & Wicaksono, H. (2025). Advancing sustainability in the automotive sector: A critical analysis of ESG performance indicators. Cleaner Environmental Systems, 16, 100248. [Google Scholar] [CrossRef]
- Wang, Y., & Sun, X. (2022). Environmental regulations, ESG performance, and corporate innovation: Evidence from China. Journal of Environmental Management, 305, 114370. [Google Scholar] [CrossRef]
- Wooldridge, J. M. (2010). Econometric analysis of cross section and panel data (2nd ed.). MIT Press. [Google Scholar]
- Xie, J., Nozawa, W., Yagi, M., Fujii, H., & Managi, S. (2019). Do environmental, social, and governance activities improve corporate financial performance? Business Strategy and the Environment, 28, 286–300. [Google Scholar] [CrossRef]
- Yang, F., Chen, T. W., Zhang, Z. B., & Yao, K. (2024). Firm ESG performance and supply-chain total-factor productivity. Sustainability, 16(20), 9016. [Google Scholar] [CrossRef]
- Yeh, T. T., Xiao, Y. Z., & Daniel, S. J. (2024). Stakeholder influences on ESG governance. Journal of Corporate Accounting and Finance, 35(2), 103–120. [Google Scholar] [CrossRef]
- Zahid, R. M. A., Saleem, A., & Maqsood, U. S. (2023). ESG performance, capital financing decisions, and audit quality: Empirical evidence from Chinese state-owned enterprises. Environmental Science and Pollution Research, 30, 44086–44099. [Google Scholar] [CrossRef]
- Zeng, S., & Jiang, W. (2023). Environmental performance and corporate financial performance: Evidence from China’s manufacturing industry. Journal of Cleaner Production, 385, 135648. [Google Scholar] [CrossRef]
Disclaimer/Publisher’s Note: The statements, opinions and data contained in all publications are solely those of the individual author(s) and contributor(s) and not of MDPI and/or the editor(s). MDPI and/or the editor(s) disclaim responsibility for any injury to people or property resulting from any ideas, methods, instructions or products referred to in the content. |
© 2025 by the authors. Licensee MDPI, Basel, Switzerland. This article is an open access article distributed under the terms and conditions of the Creative Commons Attribution (CC BY) license (https://creativecommons.org/licenses/by/4.0/).