1. Introduction
The banking industry has experienced many changes in the past decade. Technological advancements have lowered entry barriers, and the COVID-19 pandemic altered customer demand. In this study, we explored the new dimensions of supply and demand in the banking sector.
Neobanks present a significant disruption. Besides technological advancements, digitalization, and shifting customer demand, they have developed rapidly due to the increasing shortcomings of traditional banks (
Temelkov, 2020b). They are often called fintech banks due to their infrastructure, which is based on financial technology (fintech). Digital tools are used to provide banking services without any physical branches (
Hu et al., 2019;
Kim Lien et al., 2020;
Thakor, 2020). Digitalization has allowed them to increase accessibility and lower the costs, resulting in significantly less need for a physical network of bank branches and ATMs (
de Mariz, 2022). The neobanking business model puts emphasis on affordable banking services and innovative products adjusted to specific market niches (
Jagrič et al., 2021).
The question arises as to why customers choose a neobank or a traditional bank. Are there important differences between the former and the latter group of customers, and if so, what are they? While existing scientific literature has identified consumer preferences, technological advancements, and the regulatory and economic environment as significant factors (
Jagrič & Amon, 2023;
Jagrič et al., 2021;
Temelkov, 2022), the role of customer characteristics remains understudied in academia. Which characteristics, if any, drive the demand for neobanking services? How do they differ from the characteristics driving the demand for banking services?
The purpose of this study was to examine the characteristics of banking users to determine whether, and to what extent, they differ from the characteristics of neobanking users. Using primary data from banking and neobanking users across 28 countries, including the countries of the European Union and the United Kingdom, this study applied econometric modelling to analyse these characteristics.
The findings can provide up-to-date insights for both traditional banks and neobanks, enabling them to better adjust their products, services, and marketing strategies to current customer demand in dynamic financial markets. Therefore, these findings can help improve customer experience in the banking sector by helping banks address the specific needs of each customer segment. Additionally, this study contributes to the broader understanding of customer behaviour and their adoption of innovation.
Neobanks provide customers with attractive offers of unique insurance products such as insurance for extreme sports and smart devices and simple AI-based tools for budgeting. Small businesses can receive help with assets and tax management, as well as more-accessible and affordable loans (
Banga et al., 2023). Neobanks also offer simple investing options with a diverse range of possible investments, from cryptocurrencies to exclusively sustainable enterprises. Some neobanks specialize in even smaller market niches, such as consumers of a specific age range, race, sexual orientation, or other social characteristic.
We can assume neobanks offer more-affordable products and services because they have lower operational costs than traditional banks due to the absence of physical branches and an ATM network (
Temelkov, 2020b). Their development marks the continuation of the banking industry’s transition to digital services, a trend that began in the 1990s with call centres and evolved with digitalization and automation in the following decades (
Temelkov, 2020a).
Simple, established in 2009 in the United States, was the first neobank on the market (
Banerjee et al., 2022). Rapid growth has been observed in the neobanking market since 2017 (
Koibichuk et al., 2021). Today, the Neobank Tracker, a tool developed by The Financial Brand, lists more than 330 neobanks active globally (
The Financial Brand, 2024).
Many studies have proven the advantages of fintech integration in the banking sector. Fintech development has been proven to enhance risk-taking and liquidity in banks, particularly in larger banks (
Fang et al., 2023). Fintech has also contributed to higher financial inclusion (
Yuan et al., 2023), which has become a central policy consideration (
de Mariz, 2022). Neobanks could also contribute to global sustainability goals by promoting financial and social inclusion and reducing the environmental footprint of the banking industry. They minimize paper waste and the logistical effects of the banking sector through digital operations (
Amon et al., 2024). Additionally, neobanks provide improved customer experience with faster, more accessible, and affordable services (
Tanuwijaya & Oktavia, 2023).
However, neobanks are also facing significant challenges. The most pressing challenges and risks associated with neobanks include digital security, data privacy, cybercrime, lack of trust, acquiring users, and achieving principality. Principality refers to perceiving one bank as one’s main bank, despite using more than one. Due to their longer history, the majority of users of neobanks and traditional banks perceive the latter as their principal one. In terms of regulation, neobanks are often subject to fewer regulations than traditional banking institutions. Their operations differ significantly, which must be considered in developing a regulative framework while ensuring equivalent regulation. For example, neobanks put more emphasis on cross-sales of insurance products and prioritize virtual over physical cards, which usually cost extra. A more effective regulatory framework must be established, addressing these differences to better enhance competitiveness and transparency while managing new and emerging risks (
Jagrič et al., 2021).
Some studies have already found the characteristics of banking customers to be a significant factor in the banking decisions of consumers.
Laukkanen and Pasanen (
2008) found age and gender to be significant amongst Finnish banking users. In a previous study,
Laukkanen and Pasanen (
2005) also found age and gender to be significant factors.
Hu et al. (
2019) showed that users’ trust in fintech-based financial services is a significant factor affecting fintech adoption in Chinese banking market.
Yousafzai and Yani-de-Soriano (
2012) also proved the importance of customer-specific factors—more specifically, technology readiness, age, and gender—in moderating the belief–intention relationship in the banking sector.
Ho et al. (
2020) also found various significant factors affecting mobile banking adoption, namely subjective norms, self-efficiency, facilitating conditions, perceived behavioural control, compatibility, perceived usefulness, and risk. Similarly,
Oly Ndubisi and Sinti (
2006) also showed that attitudinal determinants have a significant effect on mobile banking adoption in Malaysia. Additionally, another study of mobile banking adoption found internet-related innovativeness to be a significant positive effect and general innovativeness to be a negative effect (
Lassar et al., 2005). We noted a significant lack of studies focusing on the characteristics of banking, as well as neobanking, users, displaying a research gap that our study sought to address.
2. Materials and Methods
Data were acquired in December 2023 via an online survey of 2166 banking users, performed by the authors and specialized market research provider Cint in 28 countries: Austria, Belgium, Bulgaria, Croatia, Cyprus, Czech Republic, Denmark, Estonia, Finland, France, Germany, Greece, Hungary, Ireland, Italy, Latvia, Lithuania, Luxembourg, Malta, Netherlands, Poland, Portugal, Romania, Slovakia, Slovenia, Spain, Sweden, and the United Kingdom.
The goal of data collection was to include as many users of neobanking services as possible in the sample. For that reason, we employed several electronic search channels. Users were contacted via various forums, websites on banking-related topics, and social media groups. We specifically targeted forums and websites where content related to neobanks appeared. This approach was necessary to reach as many users as possible, but it may not fully capture users who are less active in online discussions and forums. We acknowledge that the nature of the sample presents a limitation to the generalizability of the results. This study was geographically limited to the countries that provided a statistically sufficient number of responses (
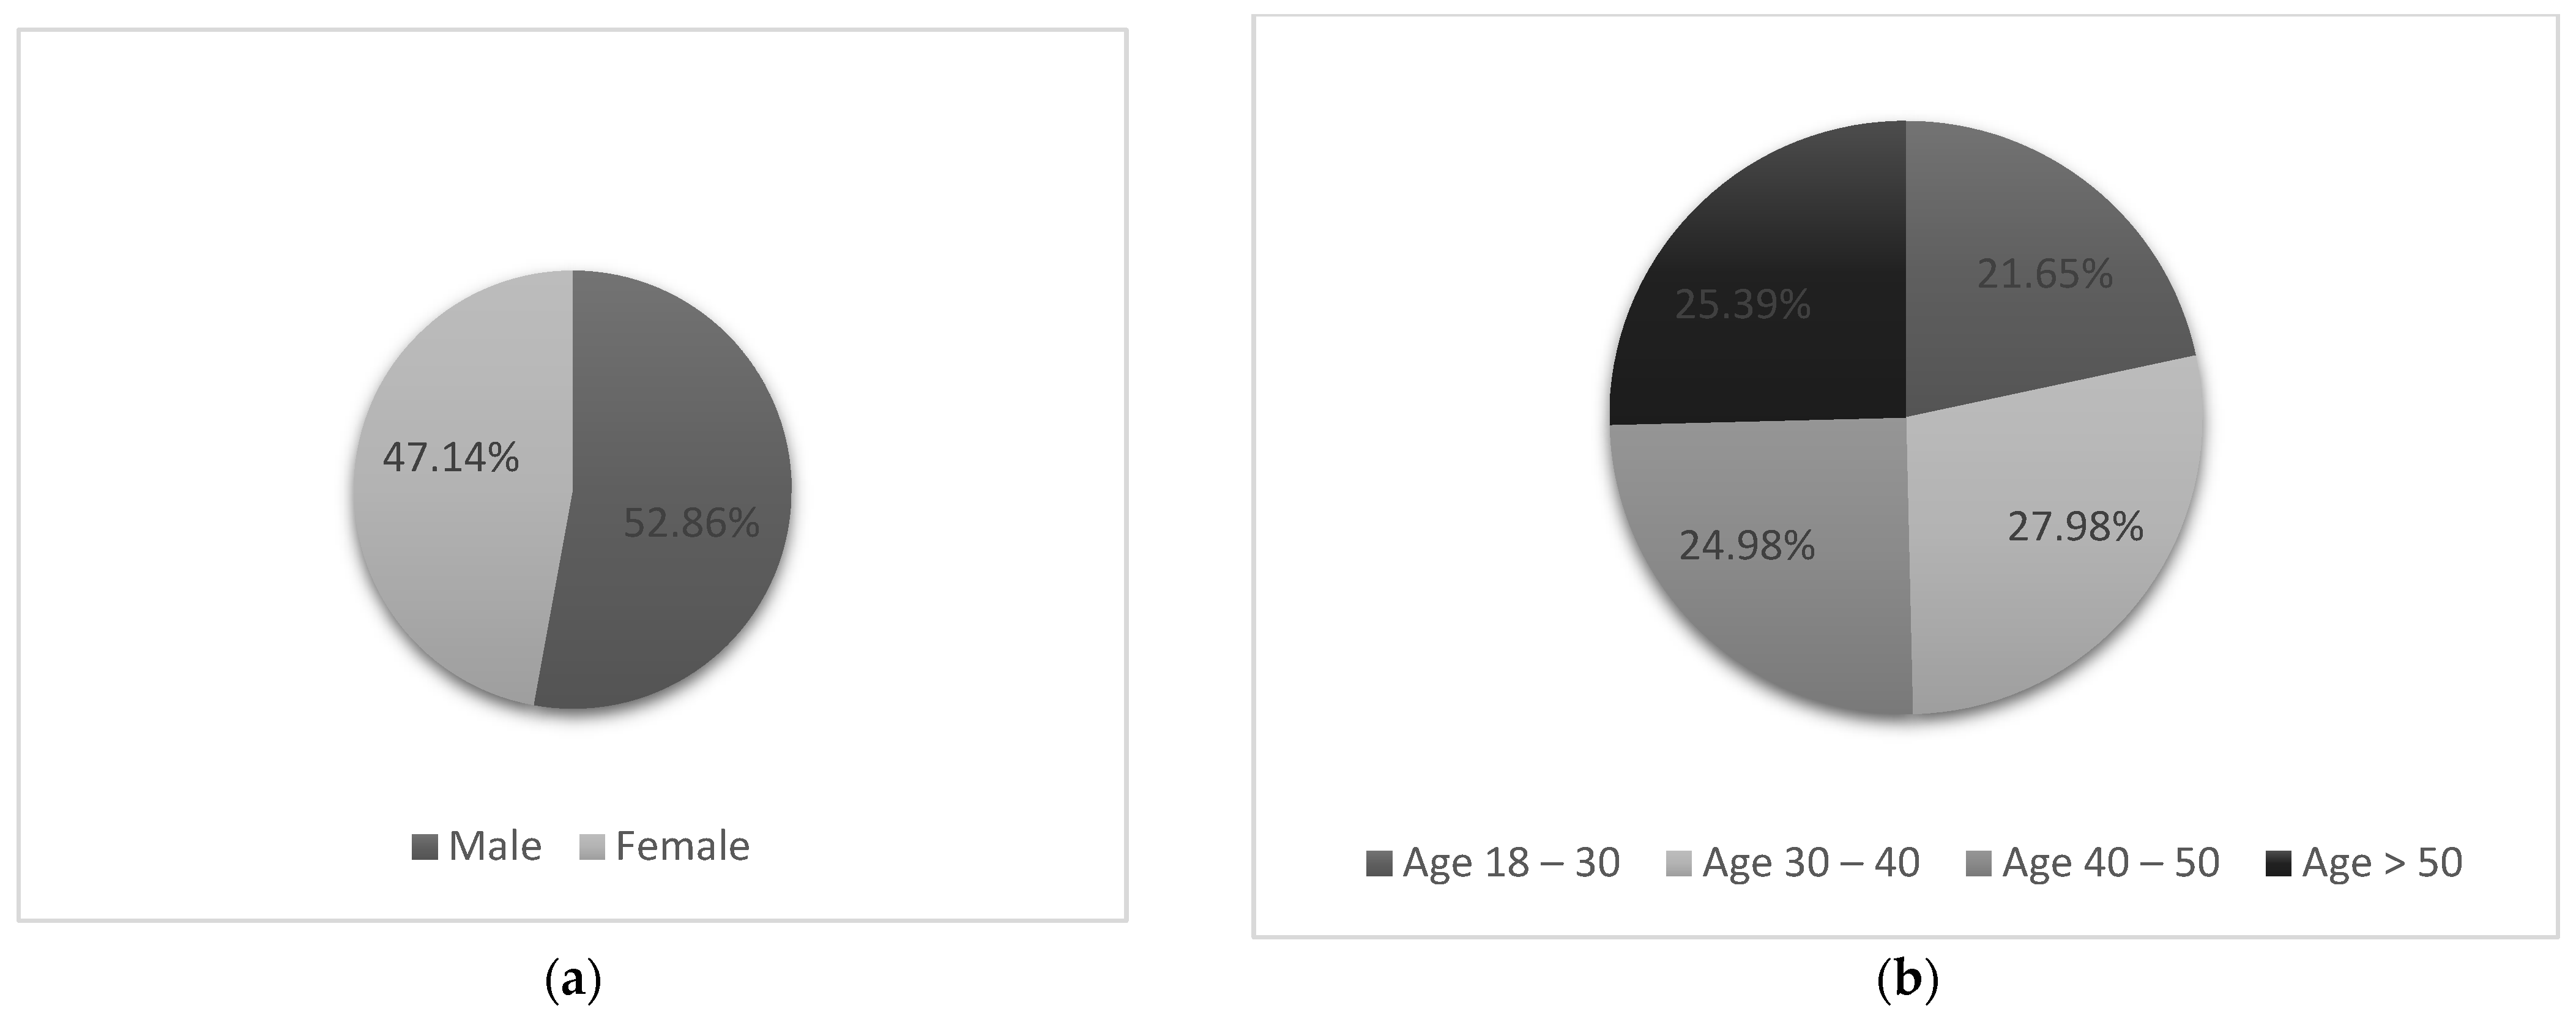
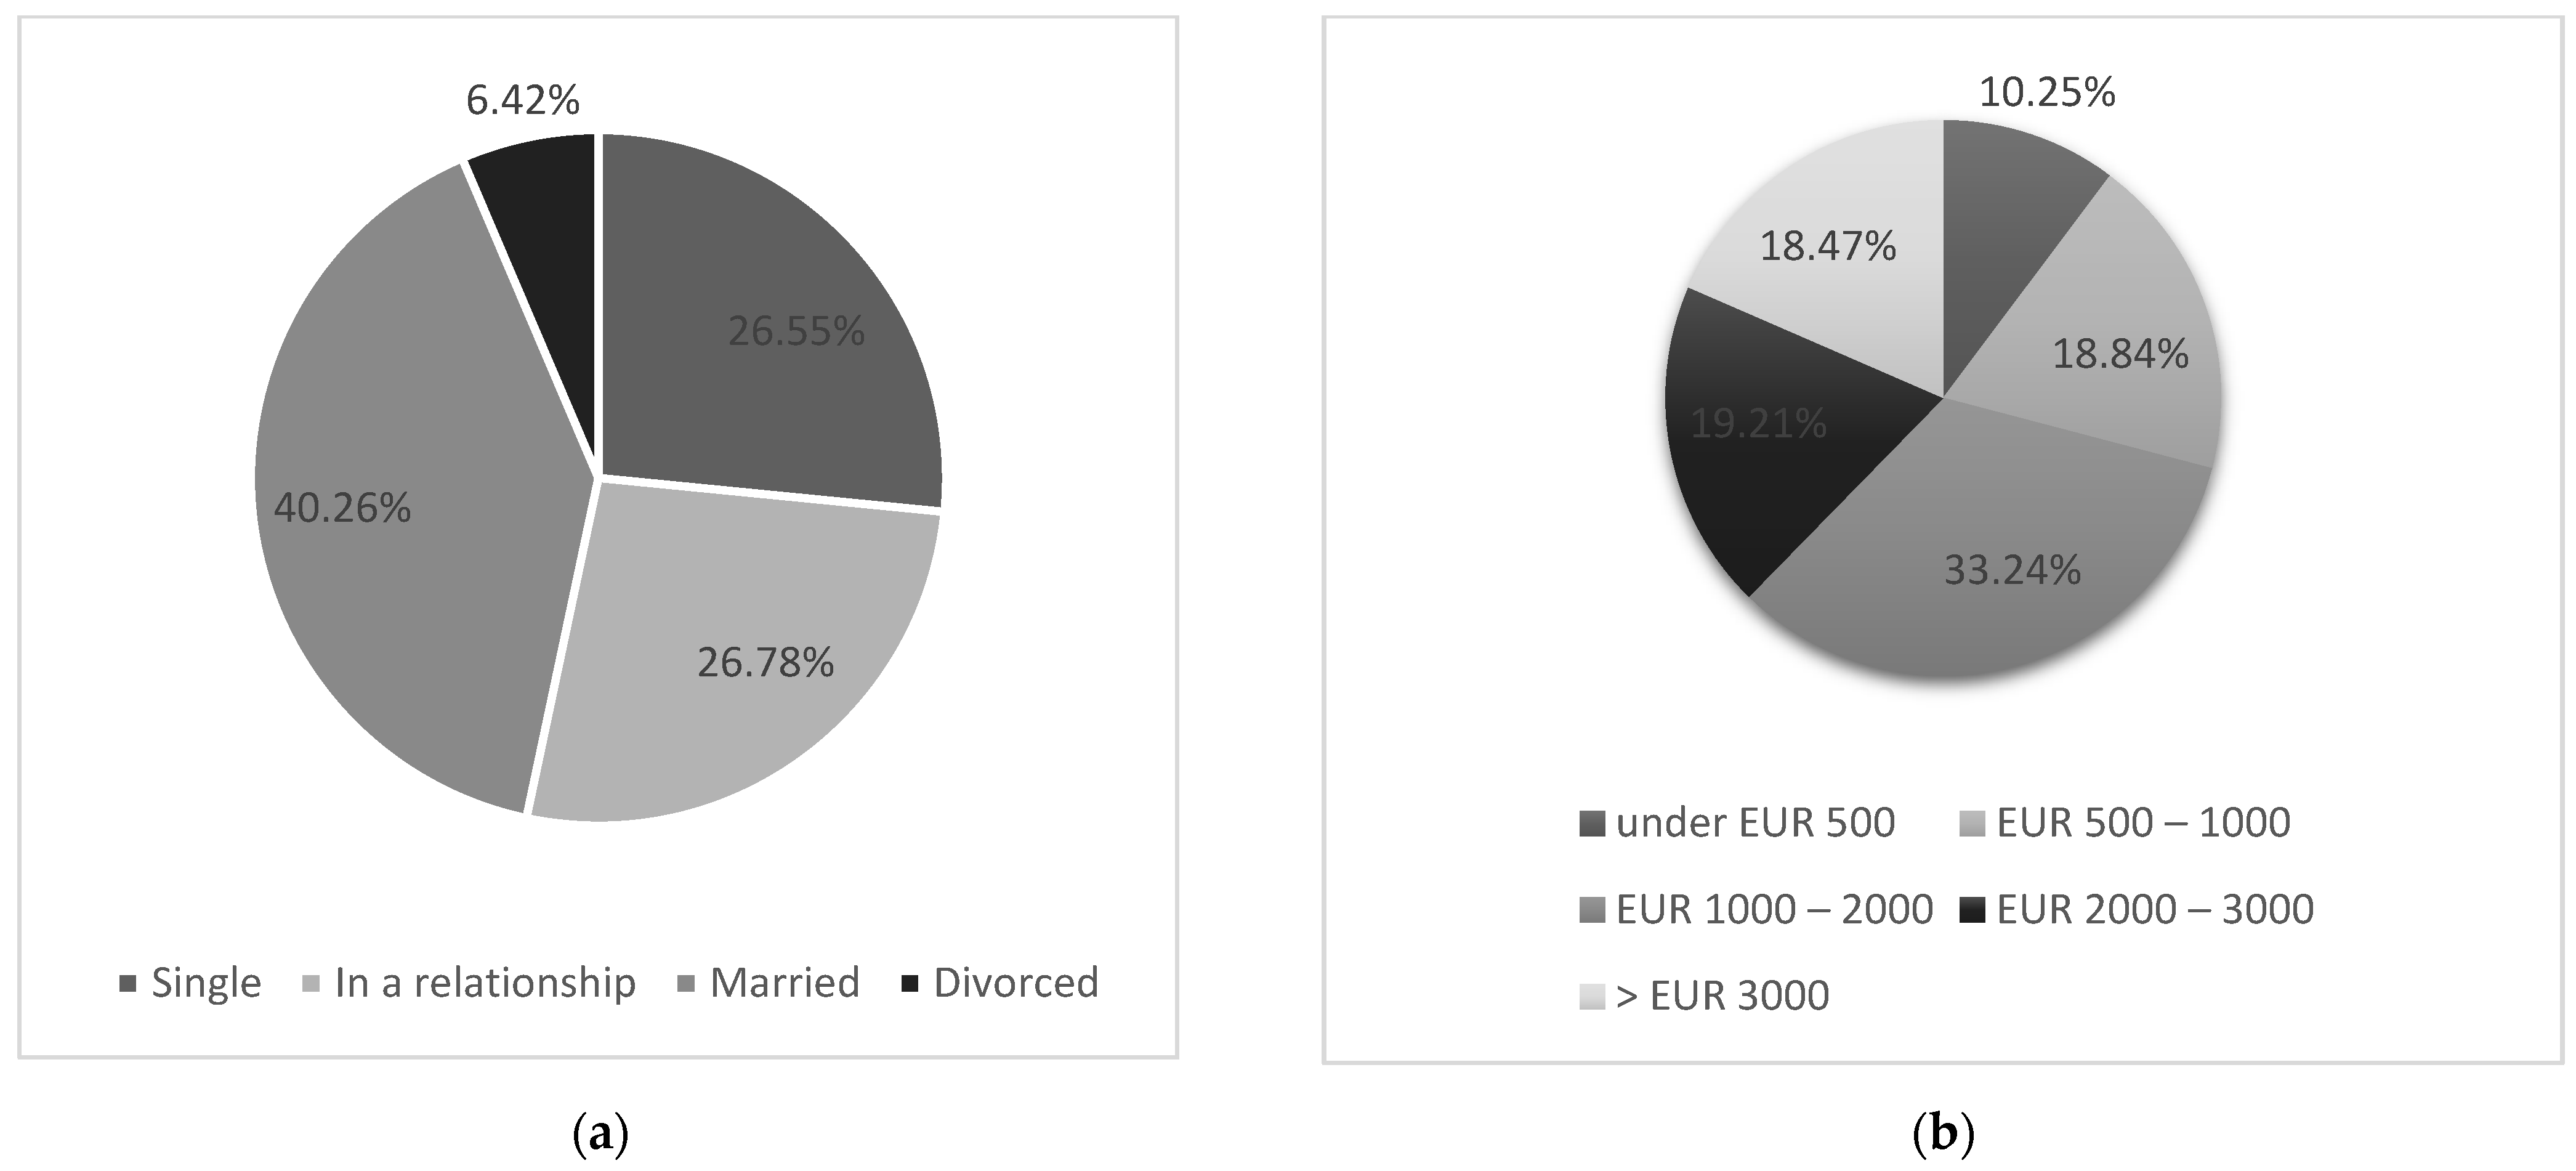
n ≥ 60). Detailed analysis of the major demographic factors is provided in
Appendix A, showing distributions of gender and age (
Figure A1), education and employment (
Figure A2), relationship status and income level (
Figure A3).
The survey was anonymous and consisted of closed-ended, Likert scale, and multiple-choice questions, grouped into three categories: demographic, banking, and neobanking characteristics. The questionnaire consisted of twenty-four questions: eight from the first category, six from the second, and ten from the third. During the modelling process, questions that did not show any significant effect on the dependent variable were gradually excluded. More details about the questionnaire are available from the authors.
The dependent variable was measured with a question: “Which bank do you have an account with?” Participants had four possible answers: only with a traditional bank, only with neobank, with both, and nowhere. Those who answered with the latter were deemed unfit and redirected to the end of the survey. The sample is therefore divided into three subgroups: users of traditional banks (y = 1), both (y = 2), and only neobanks (y = 3).
Table 1 shows descriptive statistics for the variables that showed significant effects. The rest of the descriptive statistics are available from the authors.
These data show great variability. Many variables have a median that is either equal or close to the mean, suggesting a relatively symmetric distribution. However, some variables representing banking characteristics show skewed distributions and high coefficients of variation.
In the next section, we present the model results. We applied the multinomial logit model as follows (
Cramer, 2003):
where
y = 1 is the base category,
j = 2, 3, and the summation index
m = 2, 3. This model was the most appropriate fit for our data’s characteristics. It is used when the dependent variable is composed of more than two categories and it allows the simultaneous comparison of more than one point of contrast (
El-Habil, 2012). Compared to other possible methods like polynomial regression, it is better suited for categorical outcomes without a natural order. Another possibility is factor analysis, which is not designed for predicting categorical outcomes. Alternative models like the conditional logit model could applied if the dataset also contained choice-specific variables such as the interest rate offered by specific banks. Explanatory variables are either binary or categorical, applying uniformly to all respondents; therefore, the multinomial logit model is the most appropriate model for analysing the characteristics of banking and neobanking users.
Additionally, the maximum likelihood estimator present in the multinomial logit model is the most appropriate fit when the dependent variable consists of several categories that have no natural ordering (
Kwak & Clayton-Matthews, 2002), like users of traditional banks, neobanks, or both. For more information regarding the model, see (
Cramer, 2003).
3. Results
In this section, we present the model’s results. First,
Table 2 shows a confusion matrix and the related accuracy measures.
The confusion matrix indicates effective distinguishment between the categories, with the majority of predictions clustered around the correct outcomes. The model performs exceptionally well in the second category. This validates the model’s practical value to banks.
Accuracy measures emphasize robust performance. High overall accuracy indicates that it is reliable in producing correct predictions. Additionally, high values of precision and recall indicate good balance between minimizing false positives and capturing true positives. A high micro score further validates consistent performance across all categories. These indicators confirm that the model is highly effective in predictions and therefore a highly suitable choice for these data. Multicollinearity diagnostics are presented in
Appendix B: Variance Inflation Factors (
Table A1) and marginal effects for every outcome (
Table A2,
Table A3 and
Table A4).
Table 3 presents the model’s results: the regression coefficient and significance (
p) for the second and third category of the dependent variable compared to the base category.
The model’s statistics indicate good statistical performance and suitability for these data. The log-likelihood value indicates a good overall fit. The classification ability is high for this type of research, especially for a multinomial model with three categories. The marginal effects are provided in
Appendix C.
We can divide the results into two groups: factors that increase the likelihood of a user choosing a neobank and those that decrease it. Demographic variables like education and relationship status show positive effects on neobank usage. Individuals with a bachelor’s or master’s degree are more likely to use neobanks exclusively, compared to using only traditional banks, suggesting that higher levels of education are associated with greater exposure to new trends like neobanks, higher digital literacy, and greater cost sensitivity. Singletons are also more likely to use both compared to divorced individuals, likely due to singletons having fewer financial needs, such as for joint accounts.
In contrast, age, self-employment, lower income, and residence in some countries decrease the likelihood of using neobanks. Users aged 30–40 and 40–50 years old are less likely to use neobanks, compared to users aged 50 and over. This could be due to the reduced digital adoption that is common in older generations. Neobanks often target younger generations with their marketing, which may not resonate with older generations. Age has also consistently proven to be a significant factor in previous findings on banking users’ characteristics (
Laukkanen & Pasanen, 2005,
2008;
Yousafzai & Yani-de-Soriano, 2012). Self-employed customers are also less likely to use both compared to retired individuals, possibly due to self-employed customers’ the lack of time for managing finances with multiple banks. Similarly, users earning between EUR 500 and 1000 monthly are less likely to use neobanks exclusively, compared to those earning above EUR 20,000. This could stem from various causes like limited tech access or greater financial needs that traditional banks fulfil better at the moment, like credit lending. Interestingly, users living in Slovenia, Austria, Bulgaria, Croatia, Cyprus, Denmark, Germany, Greece, Hungary, Ireland, Italy, Latvia, Lithuania, Malta, Poland, Romania, Slovakia, and Spain are less likely to use both compared to those living in Slovenia, Austria, Bulgaria, Denmark, Germany, Hungary, Ireland, Italy, Latvia, Lithuania, Romania, Slovakia, and Spain. This could stem from various causes, such as different digital habits or technological infrastructure, as well as preferences for local banking solutions.
Banking habits also play a crucial role in neobank usage. Users of one bank are less likely to use neobanks or both compared to users of more than three banks, suggesting that the principality of traditional banks is majorly present. However, those using two or three banks are more likely to use neobanks compared to those using more than three banks, suggesting that banking diversity positively impacts neobank usage. Additionally, users preferring mobile payments are more likely to use neobanks, most likely due to them being generally more tech-savvy and inclined towards digital services (
Amon et al., 2023). Users who prefer to conduct their banking services physically are more likely to use both, likely due to them having the need for services that traditional banks do not offer, like cryptocurrency integration and automated saving tools. However, those who prefer digital conduct or both physical and digital conduct are more likely to use neobanks exclusively, most likely because they are already used to digital services.
Users who always check a bank’s stability before opening an account are more likely to use neobanks exclusively. This could be due to neobanks marketing their stability more than traditional banks and often creating partnerships with them, which could cause them to be perceived as more stable.
Many neobanking habits also significantly affect neobank usage. Those who use neobanks because of their low costs or the services offered are more likely to use them exclusively. Neobanks offer more cost-effective services like free account maintenance (
Temelkov, 2020a), which attracts more cost-conscious users. Such users may see no need at all to use traditional banks, because neobanks fulfil their banking needs at a lower cost. Higher trust in neobanks also increases the probability of using neobanks exclusively, which is consistent with previous findings (
Yousafzai & Yani-de-Soriano, 2012), validating the importance of trust in banking decisions. Users likely view their chosen bank type as secure and are therefore less inclined to switch or add another bank.
Additionally, satisfaction with the speed of payments and transfers through neobanks increases the probability of using them exclusively. Their transfers and payments are quicker than those of traditional banks, often taking only seconds. Thus, it is reasonable that those appreciating the speed of conduct are more inclined to use neobanks.
Understandably, trust in traditional banks reduces the likelihood of using neobanks exclusively. Individuals bothered by AI in banking or believing that neobanks abuse data privacy are also less likely to use them. Neobanks’ infrastructure is heavily based on AI, so users uncomfortable with it may avoid using neobanking platforms. Moreover, users concerned with data privacy may feel more secure with the conventional methods of data storage used by traditional banks.
In terms of the disadvantages of neobanks, perceiving no physical visit, no personal contact, privacy, and digitalization as disadvantages reduces the likelihood of a customer using neobanks or using both. Neobanks should address these challenges to increase their adoption. Interestingly, some conflicting results were found regarding the perceived advantages of neobanks, particularly the belief that neobanks protect money, which showed negative effects. This is most likely due to misunderstandings or misinterpretations of the survey questions.
4. Discussion
For the first time, this study presents valuable insight into the characteristics of banking and neobanking users. We found several significant demographic characteristics determining the users’ choice of bank, including age, education, employment, relationship status, income, and country of origin, as well as many significant banking and neobanking habits. This substitutes existing research and provides a more comprehensive understanding of users’ characteristics and their effects on client attrition in banks, as well as demand for neobanks.
While previous literature has found some significant characteristics of banking users like age and trust, this study contributes many more, like education, employment, relationship status, and specific banking habits. Moreover, it is the first study of banking users’ characteristics to also include neobanking users. As such, these findings provide a more thorough understanding of the dynamics involved in consumers’ preferences in the quickly evolving banking industry, which offers important implications for several stakeholders.
Through testing and modelling, we have developed a tool that allows banks to perform a highly precise segmentation of their customers, enabling them to identify clients who possess a risk of partial or complete attrition. By partial attrition, we mean that a client remains with a traditional bank only for basic services, such as receiving their salary, while transferring the rest of their banking activities to a neobank. Complete attrition refers to the scenario where a client closes their account and fully shifts all their banking services to a neobank. Future research should focus on neobanking users as their quantity increases, studying how their significant characteristics are affected. It could also be beneficial to include contextual variables like regulation and macroeconomic indicators.
In the future, the key question will concern the further strategic development of neobanks in terms of expanding their services for customers. On the other hand, regulation will play an important role, particularly how banking regulators address neobanks in the future and to what extent they regulate them. Regulatory frameworks for neobanks are being developed. The European Commission (EC) established a FinTech Action Plan in 2018 to promote competition and integration in the European financial sector. The EU Digital Finance Platform and additional legislation were launched in order to develop an EU open finance framework and the Regulation of European Crowdfunding Service Providers. Additionally, there are measures present at a national level, including institutional support schemes like regulatory sandboxes and innovation hubs, which often also offer financial support (
Fast et al., 2024). The ECB notes that fintech providers are enhancing competition, access to finance, and therefore economic growth (
Dedola et al., 2023;
Fast et al., 2024). They highlight distribution platforms as especially significant regarding competition. The ECB also highlights the new risks fintech is introducing to regulatory arbitrage and financial stability, as well as potential disruptions for the traditional banking business model from low-cost digital distributers like neobanks (
Dedola et al., 2023). It is crucial that regulatory development considers the benefits of fintech and ensures its maximum potential is leveraged, while simultaneously addressing the proper management of new and emerging risks.
The growing presence of neobanks in financial markets calls for a re-evaluation of regulatory frameworks to better address their different banking business models (
Temelkov, 2022). Given our findings, policymakers should focus on strengthening cybersecurity and data protection in banks, therefore providing an environment that promotes innovation without endangering consumer protection.
Traditional banks should consider modernizing their services while maintaining the core advantages they have been shown to possess in this study: stability and personal interaction. Through the integration of additional digital solutions shown to be an advantage of neobanks, like speed, they could improve their competitive position. Neobanks should note their perceived advantages as found here, like speed, affordability, and accessibility. Working on the further enhancement of these features, along with addressing robust risk management, especially in terms of data protection, could be very significant in further strengthening their market position.
To summarise, this study’s findings can aid banks in developing more-accurate strategies for their customers. Enhanced understanding of their users’ characteristics supports financial inclusion and innovation, contributing to the furthering of a more resilient, adaptive, and advanced banking sector, efficient in fulfilling evolving consumer demands.


