Article

Unveiling the Dynamics of Financial Institutions and Markets in Shaping Economic Prosperity in MENA

Department of Finance, King Abdulaziz University, P.O. Box 80200, Jeddah 21589, Saudi Arabia
Int. J. Financial Stud. 2023, 11(4), 148; https://doi.org/10.3390/ijfs11040148
Submission received: 4 October 2023 / Revised: 5 December 2023 / Accepted: 7 December 2023 / Published: 13 December 2023

Abstract

:
This research explored the relationship between financial development and economic growth in the MENA region from 1996 to 2022. Using panel data, it assessed whether financial institutions and financial markets had differing impacts on economic growth. Various statistical methods, including OLS, GMM, quantile, and U-tests, were employed to analyze this correlation. Our findings revealed a nonlinear relationship between financial development (institutions and markets) and economic growth, characterized by an inverted U-shaped curve. This relationship was influenced by the MENA region’s limited financial regulations and the “vanishing effect”. Financial institutions were found to have an insignificant impact on economic growth but played a role in constraining it. Conversely, financial markets significantly contributed to growth initially, but this effect diminished over time, eventually turning negative. Additionally, this research highlighted the positive influences of liquidity and exports on economic growth, while noting that the rule of law and political stability had adverse effects.

1. Introduction

Schumpeter (1911) classically suggested that financial development (encompassing both institutions and markets) is instrumental in shaping economic growth, which has consistently been supported by much subsequent research, including Levine’s (2003) observation of “more finance, more growth”. The financial sector needs to be developed to bring about economic development, which occurs through the creation and expansion of financial institutions and financial markets, which facilitate substantial investments and growth. Such developments contribute to poverty reduction and an overall increase in welfare (Beck and Levine 2004; Bertocco 2008; Kemal et al. 2008; Levine 1997, 2003; McKinnon 1993; Rahaman 2011). Financial development enhances knowledge about profitable opportunities and promotes the efficient allocation of resources, driven by the creation of financial institutions, which reduce costs of obtaining information and increase contract and transaction implementation efficiency (King and Levine 1993a, 1993b; Demetriades and Hussein 1996; Levine et al. 2000; Hassan et al. 2011). Moreover, increased financial access fosters dynamic efficiency, stimulating structural modifications through innovation and overall economic advantages (see Rajan and Zingales 1998; Al-Yousif 2002; Jalil et al. 2010).
A contrary perspective, pioneered by Robinson (1952), posits that finance makes an insignificant contribution to economic growth and is conversely driven by the latter. Wijnberg (1983) and Buffie (1984) argued that, following financial development, borrowers from the informal sector shift to the formal sector, decreasing overall credit availability and restricting national economic growth. Lucas (1988) further contended that there is a limited impact of financial markets on an economy’s growth. It has been shown in various studies that the influence of financial development on economic growth depends on several interconnected variables, including inflation, financial sector policies, government size, trade openness, and per capita income, legal frameworks, cultural factors, and state ownership of banks (Rousseau and Wachtel 2002; Stulz and Williamson 2003; Yilmazkuday 2011; Abiad and Mody 2005; Ang 2008; Yilmazkuday 2011; Andrianova et al. 2008); other factors like remittances, trade and financial flexibility, political structures, and the quality of institutions can also have an effect (Rajan and Zingales 2003; Girma and Shortland 2008; Huang et al. 2010; Law 2009; Roe and Siegel 2011; Aggarwal et al. 2011; Law and Azman-Saini 2012; Law et al. 2018). These mediating factors indicate that the state of the economy affects financial development. Furthermore, Ibrahim (2007) and Loayza and Ranciere (2006) asserted that any impact of financial development on economic growth is ephemeral.
While some have suggested a nonlinear relationship between financial development and economic growth, Ang (2008) stressed that studies need to develop an accurate definition of functional forms to understand this relationship. Economic conditions can change abruptly, making nonlinear relationships more realistic regarding impacts on financial development. Assuming a linear relationship between finance and growth when there might be triggers for regime shifts could lead to inaccuracies in linear models’ predictions. By incorporating nonlinear features, such as threshold points, policymakers can better manage the amount of money to be expanded, as these points indicate critical levels for financial development’s impact on growth. To ensure the reliability and accuracy of estimates concerning the nonlinearity of the finance–growth relationship, appropriate measurements are essential for policymakers to utilize as a guide. A thorough understanding of this relationship allows policymakers to address specific issues and make informed decisions regarding the regulation, oversight, and monitoring of financial intermediaries.
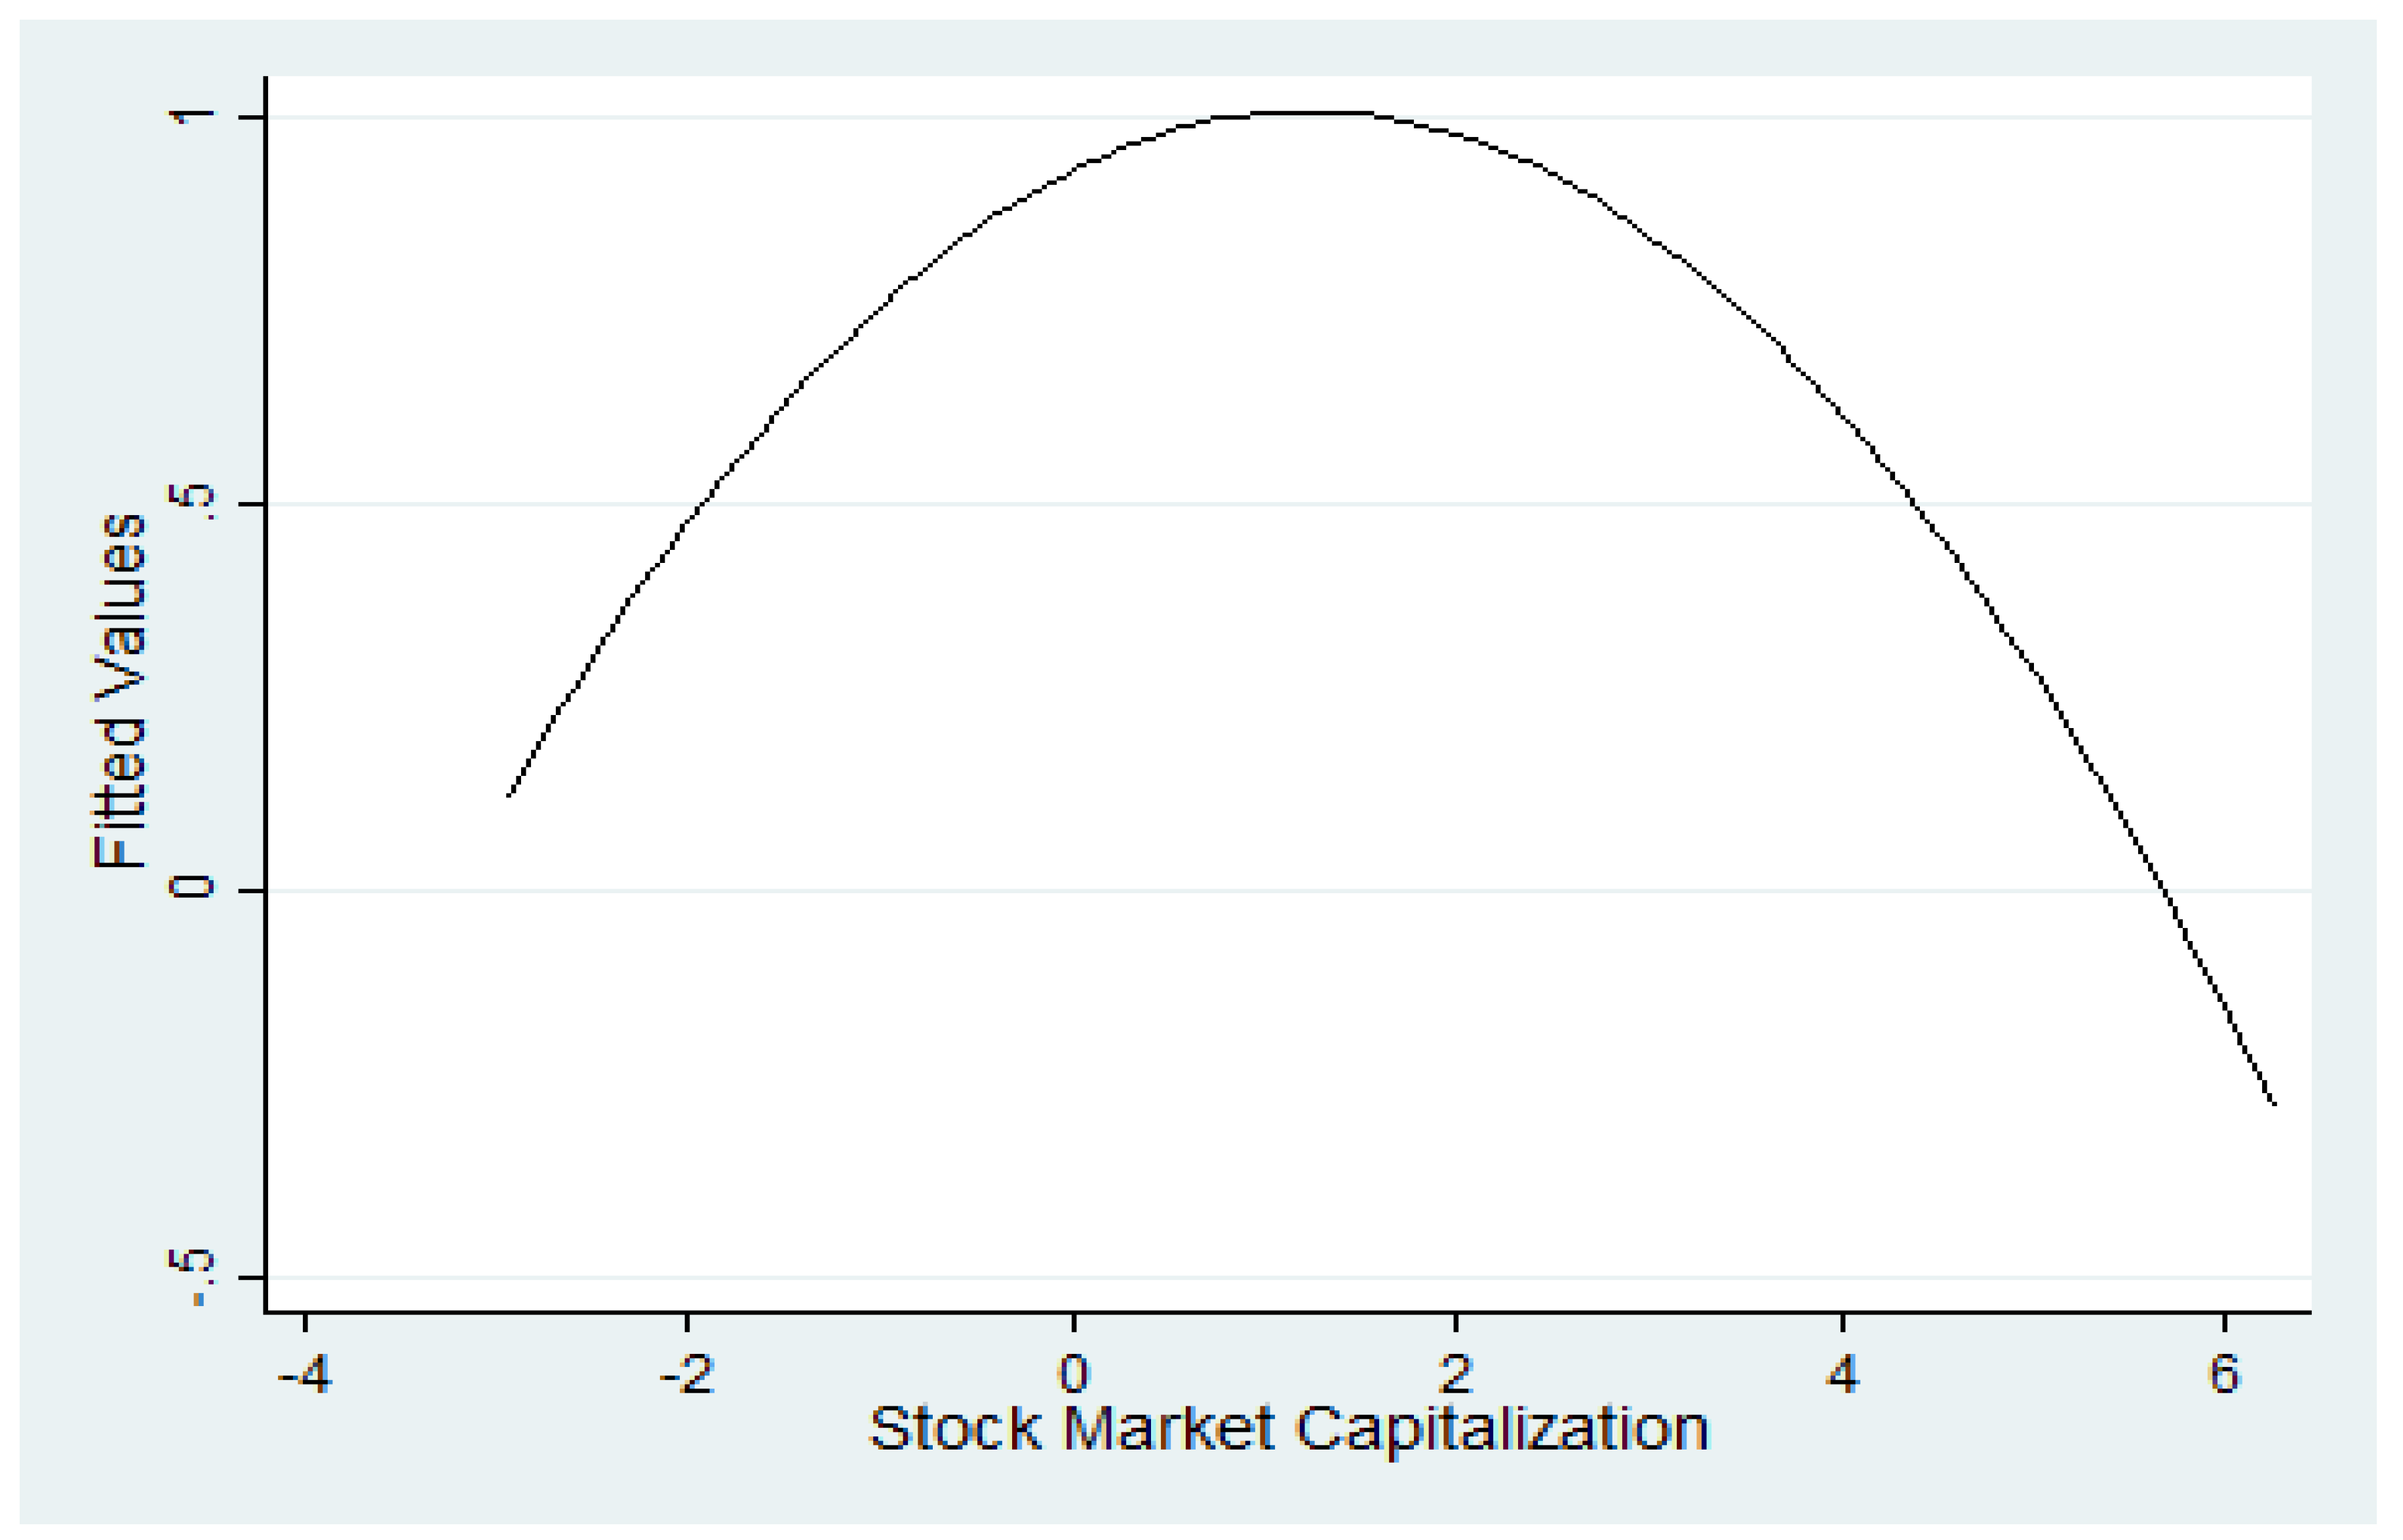
According to some studies, economic growth slowed down when financial development increased, with a nonlinear correlation represented by an inverted U-shape or Kuznets curve (Cecchetti and Kharroubi 2012). Inefficiencies in the derivative market were identified as the driving force behind this phenomenon, hindering the normative direction of financial flow (Law and Singh 2014; Arcand et al. 2015). Consequently, excessive liquidity without appropriate regulation and supervision could lead to what is known as the “financial curse”, i.e., the idea that “too much finance harms growth” (Samargandi et al. 2015). Aghion et al. (2005) also argued that the nonlinearity in the link between financial development and growth might be a limiting factor for the impact on economic growth. However, in a meta-analysis exploring the effect of financial development on economic growth carried out by Asongu (2013), contrasting results to the pioneering study of Schumpeter (1911) were determined.
Several reasons have been identified in recent studies for the nonlinear correlation between finance and growth that is represented by the inverted U-shaped curve. One factor is the presence of corruption within the banking sector, such as the unstable adherence to laws or political interference, which can lead to the misallocation of funds towards ineffective or even wasteful endeavors, thus limiting the positive impact of increased financial development on economic growth (Law et al. 2018). Furthermore, the ease of obtaining investment loans through commercial credit can facilitate productive investment. However, household loans are commonly utilized for non-productive objectives, such as personal consumption, with limited national economic growth benefits (Hung 2009). Another issue is that the financial sector employs only 3.9% of all workers; consequently, continued expansion of the industry leads to limited macroeconomic growth in terms of human capital (Cecchetti and Kharroubi 2012). Finally, it was observed by De Gregorio and Guidotti (1995) that if the financial sector undergoes liberalization under an unfavorable regulatory framework, greater financial intermediation may adversely affect growth.
The existing literature continues to present conflicting hypotheses regarding the relationship between finance and economic growth, arguing “more finance, more growth” (Levine 2003) and the opposite (Arcand et al. 2015; Law and Singh 2014). Law and Singh (2014) specifically questioned whether the negative impact of excessive financial activity on growth is only temporary. In this study, we aimed to contribute to the ongoing discussion by investigating the legitimacy of the “too much finance harms growth” theory, using the latest panel data for MENA countries for the years 1996–2022. MENA countries are of particular interest for this research, as financial development is considered a critical factor propelling regional economic growth. We sought to determine if there is nonlinearity in the finance–growth relationship and if the inverted U-shaped curve found in previous studies persisted during the years 1996–2022, indicating that financial activities are not effectively regulated and monitored. Additionally, we hypothesized that if the relationship between finance and growth modified to a U-shaped curve in the same period, then the negative impact of “too much finance” on growth would be temporary in MENA countries, indicative of robust financial systems in more recent economies with concurrent economic growth.
The rationale for this study’s economic focus has two key aspects. Firstly, despite the extensive body of research on financial development and economic growth, there is a notable gap when it comes to conducting in-depth analyses specific to the MENA region. The MENA nations face distinctive socio-economic challenges, encompassing issues like political instability, regional conflicts, reliance on finite resources (particularly oil and gas), elevated youth unemployment, the imperative need to diversify their economies, education and skill disparities, water scarcity, income inequality, and limited access to healthcare. These specific challenges call for a dedicated examination of how financial institutions and markets influence economic growth within this unique context. Secondly, the existing literature offers contradictory findings regarding the nonlinear relationship between financial development and economic growth. It indicates the presence of threshold effects and the potential for adverse consequences resulting from excessive financial development. Policymakers must grasp these complex dynamics, as inadequately regulated financial expansion could lead to economic imbalances and impede the pursuit of sustainable development. The main objective of this study was to evaluate whether the nonlinear relationship between financial development and economic growth is consistent, specifically the inverted U-shaped curve identified in earlier studies (Cecchetti and Kharroubi 2012; Law and Singh 2014; Arcand et al. 2015). Data from the period 1996–2022 were used for this purpose, which have not been included in previous research. As a result, different outcomes than those observed in earlier studies could be obtained, potentially supporting the hypothesis of a temporary effect of “too much finance harms economic growth” in MENA countries from 1996 to 2022.
The primary focus of this study was to assess the extent to which the roles of financial institutions and financial markets contribute to economic growth in MENA countries during the period 1996–2022, while also addressing endogeneity. Empirical studies carried out on the relationship between finance, institutions, markets, and growth in the past have generally backed a positive and monotonic relationship. Thus, this study aimed to investigate whether there might be a nonlinear correlation with a potential maximum threshold effect. This study aimed to explore the complementarity between financial institutions and financial markets, as measured by the financial development index of MENA economies. It sought to determine whether a well-developed financial sector, comprising both institutions and markets, creates a conducive environment for favorable growth effects on the overall financial industry. Additionally, this study investigated if the effect of either financial institutions or financial markets on economic growth becomes apparent only after a certain minimum threshold level is surpassed by the financial development index. This led to two essential questions:
  • Is the relationship between either financial institutions or financial markets and economic growth consistent with the overall level of financial development?
  • To what extent can either financial institutions or financial markets make more significant contributions to the process of economic growth? (i.e., are there any variations in the effects of financial institutions in comparison to financial markets on economic growth?)
In addressing these critical questions, this study built upon previous research, with significant implications for financial industry policies. In addition, they provide valuable insights regarding how variations in financial conditions in MENA economies impact the advantages of financial institutions and financial markets. To accomplish this, we performed a comparison of linear and nonlinear dynamic panel GMM models of financial development, considering both financial institution and financial market indicators to analyze the “vanishing effect” of financial development. Our initial findings suggested that financial development generally promotes economic growth, but the relationship between financial development and growth is not straightforward. Re-evaluating the non-monotonic hypothesis may reveal empirical evidence that supports the existence of a potential maximum financial development threshold. The growth effect of financial development, whether from financial institutions or financial markets, becomes negligible beyond this threshold. This suggests that expanding financial institutions and financial markets too much may lead to the creation of financial bubbles, causing the growth effect to disappear. Hence, it is not necessary to have a greater degree of financial development to achieve economic growth.
Furthermore, this study found that financial institutions have an insignificant impact on enhancing growth but a significant impact on restricting growth. In contrast, a critical role is played by financial markets in encouraging growth, which weakens over time and eventually negatively affects the economy. Thus, policymakers should focus on policies that prioritize the quality of finance instead of only expanding the finance sector if it is evident that further financial development significantly restricts economic growth after attaining the threshold level. However, if the data indicate that financial development significantly enhances economic growth after exceeding a given threshold level, policymakers should consider increasing financial depth by implementing stringent financial regulation so that the quality of financing is maintained.
To achieve its objectives, this study followed a systematic structure consisting of five parts. After this introductory section, Section 2 reviews the related literature and identifies gaps, followed by empirical model specification, variable selection, and econometric approaches used. Section 4 presents the empirical results and discusses relevant considerations, while Section 5 concludes the study.

2. Literature Review

Several models of the endogenous growth theory emerged from the 1980s that incorporated financial institutions and defined mechanisms through which financial development could impact economic growth, illustrating the impact of well-performing financial systems on saving and allocation decisions via capital accumulation and total factor productivity (Bencivenga and Smith 1991; Greenwood and Jovanovic 1990). Improved access to capital accumulation facilitated local and international investments, spurred by financial liberalization (Blackburn and Hung 1998). A positive relationship between long-term economic growth and the size of the financial sector, initially demonstrated by Goldsmith (1969) and King and Levine (1993a), demonstrated that the following decades continued to exhibit a strong relationship between the level of liquid liabilities and economic growth, indicating that financial depth was a positive determinant of the latter. Patrick (1966) presented the “supply-leading” hypothesis that indicated a causal link between economic growth and financial development. According to this hypothesis, purposeful establishment of financial institutions and markets enhances the provision of financial services, fostering tangible economic growth. (Nguyen et al. 2022). Researchers like King and Levine (1993b) and Goldsmith (1969) further explored the chains of this hypothesis. It has also been suggested that economic volatility can be reduced by financial development (Beck et al. 2014).
Previous studies established a causal relationship in both directions between the development of the financial sector and economic growth (Luintel and Khan 1999; Calderón and Liu 2003; Shan et al. 2001). However, Ang and McKibbin (2007) found evidence supporting the “demand-following” theory, suggesting that economic growth gives rise to financial development. On the other hand, the “supply-leading” theory was supported by other studies, which demonstrated that financial development drives economic growth (Neusser and Kugler 1998; Choe and Moosa 1999). Graff (2005) contributed to this body of research by highlighting three distinct perspectives regarding the causal relationship between economic growth and financial development. The first of these is the availability of a reliable and cost-effective form of payment, like coins or later banking money historically derived from fractional reserve banking (Rousseau and Wachtel 2000; Kindleberger 1993). The second is the volume effect, in which financial activity stimulated savings that could be channeled into investment (Ali et al. 2021). Finally, the third perspective is the allocation effect, which led to the more efficient allocation of resources for investment (Purewal and Haini 2021). The conclusion drawn from these studies was that it was advisable to pursue the idea of “more finance, more growth” (Roodman 2009a). However, it is important to note that these studies assumed a linear relationship between economic growth and financial development that remained constant over time.
Deidda and Fattouh (2002) revealed the presence of a nonlinear relationship between finance and economic growth, demonstrating that, in economies with a high initial per capita income, financial development had a positive and substantial effect on economic growth once a certain threshold was surpassed. However, in nations with a low initial per capita income, there was no statistically significant association between financial development and growth (Appiah et al. 2023). On the other hand, in intermediate-income nations, the link between financial development and growth was significant and sizable (Rioja and Valev 2004a). The effects observed in high-income countries were positive but very minor. They also observed that, in general, the impact of financial development on economic growth was positive, but it varied based on the level of development (Rioja and Valev 2004b). On the other hand, Graff (2005) showed that if countries diverge from a path of sustainable development, then the benefit they receive from a given amount of financial activity is comparatively less. Similarly, Huang and Lin (2009) used threshold regression with instrumental variables, provided by Caner and Hansen (2004), and a positive relationship between financial development and economic growth was determined. They noted that the positive impact was more significant in low-income nations in comparison to high-income nations. Interestingly, these studies used interaction models instead of quadratic models, despite them implying nonlinearity in the relationship between economic growth and financial development. In the research of Tsagkanos et al. (2021), they investigated the impact of financial development on stock market volatility. To measure the volatility effect on financial development, they would typically specify an econometric model that relate financial development and stock market volatility. They used statistical techniques that accounted for potential explanatory variables and controlled for other factors that can affect volatility, such as macroeconomic conditions or growth.
The literature presents inconsistent evidence regarding the relationship between financial development and economic growth, with some studies showing positive effects and others indicating negative effects (e.g., Schularick and Taylor 2012; Kaminsky and Reinhart 1999). Some studies explained that financial depth and economic growth had a positive long-term relationship, but one which was negative in the short term (Loayza and Ranciere 2006). Additionally, Broner and Ventura (2010) attributed this to the pro-cyclical nature of the financial sector, where financial liberalization did not sustain the increase in economic growth. Due to these inconsistent findings, academics and policymakers were motivated to review the “more finance, more growth” proposition and identify the optimal level of financial development that encourages economic growth. Shen and Lee (2006) identified patterns of nonlinearity in the form of an inverted U-shaped link between financial development and growth. Cecchetti and Kharroubi (2012), Arcand et al. (2015), and Law and Singh (2014) performed further studies that demonstrated a nonlinear relationship between finance and growth, characterized by an inverted U-shaped or Kuznets curve. This suggests that financial development can increase economic growth up to a specific point (Azman-Saini et al. 2010). However, if it exceeds the threshold level, then economic growth slows down because of the negative effect of the nonlinear nexus between finance and growth because of the “vanishing effect” (Arcand et al. 2015). Law and Singh (2014) proposed the hypothesis that “too much finance harms economic growth” based on this inverted U-shaped nexus.
Various techniques were used to assess the nonlinear relationship between finance and economic growth. Semi-parametric estimation was used by Arcand et al. (2015) with panel data of 100 developing and developed nations between the years 1960 and 2010. Cecchetti and Kharroubi (2012) used (OLS) to examine the nonlinear nexus in panel data for 50 countries for five-year periods between 1980 and 2009. Law and Singh (2014) addressed the endogeneity issue using a dynamic panel threshold formulated by Kremer et al. (2013). After this, they employed a dynamic GMM estimator for a quadratic model to increase the reliability of their findings. A quadratic model was employed by Samargandi et al. (2015) to evaluate the nonlinear nexus between growth and finance, employing panel data from 52 middle-income nations from 1980 to 2008.
This study aimed to address several gaps in the available literature by employing a nonlinear technique to identify changes in the relationship between finance and EG. First, it focused on data from the period of 1996–2022, providing insights into the recent economic conditions and assessment of the efficacy of financial development in MENA countries. Second, it investigated the consistency of the previously observed inverted U-shaped relationship between economic growth and financial development. Lastly, this study examined whether there are any discernible variations in the effects of financial institutions and financial markets on economic growth. To achieve these objectives, the paper utilized the U-test of Sasabuchi (1980) and Lind and Mehlum (2010) to confirm that the finance–growth relationship had a nonlinear pattern. Additionally, the two-step system GMM estimator was employed to estimate the quadratic model. The focus of this research was restricted to MENA countries, as financial development is a crucial element for economic growth, and it is essential for all countries aspiring to achieve development to have this.

3. Methodology, Data and Variable

3.1. Methodology and Model Specification

This study developed a panel data model by extending the existing empirical models to evaluate the main elements of economic growth, as determined using the growth ratio. The focus was on financial development and institutional and market indexes as indicators of financial aspects; the potential impacts of financial, government, and macroeconomic indicators on economic growth were specifically investigated. The pooled OLS statistical method was used, as commonly employed to identify relationships between growth and financial indicators, while also considering other determinants of growth (e.g., macroeconomic and governance indicators), as ascertained from previous research in the field of EG. The following equation represents the linear regression model:
g r o w t h i t = β 0 + β 1 F D I i t + β 2 I D i t + β 3 M D i t + β 4 L i q u i d i t y i t + β 5 I n f l a t i o n i t   + β 6 E x p o r t s i t + β 7 S c h o o l   e n r o l m e n t s i t + β 8 R u l e   o f   l a w i t   + β 9 P o l i t i c a l   s t a b i l i t y i t + β 10 G o v e r n m e n t   e f f e c t i v e n e s s i t + ε i t
where growth, the dependent variable, represents the growth rate in country i at time t; the financial sector vectors include FDI (financial development index), ID (institutional index), MD (market index), and liquidity; macroeconomic variables comprise exports, inflation, and school enrollments; and examples of governance indicators include political stability, the rule of law, and government effectiveness.
The first hypothesis cannot be tested using Equation (1), as it may not fully capture the variation in the relationship between growth and the variables in the financial sector. The previous literature has provided conflicting findings regarding the relationship between the financial development index, market index, and institutional index with growth, leading to competing hypotheses examined in this study. Nonetheless, these findings only represent a part of the nonlinear relationship and not the entire phenomenon. The nonlinearity typically manifests at the turning point, where both excessive and insufficient funding can lead to similar outcomes. To address this, this study adopted Equation (2) following previous studies (Farinha 2003; Gugler and Yurtoglu 2003; Rahman 2019). Equation (2) represents the nonlinear regression model; it was used to analyze the nonlinear relationship between growth and the financial indicators, incorporating the squares of FDI, ID, and MD and the U-test for determining the turning point:
g r o w t h i t = β 0 + β 1 F D I i t + β 2 I D i t + β 3 M D i t + β 4 F D I i t 2 + β 5 I D i t 2 + β 6 M D i t 2   + β 7 L i q u i d i t y i t + β 8 I n f l a t i o n i t + β 9 E x p o r t s i t   + β 10 S c h o o l   e n r o l m e n t s i t + β 11 R u l e   o f   l a w i t   + β 12 P o l i t i c a l   s t a b i l i t y i t + β 13 G o v e r n m e n t   e f f e c t i v e n e s s i t + ε i t
This equation uses FDI, MD, and ID as the squared values of the variables, allowing us to explore the nonlinear effect of a country’s financial indicators on growth and to understand how economic growth can be affected by varying levels of these financial sector variables. A positive sign indicates a nonlinear, inverse, and normally distributed relationship, whereas a negative sign indicates a normally distributed nonlinear relationship. Hence, the squared term represents the type of nonlinear relationship being investigated.
Due to the potential heterogeneity issue in OLS, quantile regression (QR) may offer a solution by examining various scenarios related to quantile functions (Shaddady and Moore 2019). The function of quantile regression is to determine parameters for every quantile of the dependent variable. Unlike OLS, which examines the impact of independent factors on the mean value of the dependent variable, this method shows the influence of independent variables on each quantile of the dependent variable. This approach was based on the multiplicative model, designed to account for simultaneity beside heteroscedasticity. The quantile model can be represented by the following equation:
Q τ i t g r o w t h τ i t x t = a τ i t + β τ 1 F D I i t + β τ 2 F D I i t 2 + β τ 3 I D i t + β τ 4 I D i t 2 + β 5 M D i t + β τ 6 M D i t 2 + β τ k x k i t + ε i t
where I represents countries; t signifies time; Q τ i t represents quantiles; F D I i t 2 , M D i t 2 , and I D i t 2 are the squared values of the variables; ε i t represents the error term; and x k i t is an additional explanatory variable. To address endogeneity and ensure robustness, a two-step system GMM was employed (Arellano and Bover 1995). The presence of reverse causation among the indicators makes it challenging for OLS and quantile regressions to fully eliminate the potential endogeneity problem. To address this issue and support the use of the GMM dynamic model, a lagged dependent variable was included as an independent variable. In addition, the GMM helps reduce the serial autocorrelation among the error term and endogenous variables (Ali et al. 2021). This study employed an instrumental variable two-stage regression technique to address endogeneity, particularly in the context of financial indicators and growth.

3.2. Variable Definitions

3.2.1. Dependent Variable

This research relied on up-to-date investigations employing GDP per capita growth as a measure of financial development. GDP per capita growth is determined by dividing the total gross value produced by all resident producers in the economy by the population.

3.2.2. Independent Variables

Several factors influence the analysis of economic growth. Financial indicators have been employed in several studies, such as the relative ranking of countries in terms of the depth, access, and efficiency of their financial markets and institutions that serve as a substitute for the financial development index. Similarly, the ratio of bank capital to total assets has been used in certain studies as a proxy for the financial institution index of different countries. On the other hand, research has revealed that there is a notable effect when using stock market capitalization as a substitute for the financial market index. Hence, there is a lack of consensus on how these financial indicators should be utilized, which is why this particular study adopted a comprehensive approach. It utilized the financial development index in which countries are ranked in terms of the depth, access, and efficiency of their financial markets and institutions. It estimated the financial indicators using the institutions’ index, which represents the ratio of bank capital and reserves to total assets; the market index, which represents the overall value of all publicly traded businesses’ shares; and liquidity, which assesses a business’s ability to convert assets into cash so that it can fulfill its urgent requirements in a country.
Inflation, school enrollments, and exports of a country were used as measures of macroeconomic indicators to determine their impact on economic growth.
This study established three governance variables as controls: political stability, rule of law, and government effectiveness. While corporate governance encompasses various factors, this research focused solely on these three variables; in several countries, there was limited information available on other areas of corporate governance and the high correlation that may exist among some governance variables. Notably, given the potential for multicollinearity arising from the high correlation among the governance indicators—rule of law, political stability, and government effectiveness—and considering that the model incorporates the growth of key economic variables, the estimation utilized the annual changes of the governance indicators rather than their levels. Table 1 presents a detailed explanation of each variable.

3.3. Data and Descriptive Statistics

The World Development Indicators database provided data on related-party dealings, growth, and macroeconomic indicators. On the other hand, the data on governance were sourced from the Worldwide Governance Indicators database, and the data on financial indicators came from the International Monetary Fund database, except for liquidity, which was obtained from the Global Financial Development database. To ensure comparability and relevance, the focus of the data collection was on the MENA region, given the region’s similar economic and financial conditions, as well as variations in governance across the countries in the sample.
The descriptive data for the key variables are shown in Table 2. It was determined that the growth rate was approximately 59% on average, and the FDI was typically negative (1.37). However, the liquidity was generally between 20 and 80, with an average of 42. The average inflation was around 7.6, ranging from −30 to 150. There were also differences in exports between nations, ranging from −70.5 to 218 and having an average value of 3. There were between 13 and 116.4 students enrolled in school, with an average of 77.1. The values of political stability, the rule of law, and government effectiveness were all negative, 65%, 34%, and 32%, respectively. This was because of the political and government instability in MENA countries.
Table 3 presents the relationships among the variables examined in the primary test. A robust correlation of 0.58 was observed between the financial development index and the rule of law, which was as expected. The dependent variable, growth, exhibited the strongest negative correlation of −0.27 with other independent factors. A negative relationship was found between liquidity and student enrollment; however, inflation and exports were found to be positively related. The governance indicators exhibited weak correlations. Overall, the correlations between development and other crucial factors were consistent with previous research findings and theories.

4. Empirical Evidence

4.1. Linear Model and Nonlinear Model

4.1.1. Linear Relationship between Economic Growth and Financial Development

Table 4 presents the results of pooled OLS and GMM methods along with the estimated parameters of Equation (1), shown in columns 1 and 2. The findings indicate that FDI has a significant and positive effect on EG. FDI contributed to growth by increasing the savings rate, mobilizing and pooling savings, facilitating investment reporting and analysis, promoting the inflow of foreign capital, and optimizing capital allocation. This led to capital accumulation and technological development, fostering EG. Furthermore, liquidity positively influenced growth. Increased money in the markets lowered interest rates, which made borrowing more affordable and ultimately stimulated economic activity. While inflation and government performance showed positive effects on growth, these were not statistically significant. On the other hand, exports had a significant and positive impact on the dependent variable, signifying that higher export levels indicated robust industrial production and increased employment, which positively influenced EG. In contrast, there were negative effects of political stability and school enrollment on growth, although they were not statistically significant. However, the rule of law had a significantly negative effect on growth.
Once again, these findings add to the complexity of understanding the relationship between financial development and growth. To properly address the influence of financial development on growth, a quadratic function needs to be introduced for the financial development variables, as demonstrated in Table 4. It became evident that a linear specification was inadequate to fully capture this impact. The linear correlation between FDI and growth can be seen in Figure 1.

4.1.2. Nonlinear Relationship between Economic Growth and Financial Development

We re-examined the impact of FDI on growth in the next section by incorporating a quadratic function for the financial development index, as indicated in Equation (2). The results in Table 4, columns 3 and 4, revealed that there were statistically significant positive and negative effects of FDI and F D I 2 (respectively) on growth, which confirmed the existence of a nonlinear correlation. Upon closer examination of this relationship, it became evident that growth was initially fostered by enhancing the financial sector in MENA countries, but over time, this effect became inverse, which may be because of what is known as the “vanishing effect”. It has been shown that there is a powerful relationship between FDI and the rule of law, and the lack of financial regulation in the Middle East is explained by the previous finding that the latter has a negative value. This also accounts for the nonlinear correlation between FDI and growth. Interestingly, the nonlinear relationship exhibited a normal distribution. Figure 2 presents the actual regression in Equation (2) to illustrate the relationship between FDI and growth.
A nonlinear correlation between a country’s financial development and growth was shown by an inverted U-shaped curve or normal distribution. In practical terms, this U-shaped curve or nonlinear correlation between FDI and growth indicates that the financial development index affects growth. Consequently, improvements in the depth, accessibility, stability, and efficiency of the financial system would initially have a positive impact on growth up to a certain point, after which growth would be adversely affected by further increases in the financial development index, which is attributable to a lack of financial regulation.
A regularly distributed pattern between economic growth and financial development was shown by the nonlinear correlation depicted in Figure 2. Initially, up to a specific level, FDI positively influenced growth. In Figure 2, this inflection point or extreme point is represented by −1.7 for FDI (refer to Table 5). However, beyond this point, any further increase in FDI could potentially have a negative impact on growth because of the instability of financial regulations.
Table 3 further demonstrates the normal correlation between growth and FDI. Similarly, Table 5 uses the U-test (Lind and Mehlum (2010)) to estimate the following models, whereby the hypothesis H 0 and the opposing hypothesis H 1 were compared:
G r o w t h = a   F D I + β F D I   2 + z i c + ε i t
H 0 : a + b 2 F D I m i n 0 U   ( a + b 2 F D I m a x 0 )
H 1 : a + b 2 F D I m i n > 0 U   ( a + b 2 F D I m a x < 0 )
where F D I m a x and F D I m i n represent the maximum and minimum values of financial development (respectively). A non-monotonic association between growth and financial development was shown by the rejection of the null hypothesis. The data in Table 5 reject the null hypothesis, affirming the presence of a nonlinear correlation.
Similarly, the analysis of other financial development indicators, namely ID (institutional index) and MD (market index), also revealed a nonlinear correlation with economic growth for the same reasons. Both ID and MD generally exhibited a positive impact on growth until a specific threshold, beyond which the effect turned negative, confirming the existence of a nonlinear relationship between the institutional index, market index, and growth. In Figure 3 and Figure 4, the inflection or extreme points are observed at 6.82 and 9.4 for ID and MD, respectively (refer to Table 6 and Table 7). However, the influence of financial institutions on increasing growth was relatively insignificant, while their impact became more detrimental to growth. The results indicate that markets initially played a crucial role in promoting growth, but this positive effect subsequently diminished, leading to a negative impact on the economy (refer to Figure 3).
The results of both linear and nonlinear regressions for governance indicators are shown in Table 4. The underdeveloped governance framework in MENA could be a contributing factor to the lack of strong evidence supporting the notion that better-governed corporations are more likely to promote growth, as seen in most metrics such as political stability and government effectiveness. The results indicate that the growth in the MENA region is significantly and negatively affected by the rule of law. This finding aligns with previous findings indicating the adverse impact of an absence of financial regulation on EG. On the other hand, liquidity demonstrates a consistently significant and positive effect on growth, as evidenced in both linear and nonlinear relationships presented in Table 4.
In this section of the research, the focus is on investigating how macroeconomic indicators influence growth. The estimates obtained from both linear and nonlinear models that utilized pooled OLS revealed that macroeconomic indicators had a positive but statistically insignificant effect on growth for exports. In contrast, they showed a statistically non-significant effect on growth for inflation and a negative but non-significant effect on school enrollment (as shown in Table 4). Notably, the outcomes from the linear relationship were consistent with those of the nonlinear relationship that provided similar outcomes.

4.2. Robustness Checks: Quantile Regressions

Robustness checking was undertaken utilizing QR to examine various variables related to quantile functions. Beyond just addressing outliers, OLS can have other issues related to heterogeneity (Lee and Li 2012). The assumption that “error terms are identically distributed at all points of the conditional distribution” was addressed by the QR, which employed the conditional distribution’s median, in contrast to OLS, in which the average behavior of the sample was reflected (Klomp and De Haan 2012). Consequently, this research revisited the nonlinear model by employing quantiles Q25, Q50, and Q75 to ensure the robustness of the findings. Quantile regression was a suitable approach for assessing the correlation between explanatory variables and economic growth, with GDP per capita growth being the dependent variable. Table 8 shows the outcomes, where close consistency with the primary conclusions is demonstrated by all explanatory indicators, specifically the noteworthy impact of both FDI and F D I 2 over all quantiles. For a visual representation of the quantile regression analysis depicting the nonlinear relationship between economic growth and financial development, governance, and macroeconomic indicators, refer to Figure 5 (as indicated in Table 8).

4.3. GMM, Endogeneity and Instrumental Variable (Robustness Checks)

The relationship between growth and explanatory variables can potentially give rise to reverse causality or a correlation between the error term and explanatory variables, leading to an endogeneity issue (Poletti Hughes 2008). This potential endogeneity concern of growth within the nonlinear model can be managed by performing an empirical test by employing the dynamic GMM estimator (Chen and Kao 2014). The results, as presented in Table 4, exhibited consistency, particularly for the financial development indicators, suggesting that endogeneity did not pose a significant challenge in the empirical model. The Hansen test for over-identifying restrictions that are part of the dynamic GMM estimator is also included in Table 4. No evidence of such over-identifying restrictions could be seen in the outcomes of the test. The validity of the GMM estimator was further verified by conducting first- and second-order autocorrelation tests (also referred to as AR (1) and AR (2)). According to the findings, there was a significant p-value for AR (1), indicating a first-order autocorrelation; however, this does not inherently imply inconsistent estimates, as consistency was only compromised in the presence of a second-order autocorrelation. The AR (2) test did not endorse the existence of such an issue. Furthermore, there were notably fewer instruments relative to groups, as discussed by Roodman (2009b).
The issue of endogeneity between financial development and growth was also handled in the study by employing the instrumental variable-two-stage regression methodology. This involved utilizing financial development indicators ( F D I 2 , I D 2 , and M D 2 ) as the dependent variables in the initial stage. Instrumental variables were used to estimate these indicators, including factors like credit information sharing, religious affiliation (Sunni, Shia, and Christian), number of bank branches, rights for creditors and borrowers, and the quality of regulations as independent variables. Subsequently, in the second stage, the projected financial development indicators (fitted values) from the first stage were introduced to assess the nonlinear impact of financial development on growth. The presence of a nonlinear relationship between financial development and growth was confirmed by the data presented in Table 8.

4.4. Robustness Check: Liquidity, School Enrollment, and Governance Impact

This study confronted a critical challenge stemming from the high correlation among key governance indicators—rule of law, political stability, and government effectiveness—sourced from the Worldwide Governance Indicators of the World Bank. This study identified the resulting econometric issues, emphasizing the unacceptable compromise of empirical results’ reliability for making sound economic inferences. The disproportionate influence of two variables exacerbated scale bias, necessitating a reconsideration of model inclusion. To mitigate these challenges, Table 9 presents the results of the robustness check using the generalized method of moments (GMM) analysis, focusing on the interplay of current liquidity, school enrollment levels (across primary, intermediate, and secondary tiers), and the associated impact on governance indicators. The results were consistent with the main findings, indicating that the relationship between liquidity and school enrollment did not significantly impact economic growth. Furthermore, governance variables remained in line with the primary results. Notably, there was a negative impact of political stability and rule of law on growth in the MENA region. This underscores the adverse effects of political instability and legislative deficiencies on economic development in the region.

5. Conclusions

Linear and nonlinear correlations were evaluated in this study across 17 countries within the MENA region spanning 26 years (1996–2022). The objective was to assess how financial development affected economic growth within MENA. The primary focus was shedding light on the nuanced association between financial development and growth and exploring the contributions of governance frameworks and macroeconomic indicators to the relationship between them.
Based on earlier empirical outcomes derived from a linear model, economic growth exhibited a positive correlation with financial development indices. However, the outcomes took a different direction when a nonlinear model was introduced, revealing a nonlinear connection between financial development and economic growth. The basis of the hypotheses of the U-test was a previous estimation (Lind and Mehlum 2010). This study’s findings, which counter the earlier concept suggesting the temporary harm of excessive finance on economic growth, underscore the presence of a nonlinear, U-shaped relationship between financial development and economic growth within MENA countries. The analysis specifically identified the presence of a normal distribution or an inverted U-shaped curve at the intersection of financial development and EG. While the enhancement of the financial sector can considerably enhance a country’s economy, this positive impact can also be offset by weak or unstable regulatory frameworks, leading to negative consequences.
Governance practices and relevant macroeconomic indicators were used in this research, and these aid policymakers in comprehending their potential influence on EG. The findings of this study could also offer valuable insights for managers, specifically within the MENA region, seeking to discern the factors affecting financial development and to gain a deeper understanding of such dynamics. Furthermore, this paper illustrates that the level of economic regulations and macroeconomic variables, like inflation (Yilmazkuday 2011) and regulations influencing the financial sector (Abiad and Mody 2005), act as crucial determinants in shaping the effect of financial development on EG. This interdependence underscores the susceptibility of the role played by finance in driving EG.
The results of this study can serve as valuable guidance for policymakers and those in the financial sector management, aiding them in formulating effective financial policies, regulations, and frameworks that foster the positive contribution of the financial sector to overall economic development. This research emphasizes the significance of enhancing the financial sector’s quality alongside supporting its development as part of stimulating EG. This underscores the importance of a dual approach, whereby financial rules are simultaneously broadened and strengthened, accompanied by enhanced oversight and control of financial activities. This approach aims to ensure that financial development positively affects economic growth and curtails the “vanishing effect”. Furthermore, this study aligned with the notion of “more and better finance, more growth”, taking into consideration the quantity as well as the quality of financial resources.
This paper substantiated and strengthened the outcomes by suggesting that researchers conduct additional investigations that encompass a broader range of regions or countries, while also considering a wider array of control variables or alternative governance indicators.

Funding

This research received no external funding.

Informed Consent Statement

Not applicable.

Data Availability Statement

Data are available from the authors upon request.

Conflicts of Interest

The author has no conflict of interest to declare.

References

  1. Abiad, Abdul, and Ashoka Mody. 2005. Financial Reform: What Shakes it? What Shapes it? American Economic Review 95: 63–88. [Google Scholar] [CrossRef]
  2. Aggarwal, Reena, Asli Demirgüç-Kunt, and Maria Soledad Martinez Pería. 2011. Do remittances promote financial development? Journal of Development Economics 96: 255–64. [Google Scholar] [CrossRef]
  3. Aghion, Philippe, Nicholas Bloom, Richard Blundell, Rachel Griffith, and Peter Howitt. 2005. Competition and innovation: An inverted-U relationship. The Quarterly Journal of Economics 120: 701–28. [Google Scholar]
  4. Ali, Muhammad, Syed Haider Hashmi, Muhammad Rizwan Nazir, Anam Bilal, and Muhammad Imran Nazir. 2021. Does Financial Inclusion Enhance Economic Growth? Empirical Evidence from the IsDB Member Countries. International Journal of Finance & Economics 26: 5235–58. [Google Scholar]
  5. Al-Yousif, Yousif Khalaf. 2002. Financial Development and Economic Growth: Another Look at the Evidence from Developing Countries. Review of Financial Economics 11: 131–50. [Google Scholar] [CrossRef]
  6. Andrianova, Svetlana, Panicos Demetriades, and Anja Shortland. 2008. Government Ownership of Banks, Institutions and Financial Development. Journal of Development Economics 85: 218–52. [Google Scholar] [CrossRef]
  7. Ang, James B. 2008. Are Financial Sector Policies Effective in Deepening the Malaysia Financial System. Contemporary Economic Policy 26: 623–35. [Google Scholar] [CrossRef]
  8. Ang, James B., and Warwick J. McKibbin. 2007. Financial Liberalization, Financial Sector Development and Growth: Evidence from Malaysia. Journal of Development Economics 84: 215–33. [Google Scholar] [CrossRef]
  9. Appiah, Michael, Bright Asamoah Gyamfi, Temidayo Stephen Adebayo, and Festus Victor Bekun. 2023. Do Financial Development, Foreign Direct Investment, and Economic Growth Enhance Industrial Development? Fresh Evidence from Sub-Saharan African Countries. Portuguese Economic Journal 22: 203–27. [Google Scholar] [CrossRef]
  10. Arcand, Jean-Louis, Enrico Berkes, and Ugo Panizza. 2015. Too Much Finance? Journal of Economic Growth 20: 105–48. [Google Scholar] [CrossRef]
  11. Arellano, Manuel, and Olympia Bover. 1995. Another Look at the Instrumental-variable Estimation of Error-components Models. Journal of Econometrics 68: 29–52. [Google Scholar] [CrossRef]
  12. Asongu, Simplice. 2013. Finance and Growth: Schumpeter Might Be Wrong in Our Era. New Evidence from Meta-Analysis. African Governance and Development Institute, AGDI Working Paper WP/13/009. Yaounde: African Governance and Development Institute. [Google Scholar]
  13. Azman-Saini, Wai Noor Wafda, Ahmad Zubaidi Baharumshah, and Siong Hook Law. 2010. Foreign Direct Investment, Economic Freedom, and Economic Growth: International Evidence. Economic Modelling 27: 1079–89. [Google Scholar] [CrossRef]
  14. Beck, Thorsten, and Ross Levine. 2004. Stock Markets, Banks, and Growth: Panel Evidence. Journal of Banking & Finance 28: 423–42. [Google Scholar]
  15. Beck, Thorsten, Hans Degryse, and Christian Kneer. 2014. Is more finance better? Disentangling intermediation and size effects of financial systems. Journal of Financial Stability 10: 50–64. [Google Scholar] [CrossRef]
  16. Bencivenga, Vittorio Rosario, and Bruce David Smith. 1991. Financial Intermediation and Endogenous Growth. The Review of Economic Studies 58: 195–209. [Google Scholar] [CrossRef]
  17. Bertocco, Giancarlo. 2008. Finance and Development: Is Schumpeter’s Analysis Still Relevant? Journal of Banking & Finance 32: 1161–75. [Google Scholar]
  18. Blackburn, Keith, and Victor Hung. 1998. A Theory of Growth, Financial Development and Trade. Economica 65: 107–24. [Google Scholar] [CrossRef]
  19. Broner, Fernando, and Jaume Ventura. 2010. Rethinking the Effects of Financial Liberalization. Working Paper, No. w16640. Cambridge: National Bureau of Economic Research. [Google Scholar]
  20. Buffie, Ernest. 1984. Financial Repression, the New Structuralists, and Stabilization Policy in Semi-Industrialized Economies. Journal of Development Economics 14: 305–22. [Google Scholar] [CrossRef]
  21. Calderón, César, and Lin Liu. 2003. The Direction of Causality between Financial Development and Economic Growth. Journal of Development Economics 72: 321–34. [Google Scholar] [CrossRef]
  22. Caner, Mehmet, and Bruce Hansen. 2004. Instrumental Variable Estimation of a Threshold Model. Econometric Theory 20: 813–43. [Google Scholar] [CrossRef]
  23. Cecchetti, Stephen, and Enisse Kharroubi. 2012. Reassessing the Impact of Finance on Growth. BIS Working Paper No. 381. Basel: Bank for International Settlements. [Google Scholar]
  24. Chen, Tsung-Yu, and Lie-Jane Kao. 2014. Dividend changes and information about future profitability: An application of difference GMM. Applied Economics Letters 21: 505–8. [Google Scholar] [CrossRef]
  25. Choe, Chongwoo, and Imad A. Moosa. 1999. Financial System and Economic Growth: The Korean Experience. World Development 27: 1069–82. [Google Scholar] [CrossRef]
  26. De Gregorio, José, and Pablo Guidotti. 1995. Financial Development and Economic Growth. World Development 23: 433–48. [Google Scholar] [CrossRef]
  27. Deidda, Luca, and Bassam Fattouh. 2002. Nonlinearity between Finance and Growth. Economics Letters 74: 339–45. [Google Scholar] [CrossRef]
  28. Demetriades, Panicos O., and Khaled A. Hussein. 1996. Does Financial Development cause Economic Growth? Time-series Evidence from 16 Countries. Journal of Development Economics 51: 387–411. [Google Scholar] [CrossRef]
  29. Farinha, João. 2003. Dividend policy, corporate governance and the managerial entrenchment hypothesis: An empirical analysis. Journal of Business Finance & Accounting 30: 1173–209. [Google Scholar]
  30. Girma, Sourafel, and Anja Shortland. 2008. The Political Economy of Financial Development. Oxford Economic Papers 60: 567–96. [Google Scholar] [CrossRef]
  31. Goldsmith, Raymond. 1969. Financial Structure and Development. New Haven: Yale University Press. [Google Scholar]
  32. Graff, Michael. 2005. Is There an Optimum Level of Financial Activity? KOF Working Papers No. 106. Zurich: Swiss Economic Institute, ETH Zurich. [Google Scholar]
  33. Greenwood, Jeremy, and Boyan Jovanovic. 1990. Financial Development, Growth, and the Distribution of Income. Journal of Political Economy 98: 1076–107. [Google Scholar] [CrossRef]
  34. Gugler, Klaus, and B. Burcin Yurtoglu. 2003. Corporate governance and dividend pay-out policy in Germany. European Economic Review 47: 731–58. [Google Scholar] [CrossRef]
  35. Hassan, Kamrul, Benito Sanchez, and Jung-Suk Yu. 2011. Financial Development and Economic Growth: New Evidence from Panel Data. The Quarterly Review of Economics and Finance 51: 88–104. [Google Scholar] [CrossRef]
  36. Huang, Hsu-Chuan, and Shu-Chin Lin. 2009. Non-linear Finance-growth Nexus. Economics of Transition 17: 439–66. [Google Scholar] [CrossRef]
  37. Huang, Hsu-Chuan, Shu-Chin Lin, Donggeun Kim, and Chung-Ying Yeh. 2010. Inflation and Finance-growth Nexus. Economic Modelling 27: 229–36. [Google Scholar] [CrossRef]
  38. Hung, Fu-Sheng. 2009. Explaining the Nonlinear Effects of Financial Development on Economic Growth. Journal of Economics 97: 41–65. [Google Scholar] [CrossRef]
  39. Ibrahim, Mansor H. 2007. The Role of the Financial Sector in Economic Development: The Malaysian Case. International Review Economics 54: 463–83. [Google Scholar] [CrossRef]
  40. Jalil, Abdul, Abu NM. Wahid, and Muhammad Shahbaz. 2010. Financial Development and Growth: A Positive, Monotonic Relationship? MPRA Paper No. 27668. Nashville: Tennessee State University. [Google Scholar]
  41. Kaminsky, Graciela, and Carmen Reinhart. 1999. The Twin Crises: The Causes of Banking and Balance-of-payments Problems. American Economic Review 89: 473–500. [Google Scholar] [CrossRef]
  42. Kemal, Abdul R., Qayyum Abdul, and Muhammad N. Hanif. 2008. Financial Development and Economic Growth: Evidence from Heterogeneous Panel of High Income Countries. MPRA No. 10198. Munich: University Library of Munich. [Google Scholar]
  43. Kindleberger, Charles. 1993. A Financial History of Western Europe. New York: Oxford University Press. [Google Scholar]
  44. King, Robert G., and Ross Levine. 1993a. Finance and Growth: Schumpeter Might be Right. Quarterly Journal of Economics 108: 717–37. [Google Scholar] [CrossRef]
  45. King, Robert G., and Ross Levine. 1993b. Finance, Entrepreneurship and Growth. Journal of Monetary Economics 32: 1–30. [Google Scholar] [CrossRef]
  46. Klomp, Jeroen, and Jakob De Haan. 2012. Banking risk and regulation: Does one size fit all? Journal of Banking & Finance 36: 3197–212. [Google Scholar]
  47. Kremer, Stephanie, Alexander Bick, and Dieter Nautz. 2013. Inflation and Growth: New Evidence from a Dynamic Panel Threshold Analysis. Empirical Economics 44: 861–78. [Google Scholar] [CrossRef]
  48. Law, Siong Hook. 2009. Trade Openness, Capital Inflows and Financial Development in Developing Countries. International Economic Journal 23: 409–26. [Google Scholar] [CrossRef]
  49. Law, Siong Hook, Ali M. Kutan, and N. A. M. Naseem. 2018. The Role of Institutions in Finance Curse: Evidence from International Data. Journal of Comparative Economics 46: 174–91. [Google Scholar] [CrossRef]
  50. Law, Siong Hook, and Nirvikar Singh. 2014. Does Too Much Finance Harm Economic Growth? Journal of Banking & Finance 41: 36–44. [Google Scholar]
  51. Law, Siong Hook, and Wai Noor Wafda Azman-Saini. 2012. Institutional Quality, Governance and Financial Development. Economics of Governance 13: 217–36. [Google Scholar] [CrossRef]
  52. Lee, Bong-Soo, and Ming-Yuan Leonard Li. 2012. Diversification and risk-adjusted performance: A quantile regression approach. Journal of Banking & Finance 36: 2157–73. [Google Scholar]
  53. Levine, Ross. 1997. Financial Development and Economic Growth: Views and Agenda. Journal of Economic Literature 35: 688–726. [Google Scholar]
  54. Levine, Ross. 2003. More on Finance and Growth: More Finance, More Growth? Federal Reserve Bank of St. Louis Review 85: 31–46. [Google Scholar] [CrossRef]
  55. Levine, Ross, Norman Loayza, and Thorsten Beck. 2000. Financial Intermediation and Growth: Causality and Causes. Journal of Monetary Economics 46: 31–77. [Google Scholar] [CrossRef]
  56. Lind, Jo Thori, and Halvor Mehlum. 2010. With or Without U? The Appropriate Test for a U-shaped Relationship. Oxford Bulletin of Economics and Statistics 72: 109–18. [Google Scholar] [CrossRef]
  57. Loayza, Norman, and Romain Ranciere. 2006. Financial Development, Financial Fragility, and Growth. Journal of Money, Credit and Banking 38: 1051–76. [Google Scholar] [CrossRef]
  58. Lucas, Robert E., Jr. 1988. On the mechanics of economic development. Journal of Monetary Economics 22: 3–42. [Google Scholar] [CrossRef]
  59. Luintel, Kul B., and Mosahid Khan. 1999. A Quantitative Reassessment of the Finance-growth Nexus: Evidence from Multivariate VAR. Journal of Development Economics 60: 381–405. [Google Scholar] [CrossRef]
  60. McKinnon, Robert E. 1993. The Order of Economic Liberalization: Financial Control in the Transition to a Market Economy. Baltimore: Johns Hopkins University Press. [Google Scholar]
  61. Neusser, Klaus, and Maurice Kugler. 1998. Manufacturing growth and financial development: Evidence from OECD countries. Review of Economics and Statistics 80: 638–46. [Google Scholar] [CrossRef]
  62. Nguyen, Hoa Moc, Quoc Trung Tran Le, Chi Minh Ho, Thanh Cong Nguyen, and Dinh Hoang Vo. 2022. Does financial development matter for economic growth in the emerging markets? Borsa Istanbul Review 22: 688–98. [Google Scholar] [CrossRef]
  63. Patrick, Hugh T. 1966. Financial Development and Economic Growth in Underdeveloped Countries. Economic Development and Cultural Change 14: 174–89. [Google Scholar] [CrossRef]
  64. Poletti Hughes, Joanne. 2008. R&D and dividend payments as determinants of corporate value in the UK: Empirical evidence after controlling for endogeneity. International Journal of Managerial Finance 4: 76–91. [Google Scholar]
  65. Purewal, Kamal, and Hazrat Haini. 2021. Re-examining the effect of financial markets and institutions on economic growth: Evidence from the OECD countries. Economic Change and Restructuring 55: 1–23. [Google Scholar] [CrossRef]
  66. Rahaman, Mohammad M. 2011. Access to Financing and Firm Growth. Journal of Banking and Finance 35: 709–23. [Google Scholar] [CrossRef]
  67. Rahman, A. 2019. Economic Development and Female Labour Participation in SAARC Countries: A Test of the U-Shape Hypothesis. Dhaka: Brac University. [Google Scholar]
  68. Rajan, Raghuram, and Luigi Zingales. 1998. Financial Dependence and Growth. American Economic Review 88: 559–86. [Google Scholar]
  69. Rajan, Raghuram, and Luigi Zingales. 2003. The Great Reversals: The Politics of Financial Development in the Twentieth Century. Journal of Financial Economics 69: 5–50. [Google Scholar] [CrossRef]
  70. Rioja, Felix, and Neven Valev. 2004a. Does One Size Fit All? An Examination of the Finance and Growth Relationship. Journal of Development Economics 74: 429–47. [Google Scholar] [CrossRef]
  71. Rioja, Felix, and Neven Valev. 2004b. Finance and the Sources of Growth at Various Stages of Economic Development. Economic Inquiry 42: 127–40. [Google Scholar] [CrossRef]
  72. Robinson, Joan. 1952. The Generalization of the General Theory and Other Essays. London: Palgrave Macmillan. [Google Scholar]
  73. Roe, Mark, and Jordan Siegel. 2011. Political Instability: Effects on Financial Development, Roots in the Severity of Economic Inequality. Journal of Comparative Economics 39: 279–309. [Google Scholar] [CrossRef]
  74. Roodman, David. 2009a. A Note on the Theme of Too Many Instruments. Oxford Bulletin of Economics and Statistics 71: 135–58. [Google Scholar] [CrossRef]
  75. Roodman, David. 2009b. How to do xtabond2: An introduction to difference and system GMM in Stata. The Stata Journal 9: 86–136. [Google Scholar] [CrossRef]
  76. Rousseau, Peter L., and Paul Wachtel. 2000. Equity Markets and Growth: Cross-country Evidence on Timing and Outcomes, 1980–1995. Journal of Banking & Finance 24: 1933–57. [Google Scholar]
  77. Rousseau, Peter L., and Paul Wachtel. 2002. Inflation Thresholds and the Finance-growth Nexus. Journal of International Money and Finance 21: 777–93. [Google Scholar] [CrossRef]
  78. Samargandi, Nahla, Jan Fidrmuc, and Sugata Ghosh. 2015. Is the Relationship between Financial Development and Economic Growth Monotonic? Evidence from a sample of middle-income countries. World Development 68: 66–81. [Google Scholar] [CrossRef]
  79. Sasabuchi, S. 1980. A Test of a Multivariate Normal Mean with Composite Hypotheses Determined by Linear Inequalities. Biometrika 67: 429–39. [Google Scholar] [CrossRef]
  80. Schularick, Moritz, and Alan Taylor. 2012. Credit Booms Gone Bust: Monetary Policy, Leverage Cycles, and Financial Crises, 1870–2008. American Economic Review 102: 1029–61. [Google Scholar] [CrossRef]
  81. Schumpeter, Joseph. 1911. The Theory of Economic Development. Cambridge: Harvard University Press. [Google Scholar]
  82. Shaddady, Ali, and Tom Moore. 2019. Investigation of the effects of financial regulation and supervision on bank stability: The application of CAMELS-DEA to quantile regressions. Journal of International Financial Markets, Institutions and Money 58: 96–116. [Google Scholar] [CrossRef]
  83. Shan, Morris, Alan G., and Fiona Sun. 2001. Financial Development and Economic Growth: An Egg-and Chicken Problem. Review of International Economics 9: 443–54. [Google Scholar] [CrossRef]
  84. Shen, Chung-Hua, and Chi-Chuan Lee. 2006. Same Financial Development Yet Different Economic Growth—Why? Journal of Money, Credit and Banking 38: 1907–94. [Google Scholar] [CrossRef]
  85. Stulz, René M., and Rohan Williamson. 2003. Culture, Openness and Finance. Journal of Financial Economics 70: 313–49. [Google Scholar] [CrossRef]
  86. Tsagkanos, Athanasios, Konstantinos Gkillas, Christoforos Konstantatos, and Christos Floros. 2021. Does volume drive systemic banks’ stock return volatility? Lessons from the Greek banking system. International Journal of Financial Studies 9: 24. [Google Scholar] [CrossRef]
  87. Wijnberg, S.Van. 1983. Interest rate management in LDCs. Journal of Monetary Economics 12: 433–52. [Google Scholar] [CrossRef]
  88. Yilmazkuday, Hakan. 2011. Threshold in the Finance-Growth Nexus: A Cross-Country Analysis. The World Bank Economic Review 25: 278–95. [Google Scholar] [CrossRef]
Figure 1. Linear relationship between growth and FDI.
Ijfs 11 00148 g001
Figure 2. Growth and FDI nonlinear relationship.
Ijfs 11 00148 g002
Figure 3. Growth and ID nonlinear relationship.
Ijfs 11 00148 g003
Figure 4. Growth and MD nonlinear relationship.
Ijfs 11 00148 g004
Figure 5. Quantile regression graphs for the nonlinear nexus between economic growth and financial development, governance, and macroeconomic indicators.
Ijfs 11 00148 g005
Table 1. Definitions of variables.
VariableDefinitionSources
Dependent variable
GrowthGDP per capita growth: sum of gross value added by all resident producers in the economy divided by the population.World Development Indicators Database
Independent variables
Financial Indicators
Financial development index (FDI)Countries’ relative ranking is based on the access, efficiency, and depth of their institutions and financial markets. International Monetary Fund Database
Financial institutional index (ID)Reserves to total assets and bank capital ratio.International Monetary Fund Database
Financial market index (MD)All publicly traded companies’ shares value in total.International Monetary Fund Database
LiquidityTo meet its prompt commitments, a business’s capacity to transform assets into cash.Global Financial Development Database
Macroeconomic Indicators
InflationThe reduced money value reflects an economy with increased prices of goods and services.World Development Indicators Database
ExportsSelling services and products to other countries’ consumers. World Development Indicators database
School enrollmentsA country’s total number of students.World Development Indicators Database
Governance indicators
∆ Rule of lawLaws that treat all citizens of a country equally.Worldwide Governance Indicators Database
∆ Political stabilityA nation’s persistent political structure.Worldwide Governance Indicators Database
∆ Government effectivenessElected representatives’ approach using their position and power to represent their constituents.Worldwide Governance Indicators Database
Table 2. Descriptive statistics of variables.
VariableObsMeanStd. Dev.MinMax
Growth4440.5965348.226367−5.73428.688
FDI425−1.375530.572607−2.70541−0.54778
Liquidity42442.3625150.5224320.2465379.954
Inflation4447.66519115.28466−30.1997150
Exports3633.09831420.02889−70.5302218.0947
School enrollments35077.1379221.8737713.01109116.4623
∆ Rule of law437−0.341140.744686−2.090170.995863
∆ Political stability437−0.658081.061294−3.180351.223599
∆ Government effectiveness437−0.324580.741682−2.348561.505398
Table 3. Correlation Matrix.
Variable1234567
Growth (1)1
FDI (2)−0.2715 **1
Liquidity (3)−0.07160.3812 *1
Inflation (4)0.1729 *−0.1314 *−0.34971
Exports (5)0.2659 **0.1153 ***0.0967 **0.167 ***1
School enrollments (6)−0.2417 *0.5197−0.0701 *−0.0279 *0.0649 *1
∆ Rule of law (7)−0.2434 **0.5904 **0.3104−0.3446 *0.07970.49611
∆ Political stability (8)−0.0145 *0.2833 *−0.064 *−0.2457 *0.0791 **0.2624 *0.5491 **
∆ Government effectiveness (9)−0.20690.4368 *0.2073−0.2991 **0.0298 *0.57180.4618 *
89
Political stability (8)1
Government effectiveness (9)0.5543 **1
Note: The rule of law shows a high correlation with the financial development index. * Correlation is significant at the 0.1 level. ** Correlation is significant at the 0.05 level. *** Correlation is significant at the 0.01 level.
Table 4. Linear nexus and nonlinear nexus between economic growth and financial development, governance, and macroeconomic indicators.
(1)(2)(3)(4)(5)(6)
Linear Nonlinear
VARIABLESOLSGMMOLSGMMGMMGMM
Growth −0.233 *** −0.229 ***−0.428 *−0.214 ***
(0.0757) (0.0807)(0.253)(0.0572)
FDI1.148 **0.712 **0.355 ***0.312 **
(0.485)(0.127)(0.0309)(0.210)
F D I 2 −0.689 **−0.461 **
(0.297)(0.108)
ID 0.032 *
(0.004)
I D 2 −0.0643 **
(0.0315)
MD 0.780 **
(0.303)
M D 2 −0.0426 ***
(0.0198)
Liquidity0.0523 **0.009800.0150 ***0.01000.0170*0.00765
(0.0161)(0.0112)(0.00186)(0.0111)(0.00927)(0.0114)
Inflation0.0382 *0.001600.0387 *0.002230.0115 ***0.00324
(0.0207)(0.0115)(0.0203)(0.0109)(0.0044)(0.0106)
Exports0.0670 **0.001110.0658 **0.001250.006250.000809
(0.0314)(0.00323)(0.0325)(0.00315)(0.00385)(0.00300)
School enrollments−0.0271−0.00546−0.0234−0.00397−0.0165 **−0.00994
(0.0273)(0.0142)(0.0291)(0.0119)(0.00810)(0.00909)
∆Rule of law−2.180 **−2.511 ***−2.026 **−2.514 ***−0.932 **2.483 ***
(0.894)(0.553)(0.992)(0.551)(0.235)(0.515)
∆Political stability−0.988 *−0.854 ***−0.889 **−0.843 ***−0.840 ***−0.827 ***
(0.722)(0.124)(0.325)(0.132)(0.225)(0.157)
∆Government effectiveness1.193 *0.6541.0280.6850.2660.713
(0.610)(0.561)(0.684)(0.626)(1.029)(0.524)
Constant0.905 **0.406 ***0.931 **0.619 **0.113 ***0.559 ***
(0.302)(0.0708)(0.231)(0.263)(0.0824)(0.026)
YearsYesYesYesYesYesYes
CountriesYesYesYesYesYesYes
AB test AR (1) 0.005 0.0010.0060.003
AB test AR (2) 0.591 0.7420.5870.496
Hansen test (p-value) 0.091 0.0690.1660.174
Instruments 23 252525
Groups 31 383838
R-squared0.624 0.578
Observations160160160160160160
Robust standard errors are in parentheses; *** p < 0.01, ** p < 0.05, * p < 0.1.
Table 5. U-test for growth and FDI.
MinMax
Interval−2.7−0.5477
Slope0.613 ***−0.746
0.942(−1.39)
U shape (SLM test)2.32 ***
p-value0.008
Extreme point−1.7
*** The significance of the Slope and SLM test is observed at the 0.01 level.
Table 6. U-test of growth and ID.
MinMax
Interval3.9616
Slope0.139 ***−0.446
0.495−1.82
U shape (SLM test)3.23 ***
p-value0.006
Extreme point6.82
*** The significance of the Slope and SLM test is observed at the 0.01 level.
Table 7. U-test for growth and MD.
MinMax
Interval−4.86.3
Slope0.276 ***−0.092 ***
6.98(−3.07)
U shape (SLM test)4.21 ***
p-value0.003
Extreme point9.4
*** The significance of the Slope and SLM test is observed at the 0.01 level.
Table 8. Quantile regression for the nonlinear relationship between economic growth and financial development, governance, and macroeconomic indicators.
(1)(2)(3)(4)(5)(6)
VARIABLESQR25QR50QR75IVIVIV
FID0.481 **0.490 ***0.315 *0.310 **
(0.151)(0.084)(0.139)(0.153)
F D I 2 −0.157 ***−0.285 ***−0.564 **
(0.072)(0.017)(0.157)
ID 0.615 *
(0.140)
MD 0.530 ***
(0.0476)
F D I 2  (fitted) −0.167 *
(0.082)
I D 2  (fitted) −0.00557 *
(0.00315)
M D 2  (fitted) −0.00751 **
(0.00315)
Liquidity0.02020.0397 ***0.009620.0577 ***0.0454 **0.0517 ***
(0.0203)(0.00220)(0.0252)(0.0138)(0.0191)(0.0123)
Inflation0.0805 **0.03920.01840.01400.01780.0106
(0.0396)(0.0427)(0.0407)(0.0248)(0.0250)(0.0238)
Exports0.0350 **0.0737 *0.0480 **0.0755 *0.0746 *0.0749 *
(0.0182)(0.0403)(0.0396)(0.0425)(0.0429)(0.0417)
School enrollments−0.0562 **−0.0356−0.0528 *−0.133 ***−0.106 ***−0.137 ***
(0.0256)(0.0242)(0.0271)(0.0336)(0.0331)(0.0336)
∆ Rule of law−1.965 ***−1.645 **−1.113 ***−1.170 *−1.725 **−1.446 **
(0.516)(0.288)(0.081)(0.642)(0.774)(0.690)
∆ Political stability−0.935*−0.652 ***−0.822 **−0.347 *−0.183 **−0.998 **
(0.818)(0.022)(0.230)(0.254)(0.066)(0.423)
∆ Government effectiveness0.2471.537*1.4242.014 ***2.130 ***2.306 ***
(0.993)(0.981)(1.937)(0.771)(0.823)(0.752)
Constant0.417 ***0.636 ***0.354 *0.101 ***0.840 *0.907 ***
(0.045)(0.098)(0.346)(0.026)(0.782)(0.035)
Yearsyesyesyesyesyesyes
CountriesYesYesyesyesyesyes
R-squared0.5660.6230.4210.5810.6220.517
Observations160160160160160160
Robust standard errors are in parentheses; *** p < 0.01, ** p < 0.05, * p < 0.1. Note: Fitted value is the predicted value of F D I 2 , I D 2 , and M D 2 based on the first stage regression.
Table 9. GMM for current liquidity, levels of school enrollment, and governance impact.
VARIABLES(1)(2)(3)(4)
GMMGMMGMMGMM
Growth0.125 *0.278 **0.241 **0.195 ***
(0.0956)(0.0524)(0.0621)(0.0113)
FDI0.201 **0.187 *0.175 ***0.224 **
(0.0817)(0.0882)(0.0072)(0.0612)
F D I 2 −0.662 ***−0.715 *−0.611 **−0.498 **
(0.0347)(0.212)(0.0913)(0.0717)
Liquidity (current ratio)0.0845*0.04210.03410.0178 *
(0.0245)(0.2115)(0.3401)(0.0091)
Inflation0.04120.01440.0457 *0.0114
(0.0578)(0.0747)(0.0101)(0.0477)
Exports0.0214 *0.001420.002140.00241
(0.0152)(0.00343)(0.00475)(0.00356)
School enrollment: -Primary−0.0172−0.0201−0.0202−0.0314
(0.0552)(0.0528)(0.0520)(0.03440)
Intermediate−0.0478−0.0421−0.0248−0.0202 *
(0.0648)(0.0701)(0.0687)(0.0199)
Secondary−0.0247 *−0.0147−0.0179 *−0.0254
(0.00821)(0.0454)(0.0087)(0.0648)
∆ Rule of law −1.245 **−0.889 *
(0.843)(0.145)
∆ Political stability −0.642* −0.414 ***
(0.204) (0.072)
∆ Government effectiveness 1.248 0.626
(0.724) (0.871)
Constant0.679 **0.437 ***0.249 ***0.843 **
(0.297)(0.086)(0.0247)(0.0341)
YearsYesYesYesyes
CountriesYesYesYesyes
AB test AR (1)0.0070.0020.0020.005
AB test AR (2)0.6140.4710.4940.542
Hansen test (p-value)0.0980.1620.1820.066
Instruments25252525
Groups38383838
R-squared
Observations160160160160
Robust standard errors are in parentheses; *** p < 0.01, ** p < 0.05, * p < 0.1.
Disclaimer/Publisher’s Note: The statements, opinions and data contained in all publications are solely those of the individual author(s) and contributor(s) and not of MDPI and/or the editor(s). MDPI and/or the editor(s) disclaim responsibility for any injury to people or property resulting from any ideas, methods, instructions or products referred to in the content.

