Article

Unveiling Market Connectedness: Dynamic Returns Spillovers in Asian Emerging Stock Markets

1
Department of Management Sciences, COMSATS University Islamabad, Islamabad 45550, Pakistan
2
Department of Management Sciences, Balochistan University of Information Technology, Engineering, & Management Sciences (BUITEMS), Quetta 87300, Pakistan
3
College of Business, Al Ain University, Abu Dhabi P.O. Box 122612, United Arab Emirates
4
Islamabad Policy Research Institute—IPRI, Islamabad 45710, Pakistan
5
Department of Leadership Management & Human Resources (LMHR), International Business School, Teesside University, Middlesbrough TS1 3BX, UK
*
Author to whom correspondence should be addressed.
Int. J. Financial Stud. 2023, 11(3), 112; https://doi.org/10.3390/ijfs11030112
Submission received: 4 July 2023 / Revised: 23 August 2023 / Accepted: 30 August 2023 / Published: 12 September 2023
(This article belongs to the Special Issue Macroeconomic and Financial Markets)

Abstract

:
This study investigates the returns spillovers across the equity markets of Asian emerging economies (China, India, Indonesia, Malaysia, Pakistan, Philippines, South Korea, Taiwan, and Thailand). To achieve this objective, we used two different spillover methodologies (DY 2012 and BK 2018). Moreover, this study used the daily closing prices of equity indices ranging from 5 January 2005 to 13 November 2021. The empirical findings revealed that the total spillover index using DY 2012, and the short-term frequency index using BK 2018, are close to each other, with values of 46.92% and 43.04%, respectively. However, the spillover index value is high, with a value of 56.25% in the long run. Furthermore, the results showed that the stock markets of South Korea and Taiwan are the major spillover transmitters in the Asian emerging markets. Also, the financial association among all emerging Asian equities is at its peak, subject to the mobility of cash flows across the global economies. The results of this study provide meaningful insight for policymakers and investors to implement an effective strategy to overcome the possible influence of any financial crisis in the future. Our paper provides a potential contribution to the financial literature by examining the transmission of spillovers across the Asian emerging stock markets. Furthermore, it provides in-depth information regarding stock market interdependence.

1. Introduction

In the contemporary world, equity markets play a significant and decisive role in the global economic arena. Over the past few decades, lifting barriers on trade, the ease of communication, a decrease in trade restrictions, an increase in imports and exports across the globe, easy access for capital, the ease of conducting business, and favorable market conditions have served as motivating factors for numerous local and international investors to participate in global financial markets. This is causing them to become more integrated in terms of trade and investment. Thus, investors have now more options for portfolio diversification as they can put their funds into various stock markets globally; hence, researchers have carried out studies to investigate the dynamic stock market patterns from one market to another (Joshi 2011).
The phrase “spillover of shocks” has been a point of attention for the investor, particularly in the aftermath of the GFC of 2008; therefore, it is necessary to understand the concept of “spillover”. The words spillover, co-movement, contagion, and co-integration are often used interchangeably in the finance domain. The World Bank (Cooper et al. 2000) gave three different definitions of the term “contagion”. The first definition considers contagion as “the transmission of cross-country shocks”. Secondly, “contagion is the co-movement of shocks this phenomenon is explained by the herding behaviour”. Thirdly, during a crisis, contagion becomes more widespread as a result of the presence of co-integration among countries, as compared to the “tranquil time”. In addition, a financial crisis causes a contagion effect, which means a rise in the magnitude of volatility transmission across investment assets in the financial arena (Forbes and Rigobon 2002). Moreover, the nature of the co-movements among the financial markets depends upon their level of economic association and the properties of the stock markets of the different countries (Pretorius 2002).
After the GFC, the flow of funds toward Asian economies increased. Strong capital inflows were experienced by the developing equity markets and growth increased more than in the developed ones (Korinek 2018). The economies of Asian countries are experiencing significant growth, and these economies contribute three percent to the growth in world global GDP, as a result of improvements in factors such as demographics, economic freedom, the efficient use of resources, and an expanding middle class.
Considering the global economy, the financial markets of Asia are playing a vital role in attracting potential investors who seek to achieve maximum gains with minimum risk-taking from a globally diversified portfolio. Hence, the participants within these markets should identify the changes in patterns of stock returns and volatilities to construct an optimized portfolio of assets. Moreover, modern portfolio theory (MPT), as formulated by Markowitz (1952), states that portfolio diversification minimizes risk by adding the least correlated securities into the portfolio. According to Markowitz (1952), investors should invest funds in those assets that have either no correlation or negative correlation with each other, which means that the prices of one asset will either not or negatively affect the prices of other assets. Therefore, this phenomenon has inspired researchers to investigate market linkages. These linkages will help investors to and identify the least correlated markets. Moreover, highly integrated financial markets transfer volatility shocks to one another, resulting in a “spillover effect” (Baele 2002). Therefore, non-correlated assets demand higher prices from investors than those that are highly correlated. This behavior plays a significant role in price-setting trends for securities (Glezakos et al. 2007). Hence, the spillover across these markets must be studied (Kao et al. 2018). Thus, this paper attempts to analyze the returns spillovers across different Asian equities.
The volume of trade between the rest of the world and Asia is continuously increasing; therefore, the Asian stock markets are of prime importance to global investors. Hence, these markets are turning out to be the main focus of studies for those practitioners seeking an in-depth understanding to risk and return. As a result, this empirical work outlines the dynamic return spillovers among the emerging equity markets of Asian economies. The stock markets of nine different Asian countries were selected.
The equities of the emerging economies of Asia significantly normalized the aftershocks of the financial crises. It has been proved that, over recent decades, these emerging financial markets have acted as new drivers of the global economy. According to Pete (2006), the economy of China can transform the global economy in the 21st century. On the other hand, Pakistan has always been a location of interest across the globe due to its geopolitical and strategic location. The Pakistani stock exchange in 2017 gained 21,959 points, generating a meaningful return of 36% for financial investors. Moreover, in the fiscal year 2017–2018, the growth rate of the Pakistan economy was 5.8%, which was higher than in 2016–2017 (4.06%). Furthermore, in the first decade of the 21st century, the Korean and Malaysian economies were recognized as the best-performing economies. These Asian economies have experienced growth due to the improvements in free trade, integration of financial equalities and development in the financial industry. Other Asian economies have also shown a similar trend.
This study contributes to the existing literature by addressing research gaps in various ways. Firstly, it emphasizes dynamic returns spillovers, including short-term, medium-term, and long-term spillovers, which is a novel approach, as prior studies have only focused on returns and volatility spillovers including (Abbas et al. 2019; Hung 2019; Malik et al. 2021). Secondly, it incorporates nine emerging Asian stock markets, making it distinct from previous studies. Thirdly, the study applies two different dynamic spillover methods for robustness in the empirical results. Lastly, the research highlights major spillover transmitters and recipients within the emerging Asian market landscape, providing insights for policymakers, investors, and market stakeholders to shape proactive strategies.
The statistical findings of the research show significant returns spillovers across emerging equity markets in Asia over the selected period. The total spillover index of two different approaches (DY 2012 and BK 2018) indicates the presence of a spillover effect among the selected Asian equities. Returns spillover transmission is high in the short term and low in the long term, with Indonesia, South Korea, and Taiwan being the major net transmitters, while China, India, and Pakistan are the major net receivers of spillovers. High levels of return spillovers were reported across the emerging Asian economies during the peak times within the COVID-19 pandemic return period.
The subsequent portion of this paper is organized in the following manner. Section 2 examines the relevant research, while Section 3 pertains to the data and methodology section and Section 4 represents the empirical results. Finally, Section 5 includes discussion and conclusion.

2. Review of Related Studies

To construct an efficient portfolio, a highly positive co-association and co-integration of stocks and equity markets are recognized as causing a decrease in portfolio diversification. This contradicts the assumptions of the MPT initially presented by Markowitz (1952), which were later extended by (Sharpe 1963). In the past, several financial crises have caused the co-movement to increase exponentially among the different stock markets, thus resulting in a significant amount of losses in the investor’s stock portfolio. For example, during the debt crisis in Asia 1997, and the GFC 2008, the integrated equity markets moved together, thus lowering the portfolio diversification benefits for the investors.
Numerous researchers have attempted to analyze the returns and volatility spillovers among developed economies in their studies. However, relatively few studies have included emerging, frontier, and isolated markets. Several empirical studies have documented dynamic spillovers across developed stock markets, such as (Baele 2005; Diebold and Yilmaz 2009; Eun and Shim 1989; Fang et al. 2006; Hamao et al. 1990; Kanas 1998; Ng 2000; Savva et al. 2004). Moreover, using vine copulas, in their study, Aslam et al. (2023) noted the presence of tail dependence across the equity sectors of Pakistan. As a result, there is a possibility of spillovers during turbulent periods.
Hung (2019) studied the transmission of returns and volatility spillover in China and among four countries in Southeast Asia by adopting the GARCH-BEKK (Baba, Engle, Kraft, Kroner) model. The finding of the study confirms the spillover from the Chinese stock market to others. Additionally, the results suggest that the stock markets are significantly more intertwined with the crisis. Moreover, Eun and Shim (1989) analyzed the dynamic spillovers across the equities of nine developed countries, and their empirical results showed the transmission of shocks across the stock markets. Overall, they found risk spillovers among these markets. Similarly, Hamao et al. (1990) used the three-year intraday stock price data of three different equity markets of Tokyo, London, and New York. Moreover, they examined the price spillovers among these markets, and their findings showed no spillovers across these markets.
Kanas (1998) discovered the presence of volatility spillovers among the equities of the UK, France, and Germany, whereas Savva et al. (2004) investigated the price and volatility spillover across the Paris, London, Frankfurt, and New York equity markets and found that variations in international markets affect stock prices and volatility in the domestic market. Wagner and Szimayer (2004) revealed the presence of country-specific spillovers in the American and German equities, while Fang et al. (2006) identified a one-way risk spillover effect from the bond market to the stock market when examining the risk spillovers concerning the bonds and stocks of the US and Japan.
Many scholars have explored the spillover impact between developed and emerging market stock markets over various time periods. For example, Ng (2000) investigated the spillover phenomena from the stock markets of Japan and USA toward the equities of Pacific Basin economies, and the findings showed the presence of the “spillover effect”. Meanwhile, Diebold and Yilmaz (2009) empirical research quantified spillovers by applying VAR models to the equity markets of the seven developed economies and twelve equity markets of emerging economies. The study revealed no trend of spillover effect. However, robustness was observed with time. Furthermore, Joshi (2011) conducted a study on the transmission of return and risk among the stock markets in China, India, Korea, Hong Kong, and Jakarta. Their findings documented that spillovers among the markets are bidirectional.
After that, Beirne et al. (2013) studied the transmission of spillover generated by developed stock markets towards forty-one equity markets of emerging economies. They found that fluctuations in the prices of stocks in developed markets had a spillover effect on emerging markets. Moreover, Gallo and Otranto (2008), using a Markov Switching bivariate model, investigated risk transmissions across the equities of Korea, Malaysia, Thailand, Singapore, and Hong Kong. Their empirical results revealed spillovers from Hong Kong to Thailand, Korea, and co-movement with the Malaysia and Singapore stock markets. Likewise, Graham et al. (2012) found a weak and time-varying co-association between the U.S equities and the twenty-two emerging markets. In their study, Dungey and Gajurel (2014) proved the existence of strong spillover effects on both emerging and developed equity markets. Nevertheless, in terms of sector markets, the results were different, particularly in developed markets, in which there is weak spillovers in sector indices.
Furthermore, in recent times, studies have analyzed the benefits of spillovers and diversifications across different markets. For example, Ali et al. (2023) examined the diversification benefits across Asia’s emerging markets during the COVID-19. Their results suggest that during the pandemic, the equity market of Hong Kong provided a safe haven for most markets. Additionally, the lower weightage to the equity markets of Bangladesh, Taiwan, and Malaysia provided significant diversification. Moreover, Ahmad et al. (2022) determined the integration among the BRICS, Latin America, and Emerging and Frontier Asian Equity markets. They noted diversification benefits in the short-run, and the equity–commodity portfolios led to maximum diversification. Thomas et al. (2022) revealed that overall, Asia–Pacific equity markets provide greater diversification benefits than their European counterparts.
Li et al. (2023) conducted a study on the volatility spillovers among twelve Asia–Pacific stock markets. Their statistical findings revealed that the transmission of volatility spillovers to other markets is reduced when a country has higher COVID-19 vaccinations, and the effect of vaccinations on spillovers is asymmetric. Meanwhile, Panda et al. (2021) analyzed the information bias and its spillover effect on the return volatility of Asia–Pacific region stock markets. Their results showed that the spillover shocks to Asia–Pacific equity markets were greater during times of crisis. Based on a review of the recent literature, this study is unique in its investigation of dynamic returns spillovers across nine different Asian emerging equity markets using two different methodologies: Diebold and Yilmaz (2012) and Baruník and Křehlík (2018) spillover framework.

3. Materials and Methods
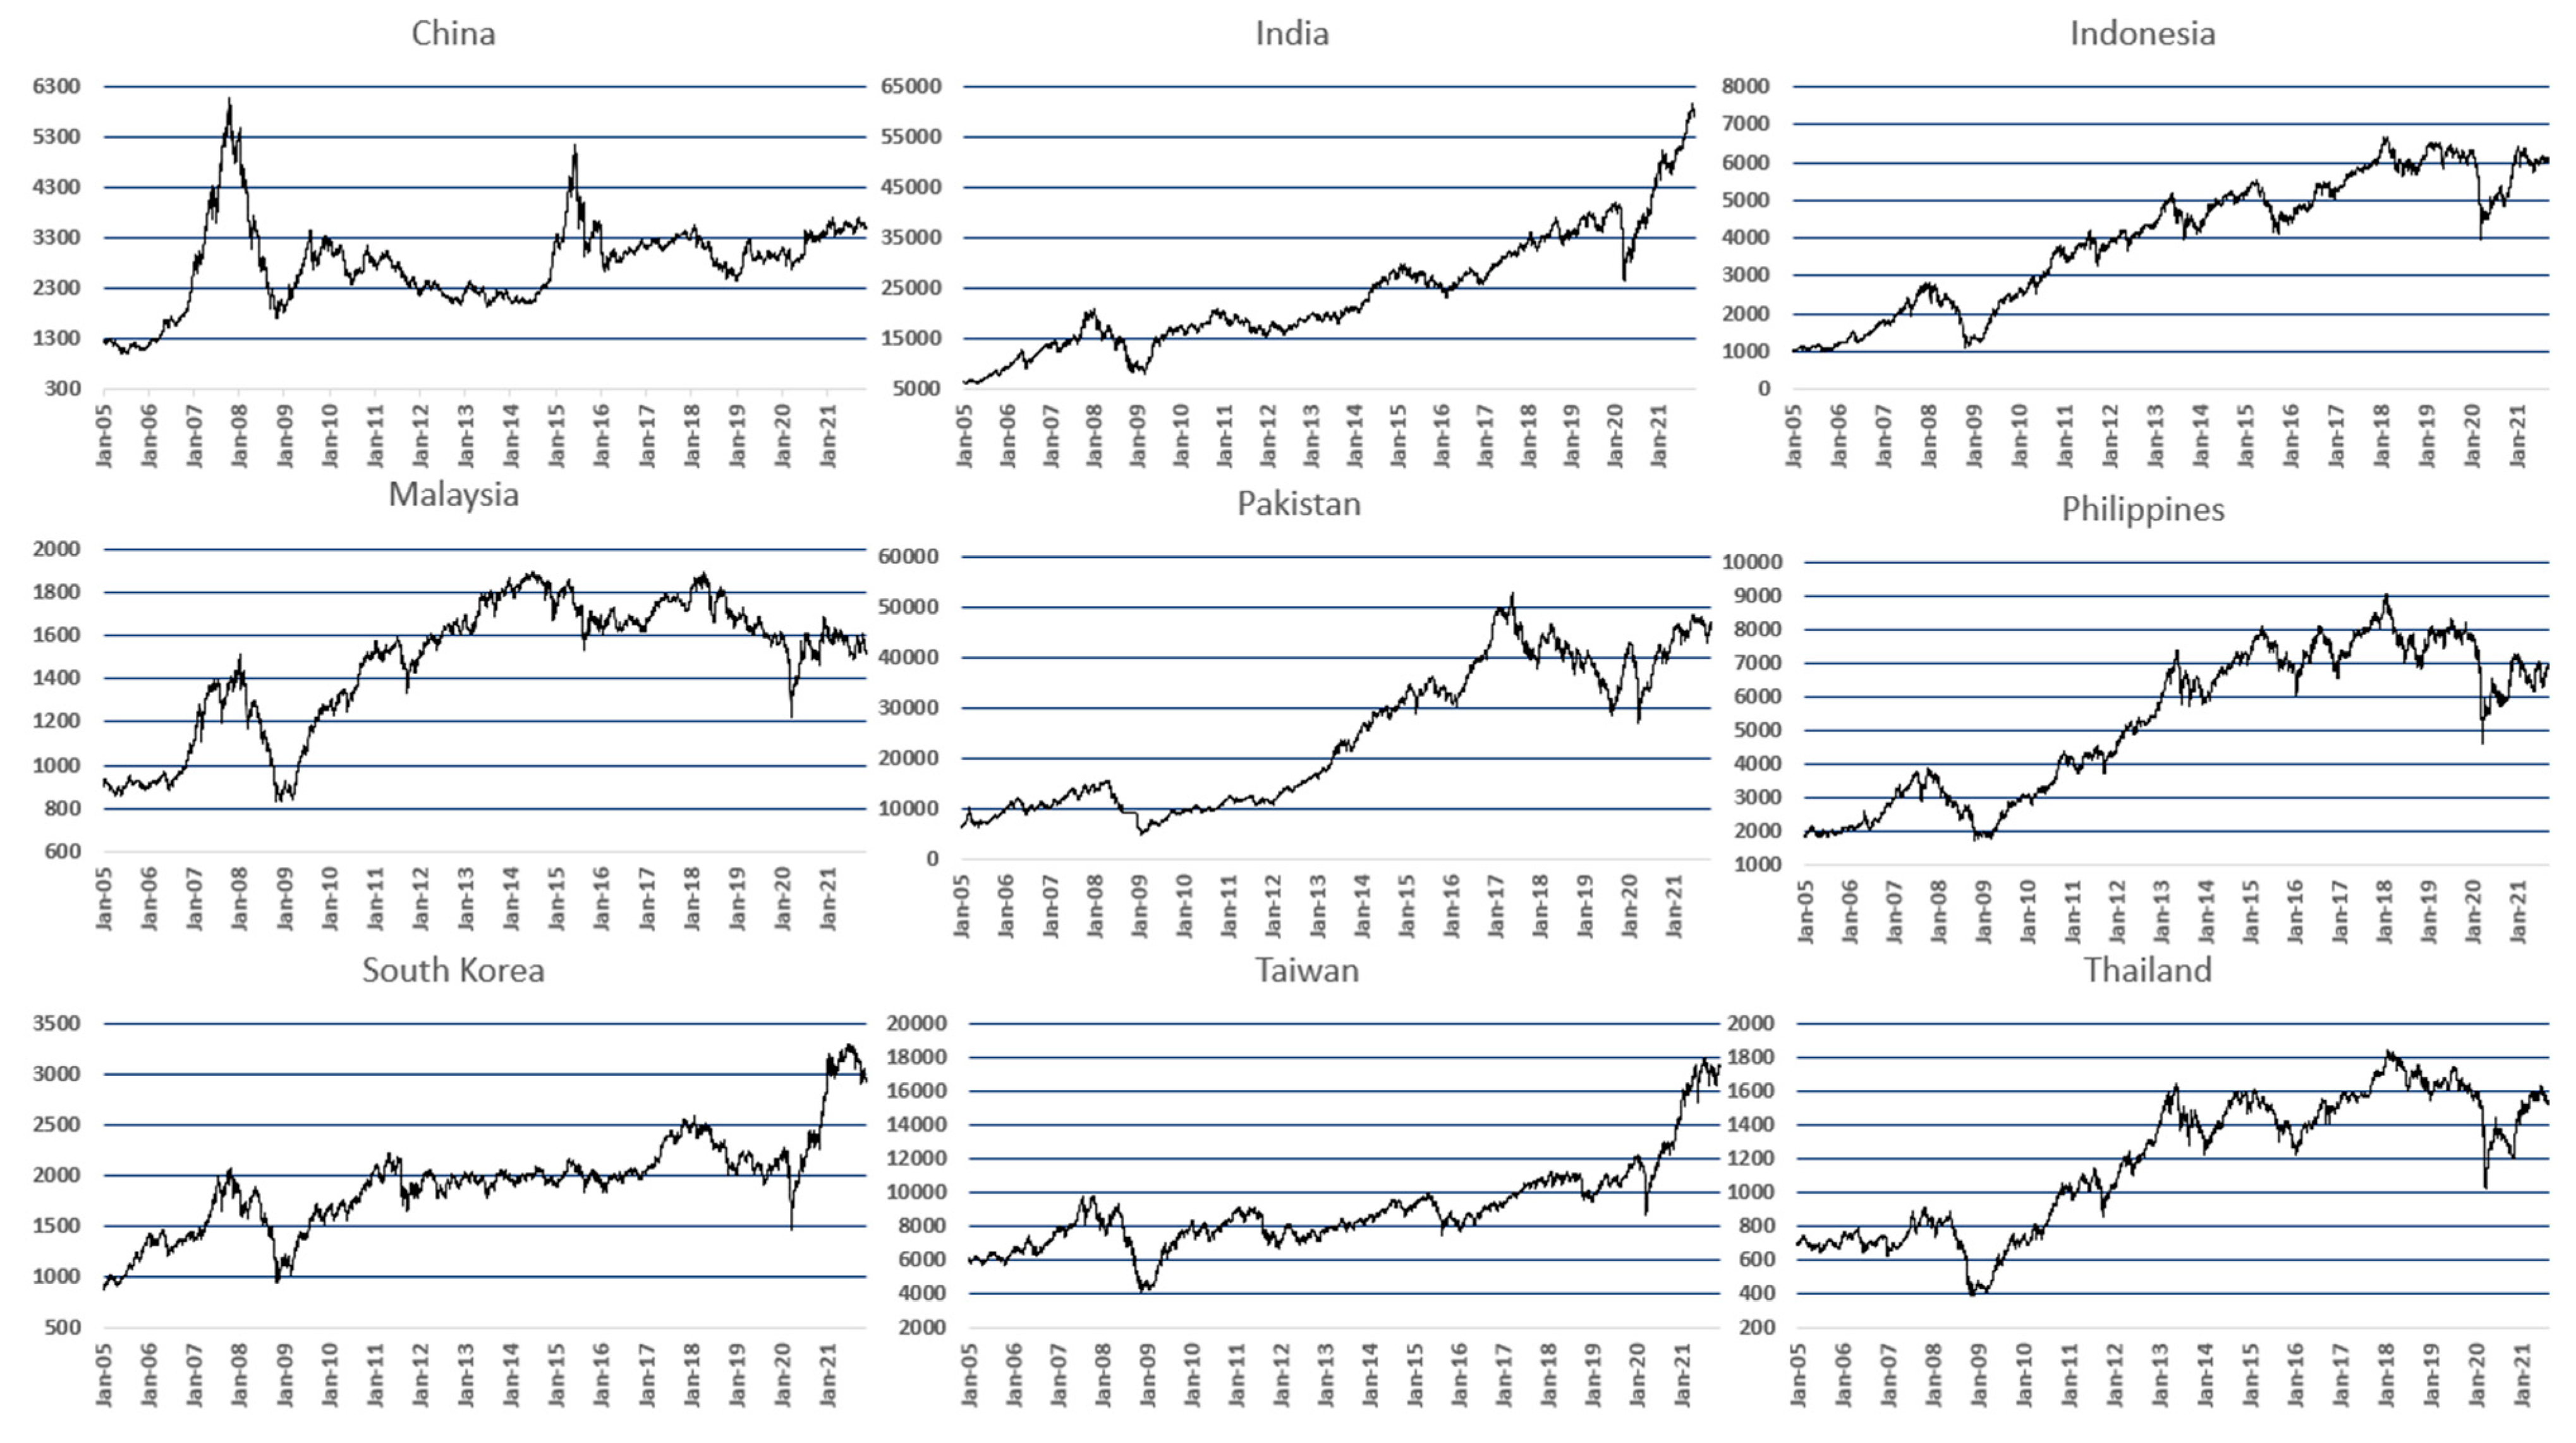
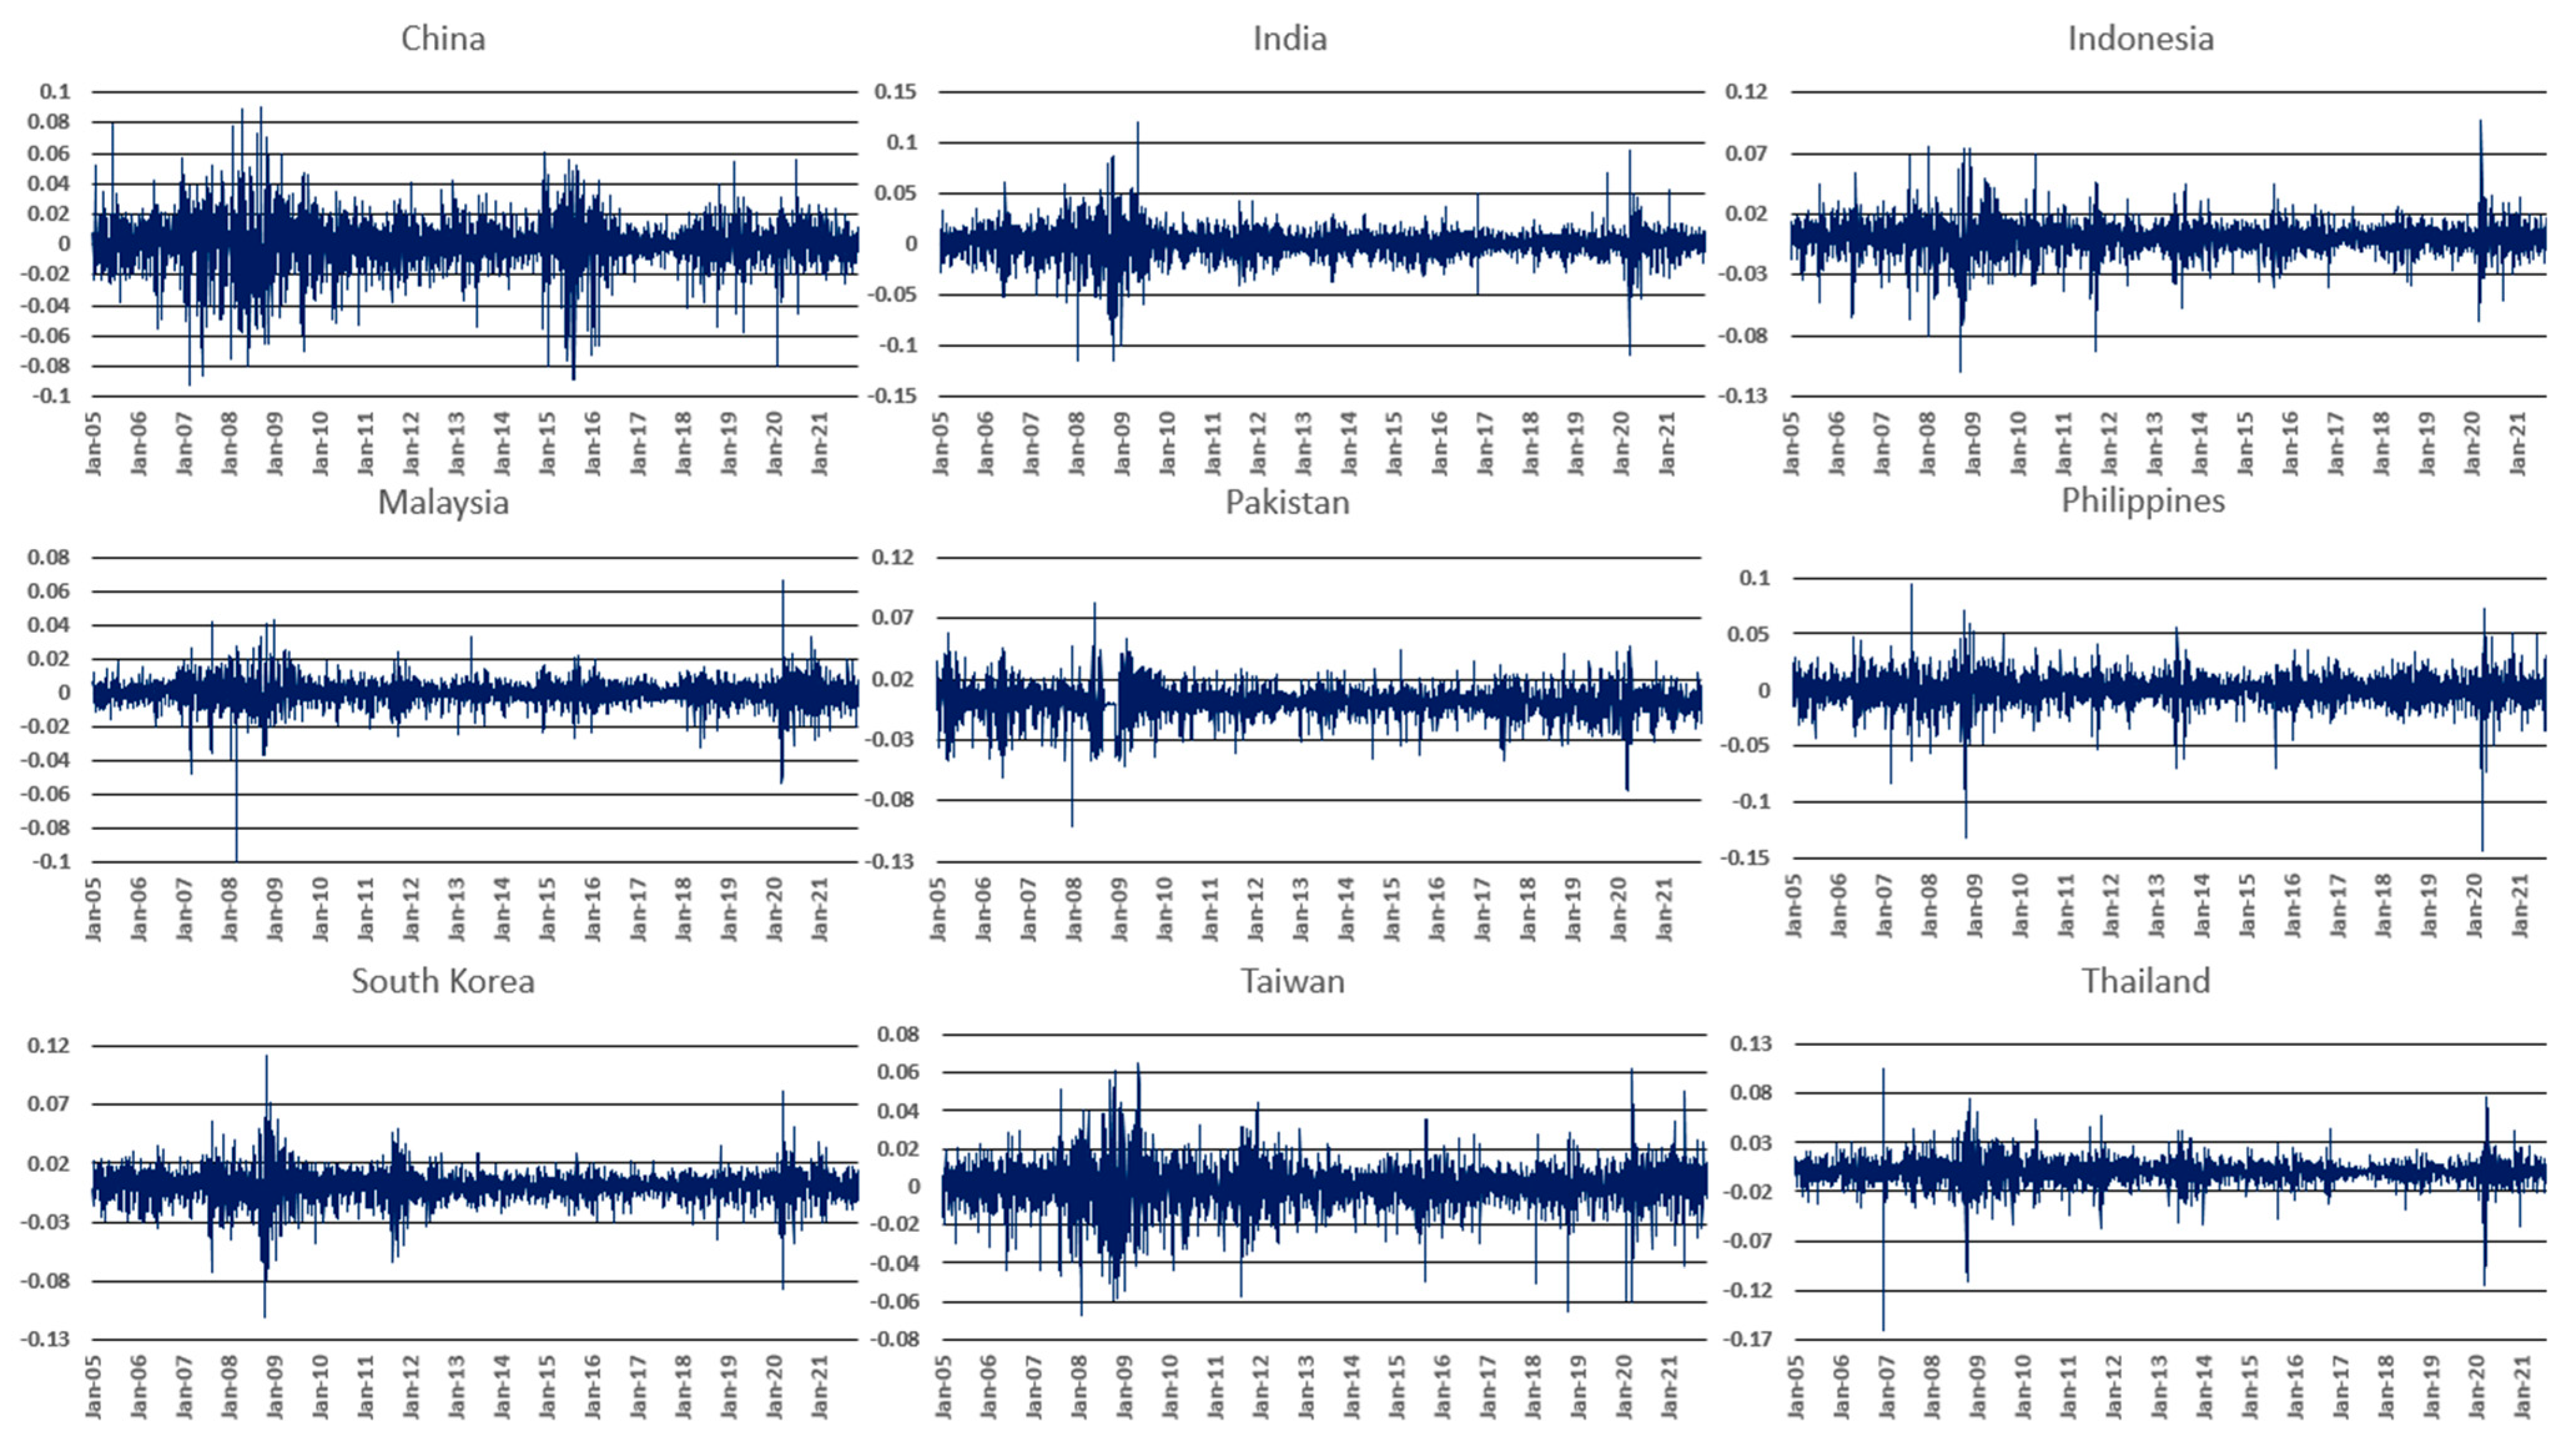
3.1. Data

In this study, we used the daily dataset of the closing prices of stock indices to investigate the spillovers among the Asian emerging stock market by using both the DY (2012) time-domain spillover framework and the BK (2018) frequency domain spillover framework. The study utilized a daily dataset of the closing prices of nine Asian emerging stock markets as shown in Figure 1. The data ranged from 5 January 2005, to 13 November 2021, and were extracted from investing.com. The equity markets were selected based on the Morgan Stanley Capital International (MSCI) classification. Furthermore, the selected nine major stock indices are shown in Table 1. The Asian stock indices log returns are estimated by:
R i t = l n p i t l n p i t 1
Table 1 provides summary statistics, such as the mean, skewness, and kurtosis, of the nine Asian emerging equity markets returns used in the study. The average mean returns for Asian markets are either positive or approximately zero. The Indian stock index shows the highest mean return in the stock market with a value of 0.051%, followed by the Pakistani stock market with an average return value of 0.046%. The Malaysian stock market exhibits the lowest returns among the set of Asian markets, with a value of 0.02%. The kurtosis for Asian stock market returns is higher than 3, and the returns distribution indicates negative skewness behavior in all Asian emerging stock indices, implying that the fat tail behavior in the Asian stock market returns. Additionally, the Augmented Dickey–Fuller (ADF) test showed that Asian emerging stock indices return time series show stationary behavior at a 1% significance level.
Figure 2 shows that the Asian emerging stock returns have experienced a high level of fluctuations over the last 15 years, with a particularly high level of return fluctuations observed during the GFC and COVID-19 pandemic. The Chinese stock market displays an extreme level of return fluctuations varying from 0.09 to −0.9, with the highest SD value (1.5%) compared to other stock indices used in this study. The Indian stock market also reveals significant volatility behavior in returns, with an SD of 1.4%, followed by the equity market of the Philippines with an SD value of 1.278%.

3.2. Diebold and Yilmaz (2012) Spillover Framework

We applied the Diebold and Yilmaz (2012) spillover framework, which employs variance decomposition and is linked to the n-variable vector autoregressive model, to investigate the transmission of financial returns among Asian emerging markets. The main emphasis of the DY spillover framework lies in assessing the overall spillover effect. An important feature of this model is its capability to estimate the directionality of spillovers.
Let us consider a stationary n-variable, V A R p , which is characterized by its covariance, written as:
x t = i = 1 p Φ i x t 1 + ε t .
Meanwhile, the disturbances vector ε   ~   0 ,   consists of IID components. The moving average characterization can be expressed as x t = i = 0 A i ε t i , where the n × n indicates the coefficient matrices of A i , that follow the recursion A i = Φ 1 A i 1 + Φ 2 A i 2 + + Φ p A i p , with A 0 is an identity matrix and A i = 0 for I < 0. The behavior of the system becomes evident through the coefficients of the moving average. The entire process relies on variance decompositions, which enable us to analyze the forecast error variance of each individual variable within the specific segment that is strongly linked to system shocks. Hence, by utilizing variance decomposition, we can accurately estimate the H-step-ahead error variance in the process of detection of x i because of shocks to x j ,   j i for each i .
The KPPS H-step-ahead is denoted by θ i j g H , where H = 1 , 2 , , so we have
θ i j g H = σ j j 1 h = 0 H 1 e i A h e j 2 h = 0 H 1 e i A h e j
where σ j j represents the standard deviation of the error term in the jth equation. denotes the variance matrix of the error term. Additionally, the selection vector is denoted by the e i , which is equal to one for the ith element and zero otherwise.
In each row, the sum of elements of variance decomposition is not equal to 1, so it can be written as j = 1 N θ i j ~ g H . Therefore,
θ i j ~ g H = θ i j g H j = 1 N θ i j g H
which will be applied in the spillover index computation, j = 1 N θ i j ~ g H = 1 and i . j = 1 N θ i j ~ g H = N .
The contributions of volatility in the development of the total spillover index are derived via KPPS variance decomposition:
S g H = i , j = 1 i j N θ i j ~ g H i j = 1 N θ i j ~ g H · 100 = i , j = 1 i = j N θ i j ~ g H N · 100
Overall spillover shocks have been represented by a total spillover index. Furthermore, we computed directional spillover properties to the market i for all other markets j as:
S i . g H = j = 1 j i N θ i j ~ g H i , j = 1 N θ i j ~ g H · 100 = j = 1 j i N θ i j ~ g H N · 100
Similarly, we also computed the directional spillover from the market i to all other j markets:
S . i g H = j = 1 j i N θ j i ~ H i , j = 1 N θ j i ~ g H · 100 = j = 1 j i N θ j i ~ g H N · 100
The net spillover for the sectors has been estimated using the above equation, which provides the overall summary of the information for each variable.
S i g = S . i g H S i . g H
Furthermore, the net pairwise spillover of the sector indices returns can be written as
S i j g H = θ j i ~ g H i , k = 1 N θ i k ~ g H θ i j ~ g H j , k = 1 N θ j k ~ g H · 100 = θ j i ~ g H θ i j ~ g H N · 100

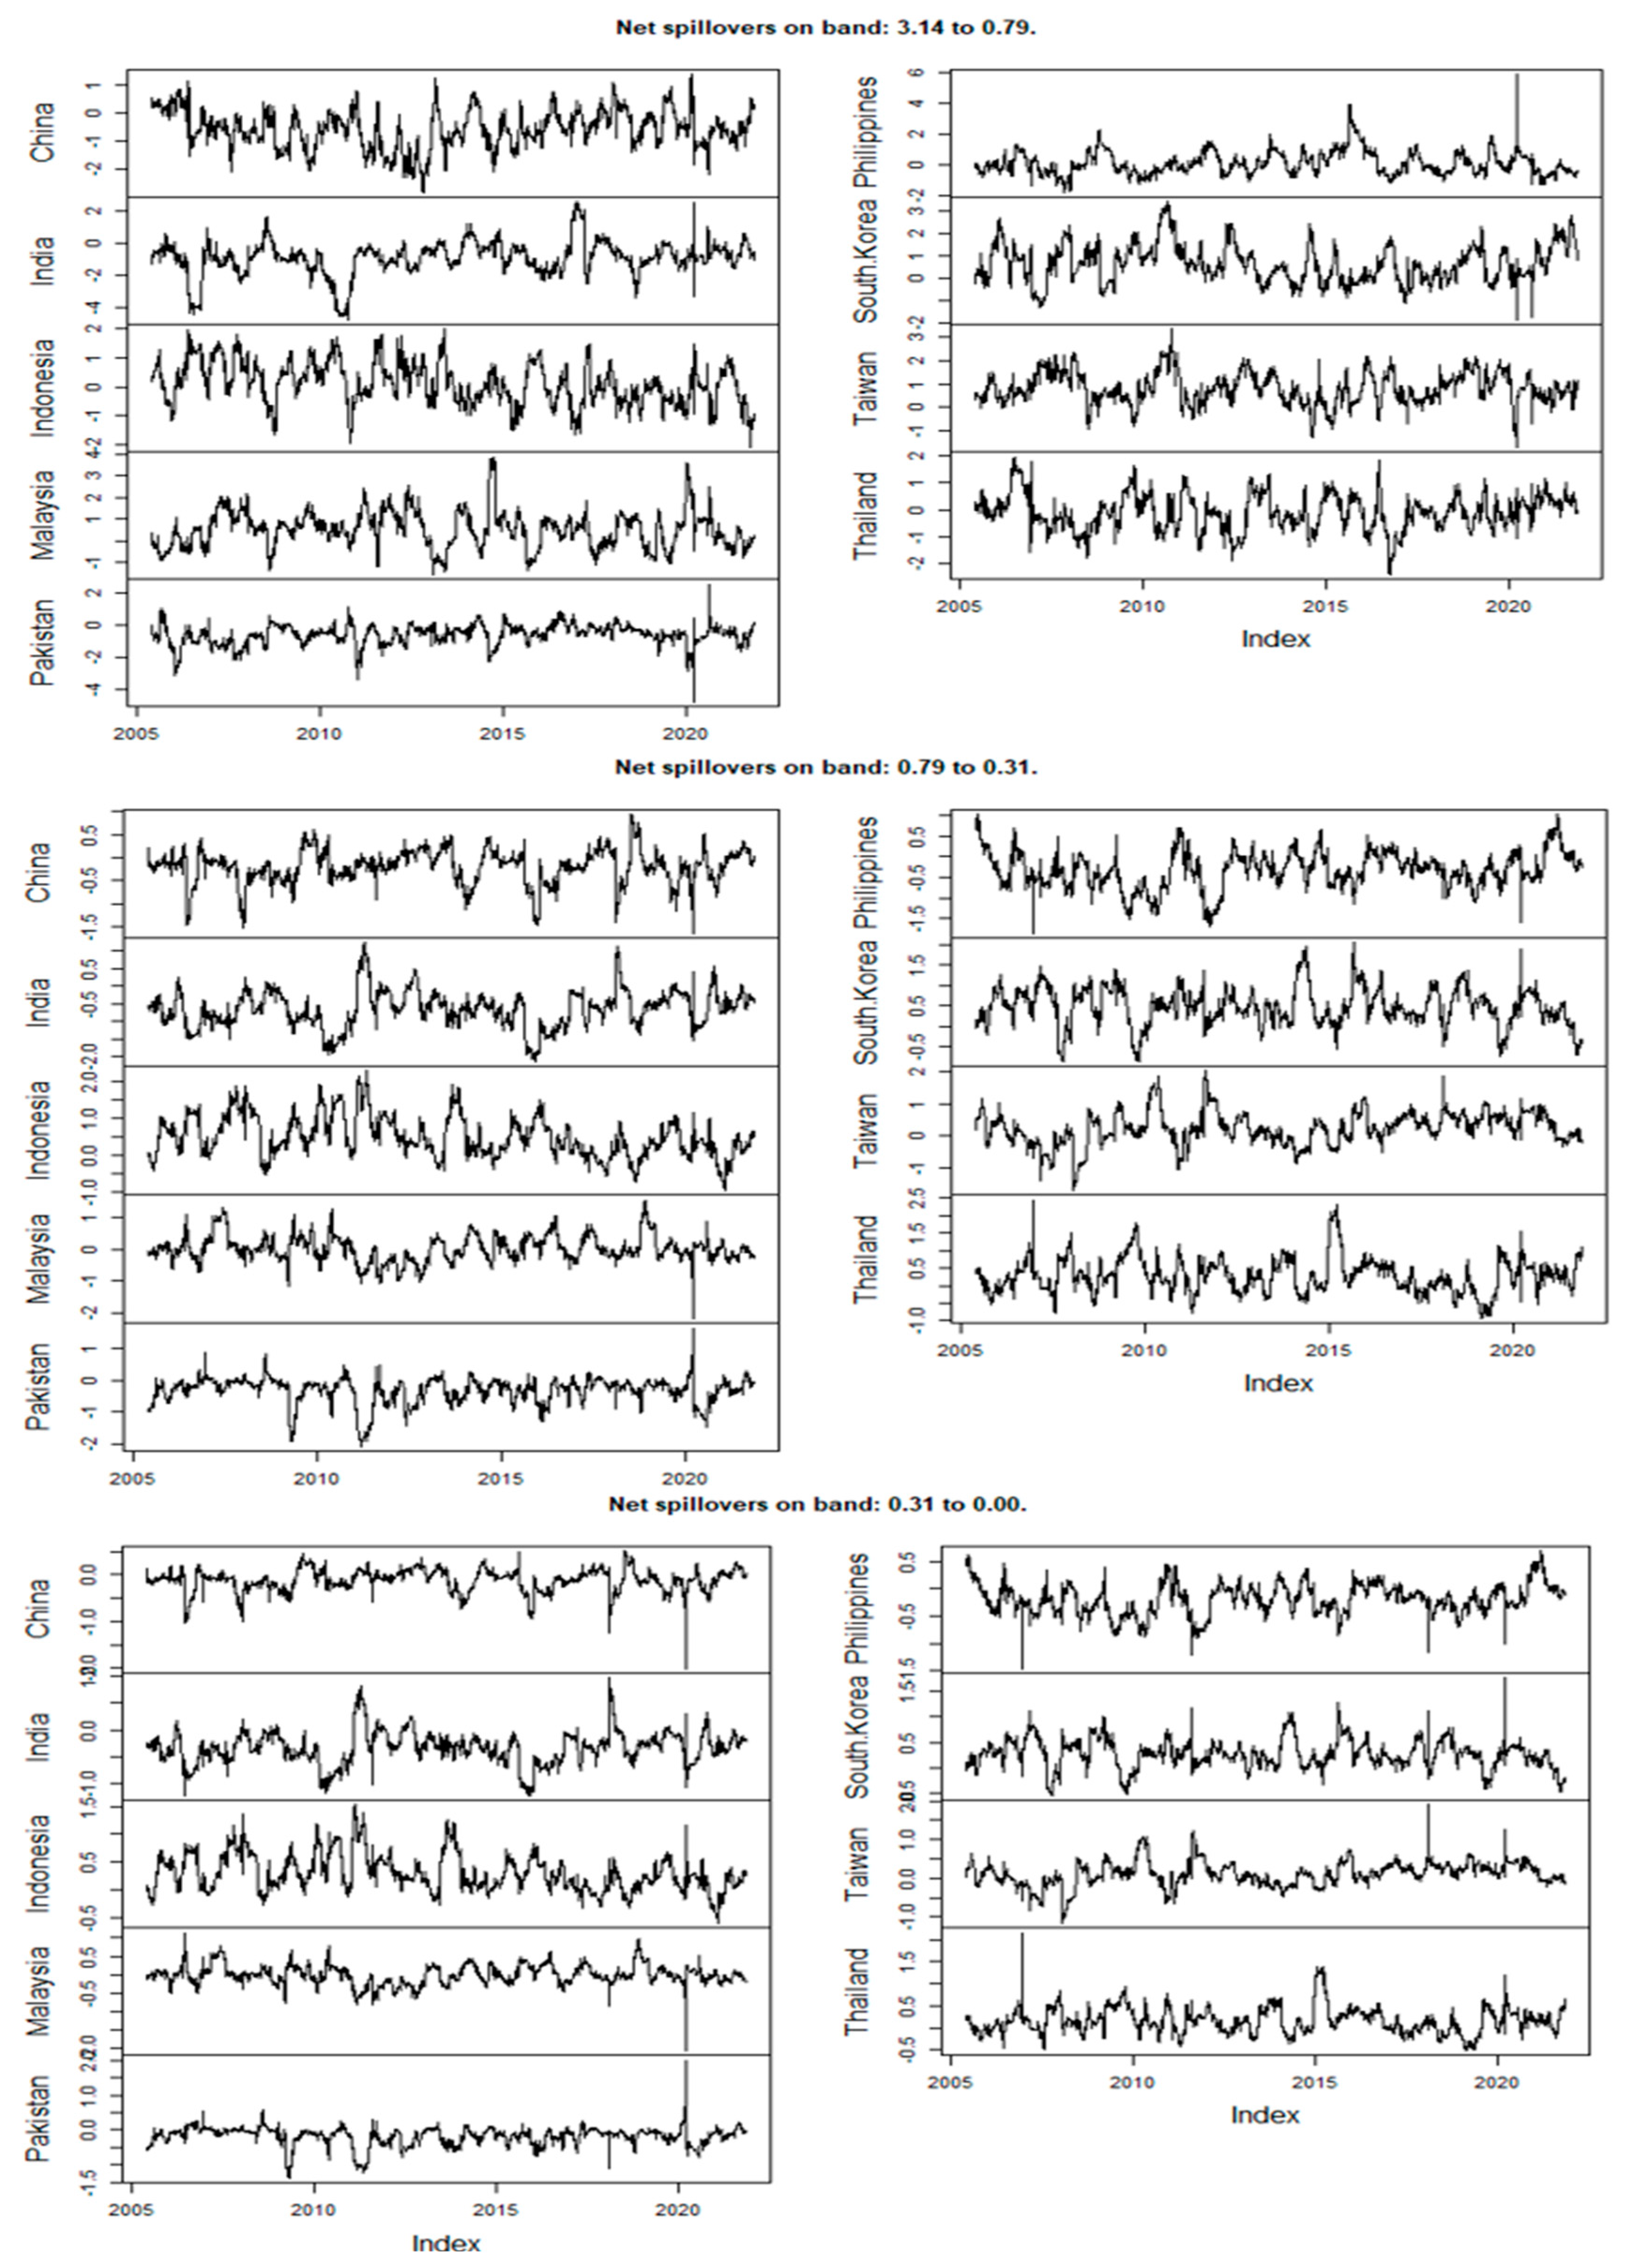
3.3. Baruník and Křehlík (2018) Spillover Framework

The Baruník and Křehlík (2018) spillover index is based on the frequency response function Ψ e i w = h e i w h ψ h . This function is based on the Fourier transformation of Ψ , with i = 1 . The generalized causation spectrum over the frequencies ω = ε π , π can be represented as:
f ω j , k = σ k k 1 | Ψ e i ω Σ j , k | 2 Ψ e i ω Σ Ψ e + i ω j . j
where the Fourier transformation of Ψ h is represented by the Ψ e i ω .
Φ j ω = ψ e i ω Σ ψ e + i ω j , j 1 2 π π π Ψ e i λ Σ Ψ e + i λ j . j d λ
Along with the respected frequency band of d = m , n | m , n π , π , m < n , the FEVD on some frequency band d is represented as:
i s β d j , k = 1 2 π m n Φ j ω f ω j , k d ω
If scaled generalized forecast error variance decomposition on the frequency band d is represented as:
β ~ d j , k = β d j , k k β j , k
The frequency connectedness is:
γ d F = 100 j k β ~ d j , k β j , k T r β ~ d θ ~ j , k
Moreover, the interconnectivity between variables can be depicted as:
γ d W = 100 1 T r β ~ d β ~ d j , k

4. Results

4.1. Diebold and Yilmaz (2012) Framework

Returns spillovers of an Asian emerging market are computed by using rolling windows (window = 100). The findings of a total spillover graph estimated by Diebold and Yilmaz (2012) are illustrated in Figure 3. The total returns spillovers of nine Asian emerging markets have revealed significant enlightenment in the past 15 years. The overall spillover began at below 40% in the first window, and then it fluctuated in the range from 60% to 70% in the last 15 years. The total spillover of the Asian emerging market dropped by up to 27% during 2017. However, the highest spillover effect of 75% was observed in March 2020, which was attributed to the impact of the COVID-19 crisis. Furthermore, the study of Aslam et al. (2021) also confirmed a significant level of spillovers during the COVID-19 within the financial markets of Europe. Moreover, during the COVID-19 pandemic, there has been a notable rise in the interconnectedness and volatilities of financial markets (Aslam et al. 2020; Khan and Khan 2021).
Table 2 represents the overall returns spillover index of the Asian emerging stock market estimated using the DY-spillover framework. The DY-Spillover framework findings are based on 10 days ahead of generalized variance decomposition and 10 days ahead of return forecast error. The “From” column in Table 2 reveals the directional spillover transmission generated from other emerging equity markets towards one’s equity market. Moreover, the findings reveal that the South Korean market received the highest returns spillover from other stock markets with a value of 60.17%, followed by the Taiwan stock market with overall strength of 59.58%. However, the lowest return spillover has been reported from other emerging stock markets to Pakistan, with a value of 11.33%.
The sum of the off-diagonal column (excluding the diagonal term) represents the directional returns spillover to the other Asian emerging stock market. The “Directional To Others” row indicates the returns spillover to other Asian emerging stock markets. The maximum directional spillover has been reported from the South Korean market to other emerging markets with a value of 75.86%. However, the minimum directional returns spillover to the other Asian emerging markets has been observed in Pakistan, followed by the equity market of China with a value of 4.48% and 19.06%, respectively. Furthermore, the comparison of both types of spillover (“From” and “To”) indicates less flexibility. For instance, the returns spillover from the stock market of South Korea to the Malaysian stock market is 10.20%, and the spillover from the equity market of Malaysia to the equity market of South Korea is 8.79%. Moreover, the highest return spillover between the two stock markets has been reported from South Korea to Taiwan, with a value of 18.12%.
The net return spillover of the Asian emerging market is represented by the “Net Directional Connectedness” row in Table 2. The findings disclose that the South Korean equity market exhibits the highest net directional returns spillover to the other Asian emerging stock market (75.86–60.17) 15.69%, followed by the Taiwan stock market with a value of Indonesian stock market value of 10.96% (70.54–59.58), and 10.83% (66.96–56.13), respectively. Nevertheless, the equity markets of India and China reported the lowest net directional return spillover with a value of −17.24% (28.93–46.17) and −10.42% (19.06–29.48), respectively. In addition, the overall directional return spillover among the nine Asian emerging markets is converted to the total spillover index. The numeric computation of the total index for this study is performed by dividing the total summation of the off-diagonal row/column (422.28) by the total sum value of the “Directional Including Own” row (899.97). The estimated total value, as presented in the last column and row of Table 2, reveals that 46.92% return forecast error variance appears as a consequence of return spillover in the nine Asian emerging markets.
To further investigate the directional spillover of the Asian emerging market, the return spillover has been computed using the rolling window of 100 observations. The “To” and “From” directional return spillover of nine Asian emerging stock markets are presented in Figure 4. A significant level of fluctuation has been noticed in the directional return spillover. In terms of receiving return spillover, Figure 4 shows that the high level of directional spillover shocks of all Asian emerging markets has been reported. It also indicates a high level of directional spillover stocks during 2020 as a result of the COVID-19 pandemic.
Table A1 in Appendix A represents the net pairwise return spillover of the Asian emerging market computed by the DY (2012) spillover method. Furthermore, concerning the net pairwise spillover matrix, a negative value signifies the transfer of net return spillover from the row stock market to the column equity market. Moreover, the comprehensive net pairwise analysis reveals that, excluding the Pakistani equity market, the Chinese equity market serves as a net return spillover transmitter to all Asian emerging markets. The findings further explored that the Indian equity market exhibits the greatest net spillover, with a value of −0.4796, to the Indonesian stock market.

4.2. Baruník and Křehlík (2018) Method

Baruník and Křehlík (2018) spillover framework is based on different frequency bands. In this research study, the return spillover of the Asian emerging stock market has been computed based on three different bands of frequencies: 3.14 to 0.79, 0.79 to 0.31, and 0.31 to 0.00, which represents the movement from 1–4 days (short-term), from 4–10 days (medium-term), and 10 to infinite days (long-term), respectively. The total return spillover index of the Asian emerging market computed by BK’s (2018) spillover method comprising a rolling window of 100 observations is shown in Figure 5.
Table 3 represents the overall return spillover of the Asian emerging market estimated using the BK (2018) framework concerning the short, medium, and long term. The computed total index value is presented in the last column and row of each panel of Table 3. The highest return spillover index in the Asian emerging market has been reported in the long term with a spillover index value of 53.25 (Panel III), followed by medium and short term with a return spillover index value of 53.14% in Panel II, and 43.04%, respectively.
Across the different frequency bands, the contribution of return spillover of the Asian emerging market varies at all three frequencies. For instance, in the short term, the contribution of returns spillovers from the other emerging markets is highest. It can be noted that the South Korean stock market is the recipient of the highest returns spillovers. However, the Philippines stock market in the medium and long term is the top recipient of the highest returns spillovers.
The findings of BK’s (2018) spillover framework reveal that Indonesia, South Korea, and Taiwan are the major net return spillover transmitters in all the selected frequencies. However, China, India, and Pakistan are the net return spillover recipients. Besides, in the medium and long term, Thailand’s equity market is the net return spillover transmitter with a value of 3.37 and 1.94, respectively. It is also reported that the South Korean and Indonesian stock markets transmit the net spillover with a value of 3.4 and 0.33 in the medium-term-run period. However, the net return spillover of both stock markets has been increasing in the medium-run period, with net spillover strength of 7.27 and 6.22, respectively. Moreover, the examination of net spillover reveals that the influence of return spillover on the Chinese stock market is more pronounced in the short term when compared to the medium and long-term durations, emanating primarily from other markets.
This study further proceeds with rolling window analysis based on the BK (2018) methodology. Figure 6 and Figure 7 represent the directional spillover of the Asian emerging stock market at a different frequency. The overall analysis shows a high level of return spillover shocks in the Asian financial market during 2020, which might be due to the impact of the COVID-19 pandemic. Zhang et al. (2021) also detected a spillover effect in the financial sector during the COVID-19 pandemic. As shown in the Figures, China, Indonesia, the Philippines, and Taiwan had a higher spillover shock at the beginning of the COVID-19 pandemic compared to other stock markets.
Figure 7 displays the directional return spillover that emerges from all nine Asian emerging equity markets. It is observed that the returns spillover shocks are extremely high in the short run and vary from 3% to 6%. However, concerning medium and long-term frequencies, the return spillover varies from 1% to 2.5%. The net return directional spillover graphs of all nine emerging markets are displayed in Figure 8, which illustrates the difference between “To Spillover” and “From Spillover”. A significant level of fluctuations has been observed in the net spillover shocks in the past 15 years. Aside from this, it has also been observed that the equity markets of China and India show negative trends in the net return spillover. Nonetheless, a potential trend has been noted in the net spillover trends of the Taiwan stock market. For instance, the net spillover shocks of the Taiwan market returns vary from −1 to 2 in the short-run period.
The net transmission of returns spillovers across the emerging equity markets of Asia is shown in Figure 8. The impact of net return spillover transmission is high in the short run compared to others. Significant information has emerged from the net return spillover analysis of the emerging markets. For instance, it has been observed that the Philippines, South Korean, and Taiwan stock markets show positive net spillover behavior, which indicates transmission of return spillover to other markets. Additionally, Chinese and Indian stock markets show negative behavior in the return spillover. For example, at the beginning of 2020, a significant decline was observed in the net spillovers of both stock markets. Furthermore, potential fluctuations have been observed in the net spillover of the Indonesian market. In the short run, the Indonesian market exhibited positive net spillover behavior in 2010, while during the COVID-19 pandemic, the market displayed a negative net spillover behavior, which indicates the market received a significant level of return spillover from other markets during COVID-19 pandemic. Moreover, the numerical information for net pairwise spillover using the BK method is illustrated in the appendix (see Table A2).

5. Discussion and Conclusions

Diebold and Yilmaz (2012) introduced an exceptional methodology that includes the time dimension for estimating spillover, which is based on the generalized variance decomposition approach in order to achieve directional connectedness. Additionally, Baruník and Křehlík (2018) introduced the extension version of the DY (2012) spillover approach by investigating the short, medium, and long-term directional connectedness known as the frequency domain approach of spillover. Asian emerging economies have a considerable presence in the global economy. Thus, understanding the returns spillovers across the Asian equities is very important. Therefore, we employed both DY (2012) and BK (2018) spillover frameworks to investigate the directional spillover of the nine Asian emerging equity markets using daily closing prices ranging from 5-January-2005 to 13-November-2021.
Furthermore, the main findings of this empirical study reveal a significant level of returns spillover across the Asian emerging equity markets, proving the existence of “spillover phenomena”. The outcomes of both spillover methods indicate that the total spillover index by DY 2012 and the short-term frequency index by BK 2018 are close to each other, with a value of 46.92% and 43.04%. However, the spillover connectedness is high at 56.25%, leading us to conclude that the emergence of the spillover in the emerging Asian stock market might depend on the time period. Moreover, the empirical results of the BK 2018 spillover framework also reveal that the spillover transmission to other emerging equity markets is extremely high in the short-term. These findings are in line with the study of Aslam et al. (2021).
The empirical findings are summarized as follows. Firstly, Indonesia, South Korea, and Taiwan are the major spillover net transmitters among the Asian emerging market, while China, India, and Pakistan are the major recipients of net return spillover. Secondly, the South Korean stock market has been identified as a major source of spillover that transmits risk to other Asian emerging stock markets. Finally, in this study, we observed that a high level of spillover was reported in 2020 during the COVID-19 crisis; a similar pattern of spillover has also been highlighted in European equity markets as a result of the turbulence caused by the spread of COVID-19, as detailed in the work of Aslam et al. (2021).
The empirical results of this study provide significant inference for policy makers and financial managers concerning the emerging equities transmission of financial shocks in equity returns. The findings demonstrated that Asian emerging stock markets remained interconnected and integrated with increasing spillovers during the crisis. Fluctuations in the Asian stock prices of one market are usually transmitted and cause changes in the prices of another equity market. The presence of spillover phenomena among the nine Asian equities suggests the chances of low diversification during a crisis period; thus, investors must be cautious and rational when investing. Hence, investors must invest in those stocks that possess low return spillovers, keeping their risk appetite in mind.
Investors stand to benefit from these insights as the findings affirm the reliability of spillover analysis, aiding cross-border investment decisions. Knowledge of dominant spillover transmitters empowers investors to tailor portfolios, considering the potential amplification of market moves from these key markets. Furthermore, linking spillover intensity with triggers prompts policy and regulatory reevaluation. Policymakers can leverage this knowledge to design measures that not only triggers but also enhance overall market resilience. Regulatory convergence among major spillover transmitters can facilitate smoother cross-border market interactions and reduce destabilization.
Despite the significance of this empirical research, it also possesses a few limitations based on which future studies can extend the contribution of this paper in several ways. Firstly, future studies can include an investigation of cross-country spillover effects in the European economies. Secondly, spillover effects between European equities and other economies are another domain that should be studied. Thirdly, considering the importance of spillover indices, researchers can use them as precautionary tools and consider their association with business cycles and global economic trends. Lastly, this study is limited to the methods described by DY (2012) and BK (2018); future studies can apply different methodologies such as Multivariate GARCH models and the cross-quantilogram approach.

Author Contributions

Conceptualization, M.K. (Maaz Khan) and K.S.M.; methodology, M.K. (Maaz Khan) and M.K. (Mrestyal Khan); software, M.K. (Maaz Khan); validation, M.K. (Maaz Khan), K.S.M. and M.K. (Mrestyal Khan); formal analysis, M.K. (Maaz Khan); data curation, M.K. (Maaz Khan); writing—original draft preparation, M.K. (Maaz Khan), M.K. (Mrestyal Khan), and K.S.M.; writing—review and editing, M.K. (Maaz Khan), M.K. (Mrestyal Khan), K.S.M., R.M., and U.N.K.; visualization, M.K. (Maaz Khan); project administration, M.K. (Maaz Khan); All authors have read and agreed to the published version of the manuscript.

Funding

This research received no external funding.

Informed Consent Statement

Not applicable.

Data Availability Statement

The data presented in this study are available on request from the corresponding author.

Acknowledgments

We sincerely appreciate all valuable comments and suggestions from the anonymous reviewers and the Academic Editor, which helped us to improve the quality of the manuscript.

Conflicts of Interest

The authors declare no conflict of interest.

Appendix A

Table A1. Net pairwise return spillover according to the method described by Diebold and Yilmaz (2012).
ChinaIndiaIndonesiaMalaysiaPakistanPhilippinesSouth KoreaTaiwanThailand
China0−0.0186−0.1850−0.15240.0212−0.0705−0.3169−0.3217−0.1138
India0.01860−0.4796−0.21670.0378−0.0927−0.4460−0.3595−0.3808
Indonesia0.18500.479600.12240.15040.2649−0.1030−0.04230.1470
Malaysia0.15240.2167−0.122400.09410.1366−0.1566−0.10870.0067
Pakistan−0.0212−0.0378−0.1504−0.09410−0.0615−0.1549−0.1185−0.1230
Philippines0.07050.0927−0.2649−0.13660.06150−0.3127−0.1935−0.1279
South Korea0.31690.44600.10300.15660.15490.312700.04970.2052
Taiwan0.32170.35950.04230.10870.11850.1935−0.049700.1246
Thailand0.11380.3808−0.1470−0.00670.12300.1279−0.2052−0.12460
Note: China = Shanghai Composite, India = BSE Sensex 30, Indonesia = JKSE Index, Malaysia = KLCI, Philippines = PSEI Composite, South Korea = KOSPI, Taiwan = Taiwan Weighted, Thailand = SET Index.
Table A2. Net pairwise return spillovers according to the method described by Baruník and Křehlík (2018).
Panel I: The spillover table for the band: 3.14 to 0.79
Roughly corresponds to 1 day to 4 days (Short Term)
ChinaIndiaIndonesiaMalaysiaPakistanPhilippinesSouth Korea TaiwanThailand
China0−0.0370−0.0841−0.11810.0054−0.0665−0.1837−0.1988−0.0367
India0.03700−0.1191−0.0674−0.0019−0.0401−0.0568−0.0522−0.1663
Indonesia0.08410.11910−0.08830.0176−0.0239−0.0568−0.09270.0761
Malaysia0.11810.06740.088300.02540.04040.0189−0.03060.1783
Pakistan−0.00540.0019−0.0176−0.02540−0.0204−0.0336−0.0151−0.0196
Philippines0.06650.04010.0239−0.04040.02040−0.0073−0.03010.0587
South Korea 0.18370.05680.0568−0.01890.03360.00730−0.06410.1234
Taiwan0.19880.05220.09270.03060.01510.03010.064100.1179
Thailand0.03670.1663−0.0761−0.17830.0196−0.0587−0.1234−0.11790
Panel II: The spillover table for the band: 0.79 to 0.31
Roughly corresponds to 4 days to 10 days. (Medium Term)
ChinaIndiaIndonesiaMalaysiaPakistanPhilippinesSouth Korea TaiwanThailand
China00.0128−0.0620−0.02480.0081−0.0003−0.0820−0.0729−0.0468
India−0.01280−0.2254−0.10180.0207−0.0328−0.2388−0.1902−0.1371
Indonesia0.06200.225400.11480.07330.1747−0.02620.03160.0342
Malaysia0.02480.1018−0.114800.03930.0713−0.0938−0.0356−0.0942
Pakistan−0.0081−0.0207−0.0733−0.03930−0.0208−0.0684−0.0569−0.0561
Philippines0.00030.0328−0.1747−0.07130.02080−0.1859−0.0985−0.1173
South Korea 0.08200.23880.02620.09380.06840.185900.06760.0430
Taiwan0.07290.1902−0.03160.03560.05690.0985−0.06760−0.0020
Thailand0.04680.1371−0.03420.09420.05610.1173−0.04300.00200
Panel III: The spillover table for the band: 0.31 to 0.00
Roughly corresponds to 10 days to Inf days. (Long Term)
ChinaIndiaIndonesiaMalaysiaPakistanPhilippinesSouth Korea TaiwanThailand
China00.0056−0.0389−0.00950.0077−0.0037−0.0512−0.0500−0.0303
India−0.00560−0.1351−0.04740.0190−0.0198−0.1504−0.1171−0.0774
Indonesia0.03890.135100.09600.05950.1141−0.02000.01880.0366
Malaysia0.00950.0474−0.096000.02940.0249−0.0818−0.0424−0.0774
Pakistan−0.0077−0.0190−0.0595−0.02940−0.0203−0.0529−0.0465−0.0473
Philippines0.00370.0198−0.1141−0.02490.02030−0.1194−0.0649−0.0693
South Korea 0.05120.15040.02000.08180.05290.119400.04610.0389
Taiwan0.05000.1171−0.01880.04240.04650.0649−0.046100.0088
Thailand0.03030.0774−0.03660.07740.04730.0693−0.0389−0.00880
Note: China = Shanghai Composite, India = BSE Sensex 30, Indonesia = JKSE Index, Malaysia = KLCI, Philippines = PSEI Composite, South Korea = KOSPI, Taiwan = Taiwan Weighted, Thailand = SET Index.

References

  1. Abbas, Ghulam, Shawkat Hammoudeh, Syed Jawad Hussain Shahzad, Shouyang Wang, and Yunjie Wei. 2019. Return and volatility connectedness between stock markets and macroeconomic factors in the G-7 countries. Journal of Systems Science and Systems Engineering 28: 1–36. [Google Scholar] [CrossRef]
  2. Ahmad, Nasir, Mobeen Ur Rehman, Xuan Vinh Vo, and Sang Hoon Kang. 2022. Does inter-region portfolio diversification pay more than international diversification? The Quarterly Review of Economics and Finance 83: 26–35. [Google Scholar]
  3. Ali, Fahad, Ahmet Sensoy, and John Goodell. 2023. Identifying diversifiers, hedges, and safe havens among Asia Pacific equity markets during COVID-19: New results for ongoing portfolio allocation. International Review of Economics & Finance 85: 744–92. [Google Scholar]
  4. Aslam, Faheem, Ahmed Imran Hunjra, Elie Bouri, Khurram Shahzad Mughal, and Mrestyal Khan. 2023. Dependence structure across equity sectors: Evidence from vine copulas. Borsa Istanbul Review 23: 184–202. [Google Scholar] [CrossRef]
  5. Aslam, Faheem, Paulo Ferreira, Khurram Shahzad Mughal, and Beenish Bashir. 2021. Intraday volatility spillovers among European financial markets during COVID-19. International Journal of Financial Studies 9: 5. [Google Scholar] [CrossRef]
  6. Aslam, Faheem, Yasir Tariq Mohmand, Paulo Ferreira, Bilal Ahmed Memon, Maaz Khan, and Mrestyal Khan. 2020. Network analysis of global stock markets at the beginning of the coronavirus disease (COVID-19) outbreak. Borsa Istanbul Review 20: S49–61. [Google Scholar] [CrossRef]
  7. Baele, Lieven. 2002. Volatility spillover effects in European equity markets: Evidence from a regime-switching model. Journal of Financial and Quantitative Analysis 40: 31–43. [Google Scholar]
  8. Baele, Lieven. 2005. Volatility spillover effects in European equity markets. Journal of Financial and Quantitative Analysis 40: 373–401. [Google Scholar] [CrossRef]
  9. Baruník, Jozef, and Tomáš Křehlík. 2018. Measuring the frequency dynamics of financial connectedness and systemic risk. Journal of Financial Econometrics 16: 271–96. [Google Scholar] [CrossRef]
  10. Beirne, John, Guglielmo Maria Caporale, Marianne Schulze-Ghattas, and Nicola Spagnolo. 2013. Volatility spillovers and contagion from mature to emerging stock markets. Review of International Economics 21: 1060–75. [Google Scholar] [CrossRef]
  11. Cooper, Richard N., Kenneth J. Arrow, Rudiger Dornbusch, Yung Chul Park, Stijin Claessens, Deon Filmer, Jeffrey S. Hammer, Lant H. Pritchett, Michael Woolcock, Deepa Narayan, and et al. 2000. The World Bank research observer 15 (2). Policy, Research Working Paper; no. WPS 2463. Available online: https://documents1.worldbank.org/curated/ru/264171468320067686/pdf/multi-page.pdf (accessed on 22 August 2023).
  12. Diebold, Francis X., and Kamil Yilmaz. 2009. Measuring financial asset return and volatility spillovers, with application to global equity markets. The Economic Journal 119: 158–71. [Google Scholar] [CrossRef]
  13. Diebold, Francis X., and Kamil Yilmaz. 2012. Better to give than to receive: Predictive directional measurement of volatility spillovers. International Journal of Forecasting 28: 57–66. [Google Scholar] [CrossRef]
  14. Dungey, Mardi, and Dungey Gajurel. 2014. Equity market contagion during the global financial crisis: Evidence from the world’s eight largest economies. Economic Systems 38: 161–77. [Google Scholar] [CrossRef]
  15. Eun, Cheol S., and Sangdal Shim. 1989. International transmission of stock market movements. Journal of Financial and Quantitative Analysis 24: 241–56. [Google Scholar] [CrossRef]
  16. Fang, Victor, Yee-Choon Lim, and Chien-Ting Lin. 2006. Volatility transmissions between stock and bond markets: Evidence from Japan and the US. International Journal of Information Technology 12: 120–12. [Google Scholar]
  17. Forbes, Kristin J., and Roberto Rigobon. 2002. No contagion, only interdependence: Measuring stock market comovements. The Journal of Finance 57: 2223–61. [Google Scholar] [CrossRef]
  18. Gallo, Giampiero M., and Edoardo Otranto. 2008. Volatility spillovers, interdependence and comovements: A Markov Switching approach. Computational Statistics & Data Analysis 52: 3011–26. [Google Scholar]
  19. Glezakos, Michalis, Anna Merika, and Haralambos Kaligosfiris. 2007. Interdependence of major world stock exchanges: How is the Athens stock exchange affected? International Research Journal of Finance and Economics 7: 24–39. [Google Scholar]
  20. Graham, Michael, Jarno Kiviaho, and Jussi Nikkinen. 2012. Integration of 22 emerging stock markets: A three-dimensional analysis. Global Finance Journal 23: 34–47. [Google Scholar] [CrossRef]
  21. Hamao, Yasushi, Ronald W. Masulis, and Victor Ng. 1990. Correlations in price changes and volatility across international stock markets. The Review of Financial Studies 3: 281–307. [Google Scholar] [CrossRef]
  22. Hung, Ngo Thai. 2019. Return and volatility spillover across equity markets between China and Southeast Asian countries. Journal of Economics, Finance and Administrative Science 24: 66–81. [Google Scholar] [CrossRef]
  23. Joshi, Prashant. 2011. Return and volatility spillovers among Asian stock markets. Sage Open 1: 2158244011413474. [Google Scholar] [CrossRef]
  24. Kanas, Angelos. 1998. Volatility spillovers across equity markets: European evidence. Applied Financial Economics 8: 245–56. [Google Scholar] [CrossRef]
  25. Kao, Wei-Shun, Tzu-Chuan Kao, Chang-Cheng Changchien, Li-Hsun Wang, and Kuei-Tzu Yeh. 2018. Contagion in international stock markets after the subprime mortgage crisis. The Chinese Economy 51: 130–53. [Google Scholar] [CrossRef]
  26. Khan, Mrestyal, and Maaz Khan. 2021. Cryptomarket Volatility in Times of COVID-19 Pandemic: Application of GARCH Models. Economic Research Guardian 11: 170–81. [Google Scholar]
  27. Korinek, Anton. 2018. Regulating capital flows to emerging markets: An externality view. Journal of International Economics 111: 61–80. [Google Scholar] [CrossRef]
  28. Li, Yanshuang, Yujie Shi, Yongdong Shi, Shangkun Yi, and Weiping Zhang. 2023. COVID-19 vaccinations and risk spillovers: Evidence from Asia-Pacific stock markets. Pacific-Basin Finance Journal 79: 102004. [Google Scholar] [CrossRef]
  29. Markowitz, Harry Max. 1952. Portfolio Selection. London: Yale University Press. [Google Scholar]
  30. Ng, Angela. 2000. Volatility spillover effects from Japan and the US to the Pacific–Basin. Journal of International Money and Finance 19: 207–33. [Google Scholar] [CrossRef]
  31. Malik, Preeti, Urvish Patel, Deep Mehtab, Nidhai Patel, Reveena Kelkar, Muhammad Akrmah, Janice L. Gabrilove, and Henry Sacks. 2021. Biomarkers and outcomes of COVID-19 hospitalisations: Systematic review and meta-analysis. BMJ Evidence-Based Medicine 26: 107–8. [Google Scholar] [CrossRef] [PubMed]
  32. Panda, Ajaya. Kumar, Pradiptarathi Panda, Swagatika Nanda, and Atul Parad. 2021. Information bias and its spillover effect on return volatility: A study on stock markets in the Asia-Pacific region. Pacific-Basin Finance Journal 69: 101653. [Google Scholar] [CrossRef]
  33. Pete, Engardio. 2006. India Are Revolutionizing Global Business. New York: McGraw-Hill. [Google Scholar]
  34. Pretorius, Elna. 2002. Economic determinants of emerging stock market interdependence. Emerging Markets Review 3: 84–105. [Google Scholar] [CrossRef]
  35. Savva, Christos S., Denise R. Osborn, and Len Gill. 2004. Volatility, Spillover Effects and Correlations in US and Major European Markets. Manchester: University of Manchester. [Google Scholar]
  36. Sharpe, Willian Forsyth. 1963. A simplified model for portfolio analysis. Management Science 9: 277–93. [Google Scholar] [CrossRef]
  37. Thomas, Nisha Mary, Smita Kashiramka, Surendra Singh Yadav, and Justin Paul. 2022. Role of emerging markets vis-à-vis frontier markets in improving portfolio diversification benefits. International Review of Economics & Finance 78: 95–121. [Google Scholar]
  38. Wagner, Niklas, and Alexander Szimayer. 2004. Local and spillover shocks in implied market volatility: Evidence for the US and Germany. Research in International Business and Finance 18: 237–51. [Google Scholar] [CrossRef]
  39. Zhang, Hua, Jinyu Chen, and Liuguo Shao. 2021. Dynamic spillovers between energy and stock markets and their implications in the context of COVID-19. International Review of Financial Analysis 77: 101828. [Google Scholar] [CrossRef] [PubMed]
Figure 1. Price trends of the Asian emerging stock markets Indices ranging from 2005 to 2021.
Ijfs 11 00112 g001
Figure 2. Financial returns fluctuations of the Asian emerging stock indices.
Ijfs 11 00112 g002
Figure 3. Total return spillover of Asian emerging market by Diebold and Yilmaz (2012).
Ijfs 11 00112 g003
Figure 4. Return Spillovers, (To, From, Net) all Asian emerging stock markets by Diebold and Yilmaz (2012).
Ijfs 11 00112 g004
Figure 5. Return Spillover of Asian Emerging Market by Baruník and Křehlík (2018) method in terms of Short, Medium, and Long, respectively.
Ijfs 11 00112 g005
Figure 6. Return spillovers (To) all Asian emerging stock markets according to the method described by Baruník and Křehlík (2018).
Ijfs 11 00112 g006
Figure 7. Return spillovers (From) all Asian emerging stock markets, according to the method described by Baruník and Křehlík (2018).
Ijfs 11 00112 g007
Figure 8. Return spillovers (Net) all Asian emerging stock markets, according to the method described by Baruník and Křehlík (2018).
Ijfs 11 00112 g008
Table 1. Summary statistics of Asian emerging stock markets returns.
ChinaIndiaIndonesiaMalaysiaPakistanPhilippinesSouth KoreaTaiwanThailand
Mean0.024%0.051%0.044%0.012%0.046%0.032%0.028%0.025%0.020%
Std.Dev.1.540%1.443%1.265%0.733%1.240%1.278%1.221%1.116%1.194%
Kurtosis5.261549.333088.6116714.185934.5586011.632739.642244.8264519.1970
Skewness−0.5649−0.4623−0.5748−0.8511−0.5255−0.9905−0.5293−0.4848−1.2612
Minimum−0.0925−0.1138−0.1095−0.0997−0.1009−0.1432−0.1117−0.0673−0.1606
Maximum0.090340.1200.097040.066260.082550.093650.112840.065250.10577
Jarqua Bera Test5187.715,75913,52336,5773920.224,94916,858434167,176
ADF test−46.761 ***−46.995 ***−43.904 ***−43.241 ***−42.453 ***−45.132 ***−44.959 ***−44.131 ***−44.061 ***
Count431143114311431143114311431143114311
Note: China = Shanghai Composite, India = BSE Sensex 30, Indonesia = JKSE Index, Malaysia = KLCI, Philippines = PSEI Composite, South Korea = KOSPI, Taiwan = Taiwan Weighted, Thailand = SET Index, *** refers to 1% significance level.
Table 2. Returns spillover among Asian emerging markets based on the method of Diebold and Yilmaz (2012).
ChinaIndiaIndonesiaMalaysiaPakistanPhilippinesSouth Korea TaiwanThailandFrom
China70.522.1743.840.372.386.756.613.3629.48
India253.818.335.530.495.949.538.316.0446.17
Indonesia2.344.0243.8710.230.88.2410.479.7810.2556.13
Malaysia2.473.5811.3344.520.68.2210.210.019.0755.48
Pakistan0.560.832.161.4488.661.051.861.531.911.33
Philippines1.745.1110.629.450.4947.189.188.387.8452.81
South Korea3.95.529.558.790.476.3739.8417.677.960.17
Taiwan3.715.089.49.030.476.6418.1240.427.1359.58
Thailand2.342.6211.579.130.796.689.758.2548.8751.13
Directional to Others19.0628.9366.9657.444.4845.5275.8670.5453.49422.28
Directional Including Own89.5882.74110.83101.9693.1492.7115.7110.96102.3646.92%
Net Directional Connectedness−10.42−17.2410.831.96−6.85−7.2915.6910.962.36
Note: China = Shanghai Composite, India = BSE Sensex 30, Indonesia = JKSE Index, Malaysia = KLCI, Philippines = PSEI Composite, South Korea = KOSPI, Taiwan = Taiwan Weighted, Thailand = SET Index.
Table 3. Returns spillover among Asian emerging markets using the method described by Baruník and Křehlík (2018).
Panel I: The spillover table for the band: 3.14 to 0.79. Roughly corresponds to 1 day to 4 days (Short Term)
ChinaIndiaIndonesiaMalaysiaPakistanPhilippinesSouth Korea TaiwanThailandFrom
China51.221.422.382.620.211.594.614.442.1419.41
India1.0940.473.642.720.333.344.263.812.8622.05
Indonesia1.632.5629.676.860.645.36.46.326.235.91
Malaysia1.562.116.0730.30.375.046.046.254.8332.27
Pakistan0.250.310.80.657.880.440.60.430.774.2
Philippines0.992.975.095.40.2633.024.374.493.8227.39
South Korea 2.963.755.896.210.34.328.4512.394.7940.59
Taiwan2.653.345.495.980.294.2211.8128.174.0937.87
Thailand2.211.366.886.440.594.345.95.1535.1232.87
Contribution To13.3417.8236.2436.832.9928.5743.9943.2829.5252.56
Contribution Including Own64.5658.2965.9167.1360.8761.5972.4471.4564.6243.04%
Net Spillover−6.07−4.230.334.56−1.211.183.45.41−3.37
Panel II: The spillover for the band: 0.79 to 0.31. Roughly corresponds to 4 days to 10 days. (Medium Term)
ChinaIndiaIndonesiaMalaysiaPakistanPhilippinesSouth Korea TaiwanThailandFrom
China12.90.471.020.790.110.481.341.350.766.32
India0.588.72.931.80.111.613.252.791.9915.06
Indonesia0.460.99.192.180.111.862.522.162.5612.75
Malaysia0.570.883.229.220.151.962.522.32.5814.18
Pakistan0.180.30.770.519.980.340.730.630.634.08
Philippines0.481.313.432.60.159.222.972.42.4915.83
South Korea 0.61.12.281.680.111.297.343.371.9412.37
Taiwan0.71.082.451.980.121.513.987.921.9113.73
Thailand0.340.762.871.730.131.442.331.898.8311.49
Contribution To3.916.818.9713.260.9910.4919.6416.8914.86105.81
Contribution Including Own16.8115.528.1622.4820.9719.7126.9824.8123.6953.14%
Net Spillover−2.41−8.266.22−0.92−3.09−5.347.273.163.37
Panel III: The spillover for the band: 0.31 to 0.00. Roughly corresponds to 10 days to Inf days. (Long Term)
ChinaIndiaIndonesiaMalaysiaPakistanPhilippinesSouth Korea TaiwanThailandFrom
China6.410.270.60.430.060.310.80.820.463.75
India0.324.641.771.020.0512.021.711.199.08
Indonesia0.250.5551.190.051.081.551.31.497.46
Malaysia0.340.592.0550.081.221.641.461.669.04
Pakistan0.130.220.590.3510.80.270.540.480.493.07
Philippines0.270.822.111.450.094.941.851.491.539.61
South Korea 0.340.661.370.910.060.784.051.911.177.2
Taiwan0.370.661.471.070.060.92.334.331.137.99
Thailand0.190.51.820.970.070.91.521.214.917.18
Contribution To2.214.2711.787.390.526.4612.2510.389.1264.38
Contribution Including Own8.628.9116.7812.3911.3211.416.314.7114.0356.25%
Net Spillover−1.54−4.814.32−1.65−2.55−3.155.052.391.94
Note: China = Shanghai Composite, India = BSE Sensex 30, Indonesia = JKSE Index, Malaysia = KLCI, Philippines = PSEI Composite, South Korea = KOSPI, Taiwan = Taiwan Weighted, Thailand = SET Index.
Disclaimer/Publisher’s Note: The statements, opinions and data contained in all publications are solely those of the individual author(s) and contributor(s) and not of MDPI and/or the editor(s). MDPI and/or the editor(s) disclaim responsibility for any injury to people or property resulting from any ideas, methods, instructions or products referred to in the content.

